Energy-Based Seismic Risk Evaluation of Tall Reinforced Concrete Building in Vancouver, BC, Canada, under Mw9 Megathrust Subduction Earthquakes and Aftershocks
 Solomon Tesfamariam
 Katsuichiro Goda
- 1School of Engineering, The University of British Columbia, Kelowna, BC, Canada
- 2Department of Civil Engineering, University of Bristol, Bristol, UK
This article presents a seismic performance evaluation framework for reinforced concrete (RC) buildings, comprising shear walls and gravity frames. The evaluation is undertaken within a performance-based earthquake engineering framework by considering regional seismicity and site-specific ground motion selection. Different engineering demand parameters (EDPs), i.e., maximum interstory drift ratio (MaxISDR) and energy-based damage index, are considered as performance indicators. Various prediction models of EDPs are developed by considering four ground motion intensity measures (IMs), i.e., spectral acceleration at the fundamental period, Arias intensity, cumulative absolute velocity (CAV), and significant duration of ground motion. For this study, a 15-story RC building, located in Vancouver, BC, Canada, is considered as a case study. By using 50 mainshock and 50 mainshock–aftershock (MS-AS) earthquake records (2 horizontal components per record and bidirectional loading), non-linear dynamic analyses are performed. Subsequently, the calculated MaxISDRs and damage indices are correlated with suitable IMs using cloud analysis, and the most efficient IM-EDP prediction models are selected by comparing standard deviations (SDs) of the regression errors. The MaxISDR of the shear walls is less than 1% for the mainshock and MS-AS records. The energy-based damage index shows sensitivity to delineate impact of earthquake types and aftershocks. The CAV is showed to be the most efficient IM for the energy-based damage index.
Introduction
Motivation
Seismic performance of reinforced concrete (RC) shear wall systems designed with Canadian design codes has been investigated by various researchers (e.g., Tremblay et al., 2001; Adebar et al., 2010; Boivin and Paultre, 2010, 2012; Luu et al., 2014). For RC core buildings designed with the CSA standard A23.3-04, Boivin and Paultre (2010) showed that the RC core performs satisfactorily for flexural demand, while potential deficiency under significant shear demand may be a concern. Koduru and Haukaas (2010) studied the seismic performance and economic loss of a 15-story RC building constructed in 1988 and located in Vancouver, BC, Canada. Their study was comprehensive, covering from regional seismic hazard, seismic vulnerability assessment, and economic impact estimation. Nevertheless, important improvements can be made with regard to use of ground motion records that are applicable to megathrust interface records from the Cascadia subduction zone, noting that the records used by Koduru and Haukaas (2010) were calibrated based on shallow crustal records. On the other hand, adopting PEER’s performance-based earthquake engineering (PBEE) framework (Cornell and Krawinkler, 2000), Yang et al. (2012) carried out a seismic loss assessment for a 42-story RC dual-system building, i.e., a centrally located core wall building with perimeter special moment-resisting frames. With a design earthquake intensity level, the maximum interstory drift ratio (MaxISDR) calculated was less than 2%.
In older Canadian codes, shear wall buildings are the primary seismic force resisting systems, and detailing of gravity frames are often neglected (Adebar et al., 2010). The poor detailing associated with the gravity frames can be (Tesfamariam and Saatcioglu, 2008) inadequate lap splice length, lap splice located in a potential plastic hinge zone, poor detailing of transverse reinforcement anchorage, welded detailing, and lack of support to longitudinal bars. Gravity frames, however, located in the plastic hinge zone of the shear wall can experience excessive deformation and, if not detailed properly, can sustain severe damage (Adebar et al., 2010). This type of damage, for example, was reported in the 27 February 2010 Maule Chile earthquake (Naeim et al., 2011) and the 22 February 2011 Christchurch earthquake (Stirrat et al., 2014). Furthermore, older buildings in Canada lack consideration of large interface events in seismic design procedures. (Note: the potential risk due to the Cascadia subduction earthquakes was only recognized in late 1990s.) The problem is further compounded with the prevalence of mainshock–aftershock (MS-AS) earthquake sequences.
The structural analysis, using an appropriate structural model for the calculation of engineering demand parameter (EDP) and collapse capacity/probability, is an essential component of the seismic vulnerability evaluation. To assess the probability of attaining a specific structural response level conditioned on seismic excitation, incremental dynamic analysis (Vamvatsikos and Cornell, 2002) and cloud and stripe analyses (Jalayer et al., 2007) can be used. Different damage indices are used as a surrogate measure for EDPs that are categorized as follows (Williams and Sexsmith, 1995): (a) non-cumulative, (b) deformation-based cumulative, (c) energy-based cumulative, and (d) combined (non-cumulative and energy-based) indices. The most common approach to relate seismic demands to structural performance limits (i.e., capacity) is based on non-cumulative drift-based EDP, such as MaxISDR and residual interstory drift ratio. For RC shear wall buildings, however, the drift-based damage indicator may show satisfactory seismic resistance performance while underestimating overall damage in the plastic region due to cyclic loading. In this article, the cumulative energy-based damage index proposed by Mehanny and Deierlein (2000), which takes into account both peak amplitude and duration of non-linear responses of structural members in quantifying the structural damage, will be used. Alternatively, other damage indices that were proposed in the literature (e.g., Park and Ang, 1985; DiPasquale and Cakmak, 1989; Reinhorn and Valles, 1995) can be adopted.
Objectives
This article presents a seismic vulnerability evaluation of a 15-story RC shear wall structure located in Vancouver, BC, Canada. The RC shear wall building includes gravity frames, which are more vulnerable to low-amplitude repeated ground motions and is modeled in OpenSees finite element software by accounting for the non-linearity in the model. The shear walls for the tall building act as a cantilever beam, and the plastic hinge is formed at the base (assumed to be the first four stories), whereas the gravity columns within this plastic region are modeled with non-linear material elements. The seismic risk assessment that is carried out in this study accounts for:
• Consideration of MS-AS earthquake records and earthquake types, i.e., shallow crustal earthquakes, deep inslab earthquakes, and megathrust Cascadia subduction earthquakes, by selecting applicable records for subduction environments from extensive MS-AS ground motion data sets (Goda and Taylor, 2012; Goda et al., 2015), including the 2011 Tohoku earthquake records that can be regarded as closest proxy for the Cascadia subduction events.
• Energy-based damage indices, which are computed from the hysteretic responses of the structural model. In this article, Mehanny–Deierlein damage index (Mehanny and Deierlein, 2000) is considered, which captures the responses from long-duration earthquakes. The damage indices for different structural elements are primarily integrated based on a combination rule suggested by Bracci et al. (1989).
• Impact of different intensity measures (IMs) on efficiency. The cumulative absolute velocity (CAV) is identified as the most efficient IM for characterizing the damage index, and subsequently seismic demand prediction models are developed using CAV. Finally, convoluting the seismic demand model with the seismic hazard of Vancouver, seismic risk is computed quantitatively.
PBEE for Seismic Vulnerability Assessment
Disaster risk reduction against future earthquakes requires decision support tools for cost-effective risk mitigation options. For seismic risk assessment and design, a PBEE methodology, originally advocated by Cornell and Krawinkler (2000) and later extended by various researchers (e.g., Goulet et al., 2007), can be adopted. In PBEE, the mean annual rate of exceedance of earthquake impact expressed in terms of damage measures (DM) and ν(DM), is quantified, involving seismic hazard, structural, and damage analyses. Mathematically, ν(DM) can be expressed as:
where λ(IM) is the mean annual rate that a certain level of IM is exceeded, G(EDP|IM) is the complementary cumulative distribution function of EDP given IM, and G(DM|EDP) is the complementary cumulative distribution function that can be characterized through damage analysis by relating EDP to the physical extent of structural damage, represented by DM. The accuracy of the earthquake impact assessment depends on the available data and the choices of the relevant models and parameters.
Hazard Consideration and IMs
In western BC, Canada, three dominant earthquake sources are present: crustal, inslab, and interface events (Hyndman and Rogers, 2010). The latter two types are originated from the Cascadia subduction zone (Figure 1A), where the oceanic Juan de Fuca Plate sinks beneath the continental North American Plate. When the stored strain along the fault is released, a megathrust subduction earthquake, similar to the 2010 Maule Chile and 2011 Tohoku Japan earthquakes, can happen. The structural damage potential and consequences due to these three earthquake types can be significantly different because of their ground motion characteristics, depending on buildings and infrastructure of interest. Generally, in comparison with crustal and inslab earthquakes, large interface ground motions, originated from the Cascadia subduction zone, have much longer duration (Figure 1B). The spectral content of the ground motion records for three earthquake types can differ significantly due to different earthquake source characteristics in terms of magnitude and distance (Figure 1C). For instance, the effects of long-duration ground motions on tall buildings have been highlighted for the 2011 Tohoku earthquake (Takewaki et al., 2011).
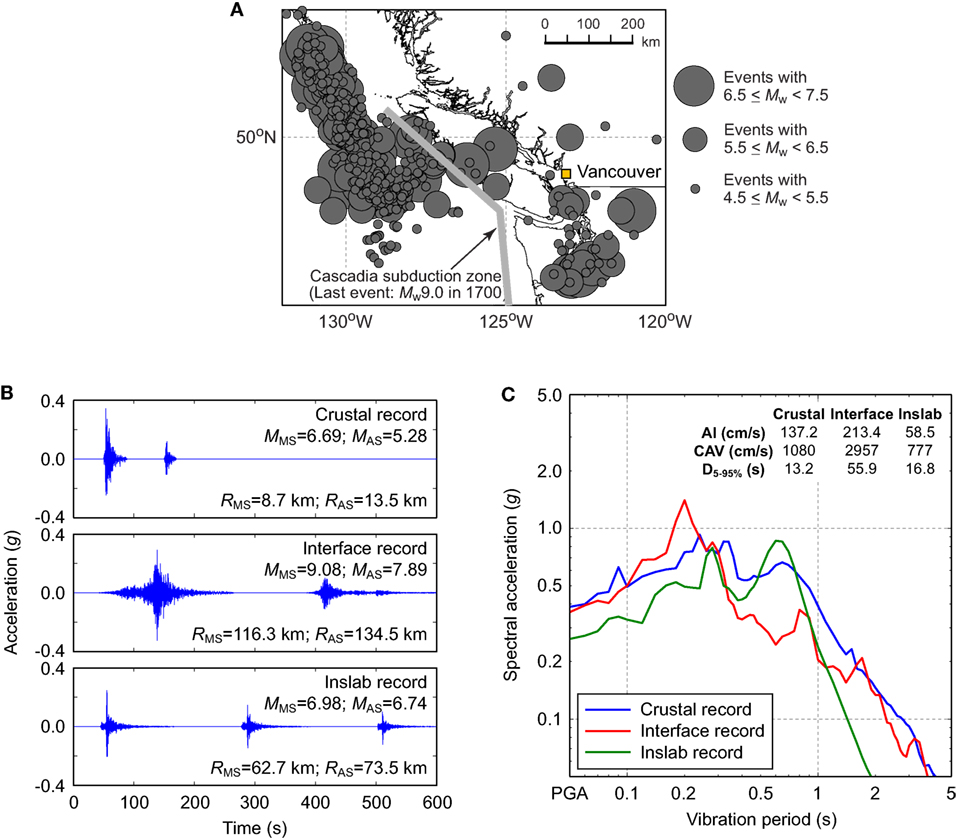
Figure 1. (A) Regional seismicity in southwestern British Columbia, Canada. (B) Sample ground motion records for crustal, interface, and inslab events. (C) Five percent damped response spectra of the sample ground motion records [single horizontal component shown in panel (B)] for crustal, interface, and inslab events.
The three earthquake types have different input characteristics. Thus, besides selecting appropriate EDPs, selecting the corresponding IM is important in the overall risk assessment. As such, consideration of spectral acceleration at the fundamental period Sa(T1), which is most commonly adopted in modern seismic hazard and risk studies, may not be the most suitable indicator of the energy input from the ground motion. In this article, Arias intensity (AI; Arias, 1970), CAV (Electrical Power Research Institute, EPRI), and significant duration of ground motion (D5–95%, Trifunac and Brady, 1975) are considered, and their correlations with structural damage are quantified. The definitions of AI and CAV are given as follows:
and
where a(t) is the accelerogram. D5–95% is defined as duration between times the AI of a ground motion record reaches 5 and 95% of its final value.
Energy-Based Damage Index
Energy-based damage indices are cumulative and are computed with consideration of hysteretic response (Gosain et al., 1977; Park and Ang, 1985; Kraetzig et al., 1989; Mehanny and Deierlein, 2000; see Table 1). Gosain et al. (1977) formulated a model to describe damage by using energy absorption normalized by yield force and displacement. Park and Ang (1985) proposed a widely used damage index DPA as a linear combination of deformation and absorbed energy under cyclic loading. The weighing factor used for the energy term in DPA is calibrated through experimental work. Kraetzig et al. (1989) developed an energy-based damage index DK that accounts for the energy dissipated in primary half cycles (PHCs) and follower half cycles (FHCs) for positive and negative parts of the response. Mehanny and Deierlein (2000) extended the Kraetzig et al.’s damage index by introducing weights on the PHCs and FHCs and the positive and negative damage indices and associated it with extent of physical damage. In this article, following Koduru and Haukaas (2010), the Mehanny–Deierlein damage index DMD is used. The limit states for DMD are shown in Table 2.
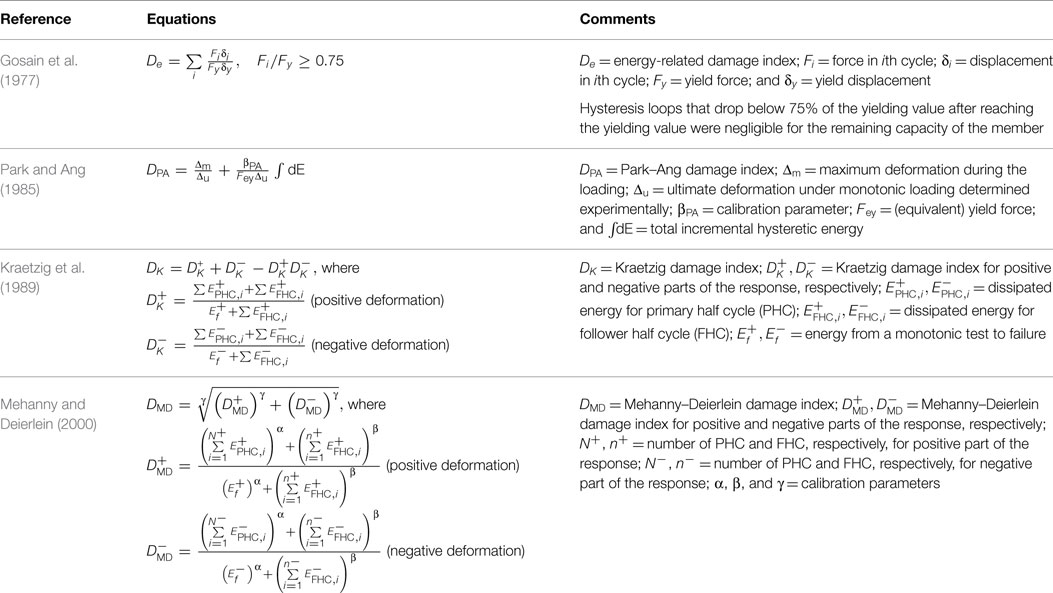
Table 1. Energy-based and combined damage indices.
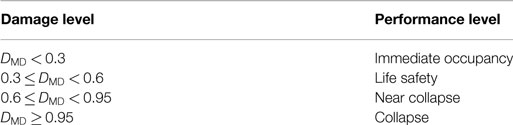
Table 2. Limit states for the Mehanny–Deierlein damage index.
To define relationships between different earthquake return periods and acceptable performance limit states, seismic performance matrices are often adopted (Table 3). It is highlighted that for frequent [50% probability of exceedance (PE) in 30 years], occasional (50% PE in 50 years), rare (10% PE in 50 years), and very rare (2% PE in 50 years) earthquake design levels, the corresponding design performance limit states are immediate occupancy (IO), life safety (LS), and collapse prevention (CP), respectively. For the energy-based earthquake damage evaluation, limit states indicated in Table 3 can be used with the corresponding definitions of the damage index (Table 2).
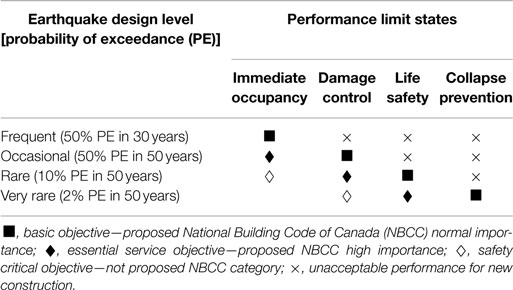
Table 3. Vision 2000 recommended seismic performance objectives for buildings (SEAOC, 1995).
Seismic Performance Evaluation
Structural Model
The reference structure considered in this study is a 15-story RC building constructed in 1988 and located in Vancouver, BC, Canada (Ventura et al., 2001; Koduru and Haukaas, 2010). The primary lateral load-resistant element of the building is shear walls (Figure 2). The building is fairly regular in plan, with minor setbacks at the fourth and fourteenth story levels (Figure 2A). The mixed-use building has commercial occupancy at the first floor and residential occupancy at the remaining floors. The shear walls in the staircase and elevator shafts are concentrated at the central core and form the main lateral load-resisting system (Figure 2B).
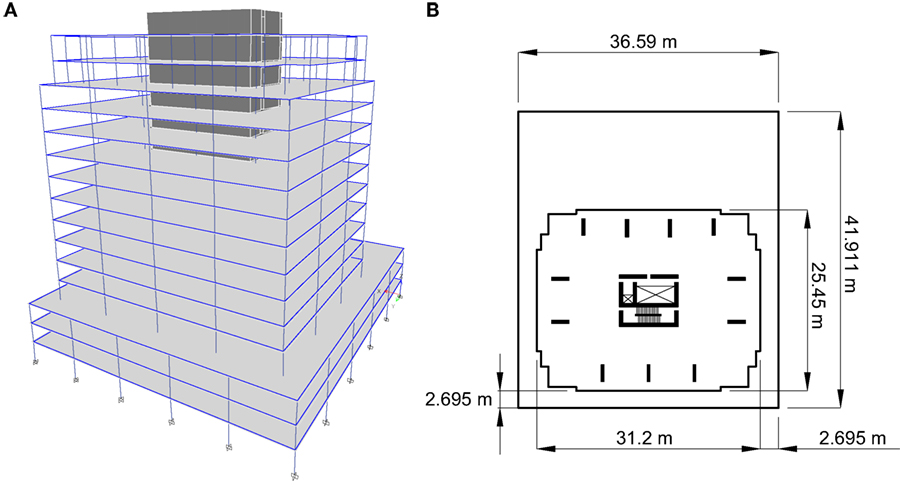
Figure 2. (A) Schematic view of the Heritage Court Tower building. (B) Schematic of a typical floor plan.
The first story height varies from 2.7 to 4.7 m, and subsequent stories are 2.7 m. Mass and stiffness of the building are used as a base model, and further simplifications are considered in developing a numerical model (Koduru, 2008). For example, four levels of underground parking below grade were not considered in the model, and the foundation was considered to be fixed at base. The numerical model for this building was developed by Koduru and Haukaas (2010) in OpenSees (McKenna et al., 2000). Finite element modeling of the structure was implemented using a fiber element, where the element cross-sections are discretized, and corresponding non-linear material properties of the core concrete, cover concrete, and reinforcing bars were assigned. The structural model consists of three components, i.e., gravity support columns, shear walls, and header beams. The modeling assumptions made by Koduru (2008) are outlined as follows:
• The effect of the RC flat plate slab is accounted for by means of the “rigid diaphragm” option in OpenSees.
• The gravity support columns, header beams, and shear walls are modeled as beam-column elements.
• The shear walls are designed to yield and form plastic hinges between the first and fourth stories. In the plastic region, the shear walls (first to fourth stories) and gravity columns (first to third stories) are modeled with fiber-discretized sections by accounting for bending moments and axial forces interaction.
• From the 4th to 10th story, the shear walls and gravity columns are modeled with non-linear elements. A hysteretic material model includes the force–deformation curve from section analysis and a stiffness degradation factor of 0.05. The shear force–deformation model is separately included in the section models of all non-linear elements. The upper stories, from the 10th to 15th, are modeled as elastic elements.
• The header beams, which connect the shear walls, are modeled as non-linear elements with a hysteretic model for the moment–curvature relationship.
Modal analysis is carried out; the first three modal vibration periods and corresponding damping ratios are obtained as follows. The first mode corresponds to the sway motion in the short structural axis direction; its vibration period and damping ratio are 0.9 s and 3.0%, respectively. The second mode is related to the torsional motion, and its vibration period and damping ratio are 0.84 s and 3.0%, respectively. The third mode is the sway mode in the long structural axis direction, and the corresponding vibration period and damping ratio are 0.25 s and 5.7%, respectively. The calculated vibration periods are in agreement with the measured vibration periods of the building by Ventura et al. (2001), i.e., first mode (0.81 s, short structural axis), second mode (0.79 s, torsional), and third mode (0.69 s, long structural axis). These dynamic characteristics are important for selecting ground motion records for use in non-linear dynamic analyses.
Seismic Hazard for Vancouver and Ground Motion Selection
The development of seismic damage prediction models requires a series of non-linear dynamic analyses of a structural model subjected to a set of ground motion records, which reflect the regional seismic hazard of interest. In this article, record selection based on multiple conditional mean spectra (CMS) for different earthquake types is carried out by following the same procedures described in the studies by Tesfamariam et al. (2015) and Tesfamariam and Goda (2015). The target CMS are developed for crustal, interface, and inslab earthquakes, based on full probabilistic seismic hazard analysis (PSHA) results by Atkinson and Goda (2011). The site of interest is Vancouver, and its surface soil is classified as site class C (average top 30 m shear-wave velocity ranges from 360 to 760 m/s). Figures 3A,B show the uniform hazard spectrum and seismic disaggregation result, respectively, at the return period of 2,500 years. The seismic disaggregation is based on spectral acceleration at 0.9 s (i.e., same as the fundamental vibration period of the building model). To develop CMS for different earthquake types, mean record characteristics for individual earthquake types are obtained from the PSHA results. Three CMS are included in Figure 3A, illustrating different spectral characteristics for the three earthquake types. For the considered case (i.e., Vancouver, site class C, vibration period of 0.9 s, and return period of 2,500 years), crustal, interface, and inslab events contribute equally to the overall seismic hazard.
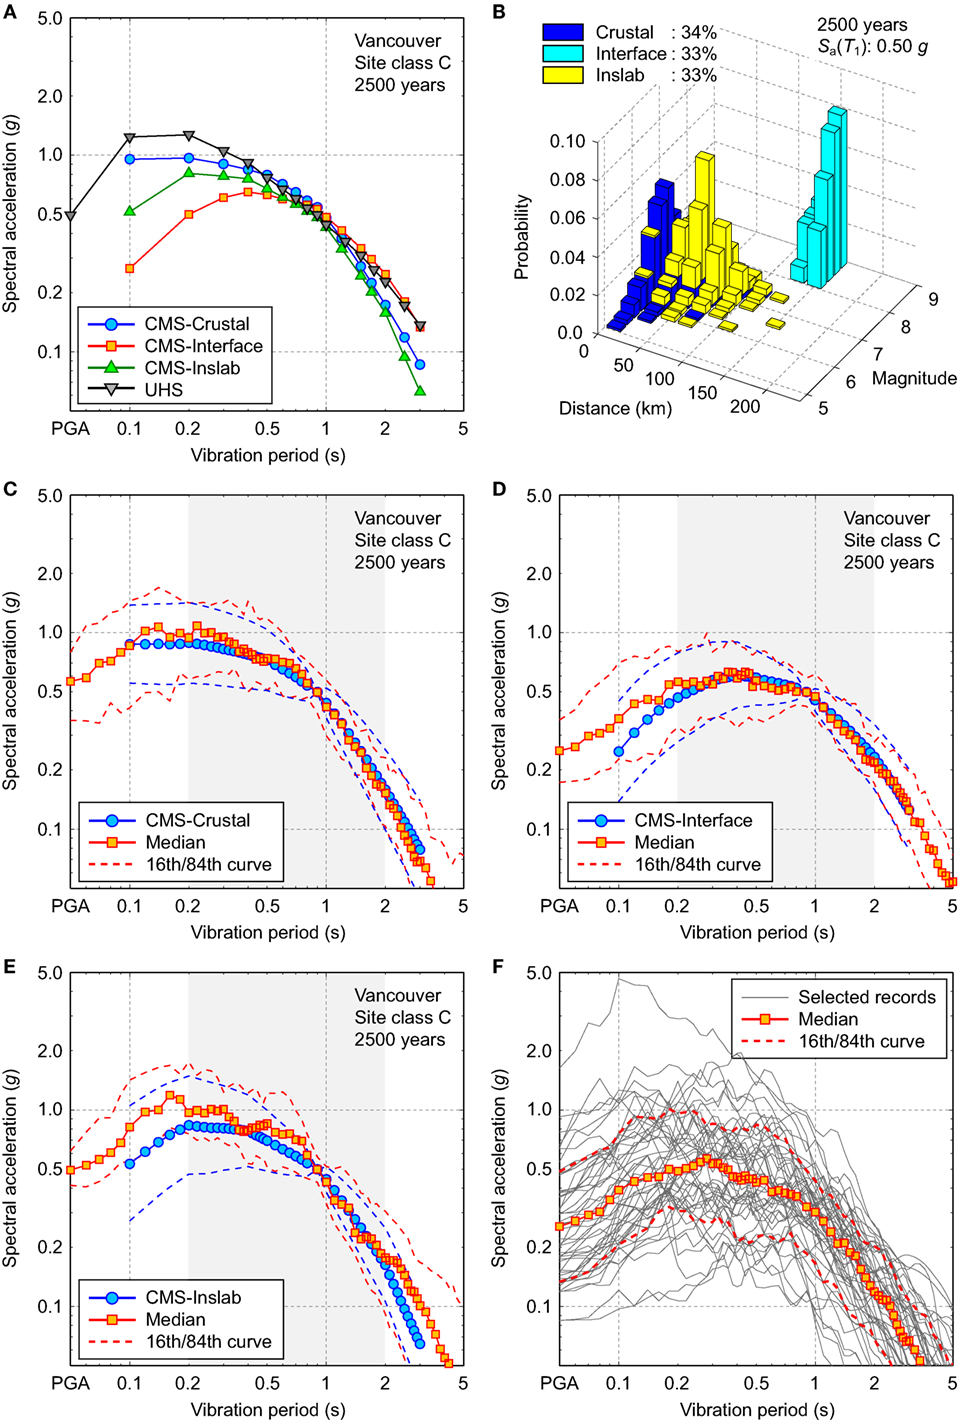
Figure 3. (A) Uniform hazard spectrum and conditional mean spectra for crustal, interface, and inslab events in Vancouver (site class C; return period of 2,500 years). (B) Seismic disaggregation for spectral acceleration at 0.9 s in Vancouver (site class C; return period of 2,500 years). Comparison of response spectra of the selected (mainshock) ground motion records (50th/16th/84th curve) and conditional mean spectra (mean and mean ± 1 SD): (C) crustal earthquakes, (D) interface earthquakes, and (E) inslab earthquakes. (F) Geometric mean response spectra of the selected mainshock ground motions.
To select a set of suitable ground motion records that match with the constructed CMS, an extended data set of real MS-AS sequences is used, which was developed by combing the worldwide (NGA) database (Goda and Taylor, 2012) with the Japanese (K-KiK-SK) database (Goda et al., 2015). The number of available MS-AS sequences is 606; among them, there are 197 crustal earthquakes, 340 interface earthquakes, and 69 inslab earthquakes. The interface events are from the Mw8.3 2003 Tokachi-oki earthquake and the Mw9.0 2011 Tohoku earthquake (which have similar event characteristics as the expected Cascadia subduction earthquake).
A set of ground motion records is selected by comparing response spectra of candidate records with the target spectra (i.e., CMS). The total number of records is set to 50. (Note: each record has two horizontal components.) The contributions from the 3 earthquake types are equal; as a result, 17, 17, and 16 records are selected for the crustal, interface, and inslab earthquakes, respectively. Response spectral matching is conducted in a least squares sense by considering the geometric mean of the response spectra of two horizontal components. (Note: spectral matching is performed for mainshock records of MS-AS sequences.) The vibration period range for spectral matching is from 0.1 to 2.0 s, which is inclusive of major vibration periods of the tall building model. Figures 3C–E show the statistics of the response spectra of the selected ground motion records (i.e., median as well as 16th and 84th percentile curves). For comparison, Figures 3C–E include the target CMS as well as the CMS ± 1 conditional standard deviation (SD) (Jayaram et al., 2011). The response spectra of the selected records and the target CMS are similar for the crustal and interface records; for inslab records, the selected records contain richer short-period spectral content than the target spectra. Given the availability of ground motion records and the dataset size of ground motion records (i.e., 16–17 for each earthquake type), matching of the candidate response spectra with the target is judged as adequate. Figure 3F shows the response spectra of the unscaled mainshock ground motions that are selected based on the preceding method. It is noted that the mean spectral acceleration at 0.9 s of the 50 records is about 0.36 g, which corresponds to the return period of 1,300 years, while 8 of 50 records exceed the spectral acceleration at 0.9 s that corresponds to the return period of 2,500 years (i.e., 0.5 g).
Figure 4A shows the magnitude–distance distribution of the selected earthquake records; in the figure, record characteristics for mainshocks and major aftershocks (i.e., events having the second largest magnitude within individual sequences) are included. Finally, Figures 4B,C compare the D5–95%-AI plot and the D5–95%-CAV plot for different earthquake types (mainshocks only). Figures 4B,C indicate that the interface records are associated with longer duration and larger CAV values than the crustal and inslab records.
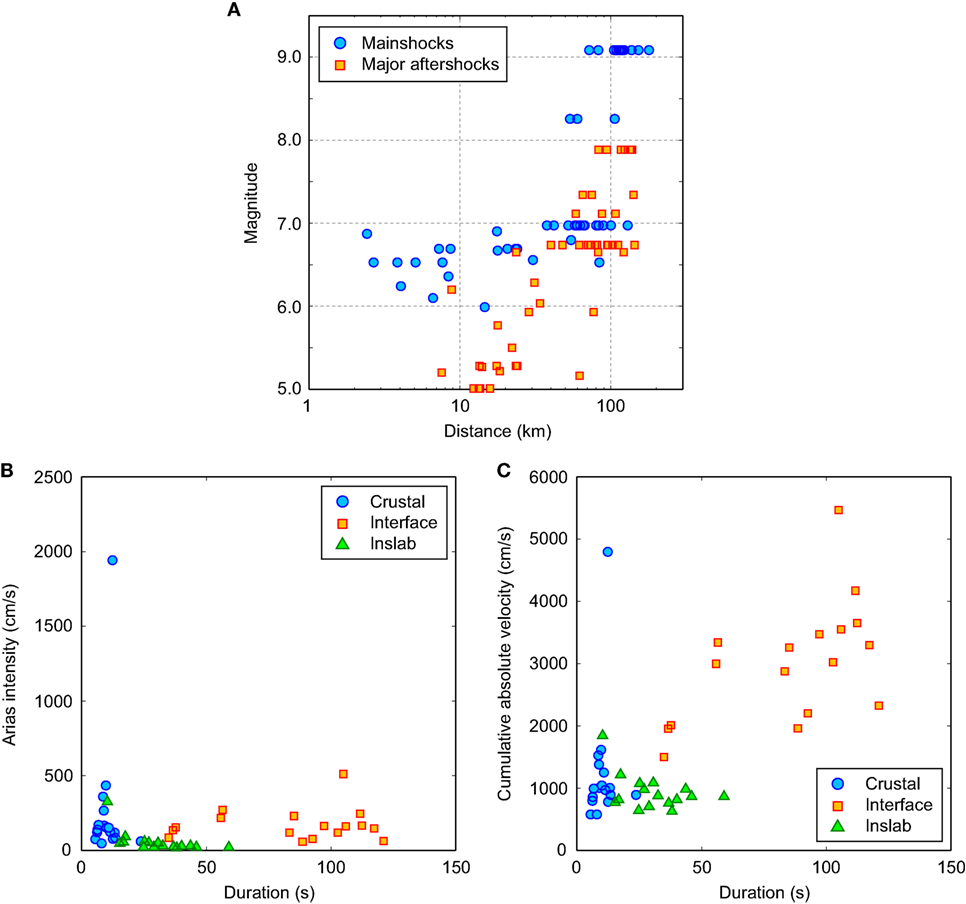
Figure 4. (A) Magnitude–distance distribution of mainshocks and major aftershocks of the selected ground motion sequences. (B) Duration–Arias intensity distribution of the selected mainshock ground motion records. (C) Duration–cumulative absolute velocity distribution of the selected mainshock ground motion records.
The selected ground motion records are used for seismic performance assessment of the tall building in Vancouver. The records reflect regional seismic hazard and dominant record characteristics. In particular, consideration of the 2011 Tohoku records is relevant to the seismic performance assessment in Vancouver because of the anticipated macro-level similarity between the 2011 Tohoku earthquake and possible Cascadia events. The relative contributions from the crustal, interface, and inslab events are equal (for the considered scenario), and thus, these records can also be used for evaluating the effects of ground motion records having different record characteristics (i.e., spectral content and duration) on non-linear seismic demand and earthquake damage potential. The records can be employed in cloud analysis to develop probabilistic seismic demand models. For this purpose, target spectral acceleration levels need to be defined.
Dynamic Analysis and Cloud Analysis
The structural analysis is carried for the 50 MS and 50 MS-AS earthquake records discussed in the previous section. The simulations are carried out using unscaled ground motions in bidirectional horizontal excitations of the 3D model (shown in Figure 2A). Various structural responses are stored for postprocessing, including time history data for interstory drift ratios and floor accelerations at all 16 stories, and Mehanny–Deierlein damage indices in the plastic hinge zone. The bidirectional interstory drift ratios were combined through geometric mean, and the corresponding drift values are used in the subsequent analysis. Figure 5 illustrates calculated time histories of structural responses subjected to the three crustal/interface/inslab ground motion records, which are the same as those shown in Figure 1B. Figure 5A shows results for the interstory drift ratio at the ninth story, while Figure 5B shows results for the Mehanny–Deierlein damage index for gravity column at the third story. The results of the third-story column is selected because the damage index of this structural element is in the middle of all other structural elements of the gravity frame system and is thus suitable to show the average trends. It can be inspected from Figure 5A that under the three input records, the structure behaves elastically as the MaxISDR is only 0.3–0.4%, and there is no significant residual drift after the earthquake sequences. On the other hand, accumulation of cumulative seismic demands to the structure can be observed in Figure 5B; in particular, a major aftershock following the interface mainshock record (middle panel in Figure 5B) shows noticeable increase of the damage index. The maximum values of DMD for the gravity column are still less than 0.3 for the three records; therefore, the structural damage to this element is considered to be negligible for these cases (see Table 2).
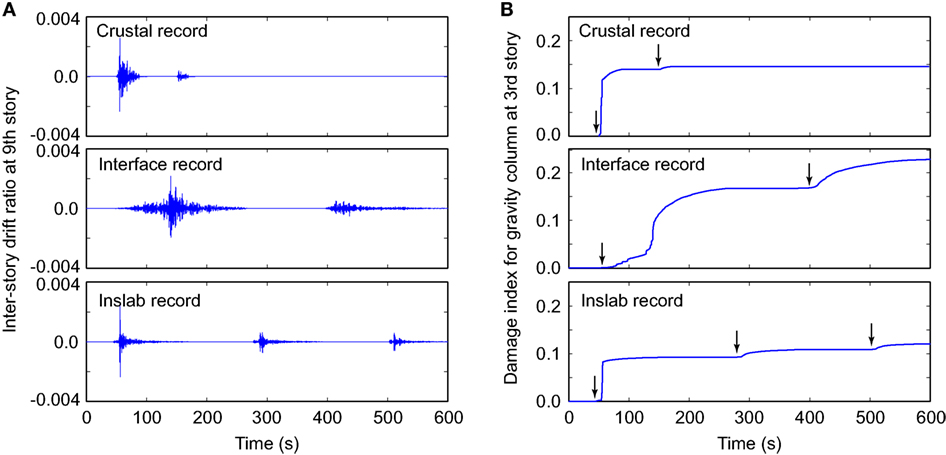
Figure 5. Sample time histories of structural responses subjected to three ground motion records (crustal, interface, and inslab; same records shown in Figures 1B): (A) interstory drift ratio at the ninth story and (B) damage index for gravity column at the third story.
Figures 6A,B show storywise profiles of interstory drift ratios (left) and relationships between MaxISDR and spectral acceleration (right), Sa(T1)-MaxISDR, for MS and MS-AS records, respectively. The results are obtained from the cloud analysis, and the responses due to different earthquake types are color coded in the figures. For both MS and MS-AS records, MaxISDR is less than 1% (minimal damage) and tends to take the largest values at the 8th to 10th stories. This is a result of higher mode effects on the response of the structure. The drift is minimal in the plastic hinge zone (the first four stories), as a combined effect of the shear walls and gravity columns. The Sa(T1)-MaxISDR plots display that MaxISDR is well correlated with Sa(T1). In the figure panels, fitted prediction models, having a form of log10EDP = a + blog10IM, where a and b are the regression coefficients, are also included. As a quantitative measure of efficiency (Luco and Cornell, 2007), SD of the regression residuals is indicated in the figure panels. It is noteworthy that although detailed results are not shown, similar regression analyses were performed for different IM variables, such as spectral accelerations at different vibration periods, AI, CAV, and D5–95%. It was found that for MaxISDR, Sa(T1) is the most efficient; this conclusion may be due to the elastic responses of the shear wall core under the ground motion records considered.
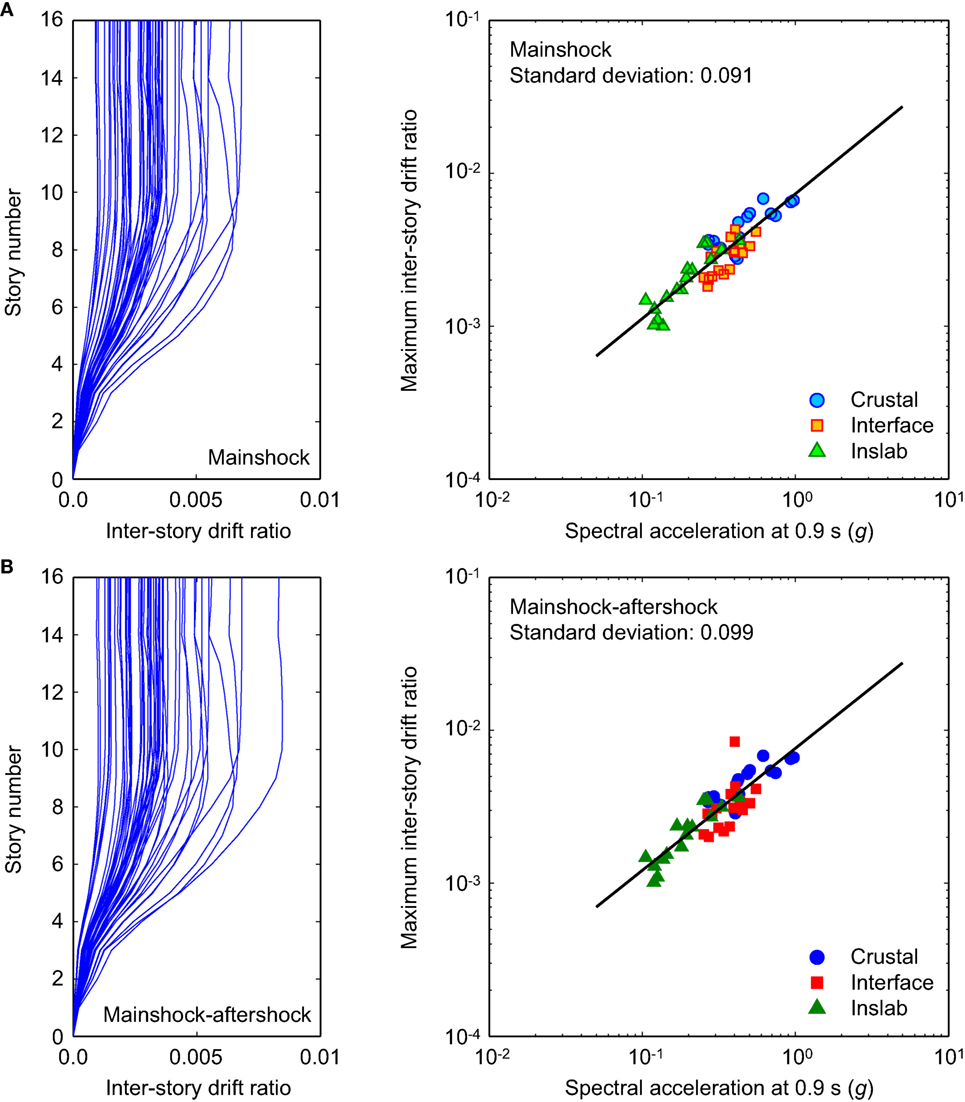
Figure 6. Peak drift demands from cloud analysis displaying storywise profiles of interstory drift ratios and maximum interstory drift ratio and spectral acceleration relationships: (A) MS records and (B) mainshock–aftershock records.
Overall, the results shown in Figure 6 indicate the effects of aftershocks are not significant in terms of interstory drift. It is noteworthy that the average increase due to major aftershocks is about 8%. However, this increase is mainly caused by only 6 sequences of 50; the majority of the aftershocks do not increase the overall interstory drift. This observation is in agreement with Goda and Taylor (2012) and Goda et al. (2015). Under the considered ground motions, the shear wall core structure remains to be mainly in the linear elastic range, and this indeed reiterates that the shear walls RC cores are not vulnerable (e.g., Yang et al., 2012). For this reason, the subsequent investigations focus upon the seismic damage evaluation of the plastic zone, gravity columns (first to third stories), header beams (second to fourth stories), and shear walls (first to fourth stories) based on the energy-based damage index; see Figure 2. This focus is justified because the members in the plastic zone area are susceptible to severe damage due to cyclic loading (Koduru and Haukaas, 2010).
Efficient IM for Energy-Based Damage Index
Effectiveness of each IM on the estimation of EDPs is assessed using the concept of efficiency. An efficient IM results in relatively small variability of EDP given IM (Luco and Cornell, 2007). This property can be quantified by the SD of the regression residuals of predicted EDP values for a given IM. In this section, the Mehanny–Deierlein damage indices DMD for the structural elements in the plastic zone are considered as EDP. More specifically, in total, 10 damage indices are focused upon; 3 are for the gravity columns (first/second/third story denoted as DMD-C1, DMD-C2, and DMD-C3, respectively), 3 are for the header beams (second/third/fourth story denoted as DMD-HB2, DMD-HB3, and DMD-HB4, respectively), and 4 are for the shear walls (first/second/third/fourth story denoted as DMD-SW1, DMD-SW2, DMD-SW3, and DMD-SW4, respectively). On the other hand, four IMs are considered to identify the efficient IM parameters: Sa(T1), AI, CAV, and D5–95%.
To compute efficiency of each IM, the log-linear model, i.e., log10EDP = a + blog10IM, is fitted using a least squares method. Table 4 summarizes the logarithmic SD of the regression residuals for all combinations of EDP and IM for both MS records and MS-AS records. To show the results graphically, scatter plots of the damage index (DMD-C3) versus four IMs for MS-AS records are presented in Figures 7A–D. The results shown in Table 4 and Figure 7 indicate that the SDs of the residuals are smallest for CAV, followed by AI, Sa(T1), and D5–95%. The results are consistent for all EDPs and for MS/MS-AS records. It can be concluded that CAV is the most efficient IM for DMD. Moreover, the results shown in Figures 7A–D suggest that interface records tend to result in greater damage index values in comparison with crustal and inslab records. This is because interface records are long-duration ground motions (Figure 4C), and thus, their cumulative damage potential is higher than other short-duration ground motions. The consideration of DMD as EDP facilitates the incorporation of cumulative damage modes into the seismic performance evaluation.
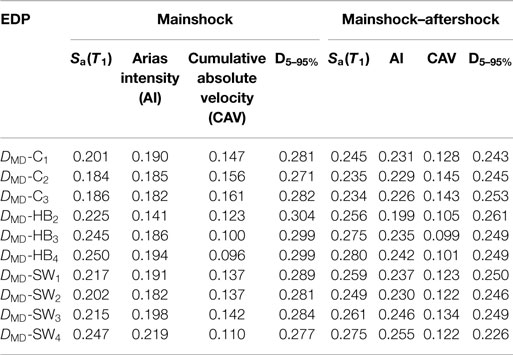
Table 4. Efficiency measure (i.e., logarithmic SD of regression residuals) for different intensity measures and engineering demand parameters (EDPs).
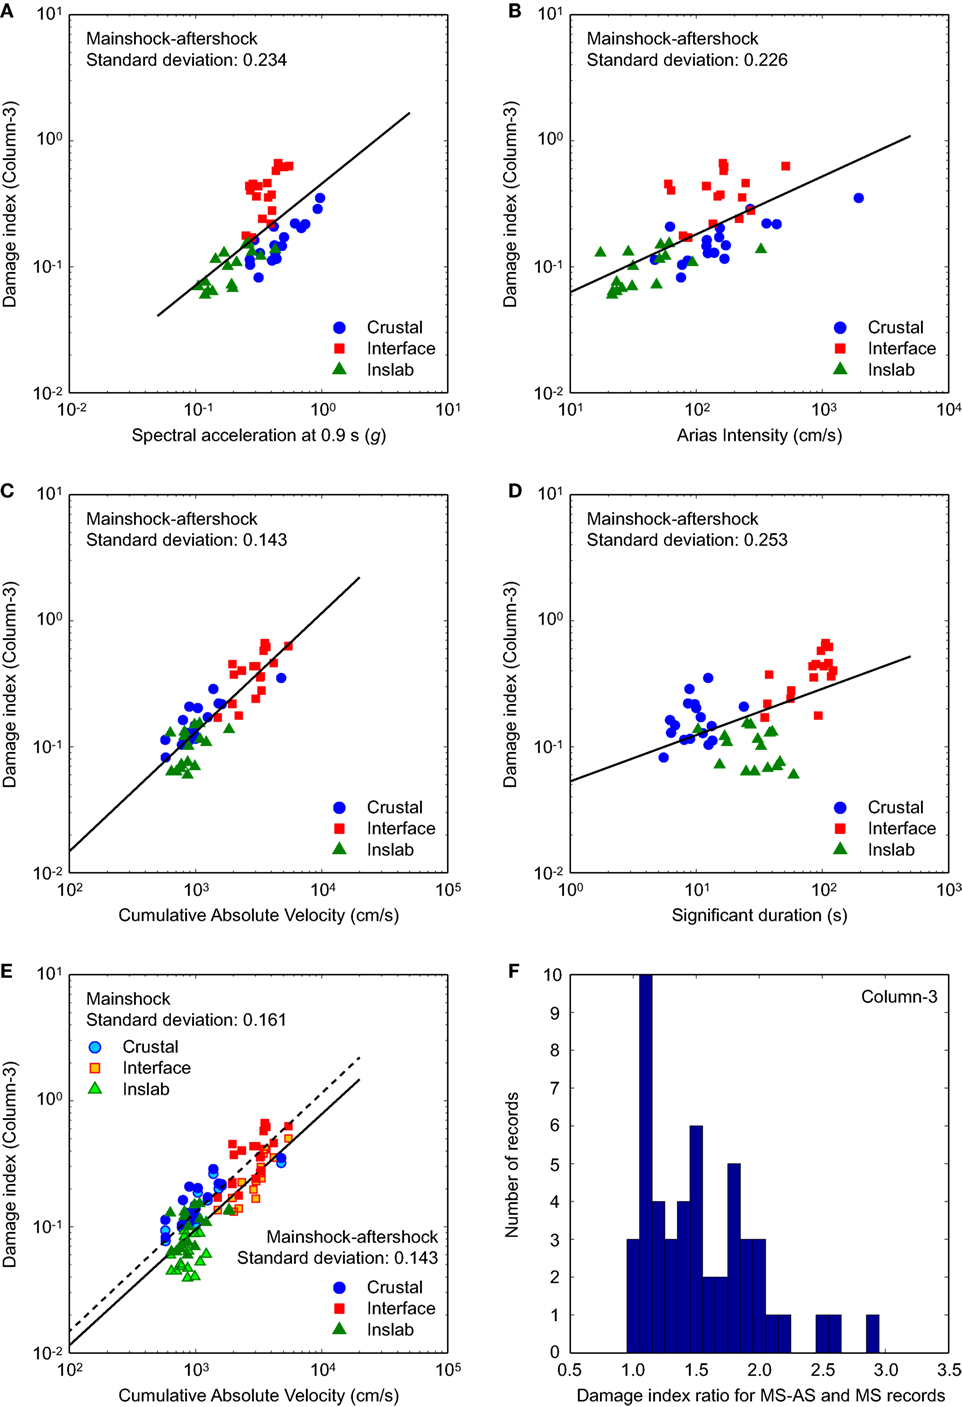
Figure 7. Scatter plots of damage index (DMD-C3) versus four intensity measures by considering mainshock–aftershock (MS-AS) records: (A) spectral acceleration at 0.9 s, (B) Arias intensity, (C) cumulative absolute velocity, and (D) significant duration. (E) Scatter plot of damage index (DMD-C3) versus cumulative absolute velocity by considering MS records and MS-AS records. (F) Histogram of the damage index ratios (DMD-C3) between MS-AS records and MS records.
Figure 7E compares the scatter plots of CAV and DMD-C3 for MS and MS-AS records, respectively. The results clearly show that the effects of major aftershocks for DMD-C3 are significant, resulting in increased earthquake damage. Based on the two fitted curves, the average increase of DMD can be quantified as 54%, which is in sharp contrast with the increase of MaxISDR shown in Figure 6. It is important to emphasize the differences of the aftershock effects on DMD-C3 and MaxISDR. For DMD-C3, the effects due to major aftershocks are noticeable for the majority of the cases, rather than a small fraction of the cases (which was applicable to MaxISDR). To demonstrate this clearly, a histogram of the ratios of DMD-C3 between MS-AS records and MS records is shown in Figure 7F. The results highlight the widespread influence of the major aftershocks on the damage index.
Combined Damage Index
The abovementioned results clearly indicate that the CAV is the efficient IM for all DMD, and the effects of earthquake types (long-duration interface events versus other earthquake types) and aftershocks have major influence on the earthquake damage evaluation. To perform probabilistic seismic risk analysis of the system in the plastic zone of the tall building, a combined measure of earthquake damage needs to be defined. It is noteworthy that the damage index computed for each component of the system represents local damage.
By assigning relative importance or weight to each local damage index, a global damage index can be computed. Park et al. (1987) proposed a story damage index Dstory as:
where Di is the local damage index at location i and Ei is the corresponding energy absorbed at location i. The energy dissipated, however, is also incorporated in the damage computation. This index can potentially misrepresent the overall damage state (Williams and Sexsmith, 1995). A more general combination rule for computing a global damage index was proposed by Bracci et al. (1989). They proposed weighing each local damage index by importance weight wi, and corresponding Dstory is computed as follows:
Parameter c is used to give higher importance to the most severely damaged elements. Bracci et al. (1989) suggested c = 1 and an equal weight to structural elements within the same story level. The global damage index is computed for each structural element, i.e., gravity columns, header beams, shear walls, within the plastic region. For simplicity, in this article, in assigning the weight, the number of structural elements at each floor is taken into consideration. For example, at the first and fourth stories, where only two types of structural members are considered, an equal weight of 0.5 can be assigned to each. On the other hand, for the second and third stories, three structural member types are present, and the weight can be assigned as 1/3. Furthermore, the damage index computed for each floor level is extended for the global damage index over the first four stories of the plastic regions, by assigning an equal weight (=0.25) to each floor.
Alternatively, more uniform weighting schemes may be considered. For instance, c = 0 in Eq. 5 corresponds to the arithmetic mean. Another popular choice for a uniform combination rule is the geometric mean of all contributing elements. In the following, these combination rules, in addition to Eq. 5 with c = 1, as proposed by Bracci et al. (1989), will be considered as a part of epistemic uncertainty associated with the structural damage assessment.
Figure 8A compares the 10 local damage indices of the gravity frame system for MS records with the combined damage index based on Eq. 5 with c = 1. It can be observed that the coupling beam at the second story shows the lowest damage index. The shear walls and gravity columns show higher damage indices, whereas the fourth story shear walls exhibit the highest damage potential. Figure 8B compares three combined damage indices in the plastic hinge zone for MS records, i.e., the Bracci et al. combination rule (Eq. 5 with c = 1), arithmetic mean, and geometric mean. The consideration of the Bracci et al. combination rule leads to higher values of the combined damage index because more weight is given to severe damage cases. The average ratios of the arithmetic mean and the geometric mean with respect to the Bracci et al. case are 0.67 and 0.52, respectively. This comparison illustrates the importance of the combination rule for defining the global damage index based on multiple local damage indices.
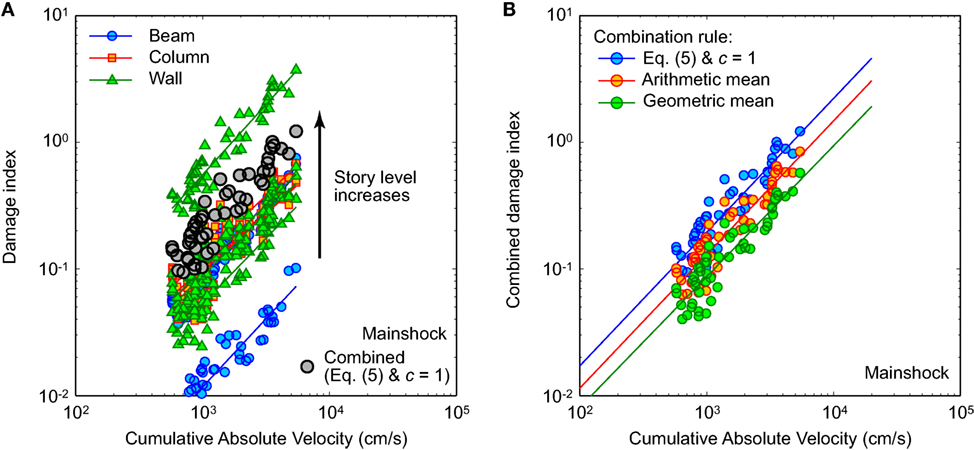
Figure 8. (A) Comparison of local damage indices with the combined damage index in the plastic hinge zone for MS records. (B) Comparison of three combined damage indices in the plastic hinge zone for MS records.
Based on the combined damage index for the gravity frame system (Bracci et al.’s combination rule with Eq. 5 and c = 1), prediction models of DMD,C in terms of CAV are developed as:
for MS records, and
for MS-AS records. The SDs of the regression residuals βD’CAV for Eqs 6 and 7 are 0.121 and 0.121, respectively. This is considered as the base case in the subsequent analyses.
As mentioned above, the combination rule of different local damage indices into a global damage index is an influential source of uncertainty. To investigate the effects of this uncertainty on seismic risk assessment, more uniform combination rules, such as arithmetic mean and geometric mean, can also be considered. By redefining the combined damage index DMD,C as arithmetic mean of the 10 local damage indices, seismic demand perdition models for DMD,C can be obtained as:
for MS records, and
for MS-AS records. The SDs for Eqs 8 and 9 are 0.120 and 0.115, respectively. Moreover, by adopting the geometric mean combination rule, seismic demand prediction models for DMD,C can be obtained as:
for MS records, and
for MS-AS records. The SDs for Eqs 10 and 11 are 0.123 and 0.110, respectively.
Fragility Curves for Energy-Based Damage Index
The developed CAV-DMD,C models (e.g., Eqs 6 and 7) can be used to derive fragility curves. The distribution of seismic demand about its median is often assumed to follow a two-parameter lognormal probability distribution. After estimating dispersion βD’CAV of the demand about its median, the fragility, i.e., probability that DMD > DMD,C at a given CAV, can be computed as:
where is the median structural capacity associated with the limit state. By taking the damage limit states shown in Tables 2 and 3 and the combination rule for the global damage index based on Eq. 5 with c = 1 (i.e., Eqs 6 and 7), three fragility curves are developed for the LS threshold (i.e., DMD,C = 0.30), near collapse (NC) threshold (i.e., DMD,C = 0.60), and collapse (C) threshold (i.e., DMD,C = 0.95). The fragility curves derived using Eq. 12 for MS records and MS-AS records are compared in Figure 9. The comparison of the fragility curves indicates that the effects of major aftershocks can be significant.
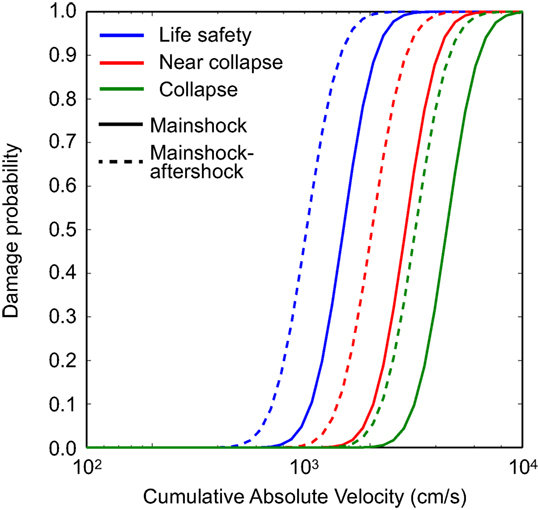
Figure 9. CAV-DMD,C fragility models for MS and mainshock– aftershock records based on the damage index thresholds listed in Tables 2 and 3. DMD,C is calculated based on Eq. 5 with c = 1.
It is noteworthy that Eq. 12 accounts for statistical uncertainty associated with seismic demand predictions only. On the other hand, there are other important uncertain elements in assessing seismic fragility, such as aleatory uncertainty of capacity C and epistemic modeling uncertainty, denoted by βC and βM, respectively (Ellingwood et al., 2007). To include these effects in evaluating the seismic fragility, the SD βD|CAV in Eq. 12 can be replaced by:
βM is assumed to be 0.20, by considering that the modeling process yields an estimate of building frame response that, with 90% confidence, is within ±30% of the actual value (Ellingwood et al., 2007). βC is assumed to be 0.25 for IO and LS, following Celik and Ellingwood (2009). For CP, however, βC can be considered to be 0.17 for the four-story gravity frame and 0.13 for the shear walls. Note that the mentioned values of βM and βC are obtained from the literature and are applicable to structural models that were considered therein. Therefore, caution should be exercised before adopting these recommended values of logarithmic SDs.
Probabilistic Seismic Risk Analysis
It is important to assess the seismic performance of the gravity frame system of the tall RC building by taking into account uncertainties associated with regional seismic hazards, ground motions, and seismic vulnerability. The PBEE-based risk analysis methodology, as formulated in Eq. 1, is suitable for such assessments. In carrying out such risk assessments for the tall building in Vancouver, the regional seismic hazard model by Atkinson and Goda (2011) can be used as a starting point. Changes to the ground motion models are necessary because the adopted IM for the gravity frame system is CAV, instead of Sa(T1). In this study, two ground motion models for CAV are considered. A model by Campbell and Bozorgnia (2012) is applicable to crustal earthquakes because this model was developed by using strong motion data from worldwide crustal earthquakes compiled in the PEER-NGA database. For the interface and inslab earthquakes, a model by Foulser-Piggott and Goda (2015) can be used because it was developed based on the extensive strong motion database of Japanese earthquakes, including the 2011 Tohoku data. For the seismic vulnerability assessment, the CAV-DMD,C models for MS records and MS-AS records developed in the study (see Eqs 6 and 7) are adopted. The numerical evaluation of Eq. 1 is conducted using Monte Carlo simulations. More specifically, a synthetic earthquake catalog of regional seismicity having five million years is generated from the regional seismicity model of Atkinson and Goda (2011). For a given seismic event in the catalog, a value of CAV is simulated by taking into account earthquake types (i.e., crustal, interface, and inslab). Subsequently, a value of DMD,C is sampled from the developed prediction models (i.e., Eqs 6–11). This is repeated for all seismic events in the catalog. In the CAV-based seismic hazard analysis, the average shear-wave velocity in the uppermost 30 m is set to 555 m/s (i.e., site class C). Once all values of CAV and DMD,C are evaluated, annual maximum hazard and risk values can be extracted to develop a seismic hazard curve (i.e., exceedance probability curve) for CAV [i.e., λ(IM) in Eq. 1] as well as a seismic risk curve for DMD,C [i.e., ν(DM) in Eq. 1]. In addition to the hazard and risk curves, seismic disaggregation plots can be obtained through the postprocessing of the results.
Figure 10 depicts the CAV-based seismic hazard results (i.e., hazard curve and corresponding disaggregation) at the return period of 2,500 years. The seismic hazard curve shown in Figure 10A indicates that the CAV values at the return periods of 500 and 2,500 years correspond to 1,230 and 2990 cm/s, respectively. The disaggregation plot at the 2,500-year return period level highlights significant contribution from the interface events (i.e., events having magnitudes greater than 8.0). The increase is in sharp contrast with the counterpart for Sa(T1), shown in Figure 3B. This is because long-duration characteristics of the interface events result in greater values of CAV.
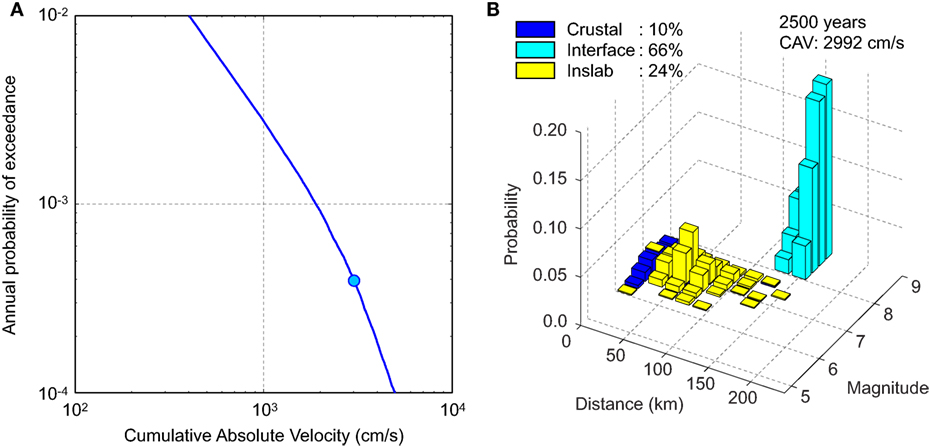
Figure 10. Cumulative absolute velocity-based seismic hazard results: (A) seismic hazard curve and (B) seismic hazard disaggregation.
Figure 11 shows the DMD,C-based seismic risk results. Two risk curves for MS records and MS-AS records are presented in Figure 11A, whereas the seismic risk disaggregation plots for MS records and MS-AS records at the 2,500-year return period are shown in Figure 11B and Figure 11C, respectively. The seismic demand prediction models used for obtaining the results shown in Figures 11A–C are Eqs 6 and 7. To relate the estimated damage potential to the limit states, four ranges of the damage limit states for DMD (i.e., Tables 2 and 3) are indicated along the upper boundary of the figure panel. The results shown in Figures 11A–C indicate that the influence of major aftershocks on the damage potential is significant, increasing the damage index values by approximately 40% for a given probability level. When the mainshock effects only are considered, the return periods that correspond to incipient of LS and NC damage states (i.e., DMD,C = 0.3 and 0.6, respectively) are 650 years and 2050 years. These return period levels are decreased to 350 years and 1,050 years (i.e., greater risks) when the aftershock effects are taken into account in addition to those due to the mainshocks. Comparison of the disaggregation plots for CAV and DMD,C suggests that they are very similar; these are because the differences of the earthquake types effectively capture the long-duration effects, as shown in Figure 7C.
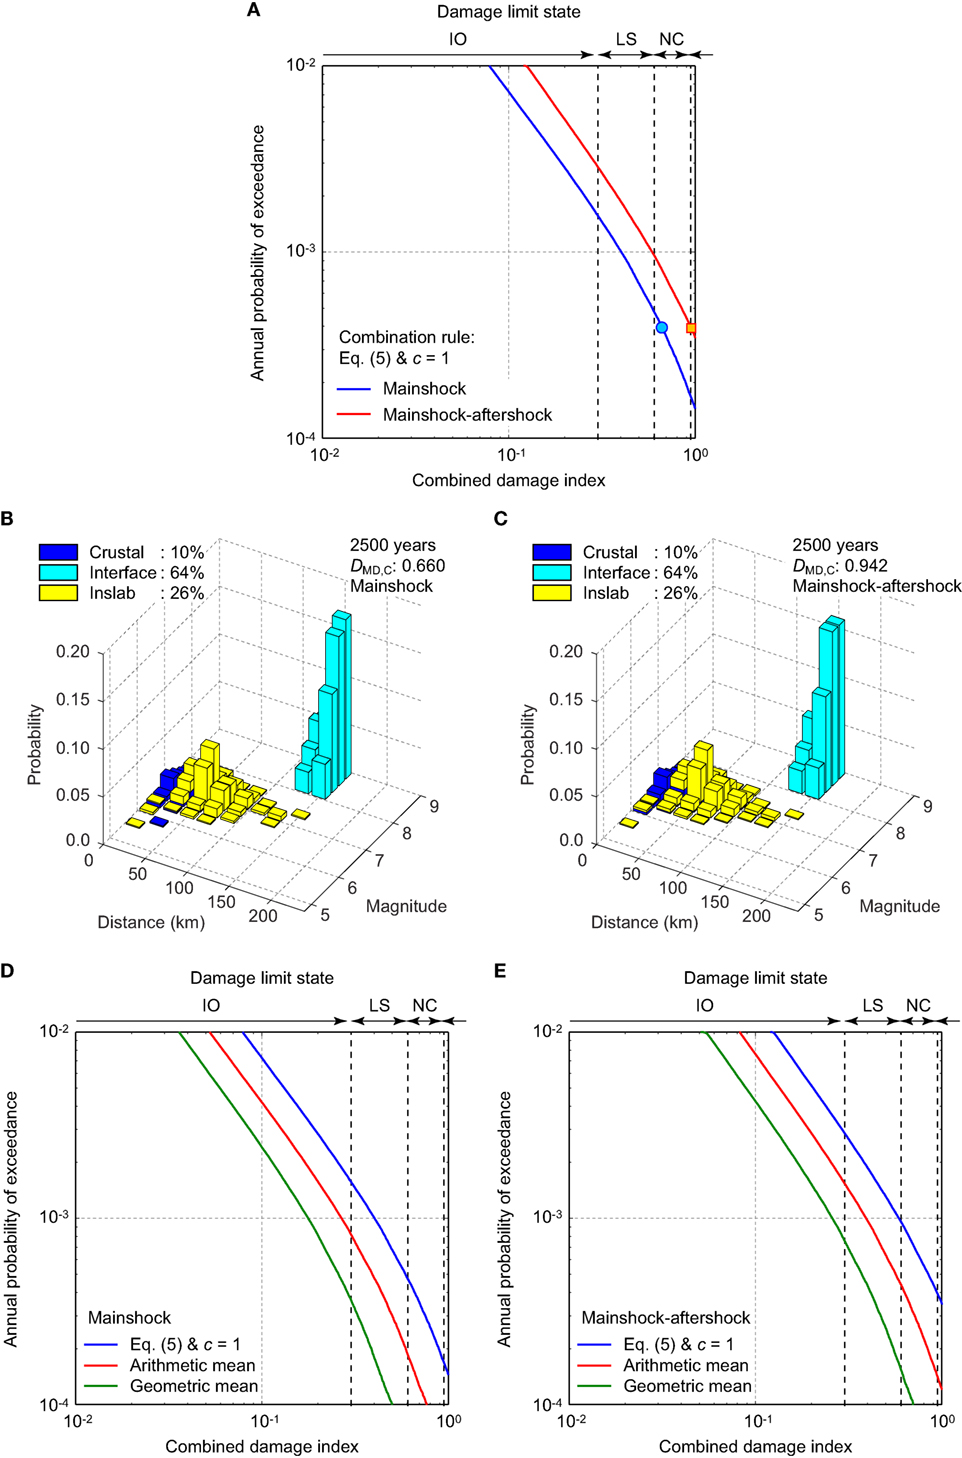
Figure 11. Damage index-based seismic risk results: (A) seismic risk curves for MS and mainshock–aftershock (MS-AS) records, (B) seismic risk disaggregation for MS records, and (C) seismic risk disaggregation for MS-AS records. Comparison of seismic risk curves based on three different combination rules for defining the combined damage index: (D) MS records and (E) MS-AS records.
Finally, the effects of the combination rule for defining the global damage index on seismic risk assessment are investigated. For this purpose, seismic risk assessments are carried out by considering three sets of seismic demand prediction models of DMD,C, i.e., Eqs 6 and 7 versus Eqs 8 and 9 versus Eqs 10 and 11. The results are shown in Figures 11D,E. The base case (i.e., Eqs 6 and 7) leads to greater damage index values, in comparison with the two other cases (i.e., arithmetic mean and geometric mean) because more weights are given to severely damaged structural elements. The differences of the seismic risk curves for the three cases are significant, highlighting the importance of capturing this uncertainty in seismic risk assessments.
Conclusion
Seismic performance of an RC shear wall system designed with Canadian design codes has shown acceptable performance in terms of drift limits. Recent damaging earthquakes have highlighted that MS-AS earthquake records are important factors in the overall risk assessment. Furthermore, gravity columns, which are not seismically detailed and thus have exhibited severe damage, can potentially lead to localized collapse. However, drift-based limit states showed little sensitivity to MS-AS earthquake records and impact of earthquake types. In this article, an energy-based damage index is considered to capture the effects of long-duration earthquake ground motions. It is important to assess the seismic performance of the gravity frame system of the tall RC building by taking into account uncertainties associated with regional seismic hazards, ground motions, and seismic vulnerability. The PBEE-based risk analysis methodology is suitable for such assessments. Thus, in this article, seismic performance of the 15-story RC shear wall building located in Vancouver, BC, Canada, was investigated. For the seismicity of Vancouver, BC, Canada, scope of the study and conclusions are summarized below.
• Three earthquake types, i.e., shallow crustal earthquakes, deep inslab earthquakes, and megathrust Cascadia subduction earthquakes, were considered. The three earthquake types have different frequency content and duration, and their impact on the seismic performance were evaluated.
• Drift-based and energy-based damage indices were considered as EDPs. The MaxISDR for both MS and MS-AS earthquake records was less than 1%. This indeed is within the IO limit state and could give a false sense of security that the building is safe. For the plastic zone located at the base of the building, the energy-based damage index is computed. The Mehanny–Deierlein damage index DMD is considered, which captures the responses from long-duration earthquakes. Earthquake types (long-duration interface events versus other earthquake types) and aftershocks have major influence on the earthquake damage evaluation in terms of DMD. As expected, the energy-based damage index has indeed shown to perform well in capturing the long-duration earthquake types.
• For DMD, four IMs, i.e., Sa(T1), AI, CAV, and D5–95%, were considered, and their efficiency was measured through residuals of the fitted prediction equations. From the calculated efficiency values, it was clearly shown that CAV is the most efficient IM for all DMD. Thus, CAV is used in the subsequent risk analysis.
• Seismic demand prediction models as well as fragility curves were developed based on the combined damage index. Both prediction models and fragility curves clearly showed the impact of major aftershocks on the vulnerability of the building.
• Convoluting the prediction model for the energy-based damage index with the seismic hazard of Vancouver, seismic risk was computed. The influence of major aftershocks on the damage potential was significant, increasing the damage index values by approximately 40% for a given probability level.
• The combination rule for defining a global damage index based on local damage indicators has major influence on seismic risk assessments. This kind of epistemic uncertainty should be taken into account.
Author Contributions
Both authors have contributed in this paper. ST performed the modeling, analysis, and computed the energy-based damage index. KG contributed in the ground motion selection, efficiency measure computation, and risk analysis.
Conflict of Interest Statement
The authors declare that the research was conducted in the absence of any commercial or financial relationships that could be construed as a potential conflict of interest.
Acknowledgments
Ground motion data for Japanese earthquakes and worldwide crustal earthquakes were obtained from the K-NET/KiK-net/SK-net databases at http://www.kyoshin.bosai.go.jp/ and http://www.sknet.eri.u-tokyo.ac.jp/, and the PEER-NGA database at http://peer.berkeley.edu/nga/index.html, respectively. This work was supported by the Natural Science Engineering Research Council Canada (RGPIN-2014-05013) to the first author and the Engineering and Physical Sciences Research Council (EP/M001067/1) to the second author. Part of this research was undertaken when the first author was a Benjamin Meaker visiting professor at the University of Bristol and the financial support is acknowledged.
References
Adebar, P., Bazargani, P., Mutrie, J., and Mitchell, D. (2010). Safety of gravity-load columns in shear wall buildings designed to Canadian standard CSA A23.3. Can. J. Civil Eng. 37, 1451–1461. doi: 10.1139/L10-075
Arias, A. (1970). “A measure of earthquake intensity,” in Seismic Design for Nuclear Power Plants, ed. R. J. Hansen (Cambridge, MA: MIT Press), 438–483.
Atkinson, G. M., and Goda, K. (2011). Effects of seismicity models and new ground motion prediction equations on seismic hazard assessment for four Canadian cities. Bull. Seismol. Soc. Am. 101, 176–189. doi:10.1785/0120100093
Boivin, Y., and Paultre, P. (2010). Seismic performance of a 12-storey ductile concrete shear wall system designed according to the 2005 National building code of Canada and the 2004 Canadian Standard Association standard A23.3. Can. J. Civil Eng. 37, 1–16. doi:10.1139/L09-115
Boivin, Y., and Paultre, P. (2012). Seismic force demand on ductile reinforced concrete shear walls subjected to western North American ground motions: part 1—parametric study. Can. J. Civil Eng. 39, 723–737. doi:10.1139/l2012-044
Bracci, J. M., Reinhorn, A. M., Mander, J. B., and Kunnath, S. K. (1989). Deterministic Model for Seismic Damage Evaluation of RC Structures. Technical Report NCEER-89-0033. Buffalo, NY: National Center for Earthquake Engineering Research, State University of New York.
Campbell, K. W., and Bozorgnia, Y. (2012). A comparison of ground motion prediction equations for Arias intensity and cumulative absolute velocity developed using a consistent database and functional form. Earthq. Spectra 28, 931–941. doi:10.1193/1.4000067
Celik, O. C., and Ellingwood, B. R. (2009). Seismic risk assessment of gravity load designed reinforced concrete frames subjected to Mid-America ground motions. J. Struct. Eng. 135, 414–424. doi:10.1061/(ASCE)0733-9445(2009)135:4(414)
Cornell, C. A., and Krawinkler, H. (2000). “Progress and challenges in seismic performance assessment,” in PEER Center News 3. Available at: http://peer.berkeley.edu/news/2000spring/performance.html
DiPasquale, E., and Cakmak, A. S. (1989). On the Relation between Local and Global Damage Indexes. Report No. NCEER-89-0034. Buffalo: National Center for Earthquake Engineering Research, State University of New York at Buffalo.
Electrical Power Research Institute (EPRI). (1988). A Criterion for Determining Exceedance of the Operating Basis Earthquake. Report No. EPRI NP-5930. Palo Alto, CA.
Ellingwood, B. R., Celik, O. C., and Kinali, K. (2007). Fragility assessment of building structural systems in Mid America. Earthq. Eng. Struct. Dyn. 36, 1935–1952. doi:10.1002/eqe.693
Foulser-Piggott, R., and Goda, K. (2015). Ground-Motion Prediction Models for Arias Intensity and cumulative absolute velocity for Japanese earthquakes considering single-station sigma and within-event spatial correlation. Bull. Seismol. Soc. Am. 105, 1903–1918. doi:10.1785/0120140316
Goda, K., and Taylor, C. A. (2012). Effects of aftershocks on peak ductility demand due to strong ground motion records from shallow crustal earthquakes. Earthq. Eng. Struct. Dyn. 41, 2311–2330. doi:10.1002/eqe.2188
Goda, K., Wenzel, F., and De Risi, R. (2015). Empirical assessment of nonlinear seismic demand of mainshock-aftershock ground motion sequences for Japanese earthquakes. Front. Built Environ. 1:6. doi:10.3389/fbuil.2015.00006
Gosain, N. K., Brown, R. H., and Jirsa, J. O. (1977). Shear requirements for load reversals on RC members. J. Struct. Eng. 103, 1461–1476.
Goulet, C. A., Haselton, C. B., Mitrani-Reiser, J., Beck, J. L., Deierlein, G. G., Porter, K. A., et al. (2007). Evaluation of the seismic performance of a code-conforming reinforced-concrete frame building – from seismic hazard to collapse safety and economic losses. Earthq. Eng. Struct. Dyn. 36, 1973–1997. doi:10.1002/eqe.694
Hyndman, R. D., and Rogers, G. C. (2010). Great earthquakes on Canada’s west coast: a review. Can. J. Earth Sci. 47, 801–820. doi:10.1139/E10-011
Jalayer, F., Franchin, P., and Pinto, P. E. (2007). A scalar decision variable for seismic reliability analysis of RC frames. Earthq. Eng. Struct. Dyn. 36, 2050–2079. doi:10.1002/eqe.704
Jayaram, N., Lin, T., and Baker, J. W. (2011). A computationally efficient ground-motion selection algorithm for matching a target response spectrum mean and variance. Earthq. Spectra 27, 797–815. doi:10.1193/1.3608002
Koduru, S. D., and Haukaas, T. (2010). Probabilistic seismic loss assessment of a Vancouver high-rise building. J. Struct. Eng. 136, 235–245. doi:10.1061/(ASCE)ST.1943-541X.0000099
Koduru, S. M. (2008). Performance-Based Earthquake Engineering with the First-Order Reliability Method. Ph.D. thesis, The University of British Columbia, Vancouver.
Kraetzig, W., Meyer, I., and Meskouris, K. (1989). “Damage evolution in reinforced concrete members under cyclic loading,” in Proc. of 5th International Conference on Structural Safety and Reliability (ICOSSAR 89) (San Francisco, CA), 795–802.
Luco, N., and Cornell, C. A. (2007). Structure-specific scalar intensity measures for near-source and ordinary earthquake ground motions. Earthq. Spectra 23, 357–392. doi:10.1193/1.2723158
Luu, H., Léger, P., and Tremblay, R. (2014). Seismic demand of moderately ductile reinforced concrete shear walls subjected to high-frequency ground motions. Can. J. Civil Eng. 41, 125–135. doi:10.1139/cjce-2013-0073
McKenna, F., Fenves, G. L., and Scott, M. H. (2000). Open System for Earthquake Engineering Simulation. Berkeley, CA: University of California. Available at: http://opensees.berkeley.edu
Mehanny, S. S., and Deierlein, G. G. (2000). Modeling of Assessment of Seismic Performance of Composite Frames with Reinforced Concrete Columns and Steel Beams. California: The John A. Blume Earthquake Engineering Center, Stanford University. Report No 135.
Naeim, F., Lew, M., Carpenter, L. D., Youssef, N. F., Rojas, F., Saragoni, G. R., et al. (2011). Performance of tall buildings in Santiago, Chile during the 27 February 2010 offshore Maule, Chile earthquake. Struct. Des. Tall Spec. Build. 20, 1–16. doi:10.1002/tal.675
Park, Y. J., and Ang, A. H.-S. (1985). Mechanistic seismic damage model for reinforced concrete. J. Struct. Eng. 111, 722–739. doi:10.1061/(ASCE)0733-9445(1985)111:4(722)
Park, Y. J., Ang, A. H.-S., and Wen, Y. K. (1987). Damage-limiting aseismic design of buildings. Earthq. Spectra 3, 1–26. doi:10.1193/1.1585416
Reinhorn, A. M., and Valles, R. E. (1995). Damage Evaluation in Inelastic Response of Structures: A Deterministic Approach. Report No. NCEER-95. Buffalo: National Center for Earthquake Engineering Research, State University of New York at Buffalo.
SEAOC. (1995). Vision 2000: Performance-Based Seismic Engineering of Buildings. Sacramento, CA: Structural Engineers Association of California.
Stirrat, A. T., Gebreyohaness, A. S., Jury, R. D., and Kam, W. Y. (2014). “Seismic performance assessment of non-ductile columns,” in 2014 NZSEE Conf.: New Zealand Society of Earthquake Engineering NZSEE (Auckland, New Zealand).
Takewaki, I., Murakami, S., Fujita, K., Yoshitomi, S., and Tsuji, M. (2011). The 2011 off the Pacific coast of Tohoku earthquake and response of high-rise buildings under long-period ground motions. Soil Dyn. Earthq. Eng. 31, 1511–1528. doi:10.1016/j.soildyn.2011.06.001
Tesfamariam, S., and Goda, K. (2015). Seismic performance evaluation framework considering maximum and residual inter-story drift ratios: application to non-code conforming reinforced concrete buildings in Victoria, BC, Canada. Front. Built Environ. 1:18. doi:10.3389/fbuil.2015.00018
Tesfamariam, S., Goda, K., and Mondal, G. (2015). Seismic vulnerability of RC frame with unreinforced masonry infill due to mainshock-aftershock earthquake sequences. Earthq. Spectra 31, 1427–1449. doi:10.1193/042313EQS111M
Tesfamariam, S., and Saatcioglu, M. (2008). Risk-based seismic evaluation of reinforced concrete buildings. Earthq. Spectra 24, 795–821. doi:10.1193/1.2952767
Tremblay, R., Léger, P., and Tu, J. (2001). Inelastic seismic response of concrete shear walls considering P-delta effects. Can. J. Civil Eng. 28, 640–655. doi:10.1139/cjce-28-4-640
Trifunac, M. B., and Brady, A. G. (1975). A study on the duration of strong earthquake ground motion. Bull. Seismol. Soc. Am. 65, 581–626.
Vamvatsikos, D., and Cornell, C. A. (2002). Incremental dynamic analysis. Earthq. Eng. Struct. Dyn. 31, 491–514. doi:10.1002/eqe.141
Ventura, C. E., Brincker, R., Dascotte, E., and Andersen, P. (2001). “FEM updating of the heritage court building structure,” in Proc. of Conference on Structural Dynamics (IMAC-XIX) (Orlando, FA), 324–330.
Williams, M. S., and Sexsmith, R. G. (1995). Seismic damage indices for concrete structures: a state-of-the-art review. Earthq. Spectra 11, 319–349. doi:10.1193/1.1585817
Keywords: seismic performance, energy-based damage index, gravity frame, shear wall, reinforced concrete building, mainshock–aftershock earthquake
Citation: Tesfamariam S and Goda K (2017) Energy-Based Seismic Risk Evaluation of Tall Reinforced Concrete Building in Vancouver, BC, Canada, under Mw9 Megathrust Subduction Earthquakes and Aftershocks. Front. Built Environ. 3:29. doi: 10.3389/fbuil.2017.00029
Received: 07 March 2017; Accepted: 28 April 2017;
Published: 30 May 2017
Edited by:
Oren Lavan, Technion – Israel Institute of Technology, IsraelReviewed by:
Marie-José Nollet, École de technologie supérieure, CanadaRita Bento, Universidade de Lisboa, Portugal
Copyright: © 2017 Tesfamariam and Goda. This is an open-access article distributed under the terms of the Creative Commons Attribution License (CC BY). The use, distribution or reproduction in other forums is permitted, provided the original author(s) or licensor are credited and that the original publication in this journal is cited, in accordance with accepted academic practice. No use, distribution or reproduction is permitted which does not comply with these terms.
*Correspondence: Solomon Tesfamariam, solomon.tesfamariam@ubc.ca