Structural Risk Assessment and Mitigation for Low- to Mid-Rise Residential Buildings in China
 Kasim A. Korkmaz
- School of Visual and Built Environments, Eastern Michigan University, Ypsilanti, MI, United States
China has experienced major earthquakes recently. The 2014 Ludian earthquake struck Ludian County, Yunnan, (Mw = 6.1) on 3 August, 2014. On April 20th 2013, Ya’an earthquake (Mw = 6.9), on April 14th 2010, Qinghai earthquake (Mw = 7.1), on July 9th 2009, Yunnan earthquake (Mw = 6.0), and on May 12th 2008, Sichuan earthquake (Mw = 7.9) struck China. Among these disasters, the most devastating, the Sichuan earthquake, resulted in the collapse of 5 million buildings and damage to more than 21 million. Human loss was also high with over 60,000 people dead, 360,000 injured, and more than 14 million people displaced. South-west China lies in an area that is prone to earthquakes. In 1970, a magnitude 7.7 earthquake in Yunnan with 15,000 lost. This study presents a detailed risk assessment for a structural risk assessment and mitigation for low- to mid-rise residential buildings for China. The risk assessment, through seismic hazard assessment approaches, evaluates the impact of the disasters for integrated structural health monitoring. Among the results of the investigation, relations and links between safety and risk are defined.
Introduction
Earthquakes are devastating natural disasters affecting human safety and causing high degrees of damage to infrastructures (Bryant, 1993; Fiedrich et al., 2000; Marcuson et al., 2003), and most cities and regions throughout the world have experienced devastating seismic events (Guo-hua et al., 2009). Since social, economic, and engineering consequences of earthquake disasters are of significant research interest, case studies, improved approaches, and statistical procedures have been established to investigate the effects of these disasters (Akason et al., 2006). The prevention of seismic risks mainly necessitate understanding of engineering solutions (Tansel, 1995). During 2010, on January 12th, Leogane, Haiti (Mw = 7.0), on February 27th, Maule, Chile (Mw = 8.8), and April 14th, Qinghai, China (Mw = 7.1) earthquakes occurred. Among these disasters, the Haiti earthquake caused more than 230,000 deaths making it the 6th deadliest earthquake. The Chilean earthquake was the seventh strongest earthquake since 1900.
Recently, China experienced major earthquakes: The 2014 Ludian earthquake struck Ludian County, Yunnan, (Mw = 6.1) on August 3rd 2014. On April 20th 2013, Ya’an earthquake (Mw = 6.9), on April 14th 2010, Qinghai earthquake (Mw = 7.1), on July 9th 2009, Yunnan earthquake (Mw = 6.0), and on May 12th 2008, Sichuan earthquake (Mw = 7.9) struck China (Ou and Li, 2010). Among these disasters, the most devastating, the Sichuan earthquake, resulted in the collapse of 5 million buildings and damage to more than 21 million. Human loss was also high with 360,000 injured, over 60,000 dead, and about 14 million people displaced. South-west China lies in an area that is seismically active. In 1970, 15,000 people dead in Yunnan earthquake with a magnitude 7.7. Figure 1 locates historical earthquakes (Mw > 6) within circles on the map (Gu et al., 2015).
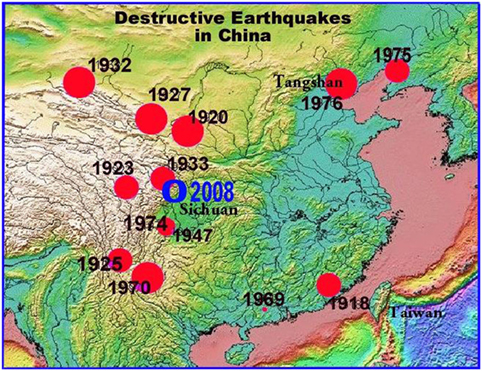
Figure 1. Historical Chinese earthquakes (M > 6).
Among the recent disasters in China, the most devastating was the Sichuan earthquake which produced a magnitude of 7.9 and occurred 92 km northwest of the Chinese Sichuan province on May 12th 2008. The Sichuan earthquake occurred on the margin of the Tibetan Plateau; in contrast to the April 14th 2010 event, the Qinghai earthquake occurred in the plateau’s interior. The Sichuan province has one of the highest populations in China with 100-million people and a heavily industrialized region (Yongshuang et al., 2007; Huang, 2008; Zifa, 2008; Wu and Olson, 2009). This earthquake was the most devastating since the 1976 Tangshan earthquake, at where 240,000 people died. In the Sichuan earthquake, 5 million buildings collapsed, and 20 million buildings were damaged. China’s Information Office of the State Council reported that over 60,000 people died and 360,000 injured. The total economic loss was estimated more than 80 billion US dollars (ABS, 2008; EERI (Earthquake Engineering Research Institute), 2008; Miyamoto, 2008; Cui et al., 2011; Perlstein and Ortolano, 2015). The earthquake history in China appears in Table 1, and Figure 2 gives the population distribution and the seismically active regions.
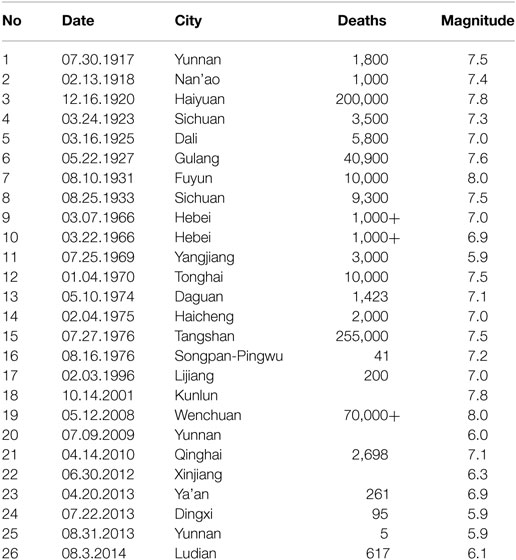
Table 1. Chinese Earthquakes.
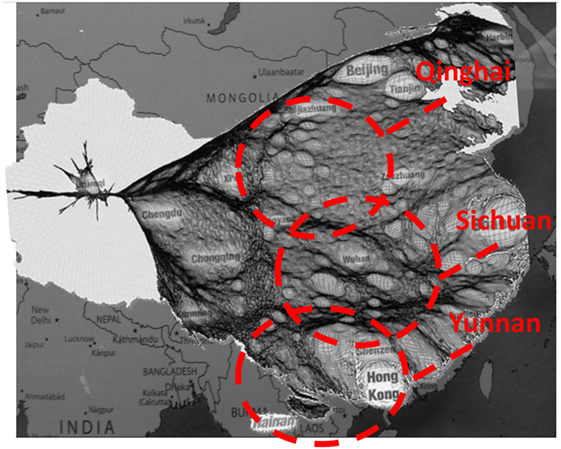
Figure 2. Population distribution and the seismically active regions [adopted from Worldmapper (2016)].
During the Sichuan earthquake, different types of reinforced concrete (RC) residential buildings were severely damaged or collapsed. Damaged/collapsed buildings represented construction during different time periods. Buildings constructed strictly according to design codes (Gbj11-1989, 1989; GB 50011-2001, 2001; GB 50011-2002, 2002) and with good workmanship performed well during the earthquake. However, a great number of damaged or collapsed residential buildings represented construction with poor workmanship, substandard materials, and inadequate reinforcement (Burchfiel et al., 2008; Chen and Somerville, 2008).
This study develops a detailed structural evaluation for residential low- to mid-rise buildings in China for a structural risk assessment and mitigation. A detailed probabilistic risk analyses were conducted with data from 900 different earthquakes that occurred between 1973 and 2016 to give an assessment approach. The earthquake data allow plotting occurrence probabilities of earthquakes by using the Poisson model and the magnitudes of the seismic events, and the investigation considers collapse and damage to existing low- to mid-rise residential buildings that dominate the building inventory in seismically active regions in China. Among the results of the investigation, relations and links between safety and risk are defined. The objective of the study is to evaluate the low- to mid-rise residential buildings in China in terms of earthquake resistance. In the study, typical RC residential buildings were designed to define the seismic vulnerability. The sample models represent variety of existing RC residential buildings. Non-linear seismic analyses of RC residential buildings were completed.
Sturtucral Risk Assessment
In last decade, majority of the existing buildings have been traded with low- to mid-rise RC buildings including schools, hospitals, governmental offices, hotels, and financial and business centers. The majority of such buildings were exiguous designed and are similar to each other in all over the China. Majority of the existing residential buildings are suspected too vulnerable to strong earthquakes (ABS, 2008; EERI (Earthquake Engineering Research Institute), 2008; OCHA, 2008; USGS, 2010). Figure 3 gives an idea about example of the existing buildings. Low-rise residential buildings have the majority that got damage/collapsed. Severe damage at beam-column connections also occurred. Various types of damages have been observed in the earthquake, and these damages are given in Figure 4. As seen in Figure 4, damaged and collapsed buildings in the region are weak buildings against seismic loads. Therefore, buildings got severe damages.
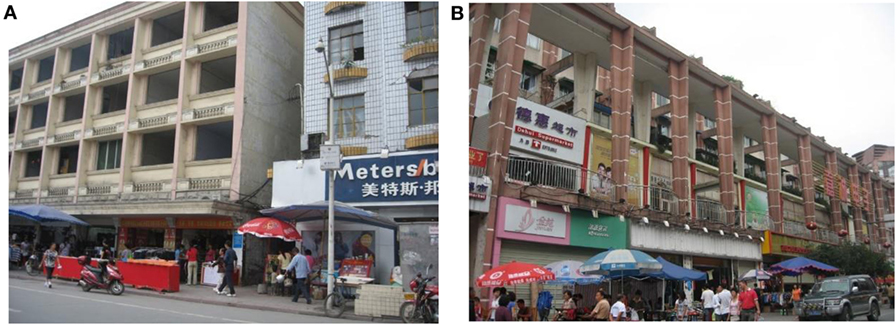
Figure 3. Examples of existing buildings. (A) Typical reinforced concrete building and (B) multistory building with stores.
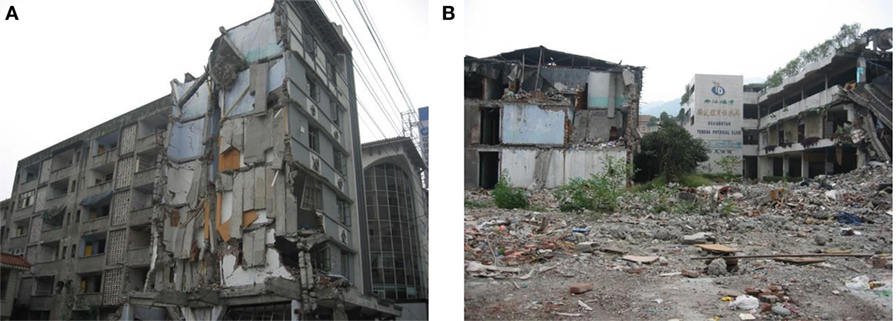
Figure 4. Examples of damaged and collapsed buildings. (A) Typical damaged reinforced concrete building and (B) collapsed and damaged buildings.
Masonry walls are common as infill walls for both interiors and exteriors (Park et al., 1985). Most of the RC buildings have shop openings on the ground floor; each shop occupies one bay in the direction parallel with the street with the shop’s front open to the street and separated from the other shops by partition walls in the direction perpendicular to the axis of the street. This design makes buildings particularly vulnerable to soft-story collapse in a direction parallel with the street. The damage could also result from a lack of consideration in the design phase for the change in relative stiffness provided by infill walls between the ground and the upper floors. Constructional material is the ranging from natural stones to bricks and blocks. Designing these structures for satisfactory structural behavior is a demanding task. Large displacements and damage are sustained by the ground floor column, where, relative to the stiffer upper floors, most of the deformation demands from the earthquake occur. Figure 5 shows a typical RC building with a soft story at the ground level. Soft stories are considered as weak to seismic loads, and many of the damages are observed in soft stories in the previous earthquakes experienced.
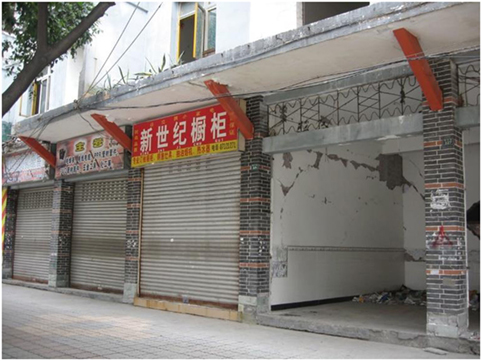
Figure 5. Soft story due to stores at the ground floor.
Risk Mitigation and Control
Risk is defined with the probability of occurrence of an event or as the magnitude of the consequences in a period (Solomon et al., 1983). Probabilistic seismic risk is the probability of occurrence of a destructive seismic event in a location in a period (Glaser et al., 2007). When investigating the earthquake occurrences in a location, an assumption for probabilistic assessment is a linear relationship between magnitude and frequency that may be obtained as a function of magnitude (Belazougui et al., 2004; Boylu, 2005; Glaser et al., 2007; Lia et al., 2014). Recent earthquake data were taken into account to determine the probabilistic seismic hazard between 1973 and 2016. Establishing return periods and probabilities of earthquake occurrences in the regions that have high seismic risk is important endeavors to construct high strengthen buildings. Researchers use various statistical methods to determine seismic risk and to estimate the probabilities of earthquake occurrence, but the Poisson model is the most common method mostly to expose potential seismic risks due to its accepted accurate results in terms of probability of failure. Among the data for Poisson modeling is magnitude which clarifies the effects of an earthquake for determining seismic risk.
This study applies the Poisson model estimation and earthquakes between 1973 and 2016 that provides data for the methodology. In total, data from 900 earthquakes were taken into account. In Table 2, seismic risk values for selected earthquakes are given. In Table 3, probability values using the Poisson model for different periods are given. Figure 6 defines the cumulative distribution and total distribution diagrams. As seen in Figure 6, magnitudes in between 4 and 6 have the highest frequency, while magnitudes in between 7 and 9 have the lowest frequency. In the cumulative perspective, magnitudes between 4 and 6 constitute 60% of the all seismic activity. Detailed figures for probability definition appear in Tables 2 and 3.
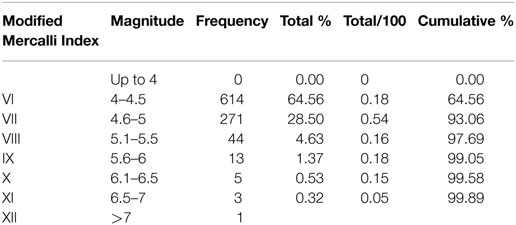
Table 2. Calculated seismic values.
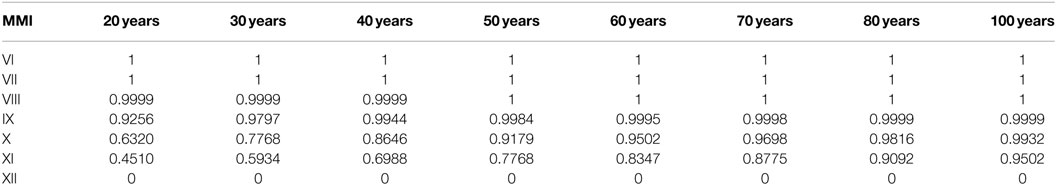
Table 3. Probability values with the Poisson model for different time periods in Modified Mercalli Index (MMI).
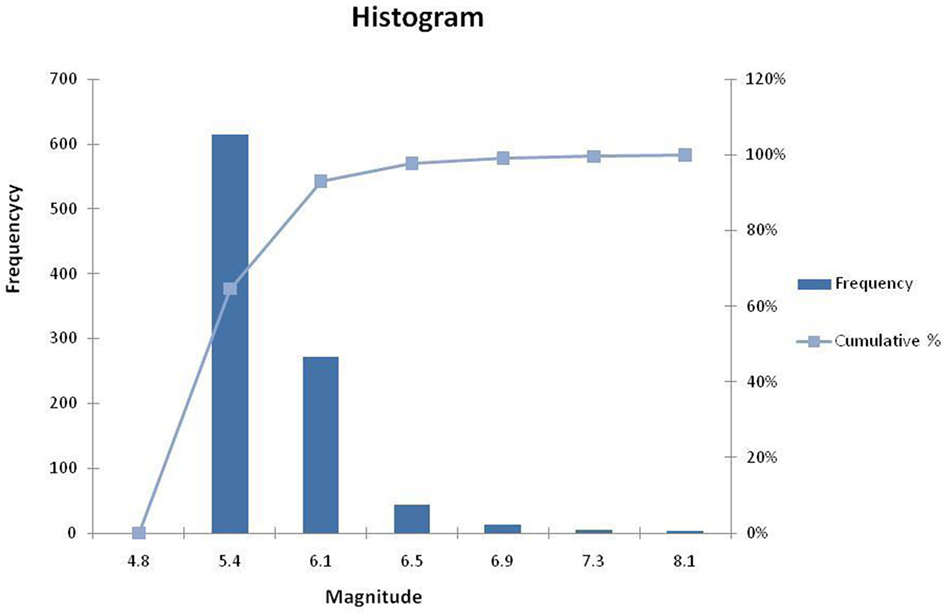
Figure 6. Cumulative and total distribution diagram.
Figure 7, sketched with the Poisson model, represents the probability surface which gives earthquake occurrence probabilities for different time periods in continuous transactions. Probability surface was defined with probability of failure, Modified Mercalli Index, and years. The earthquake occurrence probability curves in the assessment process for 20, 30, 40, 50, 60, and 80 years are given in this study.
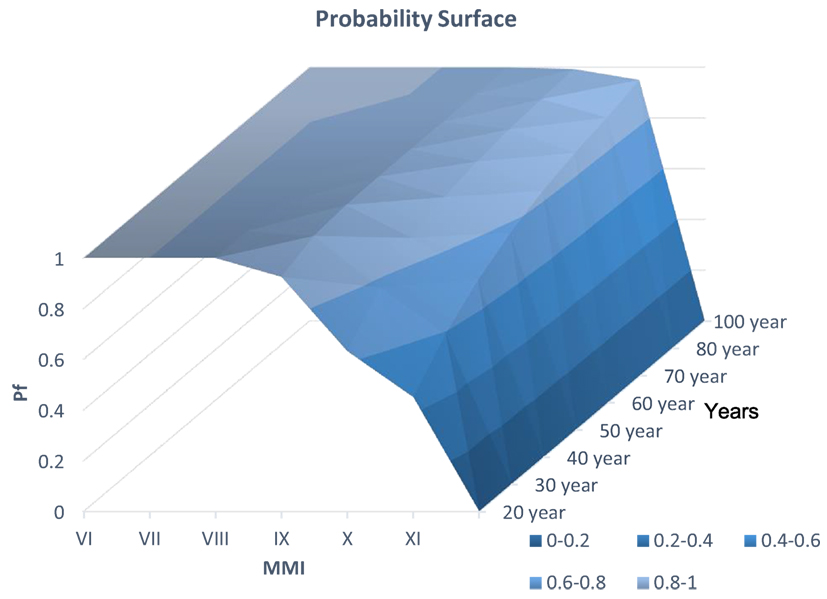
Figure 7. Earthquake occurrence probabilities for different time periods using the Poisson model.
Based on this assumption, for the earthquake occurrences, Poisson distribution is determined for given case. The cumulative frequency distribution is the probability of occurrence of N or fewer earthquake considerations in a period, t is given in Eq. 1 (Feller, 1968):
where λ is the frequency.
In particular, the probability of number of earthquakes in a period, t, is:
Times between earthquake occurrences show a negative distribution. Thus, the probability of a time period given between two earthquake considerations in (t, t + dt) will be calculated as:
The probability of earthquake occurrences, F(t), can be expressed as 1 − p (0; λt):
In given case, for magnitude of M1, the probabilities of failure (Pf) in t years can be directly calculated with as given in Eq. 5 (Tabban and Gencoglu, 1975; Tuksal, 1976):
where n(M) is the annual numbers of magnitude of M1 and greater earthquakes. The return periods for the considered earthquakes in the analysis can be obtained as given in Eq. 6:
Risk Assessment and Mitigation
Representative Buildings
In this study, for an efficient risk assessment and mitigation, structural health monitoring approaches have been adopted (Li et al., 2015). Risk assessment and mitigation approach have been applied on chosen types of low- to mid-rise R/C buildings. The chosen buildings represent the typical structures that dominate the building inventory in the seismically active regions in China. The representative buildings are 4-, 6-, and 8-story buildings. For the investigation, these buildings are frame with infill walls and frame with soft-story effect. For analyses, six different models were designed with intentionally weak materials to mirror the real buildings in the region. Chinese Code for Seismic Design of Buildings GB50011-2010 was taken into consideration as basis for the design of the buildings. Concrete strength of the models is C16, and steel is S220. For 4-story models, 1 and 2, column dimensions are 50 cm × 50 cm and beam dimensions are 25 cm × 50 cm. For 6-story models, 3 and 4, column dimensions are 50 cm × 50 cm and beam dimensions are 30 cm × 60 cm. For 8-story models, 5 and 6, column dimensions are 60 cm × 60 cm and beam dimensions are 30 cm × 60 cm. Layout, size, and reinforcing details for the beams and columns are repeated at each story. The longitudinal reinforcement ratio in the columns is 1%. For reinforcement, S220 (fy = 220 MPa) steel was used. Concrete design strength fc′ was taken as 16 MPa (approximately 2/3 of the Chinese Design Code required level) based on field data obtained from existing buildings. According to field observations, the column confinement region details were not a frequent practice, and the column middle region transverse reinforcement details are used through the height of the columns. Therefore, the transverse reinforcement in the columns was taken as 8 mm-diameter hoops with 20 cm spacing, i.e., typical column middle region reinforcing detail per the design code, throughout the height of the columns. Figure 8 shows the elevation views of the selected model buildings.
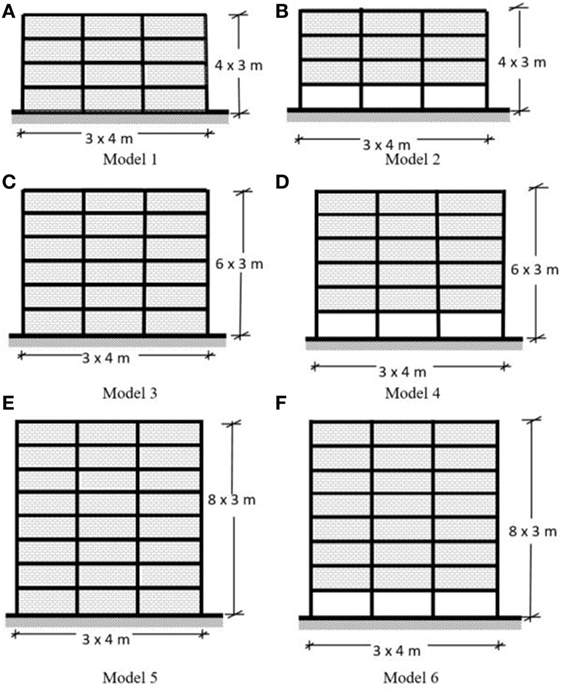
Figure 8. Model representative buildings, (A) Model 1, (B) Model 2, (C) Model 3, (D) Model 4, (E) Model 5, (F) Model 6.
Non-Linear Structural Analysis
Non-linear structural analysis is the method for determining the earthquake behavior of structural systems. This method has a varying methodology with non-linear static pushover and dynamic time history analysis. Non-linear dynamic time history analysis is one of the most reliable methodologies, but it is very complex and time consuming (ATC, 1996; FEMA-356, 2000; Federal Emergency Management Agency, 2005).
Non-linear static pushover analysis becomes more efficient and common in recent years. FEMA and ATC also suggest carrying out the non-linear static pushover analysis for assessment (ATC, 1996; FEMA-356, 2000; Federal Emergency Management Agency, 2005). Non-linear static pushover analysis determines structural earthquake behavior as the base shear versus roof displacement relationship. The models were prepared by using the SAP2000 program (Wilson and Habibullah, 1998). Non-linear static pushover analysis’ basis is the lateral forces–displacement relationship, which shows capacity of the structure under lateral forces, with materially and geometrically non-linear structural theory. Plastic hinge theory is applied to define non-linear behavior of structural materials. In this theory, plastic deformations are lumped at plastic hinges. At other sections, material behavior is accepted as linear elastic. The assumption is that plastic behavior has a one-dimension bending moment for beams, and a two-dimension bending moment and axial force interaction for columns.
Flexural elements for beams, beam-column elements for columns, strut elements for infill walls, and rigid diaphragms for floors were employed for modeling the structural components of the buildings. Non-linear flexural characteristics of the individual frame members were defined by moment rotation relationships of plastic hinges assigned at the member ends. Flexural moment capacities were based on the section and material properties of members. Moment rotation relationship for frame members is demonstrated in Figure 9 (Hanoglu, 2002).
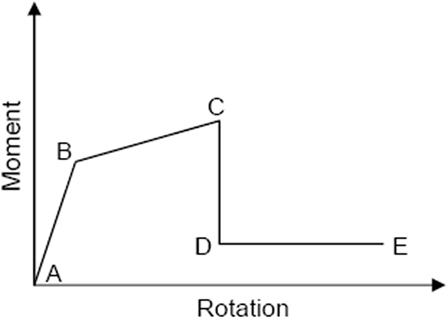
Figure 9. Idealized moment relationship of a frame member-end (Hanoglu, 2002).
Walls were modeled with equivalent diagonal bars as shown in Figure 10. N − Δp relationship of equivalent bars is given in Figure 10 (Hanoglu, 2002). In the analysis, elasticity modulus of walls is 6,000 MPa. Diagonal bar band length can be defined according to FEMA 356 as given in the Eqs 7 and 8 (Federal Emergency Management Agency, 2005):
where hcol and hinf are the height of column and infill wall, respectively. Efe and Eme are frame and infill wall materials’ elasticity moduli, respectively. Icol is column moment of inertia Linf is wall length, rinf is wall diagonal length, tinf is thickness of wall, and λ1 is coefficient for calculation of band length of equivalent bar. θ is equivalent bar angle with x axis (FEMA-356, 2000).
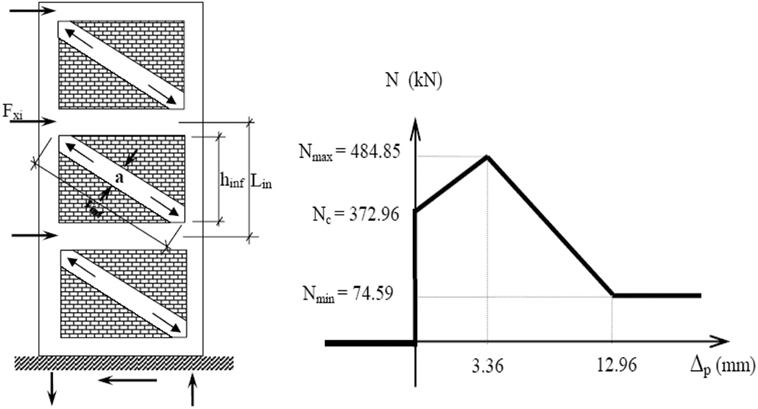
Figure 10. Modeling and N − Δp relationship of infill walls (Hanoglu, 2002).
Performance Evaluation
The performance of the sample structures was estimated by using non-linear analyses. The non-linear force–displacement relationship between base shear and roof displacement was considered. In the analyses, the capacity curves of the models were sketched. Figure 11 shows force–displacement curves obtained through pushover analyses for the reviewed buildings, and Figure 12 provides a comparison. According to Figure 12, Model 1 has the highest Vt/W ratio, while Model 5 has the lowest. Model 1 is 4-story and has no soft story. Model 6 is 8-story and has a soft story. In terms of ductility, Model 1 has the higher ductility while Model 6 has the lowest. The effect of a soft story on ductility is relatively insignificant. Models without soft stories have higher Vt/W ratios. Soft stories cause a significant behavior change. Common soft-story applications appear to cause damage in existing buildings.
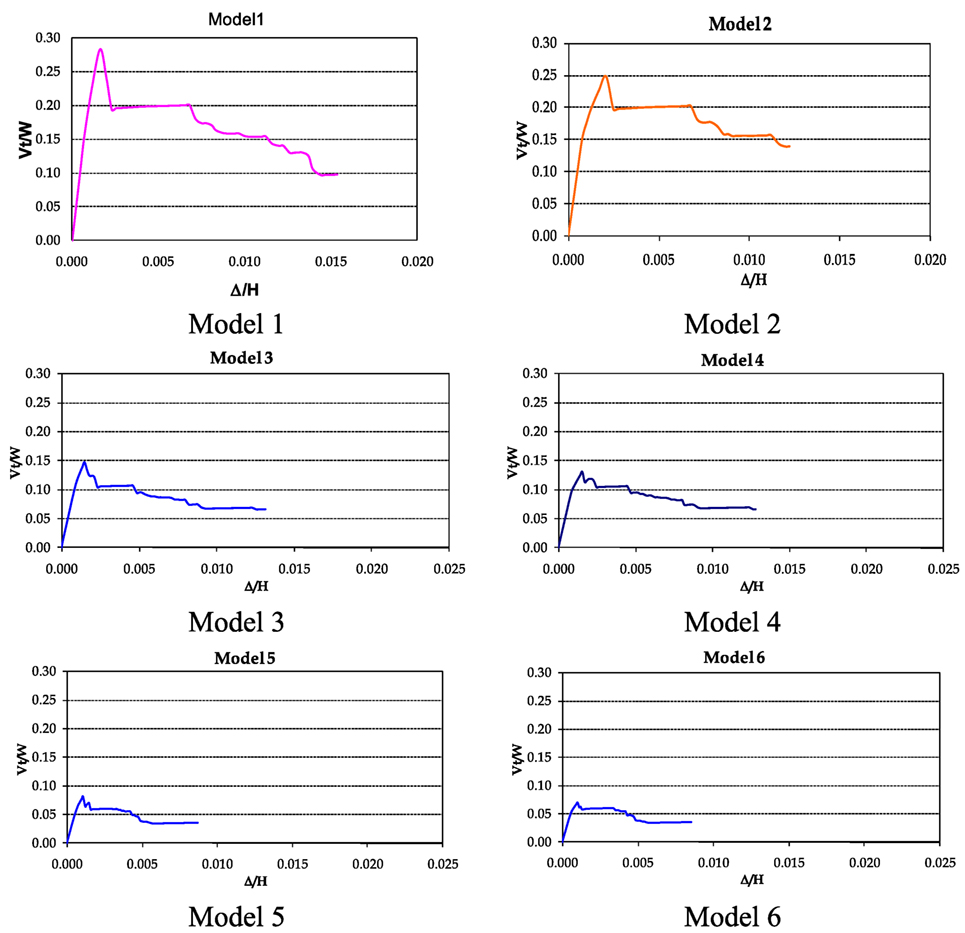
Figure 11. Force–displacement curves obtained through pushover analyses for the sample buildings.
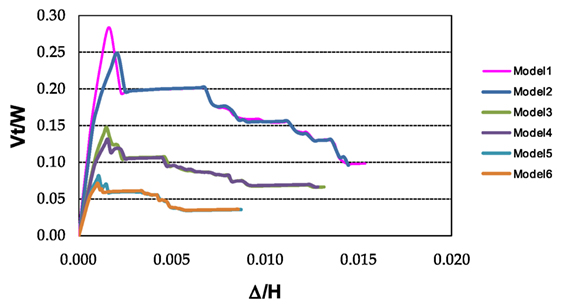
Figure 12. Comparison of force–displacement curves.
Lessons Learnt from Recent Earthquakes
As defined in performance evaluation of the investigated RC buildings, properly designed and constructed RC buildings meet performance requirements. Considering the level of recent earthquakes in China, construction becomes a more important phase for earthquake resistant buildings. Damages and collapses are not due to major structural deficiencies from the design stage. The main reasons of the damage are poor workmanship and material quality, as well as inadequate reinforcement. Therefore, existing RC buildings are in risk of heavy damage or collapse, in possible future earthquakes. Construction characteristics, such as project errors, poor quality construction and workmanship, and modifications to the buildings, are the main concerns that need extra-precaution in China.
Conclusion
This study presents a detailed seismic safety and risk assessment for low- to mid-rise residential buildings in China for structural risk control and integrated health monitoring and assesses the reasons structural damage and collapse occurred in the recent earthquakes. In the probabilistic seismic risk assessment part, risk was considered in terms of probabilistic evaluation. Earthquake occurrence probabilities by using the Poisson model were sketched. Various earthquake magnitudes were considered for the analyses. Earthquake performance of typical low- to mid-rise RC residential buildings was investigated using non-linear approaches. Definition of structural behavior of existing buildings is very important for mitigating the consequences of a future earthquake. New buildings depend on many different parameters which are, reasonably, mostly construction and architectural requirements. Soft stories are one of reasons for damage in earthquakes. Consequently, avoiding the soft stories in buildings would be an important step of assuring safer buildings against to earthquakes.
Author Contributions
KK is the only author in this article. He carried out the research for this research.
Conflict of Interest Statement
The author declares that the research was conducted in the absence of any commercial or financial relationships that could be construed as a potential conflict of interest.
References
ABS. (2008). Technical Report on Wechuan Earthquake: Wenchuan Earthquake Report China. Sichuan Prefecture: ABS Consulting.
Akason, J. B., Olafsson, S., and Sigbjornsson, R. (2006). Perception and observation of residential safety during earthquake exposure: a case study. Saf. Sci. 44, 919–933. doi:10.1016/j.ssci.2006.06.003
ATC. (1996). Seismic Evaluation and Retrofit of Concrete Buildings. ATC 40, Vol. 1. Washington, DC, USA: Applied Technology Council.
Belazougui, M., Farsi, M., and Remas, A. (2004). Seismic risk assessment of current buildings of Algiers city. Paper Presented at 13th World Conference on Earthquake Engineering, Vancouver, Canada.
Boylu, M. (2005). A Benefit/Cost Analysis for the Seismic Rehabilitation of Existing Reinforced Concrete Buildings in Izmir. MS thesis, IzTech Institute, Izmir, Turkey.
Burchfiel, B. C., Royden, L. H., van der Hilst, R. D., Hager, B. H., Chen, Z., King, R. W., et al. (2008). A Geological and Geophysical Context for the Wenchuan Earthquake of 12 May 2008, Vol. 18, Issue 7. Sichuan, People’s Republic of China: GSA Today.
Chen, K., and Somerville, P. (2008). Earthquake in Sichuan Province, China, Risk Frontiers. Sydney, Australia: Macquarie University.
Cui, P., Chen, X. Q., Zhu, Y. Y., Su, F. H., Wei, F. Q., Han, Y. S., et al. (2011). The Wenchuan earthquake (May 12, 2008), Sichuan Province, China, and resulting geohazards. Nat. Hazards 56, 19–36. doi:10.1007/s11069-009-9392-1
EERI (Earthquake Engineering Research Institute). (2008). Special Earthquake Report, Learning from Earthquakes the Wenchuan. Sichuan Province, China. Earthquake of May 12, 2008.
Federal Emergency Management Agency. (2005). Recommended Provisions for the Development of Seismic Regulations for New Buildings and Other Structures, FEMA-440. Washington: ABD.
Feller, W. (1968). An Introduction to Probability Theory and Its Applications, Vol. I. USA: John Wiley & Sons, 156–159.
FEMA-356. (2000). Prestandart and Commentary for the Seismic Rehabilitation of Buildings. Washington, DC: Federal Emergency Management Agency.
Fiedrich, F., Gehbauer, F., and Rickers, U. (2000). Optimized resource allocation for emergency response after earthquake disasters. Saf. Sci. 35, 41–57. doi:10.1016/S0925-7535(00)00021-7
GB 50011-2001. (2001). Code for Seismic Design of Buildings. Beijing: The Construction Ministry of P. R. China and National Bureau for Quality Supervision, Inspection and Quarantine.
GB 50011-2002. (2002). Code for Design of Concrete Structures. Beijing: The Construction Ministry of P. R. China and National Bureau for Quality Supervision, Inspection and Quarantine.
Gbj11-1989. (1989). Code for Seismic Design of Buildings. Beijing: The Construction Ministry of P. R. China and National Bureau for Quality Supervision, Inspection and Quarantine.
Glaser, S. D., Li, H., Ou, J., and Lynch, J. (2007). Sensor technology innovation for the advancement of structural health monitoring: a strategic program of US-China research for the next decade. Smart Struct. Syst. 3, 221–244. doi:10.12989/sss.2007.3.2.221
Gu, C., Kesteloot, C., and Cook, I. G. (2015). Theorising Chinese urbanisation: a multi-layered perspective. Urban Stud. 52, 2564–2580. doi:10.1177/0042098014550457
Guo-hua, C., Tao, L., and Hua-wen, Z. (2009). Study on the methodology for evaluating urban and regional disaster carrying capacity and its application. Saf. Sci. 47, 50–58. doi:10.1016/j.ssci.2007.12.002
Hanoglu, K. B. (2002). Fiber Reinforced Plastic Overlay Retrofit of Hollow Clay Tile Masonry Infilled Reinforced Concrete Frames. Ph.D. dissertation, Bogazici University, Istanbul, Turkey.
Huang, R. (2008). Presentation on the Work of the State Key Lab for Geohazard Prevention following the Wenchuan Earthquake. Sichuan: Chengdu University of Technology.
Li, H., Ou, J., Zhang, X., Pei, M., and Li, N. (2015). Research and practice of health monitoring for long-span bridges in the mainland of China. Smart Struct. Syst. 15, 555. doi:10.12989/sss.2015.15.3.555
Lia, X., Yang, F., Zhub, Y., and Gao, Y. (2014). An assessment framework for analyzing the embodied carbon impacts of residential buildings in China. Energy Build. 85, 400–409. doi:10.1016/j.enbuild.2014.09.051
Marcuson, W. F., Beroza, G. C., Bielak, J., Desroches, R., Gath, E. M., Hanson, R. D., et al. (eds) (2003). Preventing Earthquake Disasters: The Grand Challenge in Earthquake Engineering. Washington, DC: National Research Council, the National Academies Press.
Miyamoto, H. K. (2008). Earthquake Field Investigation Report, M8 Sichuan China Earthquake, Global Risk, Beijing.
OCHA. (2008). OCHA Situation Report No. 5. Sichuan Province: United Nations Office for the Coordination of Humanitarian Affairs.
Ou, J., and Li, H. (2010). Structural health monitoring in mainland China: review and future trends. Struct. Health Monit. 9, 219–231. doi:10.1177/1475921710365269
Park, Y., Ang, A., and Wen, Y. (1985). Seismic damage analysis of reinforced concrete buildings. J. Struct. Eng. 4, 740–757. doi:10.1061/(ASCE)0733-9445(1985)111:4(740)
Perlstein, A., and Ortolano, L. (2015). Urban growth in China, evolution in the role of urban planners. J. Plan. Educ. Res. 35, 4435–4443. doi:10.1177/0739456X15586627
Solomon, K. A., Kastenberg, W. E., and Nelson, P. (1983). Dealing with Uncertainty Arising Out of Probabilistic Risk Assessment. Oak Ridge: Rand Publications Series. Prepared for Oak Ridge National Laboratory (R-3045ORNL).
Tabban, A., and Gencoglu, S. (1975). Earthquake and its parameters. Bulletin of Earthquake Research Institute, Vol. 11. 7–83.
Tansel, B. (1995). Natural and manmade disasters: accepting and managing risks. Saf. Sci. 20, 91–99. doi:10.1016/0925-7535(94)00070-J
Tuksal, I. (1976). Seismicity of the North Anatolian Fault System in the Domain of Space, Time and Magnitude. M.S. thesis, Saint-Louis University, Saint-Louis, MO.
USGS. (2010). USGS Sichuan Earthquake Information Web Page. Available at: http://earthquake.usgs.gov/
Wilson, E., and Habibullah, A. (1998). SAP 2000 Integrated Finite Element Analysis and Design of Structures Basic Analysis Reference Manual. Berkeley, USA: Computers and Structures.
Worldmapper. (2016). Worldmapper Gridded Population Cartograms. Available at: http://www.worldmapper.org/
Wu, D., and Olson, D. L. (2009). Introduction to the special section on “Optimizing Risk Management: Methods and Tools”. Hum. Ecol. Risk Assess. 15, 220–226. doi:10.1080/10807030902760967
Yongshuang, Z., Jiagui, Z., Weizhi, J., Jusong, S., Xianli, W., and Tanyu, X. (2007). Discussion on environmental geological problems in the areas from Southwest China to Southeast Asia. Earth Sci. Front. 14, 24–30. doi:10.1016/S1872-5791(08)60002-0
Keywords: Chinese earthquakes, structural risk assessment, low- to mid-rise residential buildings in China, probabilistic risk assessment, mitigation
Citation: Korkmaz KA (2017) Structural Risk Assessment and Mitigation for Low- to Mid-Rise Residential Buildings in China. Front. Built Environ. 3:37. doi: 10.3389/fbuil.2017.00037
Received: 25 January 2017; Accepted: 21 June 2017;
Published: 25 July 2017
Edited by:
Mario De Stefano, University of Florence, ItalyReviewed by:
Johnny Ho, The University of Queensland, AustraliaDionysis Biskinis, University of Patras, Greece
Copyright: © 2017 Korkmaz. This is an open-access article distributed under the terms of the Creative Commons Attribution License (CC BY). The use, distribution or reproduction in other forums is permitted, provided the original author(s) or licensor are credited and that the original publication in this journal is cited, in accordance with accepted academic practice. No use, distribution or reproduction is permitted which does not comply with these terms.
*Correspondence: Kasim A. Korkmaz, kkorkmaz@emich.edu