Hurricane Loss Analysis Based on the Population-Weighted Index
 Grzegorz Kakareko
 Sungmoon Jung
 O. Arda Vanli2
 Omar Khemici
- 1Department of Civil and Environmental Engineering, Florida A&M University – Florida State University College of Engineering, Tallahassee, FL, United States
- 2Department of Industrial and Manufacturing Engineering, Florida A&M University – Florida State University College of Engineering, Tallahassee, FL, United States
- 3CoreLogic, Oakland, CA, United States
This paper discusses different measures for quantifying regional hurricane loss. The main measures used in the past are normalized percentage loss and dollar value loss. In this research, we show that these measures are useful but may not properly reflect the size of the population influenced by hurricanes. A new loss measure is proposed that reflects the hurricane impact on people occupying the structure. For demonstrating the differences among these metrics, regional loss analysis was conducted for Florida. The regional analysis was composed of three modules: the hazard module stochastically modeled the wind occurrence in the region; the vulnerability module utilized vulnerability functions developed in this research to calculate the loss; and the financial module quantified the hurricane loss. In the financial module, we calculated three loss metrics for certain region. The first metric is the average annual loss (AAL) which represents the expected loss per year in percentage. The second is the average annual dollar loss which represents the expected dollar amount loss per year. The third is the average annual population-weighted loss (AAPL)—a new measure proposed in this research. Compared with the AAL, the AAPL reflects the number of people influenced by the hurricane. The advantages of the AAPL are illustrated using three different analysis examples: (1) conventional regional loss analysis, (2) mitigation potential analysis, and (3) forecasted future loss analysis due to the change in population.
Introduction
Florida has a large number of residential homes at risk of hurricanes (Hayes and Guyton, 2016). Among the 10 most costly hurricanes in the United States history, 7 occurred in Florida (Pielke and Landsea, 1998; Blake et al., 2007) ranking the state as the most exposed to high winds. Moreover, the population of Florida is continuously increasing, exposing more and more people to the hurricane. The goal of this paper is to investigate a new loss measure that considers the population aspect, to use in regional loss analysis.
The regional loss analysis is a multi-disciplinary research problem involving meteorology, statistics, civil engineering, and computer science (Simmons et al., 2002; Pinelli et al., 2004; Watson and Johnson, 2004a; Hamid et al., 2010). Grayson et al. (2013) proposed a new regional model with better quantification of the damage caused by debris from surrounding buildings. Yau et al. (2010) delivered an integrated model to estimate the structural damage and economic loss. Some researchers forecasted the future loss due to change in the building stock (Jain et al., 2005; Jain and Davidson, 2007) or the wind speed adjustment produced by climate change (Huang et al., 2001; Bjarnadottir et al., 2011). Li and Ellingwood (2009) and Li (2010) discussed the total loss that can be caused by multiple natural hazards in some regions.
Hurricane Andrew hit Florida in August 1992 and was the most destructive hurricane in the United States history (Blake et al., 2007) for two main reasons. The first was the strength of the hurricane (category 5 in Saffir–Simpson scale). The second was lower standards of Florida building code (e.g., toe-nails as roof-to-wall connections). The authorities of Florida after the Hurricane Andrew upgraded the building code to decrease the future hurricane loss (Rosowsky and Schiff, 2003). Severe damage caused by hurricanes was a motivation for many studies on mitigation (Applied Research Associates, 2002a,b, 2008; Stewart et al., 2003; Pinelli et al., 2009; Unnikrishnan and Barbato, 2016).
The Florida Commission on Hurricane Loss Projection Methodology published hurricane regional loss prediction models developed by private companies or research institutes. The most popular models are the Florida Public Hurricane Loss Model (FPHLM, 2015), and models developed by AIR Worldwide Corporation (AIR WORLDWIDE, 2015), Applied Research Associates (Applied Research Associates and Division, 2015), CoreLogic EQECAT (2015), and Risk Management Solutions (RiskLink 15.0, 2015). Watson et al. (2004b) compared some of these models and showed their advantages and disadvantages.
Researchers have used normalized loss value or the dollar value to quantify the financial loss due to the hurricane (Changnon, 2003; Cutter and Emrich, 2005; Powell et al., 2005; Pielke et al., 2008). In this study, we discuss these measures and show that in some cases they may be misleading. A new metric is proposed that reflects the impact of the hurricane on the population. The advantages and disadvantages of different loss measures are discussed using the loss analysis of Florida along with mitigation potential analysis. Population in the Florida has been consistently increasing in recent years. To address the problem of population influx, we forecast the future loss due to the population change in the last section of the paper.
Regional Loss Methodology
Vulnerability Estimation
The most common way for estimating the loss to single family homes caused by natural hazards is by using vulnerability functions. The vulnerability function takes wind speed as an input and produces a damage ratio, which is defined as a ratio of the repair cost of damage over the total replacement cost of the house. Following the state-of-the-art reviews (Walker, 2011; Pita et al., 2014), vulnerability estimation can be classified into two categories.
The first category is function approximation based on past insurance claims data (Leicester and Reardon, 1976; Friedman, 1984; Sparks et al., 1994). The biggest disadvantage of functions developed by this method is a generalization of all houses without considering structural differences. In addition, those functions may become obsolete as building code and materials change over time.
The second category is an engineering approach. Based on the characterization of the house structure such as house geometry, location of the house, and capacities of components (e.g., roof cover, roof-to-wall connection, roof sheathing, windows, doors, walls sheathing), a computational model is developed to simulate the loss. Many studies have been conducted to improve the engineering approach. Some of the key studies are briefly summarized. Vickery et al. (2006a) and Vickery et al. (2006b) described the overall algorithms based on different damage states, which are used in Hazus (HAZUS MHMR, 2003). Gurley et al. (2005) developed the Florida Public Hurricane Loss Projection Model, which answered many questions on the subject of engineering-based vulnerability estimation. Pinelli et al. (2011) specified the importance of different house components in loss estimation. Pita et al. (2013) underlined the importance of utilizing geographic information systems for loss predictions. Ellingwood et al. (2004) and Li and Ellingwood (2006) developed fragility functions of house components.
In this research, we followed the engineering approach for vulnerability estimation. A Matlab program was developed, pursuing the overall algorithm described in Figure 1. The input values of the program were the house characteristics (house dimensions, type of roof, site location, surrounding environment) and capacities of house components (windows, doors, garage door, roof cover, roof sheeting, roof-to-wall connections, walls). The capacities of all house components were adopted from the work of previous researchers or experimental studies. To describe the uncertainties in components, the capacities were randomly generated based on statistical distributions. A particular element was marked as damaged when the load exceeded the capacity of the element.
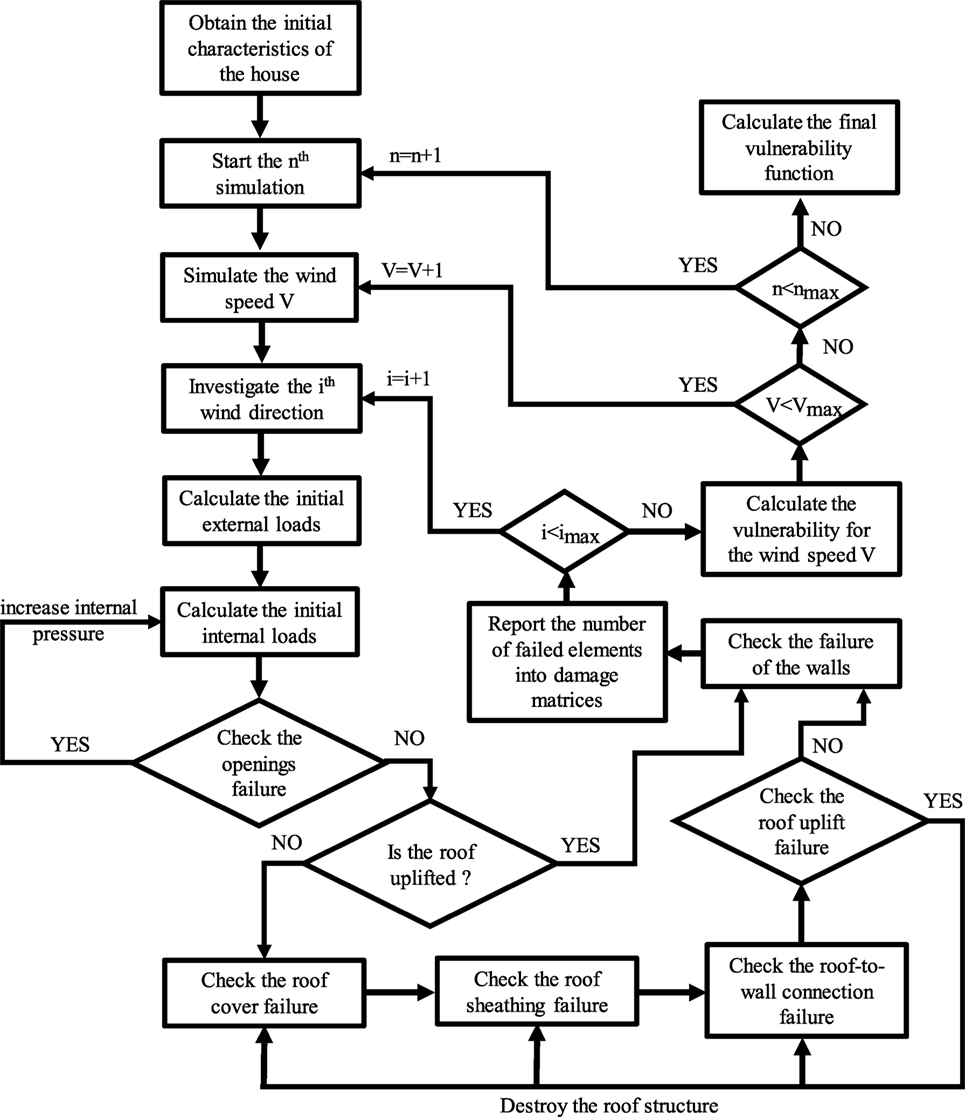
Figure 1. The algorithm of the vulnerability estimation.
The Monte Carlo simulations were repeated m times, where value of m was determined as 10,000 by a convergence test. For every simulation, the wind speed was generated from 0 to 120 m/s with an increment of 1 m/s. In order to convert the wind speed into the loads that act on the house, formulas from ASCE 7 (2010) were utilized.
The wind pressure is characterized by Eq. 1:
where qh is velocity pressure evaluated at the mean roof height of the building, G is the gust-effect factor, Cp is the external pressure coefficient, and GCpi is a product of the gust-effect factor and internal pressure coefficient. The velocity pressure is calculated by Eq. 2:
where Kh is the velocity pressure exposure coefficient, Kzt is the topographic factor, and V[m/s] is the wind speed. For the particular wind speed, the eight directions of the wind were considered following the approach from Cope (2004) and Gurley et al. (2005). We assumed the same probability of the wind from all of the directions.
As the first of the vulnerability estimation, we checked the opening failure mode for all windows, garage doors, and doors. The windows have two failure modes: one is a failure by pressure, and the other is a failure by debris impact (Gurley et al., 2005) (Eq. 3):
where pD(V) is the probability of impact, A is a fraction of missile objects, NA is a total number of missile objects, B is the number of the objects that are currently in the air, C is a fraction of the unprotected windows in the wall, and D is the probability if described object destroys the window.
The failure of the openings may allow the wind to penetrate the interior of the house and produce the additional internal pressure. Internal pressure was increased if Eq. 4 was satisfied, by changing the category of the building from enclosed to partially enclosed:
where Ao is the total area of openings in the wall that receives positive external pressure, Aoi is the sum of the areas of openings in the building envelope excluding Ao.
The second house element checked was the roof structure, which is composed of the roof cover, roof sheathing, and roof-to-wall connection. The roof cover is the main barrier preventing water penetration. Water penetration is the main reason for the internal loss—a significant part of the total loss. For internal loss calculation, the approach from Holmes (1999) was utilized. The roof sheathing and the roof cover have one failure mode, which is a failure by pull out. If the roof sheathing panel is damaged, the corresponding roof cover was assumed as damaged. The last, but the most crucial element of the roof structure, is the roof-to-wall connection. The price of roof-to-wall connection is relatively low compared with other components, but it has a crucial role in the overall capacity of the roof structure. After the failure of a particular roof-to-wall connection, the force from this connection was redistributed to the remaining roof-to-wall connections of the same roof area. After ensuring the roof-to-wall connection, the program checks the roof uplift using Eq. 5. If the roof is uplifted, it is assumed that the whole roof structure (the roof cover, the roof sheathing, and the roof-to-wall connection) is destroyed:
where R is the sum of the capacity of the roof-to-wall connections that have not failed, W is uplift wind load, and D is the dead load. Larger dead load values have beneficial effect on the overall roof capacity.
The last step of the loss analysis is the analysis of walls. Walls have three failure modes, namely, sheathing failure, lateral failure (Cope, 2004), and foundation failure due to the shear force. The first mode is progressive whereas the second and third modes are abrupt. The second and third modes destroy the whole house structure.
After all elements were checked, the damage was assigned into the damage matrices. Based on the damage matrices and replacement costs of failed components (Means, 2015), the vulnerability at a particular wind speed was calculated.
Florida Regional Analysis
The loss analysis was performed in collaboration with CoreLogic company, which developed a fully validated software for loss estimation. The methodology used in the regional loss analysis follows CoreLogic EQECAT (2015). Figure 2 shows the overall algorithm that was applied to the regional loss estimation. The methodology can be categorized into three modules: the hazard module, the vulnerability module, and the financial module.
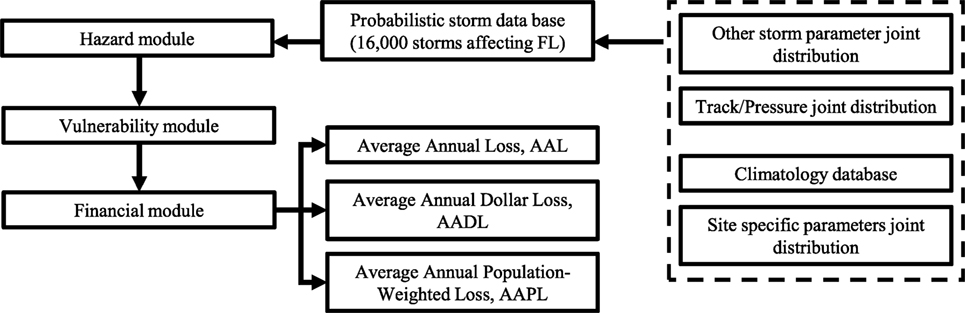
Figure 2. The methodology for regional loss estimation.
The first module named as the hazard module estimates the wind speed at all property locations, defined by their latitude and longitude coordinates or street addresses. The storm database used in this research includes a combination of the historical and stochastic storms combining overall 16,000 high wind speed events that affect Florida. Based on the data from National Hurricane Center HURDAT2, we were able to calculate the storm intensity approximated from the coastline dependent smoothed hurricane landfall maximum wind speed distributions (Ho et al., 1987).
The synthetic hurricanes were calculated following the algorithm from Batts et al. (1980) and Vickery and Twisdale (1995). The central pressure difference (Eq. 6) was the main factor in determining the radius of maximum wind speeds for the high wind speed event (Krayer and Marshall, 1992):
where a is a filling constant, Δp0 is a central pressure difference at the time of landfall.
The maximum gradient wind speed (Eq. 7) and the maximum 10 min wind speed at the height of 10 m above the ocean (Eq. 8) were calculated to estimate the 10 min wind speed over the ocean at any point in the hurricane (Eq. 9):
where K is a constant, Δp central pressure difference. Rmax is the radial distance from the center of the storm to the location where the maximum wind speeds occur, and f is a Coriolis parameter:
where c is the translation speed of the hurricane:
where Vr(r) is a ratio of maximum 10 min wind speed at the radius of maximum winds to the 10 min mean at a distance r from the center of circulation (Batts et al., 1980).
The model computes wind speeds using the storm’s maximum sustained wind speed, the filling rate, the radius of maximum winds, the storm track, the translation speed, the gust factor, the storm profile (attenuation of wind speed outward from the center), and the friction caused by local terrain and man-made structures. The model used in this research addresses the loss estimates for wind effects only. Storm surge losses are outside the scope of this research. The model used in this research addresses the loss estimates for wind effects only. Storm surge losses were not included but follow the similar methodology. The examination of climate change in future hurricane activities were outside scope of this research and were not included during simulating future hurricanes. Liu (2014) developed a database of synthetic hurricanes that carry the effect of the surface temperature and annual frequency change, which can be addressed in the future study.
The second module titled as the vulnerability module provides damage estimates for each of the property assets being analyzed during the hurricane event. The vulnerability functions used in this research were delivered based on the engineering approach and were explained more thoroughly in Section “Vulnerability Estimation.”
The last module, called the financial module, calculates the loss using vulnerability functions associated with the structures. In this research, we calculated three different loss metrics. Details of these metrics will be explained in the next section.
Comparison of Different Measures of Regional Loss
Regional Loss Measures
In this research, we compare three different loss metrics using the regional loss analysis of Florida counties. The first metric is the average annual loss (AAL) (%), described by Eq. 10. AAL represents the expected loss ratio per year. The dollar loss of the region is normalized by the total replacement value of all houses in the region (only the building value without the price of the lot):
where M is the number of events in the time period Δt (in the current research we assumed Δt = 113 years from 1900 to 2013); and is the percentage event loss caused by ith event (Eq. 11):
where K is the number of locations in the considered region (in this research region = a county); Vij is the maximum wind speed observed at the jth location during the ith event; and Lj(Vij) is the percentage loss obtained from the particular vulnerability function.
The second loss metric is the average annual dollar loss (AADL) ($) characterized by Eq. 12. AADL represents the expected dollar amount loss per year, i.e., the dollar loss of all structures in the investigated region:
where is the dollar event loss in the considered region:
where Hj is the price of the property at the jth location (without price of the lot).
The last loss metric is the average annual population-weighted loss AAPL (people) defined in Eq. 14, which is a new measure proposed in this research. The population-weight reflects the number of people influenced by the hurricane. As an example, consider two different counties with identical AAL. With AAL alone, the two counties appear to have the same level of risks against hurricanes. However, if one county has a lot more population than the other, a measure needs to reflect this difference in population:
where is the population event loss in the considered region:
where Pj is the exposed population at the jth location (number of people occupying the examined structure).
Vulnerability Analysis of the Residential Structures Built before Hurricane Andrew
To illustrate the differences among loss metrics, an example loss analysis was conducted. The first step was to construct vulnerability functions. We chose a low-rise wood residential structure with gable roof built before hurricane Andrew (built before 1992). The geometry of the investigated house was chosen in a way to represent the highest percentage of existing structures in Florida. The following dimensions have been utilized: overhang = 0.61 m (2 ft), length = 18.29 m (60 ft), width = 11.58 m (38 ft), walls height = 3.05 m (10 ft), roof height = 4.14 m (13.6 ft), roof angle = 23°, and truss spacing = 0.61 m (2 ft). This geometry was chosen based on Pinelli et al. (2003), where a significant number of houses were investigated and this structure was identified as the most representative one.
Table 1 shows the capacities of the different house elements used for the vulnerability estimation (see Vulnerability Estimation). The capacities represent the structures built before hurricane Andrew. It should be noticed that those capacities are relatively lower compared with structures built more recently. After hurricane Andrew, the building code in Florida has been changed to decrease the loss from future hurricane events. Since many houses in Florida were built before 1992, this structure still represents the majority of the wood residential structures (Pita et al., 2008).
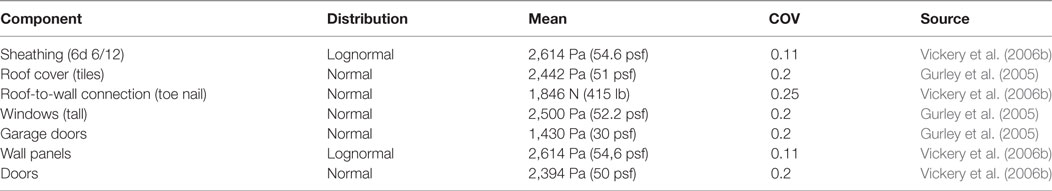
Table 1. Capacity of house components: built before 1992.
Figure 3 describes the vulnerability curve of the house built before hurricane Andrew along with the 0.05 and 0.95 quantiles. Furthermore, Figure 3 includes the vulnerability curve from Hazus (HAZUS MHMR, 2003) as a comparison that is fully validated based on historical loss data.
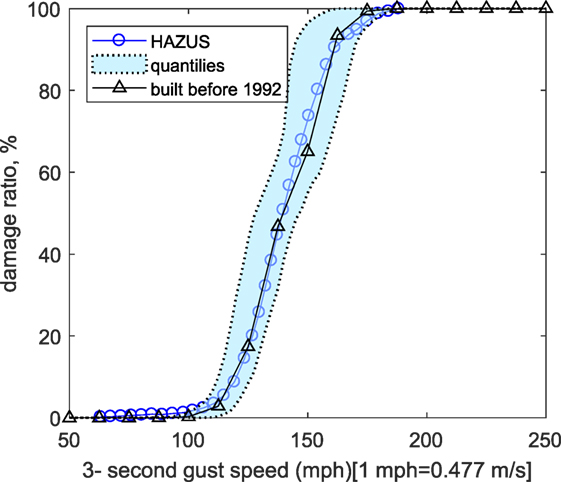
Figure 3. The vulnerability of the house structure built before hurricane Andrew.
Regional Analysis of the Wood Residential Structures Built before Hurricane Andrew
Different loss metrics reveal various aspects of expected loss of the region. The AAL reflects the percentage average loss of structures in the region. This metric depends mainly on two characteristics; the wind probability in the region and the vulnerability of the investigated house structure. The AAL is useful for insurers (or future homeowners) who analyze the expected loss of a certain type of house at a location. On the other hand, the AADL is the sum of the dollar loss of all properties in the region, and therefore will be useful for both insurers and counties or state officials. Comparing with the AAL, the AADL reflects the price of the house and the number of a house structures in the investigated location.
Those two measures are useful and address many relevant issues but in some cases, they may be misleading. The AAL does not reflect the actual price of the house and the number of structures in the region. For example, a county with the highest AAL can produce relatively low AADL: e.g., a county with a small number of structures and low value of properties but exposed to high wind probability. Similarly, the AADL may produce misleading information as well: e.g., a county with the high number of expensive structures that have low AAL. Furthermore, the value of AADL is hard to compare with different states or counties due to the difference in the price of the house and average dollar household income. Moreover, both the AAL and the AADL do not directly reflect the population. These two measures do not address the number of people that are going to be affected by the high wind event.
The AAPL will reveal population aspect of hazard that cannot be directly described by the AAL and the AADL. Unlike the AADL that depends on the price of the house, we can impartially compare AAPL among different states or even among different counties. To demonstrate the need of the new metric proposed in this research, we clustered the loss data into three groups. The groups were chosen based on design wind speed maps from ASCE 7 (2010) (occupancy category II). Groups A, B, and C represent the following wind speed ranges: 120–130, 140–150, and 160–180 mph, respectively.
According to Pita et al. (2009), we were able to calculate the percentage of the investigated structures (low-rise wood residential structure with gable roof built before hurricane Andrew) among all of the residential structures. Based on actual building stock data (U.S. Census Bureau, 2015b), the number of houses, the price of houses (without the price of the lot), and the number of occupants were calculated for each of the investigated regions.
Each mark of Figure 4 represents one county in Florida. It plots the AAL along with the population that occupy the investigated type of structure (wood-frame house built before 1992), for certain county. We were not able to specify the trend function for AAL that would satisfy the two initial constrains. Firstly, for a population size of 0, then AAL is 0. Secondly, the trend line should explain at least 75% of the data around the mean (coefficient of determination >0.75). It is obvious from Figure 4 that the AAL does not reflect the population aspect.
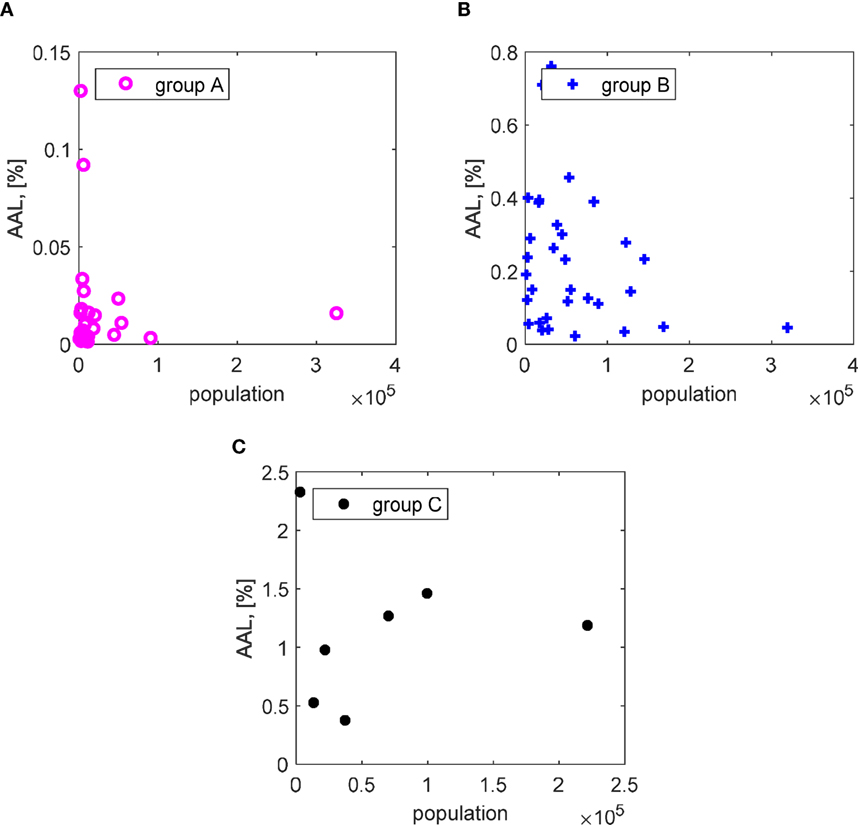
Figure 4. The average annual loss of the structure built before 1992 vs population: (A) Group A (120–130 mph), (B) Group B (140–150 mph), (C) Group C (160–180 mph).
The motivation for the measure proposed in this research was quantification of the hurricane impact on the population. The AAPL not only quantifies the impact on the population but is independent of the price differences of houses between different regions. The AAPL is an attempt to include the best characteristics of the two previous measures, which is descriptive of the loss from particular structure and impact of the loss on the region (subjective in AADP). Figure 5 defines the relationship between the AAPL and the population. The trend among points is more visible compared with Figure 4 and drawn by black dashed line. The main criteria in choosing the trend functions was the smallest coefficient of determination of the functions that satisfy the initial constrains used earlier for Figure 4. We have chosen the linear functions for Figures 5A,C and power function for Figure 5B. The coefficients of determinations exceeded 0.91, 0.78, and 0.97.
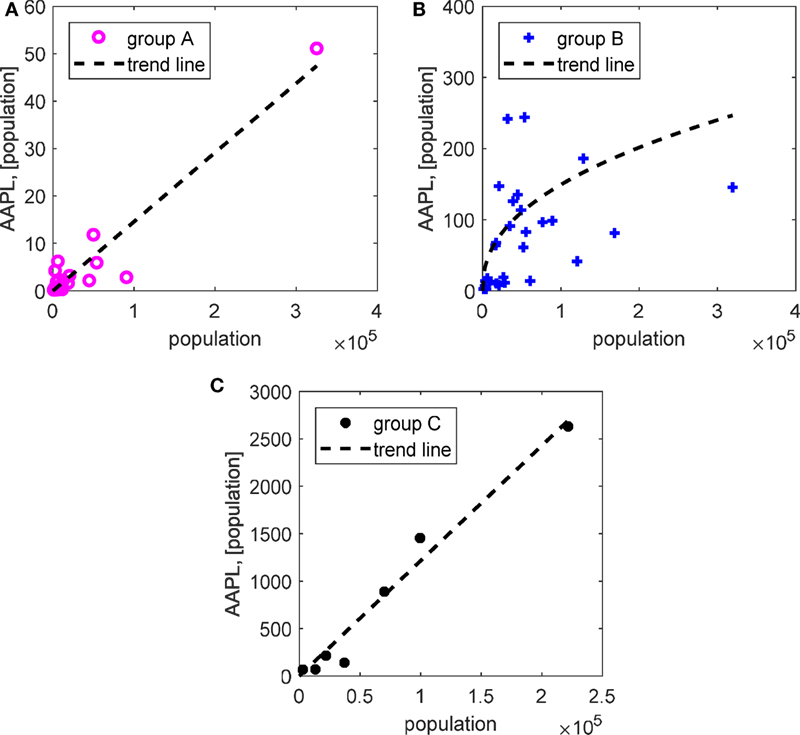
Figure 5. The trend between the AAPL and population (A) Group A, (B) Group B, (C) Group C.
Figure 6 characterizes the differences between the loss measures among the counties in Florida. The three measures show different distribution of losses among counties. Figure 6A (AAL) is useful for insurers (and homeowners) that analyze a certain type of house in a chosen area. The map quantifies possible risk of that type of structure. Figure 6B (AADL) is convenient for insurers or government officials to assess the regions with the highest dollar loss, which may need special attention. Figure 6C (AAPL) describes the measure proposed in this research that assesses the impact of the hurricane on the population. The advantage of the AAPL is a quantification of the hurricane loss on the population rather than on dollar value. Since the exact price approximation is difficult and often impractical, we had to approximate the dollar value for many regions, raising the uncertainties of the dollar loss estimation AADL.
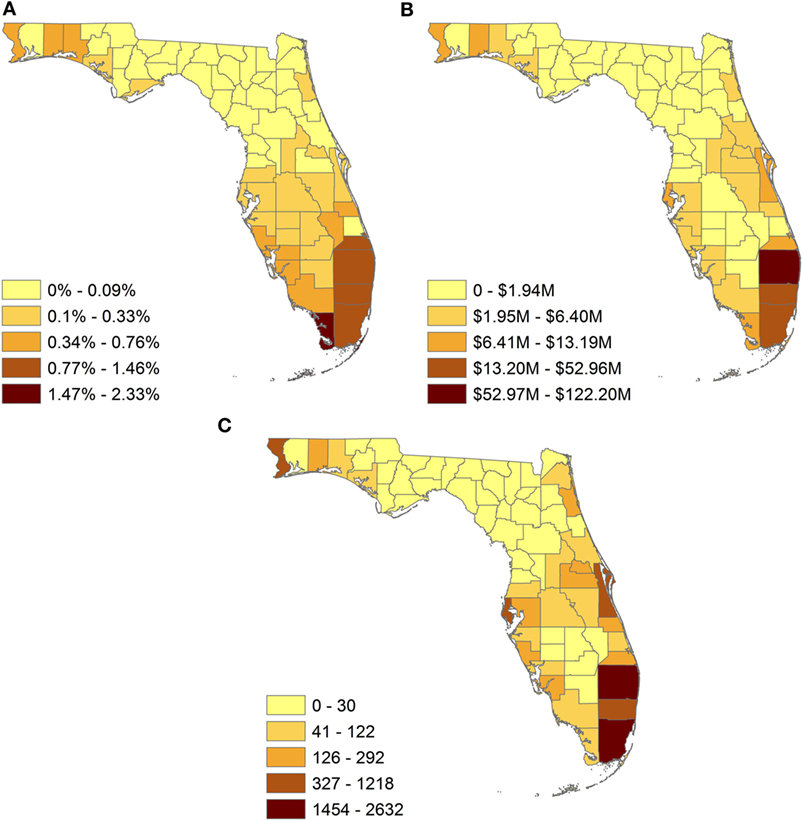
Figure 6. The comparison of different loss metrics in the regional scale: (A) average annual loss, (B) average annual dollar loss, (C) AAPL.
Table 2 complements Figure 6 and shows the counties with the highest loss calculated by three different metrics (AAL, AADL, and AAPL), in descending order. All loss measures rank the counties differently. In particular, Collier and Indian River counties appeared in AAL but not included in other metrics. Monroe county ranked the highest in AAL, but ninth in AADL, and was not included in AAPL.
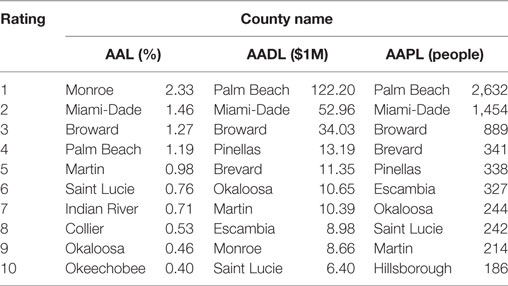
Table 2. Counties with the highest loss.
Hurricane Mitigation Potential of the Wood Residential Structures Built before Hurricane Andrew
In this section, we quantified the hurricane mitigation potential based on different loss measures. To quantify the mitigation potential, we specified the structure built from one of the strongest materials available on the market, which represents a retrofitted house. Table 3 shows capacities of the components of the retrofitted house. Figure 7 presents the vulnerability function of the retrofitted house structure. The vulnerability has been greatly decreased compared with Figure 3 (house built before 1992). The minor damage to retrofitted structure produces severe damage to the house built before hurricane Andrew. The mitigation potential is defined as differences in loss between the house built before hurricane Andrew and the retrofitted structure.
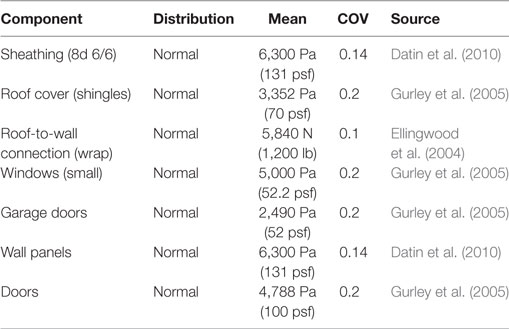
Table 3. Capacity of house components: built after 1992.
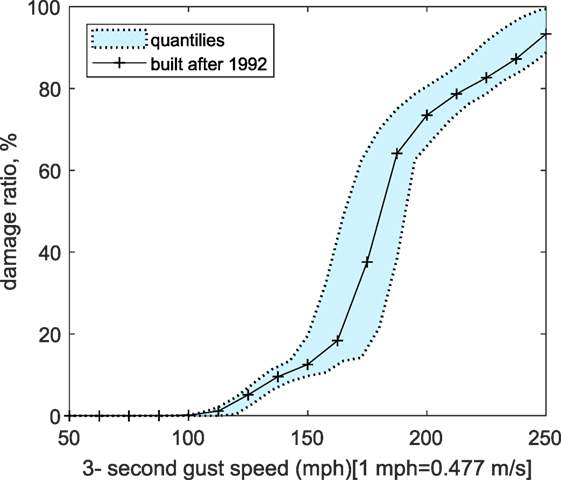
Figure 7. The vulnerability of mitigated house structure.
Figure 8 graphically illustrates the mitigation potential of Florida counties. Following the findings in Table 4 home owners from the Monroe, Miami-Dade, Broward, Palm Beach, and Martin counties would benefit the most by retrofitting their houses. On the other hand, state authorities should pay closer attention to decreased dollar amount for the counties Palm Beach, Miami-Dade, Broward, Pinellas, and Brevard. This information will be also useful for insurers. The mitigation benefit based on the AAPL shows a similar outcome as the AADL because dollar amount and population are related in many counties. However, some counties rank notably differently between the two measures. For example, Monroe county is ranked as eighth but does not exist within top 10 in AAPL. The mitigation of AAPL comes from reduction in the vulnerability function due to the retrofit (upgrading the structure built before 1992 to current standards).
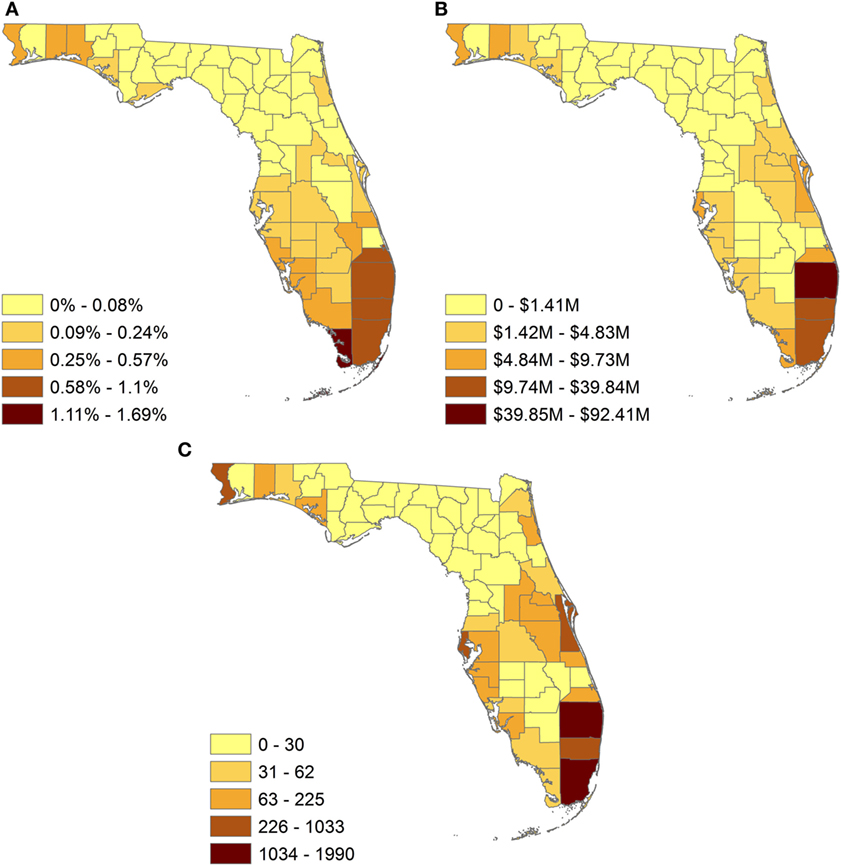
Figure 8. Mitigation potential for: (A) average annual loss, (B) average annual dollar loss, (C) AAPL.
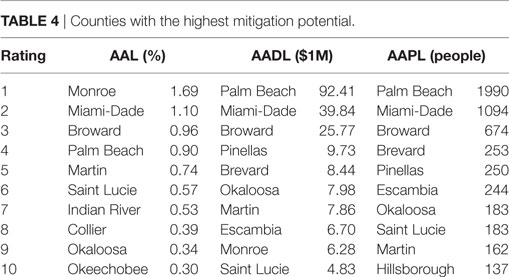
Table 4. Counties with the highest mitigation potential.
Forecasting AAPL Due to the Change in the Population
Florida is one of the most exposed states to the natural hazards, with a growing population (U.S. Census Bureau, 2015a). The AAPL quantifies the impact of the hurricane on the exposed population. Figure 9A shows the population trend of the five selected counties. The counties were selected based on the AAPL of the mitigated house. With increasing population, there is an expected increase in hurricane impact on the population.
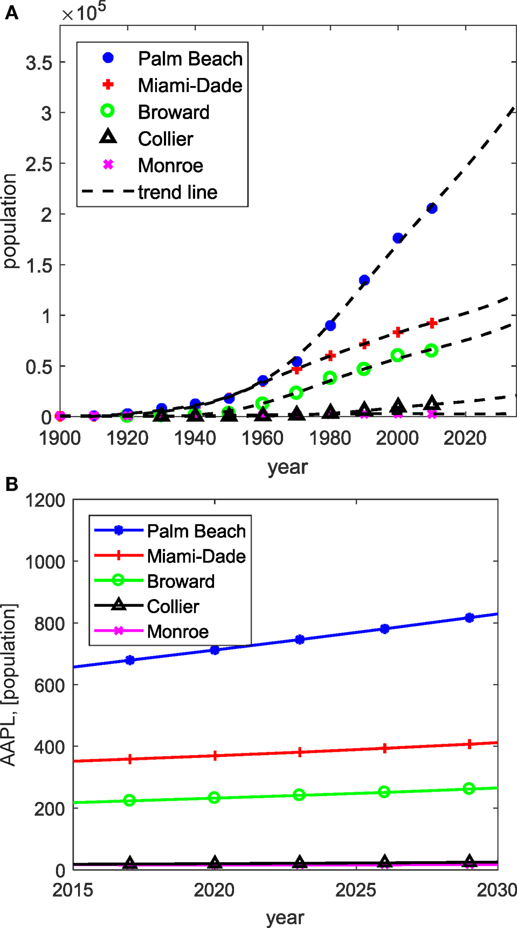
Figure 9. Predicted changes of: (A) population in Florida between 1990 and 2030, (B) the AAPL between 2015 and 2030.
Based on the population change between 1990 and 2010 (U.S. Census Bureau, 2015a), we approximated the increase of the population occupying low-rise wood residential structures. We assumed that the new Florida residents will live in structures built after 1992. Assuming the constant AAL, we approximated the future AAPL due to the population change. Figure 9B predicts the future AAPL for the selected counties. Following the Figure 9B, the Palm Beach county is expected to have the largest increase in AAPL that is caused by the highest predicted increase in the population (Figure 9A).
Prediction of the future AADL depends on two main factors. The first one is the change in the building price (without the price of the lot). Figure 10A shows the average historical price of the building (without the price of the lot) along with the trend line for the future. The second factor is the prospective number of buildings, which is correlated to the population. Figure 10B describes the forthcoming number of the wood residential buildings with gable roof along with the historical data.
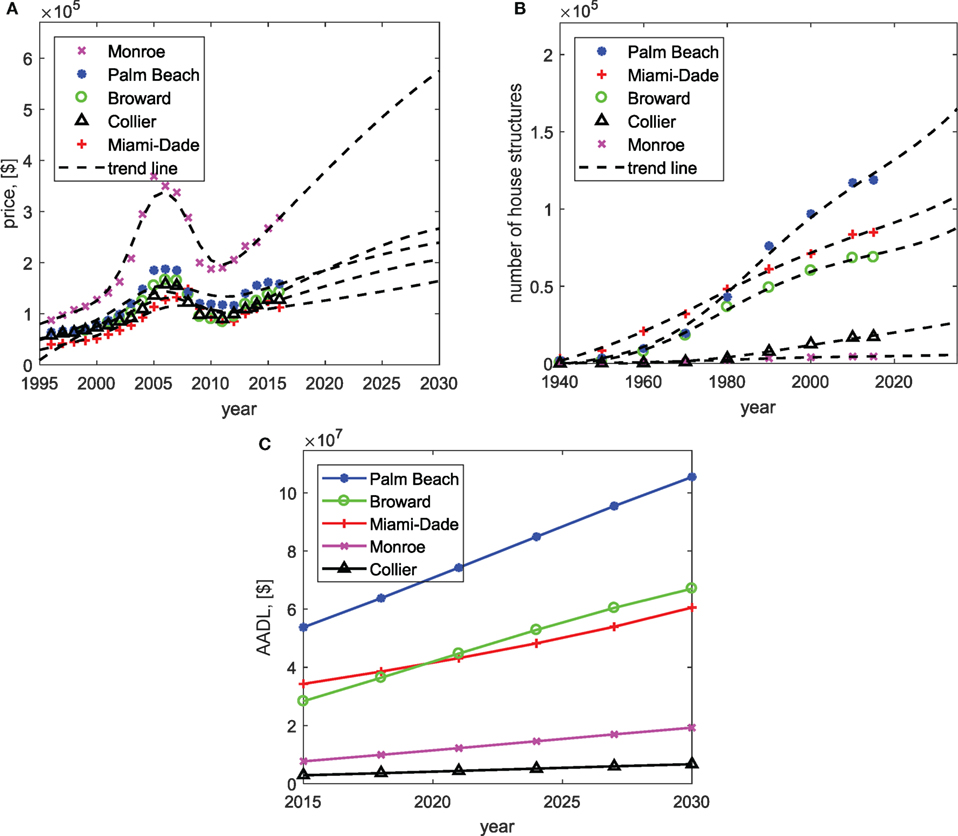
Figure 10. Predicted changes of: (A) the average building price (without the price of the lot) between 1995 and 2030, (B) the number wood-frame residential structures with a gable roof between 1940 and 2030, (C) the average annual dollar loss between 2015 and 2030.
Figure 10C presents the expected change of the AADL for the houses built after 1992. Palm Beach county should except the highest increase of AADL in the next years. While the Miami-Dade county showed the second highest increase in AAPL (Figure 9B), the Broward county showed the second highest increase in AADL (Figure 10C). Predictions of AADL carry more uncertainties compared with the AAPL. Those uncertainties arise due to the house price value that is hard to predict for the long time frame.
Conclusion
This paper first summarized commonly used regional loss metrics. The first metric was the AAL, which represents the expected loss ratio per year. This metric mainly depends on two characteristics: the wind probability in the region and the vulnerability of the investigated house structure. The second metric was the AADL, which is the sum of the dollar loss of all properties in the region. The AADL reflects the price of the house and the number of the particular house structure in the investigated location, but it neglects the population aspect. This paper illustrated that in some cases AAL and AADL may be misleading: e.g., a county with the highest AAL can produce relatively low AADL. Furthermore, the average house price varies greatly among different locations. The same AADL for different states may describe two different loss situations. In addition, the exact price information is difficult to obtain.
In this paper, we proposed a new metric—the average annual population loss (AAPL). The new metric reflects the strength of the hurricane and the number of the affected people. The AAPL can be compared unbiased among different states or among different counties. To characterize the difference among loss measures, we performed the regional loss analysis of all Florida counties. The regional analysis was composed of three modules: the hazard module, the vulnerability module, and the financial module. The probabilistic storm database used in this research contained 16,000 storms affecting Florida region. Based on the results of regional loss analysis, we quantified the mitigation potential of Florida counties for different loss measures. Population in Florida is one of the fastest growing in the United States. With increasing population, there is an expected increase in AAPL. Based on historical population data, we predicted the change in the population in the next 30 years. For the expected population change, we quantified the future AAPL for the most exposed counties: Palm Beach, Miami-Dade, and Broward counties should expect the highest increase of AAPL in the next 30 years, in that order. For the future AADL, Palm Beach, Broward, and Miami-Date counties are expected to have the highest increase.
This paper has laid a foundation for population-based loss metrics. The AAPL can be improved in future studies. Especially, non-linear relationship between the loss ratio and influenced population needs to be addressed. The loss ratio of 1.0 will certainly influence all occupants of the house. However, a lower loss ratio such as 0.1 does not necessarily influence 10% of the occupant. The relationship between the loss ratio and influenced population is complicated, which needs to be addressed in future studies.
Author Contributions
GK formulated the idea, wrote the manuscript, and performed all analyses except the regional analysis and AAL calculation. SJ refined the idea, supervised the research, and had a significant contribution in writing the manuscript. AV helped in finding the idea and in statistical analysis. AT, OK, and MK performed the regional loss analysis and calculated the AAL.
Conflict of Interest Statement
Authors, AT, OK, and MK, were employed by company CoreLogic. All other authors declare no competing interests.
Funding
This publication was supported by the National Sea Grant College Program of the U.S. Department of Commerce’s National Oceanic and Atmospheric Administration (NOAA), Grant No. NA 14OAR4170108, Subcontract No UFDSP00010509 made to Florida State University. The views expressed are those of the authors and do not necessarily reflect the view of these organizations.
References
AIR WORLDWIDE. (2015). The Air Hurricane Model: Air Atlantic Tropical Cyclone Model v15.0.1. Boston: Florida Commission on Hurricane Loss Projection Methodology.
Applied Research Associates. (2002a). Development of Loss Relativities for Wind Resistive Features of Residential Buildings with Five or More Units, Raleigh, NC: Applied Research Associates Inc.
Applied Research Associates. (2002b). Development of Loss Relativities for Wind Resistive Features of Residential Structures, Raleigh, NC: Applied Research Associates Inc.
Applied Research Associates. (2008). Florida Residential Wind Loss Mitigation Study, Raleigh, NC: Applied Research Associates Inc.
Applied Research Associates, I., and Division, I. (2015). Hurloss Version 7.0.A. Raleigh: Florida Commission on Hurricane Loss Projection Methodology.
ASCE 7. (2010). Minimum Design Loads for Buildings and Other Structures. Reston: American Society of Civil Engineers.
Batts, M. E., Simiu, E., and Russell, L. R. (1980). Hurricane wind speeds in the United States. J. Struct. Div. 106, 2001–2016.
Bjarnadottir, S., Li, Y., and Stewart, M. G. (2011). A probabilistic-based framework for impact and adaptation assessment of climate change on hurricane damage risks and costs. Struct. Saf. 33, 173–185. doi:10.1016/j.strusafe.2011.02.003
Blake, E. S., Rappaport, E. N., and Landsea, C. W. (2007). The Deadliest, Costliest, and Most Intense United States Tropical Cyclones from 1851 to 2006 (And Other Frequently Requested Hurricane Facts). Miami: NOAA/National Weather Service, National Centers for Environmental Prediction, National Hurricane Center.
Changnon, S. A. (2003). Shifting economic impacts from weather extremes in the united states: a result of societal changes, not global warming. Nat. Hazards 29, 273–290. doi:10.1023/A:1023642131794
Cope, A. D. (2004). Predicting the Vulnerability of Typical Residential Buildings to Hurricane Damage. Gainesville: University of Florida.
CoreLogic EQECAT. (2015). A Component of the Eqecat North Atlantic Hurricane Model in Risk Quantification and Engineering. Irvine: Florida Commission on Hurricane Loss Projection Methodology.
Cutter, S. L., and Emrich, C. (2005). Are natural hazards and disaster losses in the US increasing? EOS Trans. Am. Geophys. Union 86, 381–389. doi:10.1029/2005EO410001
Datin, P. L., Prevatt, D. O., and Pang, W. (2010). Wind-uplift capacity of residential wood roof-sheathing panels retrofitted with insulating foam adhesive. J. Archit. Eng. 17, 144–154. doi:10.1061/(ASCE)AE.1943-5568.0000034
Ellingwood, B. R., Rosowsky, D. V., Li, Y., and Kim, J. H. (2004). Fragility assessment of light-frame wood construction subjected to wind and earthquake hazards. J. Struct. Eng. 130, 1921–1930. doi:10.1061/(ASCE)0733-9445(2004)130:12(1921)
FPHLM. (2015). Florida Public Hurricane Loss Model 6.1. Miami: Florida Commission on Hurricane Loss Projection.
Friedman, D. G. (1984). Natural Hazard Risk Assessment for an Insurance Program. Hartford: Geneva Papers on Risk and Insurance, 57–128.
Grayson, J. M., Pang, W., and Schiff, S. (2013). Building envelope failure assessment framework for residential communities subjected to hurricanes. Eng. Struct. 51, 245–258. doi:10.1016/j.engstruct.2013.01.027
Gurley, K., Pinelli, J., Subramanian, C., Cope, A., Zhang, L., and Murphree, J. (2005). Florida Public Hurricane Loss Projection Model Engineering Team. Final Report. Miami: International Hurricane Research Center, Florida International University.
Hamid, S., Kibria, B. G., Gulati, S., Powell, M., Annane, B., Cocke, S., et al. (2010). Predicting losses of residential structures in the state of Florida by the public hurricane loss evaluation model. Stat. Methodol. 7, 552–573. doi:10.1016/j.stamet.2010.02.004
Hayes, A., and Guyton, L. (2016). Corelogic Storm Surge Analysis Identifies More Than 6.8 Million US Homes at Risk of Hurricane Storm Surge Damage in 2016. Available at: http://www.corelogic.com/
HAZUS MHMR. (2003). Multi-Hazard Loss Estimation Methodology. FEMA. Available at: http://www.fema.gov
Ho, F. P., Su, J. C., Hanevich, K. L., Smith, R. J., and Richards, F. P. (1987). Hurricane Climatology for the Atlantic and Gulf Coasts of the United States. Silver Spring, MD: NOAA Technical Memorandum.
Holmes, W. (1999). Multi-Hazard Loss Estimation Methodology: Technical Manual. Washington, DC: Federal Emergency Management Agency.
Huang, Z., Rosowsky, D. V., and Sparks, P. R. (2001). Long-term hurricane risk assessment and expected damage to residential structures. Reliab. Eng. Syst. Saf. 74, 239–249. doi:10.1016/S0951-8320(01)00086-2
Jain, V. K., Davidson, R., and Rosowsky, D. (2005). Modeling changes in hurricane risk over time. Nat. Hazards Rev. 6, 88–96. doi:10.1061/(ASCE)1527-6988(2005)6:2(88)
Jain, V. K., and Davidson, R. A. (2007). Forecasting changes in the hurricane wind vulnerability of a regional inventory of wood-frame houses. J. Infrastruct. Syst. 13, 31–42. doi:10.1061/(ASCE)1076-0342(2007)13:1(31)
Krayer, W. R., and Marshall, R. D. (1992). Gust factors applied to hurricane winds. Bull. Am. Meteorol. Soc. 73, 613–618. doi:10.1175/1520-0477(1992)073<0613:GFATHW>2.0.CO;2
Leicester, R., and Reardon, G. (1976). “Case studies of wind damage to domestic and other low-rise buildings,” in Symposium on Natural Hazards in Australia (Canberra: Australian Academy of Science).
Li, Y. (2010). Assessment of damage risks to residential buildings and cost–benefit of mitigation strategies considering hurricane and earthquake hazards. J. Perform. Construct. Facil. 26, 7–16. doi:10.1061/(ASCE)CF.1943-5509.0000204
Li, Y., and Ellingwood, B. R. (2006). Hurricane damage to residential construction in the US: importance of uncertainty modeling in risk assessment. Eng. Struct. 28, 1009–1018. doi:10.1016/j.engstruct.2005.11.005
Li, Y., and Ellingwood, B. R. (2009). Framework for multihazard risk assessment and mitigation for wood-frame residential construction. J. Struct. Eng. 135, 159–168. doi:10.1061/(ASCE)0733-9445(2009)135:2(159)
Liu, F. (2014). Projections of Future US Design Wind Speeds and Hurricane Losses due to Climate Change. Doctoral Dissertation, Clemson Univ, Clemson, SC.
Pielke, R. A. Jr., Gratz, J., Landsea, C. W., Collins, D., Saunders, M. A., and Musulin, R. (2008). Normalized hurricane damage in the United States: 1900–2005. Nat. Hazards Rev. 9, 29–42. doi:10.1061/(ASCE)1527-6988(2008)9:1(29)
Pielke, R. A. Jr., and Landsea, C. W. (1998). Normalized hurricane damages in the United States: 1925-95. Weather Forecast. 13, 621–631. doi:10.1175/1520-0434(1998)013<0621:NHDITU>2.0.CO;2
Pinelli, J.-P., Pita, G., Gurley, K., Torkian, B., Hamid, S., and Subramanian, C. (2011). Damage characterization: application to Florida public hurricane loss model. Nat. Hazards Rev. 12, 190–195. doi:10.1061/(ASCE)NH.1527-6996.0000051
Pinelli, J.-P., Simiu, E., Gurley, K., Subramanian, C., Zhang, L., Cope, A., et al. (2004). Hurricane damage prediction model for residential structures. J. Struct. Eng. 130, 1685–1691. doi:10.1061/(ASCE)0733-9445(2004)130:11(1685)
Pinelli, J.-P., Torkian, B. B., Gurley, K., Subramanian, C., and Hamid, S. (2009). “Cost effectiveness of hurricane mitigation measures for residential buildings,” in Proceedings, 11th America’s Conference on Wind Engineering (American Association of wind Engineering). Available at: www.aawe.org
Pinelli, J.-P., Zhang, L., Subramanian, C., Cope, A., Gurley, K., Gulati, S., et al. (2003). “Classification of structural models for wind damage predictions in Florida,” in Proceedings, 11th International Conference on Wind Engineering, Miami.
Pita, G., Pinelli, J., Subramanian, C., Gurley, K., and Hamid, S. (2008). “Hurricane vulnerability of multi-story residential buildings in Florida,” in Proceedings ESREL 2008, Stavanger, Norway.
Pita, G., Pinelli, J.-P., Gurley, K., and Mitrani-Reiser, J. (2014). State of the art of hurricane vulnerability estimation methods: a review. Nat. Hazards Rev. 16, 04014022. doi:10.1061/(ASCE)NH.1527-6996.0000153
Pita, G. L., Pinelli, J.-P., Gurley, K., Subramanian, C., and Hamid, S. (2009). “Vulnerability of low-rise commercial-residential buildings in the Florida public hurricane loss model,” in Proceedings, 11th America’s Conference on Wind Engineering (American Association of wind Engineering). Available at: www.aawe.org
Pita, G. L., Pinelli, J.-P., Gurley, K. R., and Hamid, S. (2013). Hurricane vulnerability modeling: development and future trends. J. Wind Eng. Ind. Aerodyn. 114, 96–105. doi:10.1016/j.jweia.2012.12.004
Powell, M., Soukup, G., Cocke, S., Gulati, S., Morisseau-Leroy, N., Hamid, S., et al. (2005). State of florida hurricane loss projection model: atmospheric science component. J. Wind Eng. Ind. Aerodyn. 93, 651–674. doi:10.1016/j.jweia.2005.05.008
RiskLink 15.0. (2015). North Atlantic Hurricane Models. Newark: Florida Commission on Hurricane Loss Projection Methodology.
Rosowsky, D., and Schiff, S. (2003). What are our expectations, objectives, and performance requirements for wood structures in high wind regions? Nat. Hazards Rev. 4, 144–148. doi:10.1061/(ASCE)1527-6988(2003)4:3(144)
Simmons, K. M., Kruse, J. B., and Smith, D. A. (2002). Valuing mitigation: real estate market response to hurricane loss reduction measures. South. Econ. J. 68, 660–671. doi:10.2307/1061724
Sparks, P. R., Schiff, S. D., and Reinhold, T. (1994). Wind damage to envelopes of houses and consequent insurance losses. J. Wind Eng. Ind. Aerodyn. 53, 145–155. doi:10.1016/0167-6105(94)90023-X
Stewart, M. G., Rosowsky, D. V., and Huang, Z. (2003). Hurricane risks and economic viability of strengthened construction. Nat. Hazards Rev. 4, 12–19. doi:10.1061/(ASCE)1527-6988(2003)4:1(12)
Unnikrishnan, V. U., and Barbato, M. (2016). Performance-based comparison of different storm mitigation techniques for residential buildings. J. Struct. Eng. 142, 04016011. doi:10.1061/(ASCE)ST.1943-541X.0001469
U.S. Census Bureau. (2015a). Historical Census of Housing Tables. Available at: www.census.gov
U.S. Census Bureau. (2015b). Quickfacts Provides Statistics for All States and Counties, and for Cities and Towns with a Population of 5,000 or More. Available at: www.census.gov
Vickery, P. J., Lin, J., Skerlj, P. F., Twisdale, L. A. Jr., and Huang, K. (2006a). Hazus-mh hurricane model methodology. I: hurricane hazard, terrain, and wind load modeling. Nat. Hazards Rev. 7, 82–93. doi:10.1061/(ASCE)1527-6988(2006)7:2(82)
Vickery, P. J., Skerlj, P. F., Lin, J., Twisdale, L. A. Jr., Young, M. A., and Lavelle, F. M. (2006b). Hazus-mh hurricane model methodology. II: damage and loss estimation. Nat. Hazards Rev. 7, 94–103. doi:10.1061/(ASCE)1527-6988(2006)7:2(94)
Vickery, P. J., and Twisdale, L. A. (1995). Wind-field and filling models for hurricane wind-speed predictions. J. Struct. Eng. 121, 1700–1709. doi:10.1061/(ASCE)0733-9445(1995)121:11(1691)
Walker, G. R. (2011). Modelling the vulnerability of buildings to wind. Can. J. Civil Eng. 38, 1031–1039. doi:10.1139/L11-047
Watson, C. C. Jr., and Johnson, M. E. (2004a). Hurricane loss estimation models. Bull. Am. Meteorol. Soc. 85, 1713. doi:10.1175/BAMS-85-11-1713
Watson, C. C. Jr., Johnson, M. E., and Simons, M. (2004b). Insurance rate filings and hurricane loss estimation models. J. Insur. Regul. 22, 39.
Keywords: regional, hurricane, vulnerability, population, loss
Citation: Kakareko G, Jung S, Vanli OA, Tecle A, Khemici O and Khater M (2017) Hurricane Loss Analysis Based on the Population-Weighted Index. Front. Built Environ. 3:46. doi: 10.3389/fbuil.2017.00046
Received: 18 May 2017; Accepted: 20 July 2017;
Published: 10 August 2017
Edited by:
Kurtis Robert Gurley, University of Florida, United StatesCopyright: © 2017 Kakareko, Jung, Vanli, Tecle, Khemici and Khater. This is an open-access article distributed under the terms of the Creative Commons Attribution License (CC BY). The use, distribution or reproduction in other forums is permitted, provided the original author(s) or licensor are credited and that the original publication in this journal is cited, in accordance with accepted academic practice. No use, distribution or reproduction is permitted which does not comply with these terms.
*Correspondence: Sungmoon Jung, sjung@eng.famu.fsu.edu