Normalized Curvature Ratio for Damage Detection in Beam-Like Structures
 Kaitlyn Kliewer
 Branko Glisic
- Department of Civil and Environmental Engineering, Princeton University, Princeton, NJ, United States
Fiber Optic Sensors (FOS) offer numerous advantages for structural health monitoring. In addition to being durable, lightweight, and capable of multiplexing, they offer the ability to monitor strain in both static and dynamic mode. FOS also allow for instrumentation of large areas of a structure with long-gage sensors which helps enable global monitoring of the structure. Drawing upon these benefits, the Normalized Curvature Ratio (NCR), a curvature based damage detection method, has been developed. This method utilizes a series of long-gage Fiber Bragg Grating (FBG) strain sensors for damage detection of a structure through dynamic strain measurements and curvature analysis. The main assumption is that the ratios between cross-sectional curvature amplitudes under free vibration remain unchanged given the state of the structure is unchanged. The theoretical development of this method is presented along with an analytical study of a simply supported beam with two damage cases: a loss of flexural stiffness in the span and a change in rotational stiffness of the support. Validation of the method is then performed through two implementations. First, through a small-scale laboratory test with a simply supported aluminum beam subjected to a change in the rotational stiffness of the support. Second, the method is applied to an existing in-service highway overpass with over 5 years of data collection of dynamic strain events. The advantages and limitations of the method are identified and discussed. This research shows encouraging results and the potential for the NCR to be used as a simplistic metric for damage detection.
1. Introduction
American infrastructure recently received a D+ rating by the American Society of Civil Engineers in the 2017 Infrastructure Report (ASCE, 2017). In the US, there are over 600,000 bridges and more than 25% of those bridges are structurally deficient or functionally obsolete, according to the US federal highway administration (USDOT, 2015). The average age of these structurally deficient bridges is over 65 years, which well exceeds the average service life of 50 years for those structures (Davis et al., 2013). In an effort to monitor the state of bridges, the federal highway administration currently mandates periodic inspection of all bridges which typically done through visual inspection (National Bridge Inspection Standards (NBIS), 1996; Phares et al., 2004). However, this has been found to be inefficient and unreliable as it is prone to human errors. Phares et al. looked at the accuracy and reliability of these routine bridge inspections and found that 56% of average condition ratings are incorrect with a probability of 95% (Phares et al., 2004). Because civil infrastructure, such as bridges, roads, dams, and buildings plays a crucial role in the socio-economic life and development of a country, there is a need for reliable methods to assess the condition of structures. Structural health monitoring (SHM) provides the ability to address this challenge and potentially improve the lifespan and cost of repairs on these structures. However, implementation of SHM has its own challenges relating to selection of damage sensitive feature and data analysis. Bridge managers and engineers are somewhat reluctant in applying SHM in the cases where damage-sensitive features have little engineering meaning or where the data analysis is complex and complicated. In addition, in spite of technological advancements during the last decade, live load monitoring still represents a challenge, and thus, their correlation with damage sensitive feature is in many cases impossible.
To address above challenges, the objective of this research is to create a simplistic dynamic SHM method based on curvature change under free vibration, through the use of the normalized curvature ratio (NCR) as a damage sensitive feature. The NCR is a parameter that was identified as simplistic to implement in SHM and independent of live loads. It uses the curvature values at discrete locations measured using strain sensors. The method is developed through the use of analytical case studies which demonstrated the potential of the NCR as a damage sensitive feature. To assess its performance and limitations, this method has been applied to both a small-scale laboratory specimen and to an in-service bridge, both instrumented with long-gage Fiber Bragg-Grating (FBG) strain sensors. With sufficient sensors and sensitivity, the NCR method has the potential for Level II SHM, which includes both the determination that damage is present and the determination of the geometric location of the damage. However, due to the limited number of sensors available for the experimental tests presented in this paper, the analysis of the NCR method in this paper is limited to Level I SHM.
The field of vibration-based structural health monitoring methods is currently a vast area of research with contributions to the field beginning in the 1970s. Extensive literature reviews of vibration-based methods have been performed by Doebling et al. (1998), which present a review of methods published prior to 1996 (Sohn et al., 2003), review vibration-based methods published between 1996–2001 (Carden and Fanning, 2004), focus on papers published after 1996 (Fan and Qiao, 2011), and review vibration-based methods for beam-type structures. A common approach for vibration-based monitoring methods is to rely upon detecting structural changes through natural frequency (Doebling et al., 1996; Salawu, 1997) and mode shape-based analysis (Shi et al., 2000; Zonta et al., 2003, 2008). However, it was found by Nandan and Singh (2014) that modal frequencies can be heavily effected by thermal changes in the thermal environment and these temperature influences can mask the changes in modal frequencies due to damage. However, Pandey et al. (1991) found that curvature based methods may be a more sensitive indicator of damage in-beam like structures. Since this finding, there has been research focused on curvature-mode shape damage detection methods (Wahab and De Roeck, 1999; Quaranta et al., 2016; Yang et al., 2016) and modal strain energy methods (Shi et al., 1998). It was found that accelerometers are a commonly used sensor for these vibration-based methods, including curvature-based methods. However, strain sensors are more optimal sensor for curvature based methods as curvature can be directly determined from the strain sensors and curvature as methods using numerically calculated curvature were found to have unacceptably high errors (Chance et al., 1994; Wahab and De Roeck, 1999).
Due to ease of instrumentation and their low cost, accelerometers are very common for dynamic structural monitoring with a wide range of applications from long-span bridges to wind turbines. However, there are limitations associated with traditional accelerometer technology that include difficulty multiplexing the sensors, they are limited to point sensors, they are sensitive to electromagnetic interference, and they have limited application in hostile environments (Antunes et al., 2012). In addition, determination of curvature from acceleration requires differentiation, which is prone to errors. When using strain sensors, because the curvature is linearly correlated with the strain, the curvature can be directly calculated from the strain measurements and eliminates the need for numerical differentiation, which reduces errors. There are many long-gage fiber optic strain sensors currently available, such as those developed by Pozzi et al. (2008); however, this research will focus on the use of fiber-Bragg grating (FBG) strain sensors. FBG sensors overcome many of the disadvantages associated with traditional accelerometers as they offer long-gage sensor possibilities as well as static and dynamic monitoring abilities, they are durable and lightweight, immune to electro-magnetic interference and offer multiplexing capabilities (Glisic and Inaudi, 2007). This research will focus on the use of long-gage sensors as opposed to point (short-gage) sensors as they are not influenced by local inhomogeneity of monitored material (e.g., concrete) and increase the chance of detecting damage due to the larger spatial coverage.
The theoretical development of the NCR method is briefly presented in the Section 2 followed by an application of these methods in two different analytical studies described in Section 3. Sections 4 and 5 present the application of the method to a small-scale laboratory specimen using a simply supported beam and the application of this method to an existing in-service structure, respectively. Last, the conclusions are presented in Section 6.
2. Method Development
This research focuses on the creation of a curvature-based method applicable to beam-like structures under free vibration that can be approximated as a Bernoulli–Euler beam. The curvature modes under free vibration are not expected to change unless the structure experiences unusual behavior. This creates the basis for the main assumption of the proposed method, that the ratios between curvature amplitudes at different locations of the beam should remain constant under free vibration, unless there is a change in the state of the structure. While the sensors can detect the damage directly if it occurs at location of sensors, direct damage detection is not considered in this study, as it is less challenging and already addressed in the literature (e.g., see Hubbell and Glisic (2013)). A summary of the derivation of the equations critical for understanding the NCR method are presented in the following sections. Elementary theoretical equations for the vibrations of continuous structures are only briefly presented, a more explanation of the theory and more detailed derivations can be found in Leissa and Qatu (2011).
2.1. Dynamic Behavior of Bernoulli–Euler Beam
The equation of motion for a plane Bernoulli–Euler beam under transverse free vibration with a small amplitude can be described by the following equation:
where EI(x) is the flexural rigidity, ρ is the density per unit volume, A(x) is the area of the cross-section, x is the coordinate in longitudinal direction of the beam, and y is the deflection of the center-line of the beam. In order to solve this equation, a solution in the following form is assumed:
which allows for the solution of the modal displacement of a beam. The solution for the displacement, assuming a uniform beam where EI(x) = EI = constant and ρ(x) = ρ = constant, is:
where αn is related to the n(th) eigenfrequency of the beam, ωn, and can be described by the following equation:
C1, …, C4 are constants determined by the boundary and continuity conditions of the beam. Because the curvature of a beam at a point is equal to the second derivative of deflection at that point, equation (2) can be used to obtain a generic equation for the curvature of a beam. This equation is equivalent to:
For the purposes of simplification of presentation, in this paper, the research focuses on the application to a simply supported beam. However, the method can easily be extended to any beam-like structure by following the same logic as for a simply supported beam. In many real-life applications, free vibration of structure is frequently dominated by the first mode or it may be possible to filter out the higher modes of vibration. For a simply supported beam, in order to determine the constants in equation (5), the following set of equations can be used to describe the boundary conditions:
By substituting equations (6)–(9) into equation (3), a solution for the coefficients C1–C4 can be obtained, and thus the curvature distribution along the beam can be determined at any moment in time for an intact, non-damaged simply supported beam. Derivations for two typical damage scenarios—reduction of the cross-section and partial fixation of a support (see Figure 1)—are presented in the following text. These two cases were studied in order to assess the theoretical sensitivity of the method.
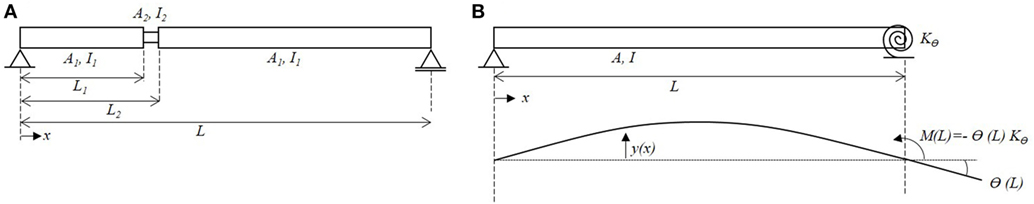
Figure 1. Case studies on Bernoulli–Euler beams: (A) a beam with reduced cross-section occurring at an arbitrary location along the length of the beam and (B) a beam with partially fixed end at the support.
2.1.1. Equations of Motion: Beam Damaged Mid-Span
A beam with a loss of stiffness due to a reduction in the cross-section (e.g., due to a crack, corrosion or loss of composite action between steel and concrete in steel–concrete composite structures) can be represented as illustrated in Figure 1A. The beam can be discretized into 3 different segments, where the beginning and end segments have the full uniform stiffness, EI1. The middle segment of this beam is the section with reduced stiffness EI2. For this system, a series of equations based on equation (3) are needed to describe the equation of motion for the beam. The equation for the displacement of the beam for each of the three segments is as follows:
A solution to these equations can be determined using both the continuity equations listed below in equations (11)–(18) and using the boundary conditions for the beam. For a simply supported beam under these conditions, the boundary conditions at x = 0 and x = L for this system are equivalent to the boundary conditions provided in equations (6)–(9). The continuity conditions at the junctions of the beam segments are represented as follows:
From the equations of motion, the resulting curvature of the beam dependent on the loss of stiffness (I2/I1) can be determined once the coefficients C1–C12 are determined.
2.1.2. Equations of Motion: Beam Damaged at Support
Another typical damage or unusual structural behavior may occur when there is a change in the boundary conditions of the structure. A change in the boundary conditions of a structure can be the result of malfunction of support mechanism due to various causes, such as corrosion, dislocation, and fatigue cracks. This damage may lead to a change in the rotational stiffness of the beam. The rotational stiffness can be represented by a rotational spring with a stiffness kθ at the location of the support and an example of this beam is illustrated in Figure 1B. Using this new boundary condition, a relationship between the curvature of the beam and the rotational stiffness of the support can be determined using the same boundary conditions as equations (6)–(8) in addition to the following boundary condition:
Using equations (6), (7), (8), and (19) and substituting them into equation (3), a solution for the coefficients C1–C4 and α can be obtained where a relationship between the rotational stiffness, kθ, and α can be described by the following equation:
Using these equations, the curvature mode shape for a beam with a pin support and a pin support with a rotational stiffness of kθ can be determined.
2.2. Normalized Curvature Ratio (NCR) Method
Based on equation (5), for any beam under free-vibration, in a single mode (in most cases in real structures, free vibration occurs primarily in the first mode), the ratio of the curvature of the beam at one location and the curvature of the beam at another location should remain a constant value. This is true regardless of the boundary conditions of the system and is independent of the amplitude of the motion. We can define this ratio between curvatures in two cross-sections as normalized curvature ratio (NCR) by the following equation:
where κi is the curvature of the beam at sensor location i and κj is the curvature of the beam at sensor location j. Experimentally, the peak curvature values for each sensor are used, such as those shown in Figure 2. In order to obtain NCRij, the peak curvatures at sensor i can be plotted against the peak curvatures at sensor j. A linear regression can be fit to this relationship and the slope of this regression provides the NCR for these two sensor locations. If there is a change occurring in the structure (e.g., regarding the boundary conditions of the structure or reduction of cross-section along the span of the beam), this change is expected to be reflected as a change in the normalized curvature ratio (NCR). Evaluation of the NCR is particularly well suited for a structure instrumented with a series of parallel strain sensors installed at discrete locations along the length of the beam. Parallel strain sensors can be placed at the desired locations to calculate the NCRs and, because strain is linearly related to the curvature in a beam, the curvature at the desired locations can be obtained while introducing minimal uncertainty into the results.
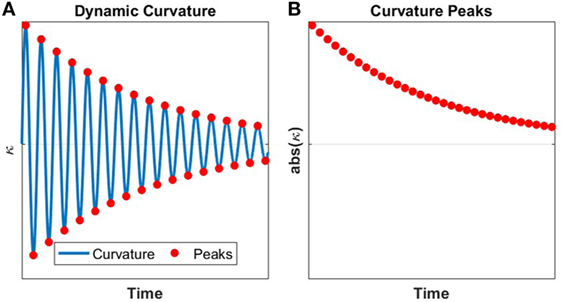
Figure 2. Schematic representation of identification of curvature local extreme values used in NCR Method: (A) Dynamic curvature response and (B) the associated peak curvature values.
An overview of this SHM method based on NCR is schematically presented in Figure 3. The initial stage of the method involves the development of a model for the structural system. Either an analytical or numerical model can be used for the NCR method; however, in this paper an analytical model will be used. If there is a preexisting sensor network installed on the structure, it may be possible to utilize the existing network as opposed to installing a new system. The effectiveness of the existing network may be evaluated using the structural model that was developed. If there is no sensor network in place, the model of the structural system can be used to perform an analysis to determine the optimal sensor placement for the structure. Once the structural response is obtained, the free vibration response time series must be determined. An example is provided in Section 5.2 when analyzing the results from the highway overpass. If reference data for the structure is available, the damage sensitive parameter, the NCR, can be compared to the parameters from the reference point. This comparison allows for an evaluation of the change in structural performance over time. However, a reference point is not always available for a structure. In these cases, the NCR can be compared with the theoretical values determined using the structural model. If there is a statistically significant difference between the measured value and the reference value, it may be indication of unusual structural behavior. Since the measurements are collected over very short terms, temperature compensation is not necessary, and thermal strain can be neglected in calculus (Sigurdardottir and Glisic, 2013). Thus, a benefit of the NCR method is that it does not require any correction of data related to temperature changes.
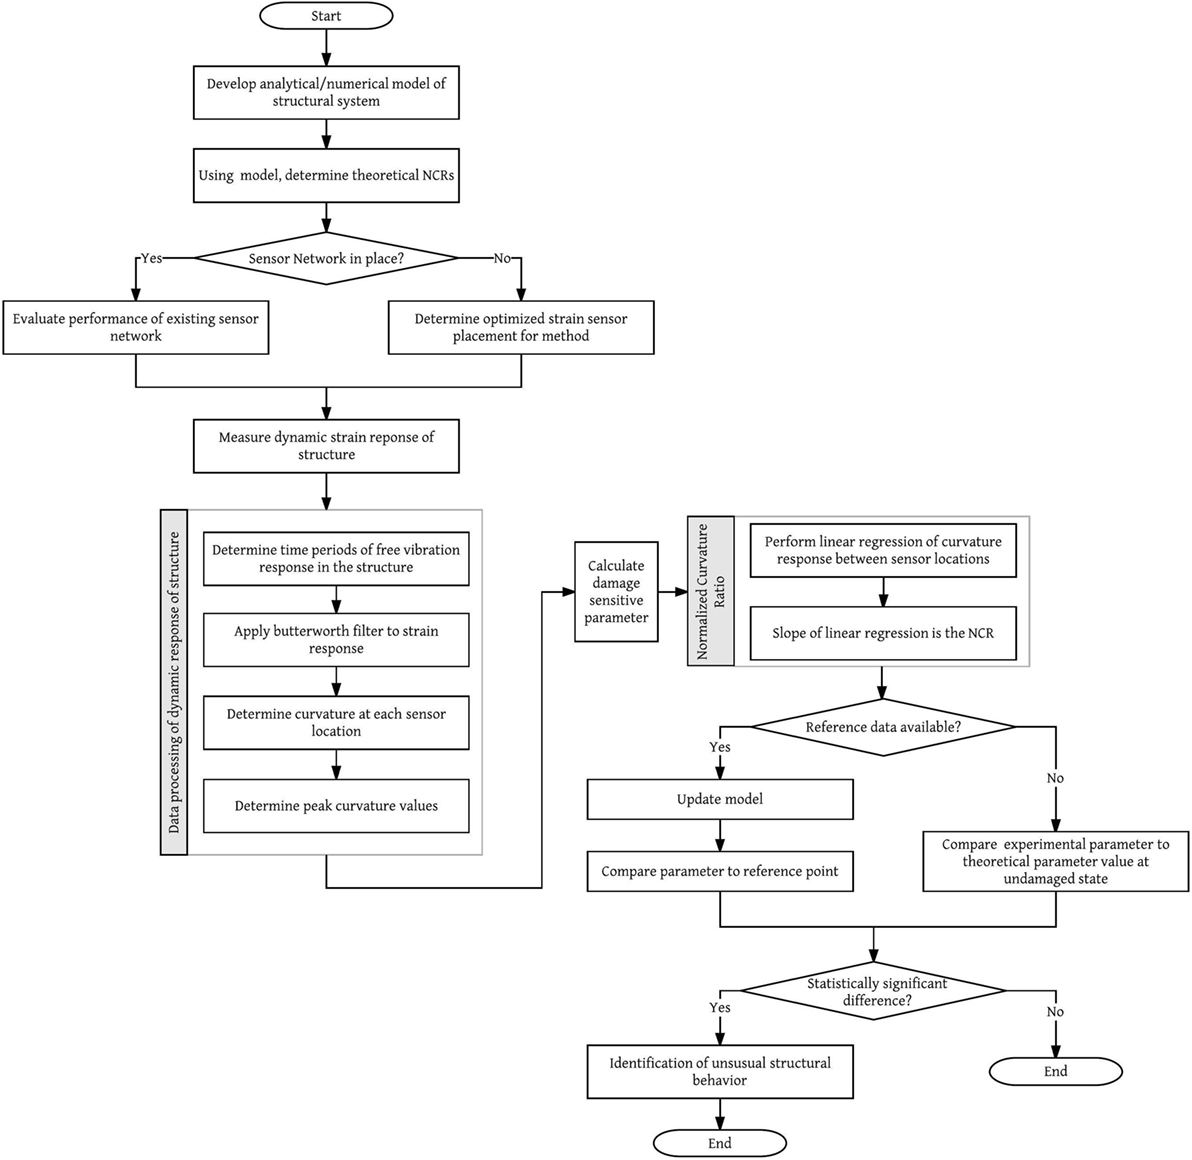
Figure 3. Schematic representation of SHM method based on NCR.
3. Analytical Study
In order to assess sensitivity of the method presented above, an analytical study was performed for the two typical damage types presented in the previous section. Both analysis will use a simply supported aluminum beam with a length of 2 m, a height of 1 cm, and a width of 25 cm. Additionally, the results presented will focus on the strain and curvature values calculated at 4 locations on the beam that are evenly spaced along the length of the structure (0.4, 0.8, 1.2, and 1.6 m). This was done so to partially simulate the beam being instrumented with a series of 4 strain sensors, similar to the method used in laboratory tests (see Section 4). An overview of the application of the method is presented along with the results from the study.
3.1. Beam with Reduced Stiffness
An analysis of the NCR for a beam with a reduced flexural stiffness was performed by modeling an increasing loss of stiffness of the cross-section of the beam at various locations on the beam. The height of the cross-section was varied and this occurred at 0.5 and 1 m from the left support. The curvature of this beam was determined using equations (10)–(18).
The effect of the reduced stiffness on the curvature of the beam can be seen in Figure 4 showing the curvature mode shape for the two damage locations. The NCR were calculated for each case and are shown in Figures 4A,B. For the case with the damage located at 0.5 m, a difference in the NCR values is observed as the cross-section is reduced. However, these changes in the curvature ratios are not significant, except in the case of very severe damage. It is important to note that when the damage is located in the middle of the beam, there is a minimal impact on the curvature ratios of the structure as the vibration of the beam is symmetric. This indicates that a given configuration of sensors is not equally sensitive to the damages occurring at different locations. In general, problems with sensitivity to damage at specific locations (e.g., in the middle of the beam) may be resolved by instrumenting the structure with sensors at these identified locations (i.e., where the NCR method is not sensitive to damage), which will allow for direct detection of damage; however, direct damage detection is out of the scope of this study. Hence, because not all sensor placements are optimal or may have regions where they are insensitive to damage, it is important to perform an analysis on the structure to determine the optimal sensor placement prior to installation.
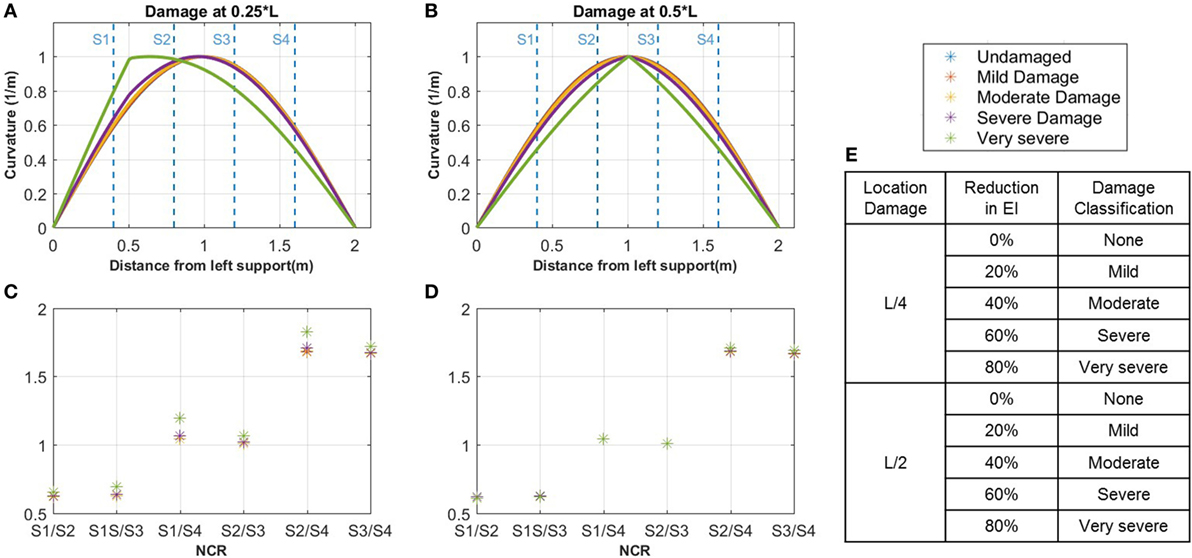
Figure 4. Results from two analytical beam models with loss of stiffness in the cross-section: the curvature (A) and corresponding NCRs (C) for analytical beam with damage located at the quarter-span and the curvature (B) and corresponding NCRs (D) for analytical beam with damage located at the mid-span; (E) Damage classification and corresponding reduction in stiffness (EI).
3.2. Beam with Change in Support Conditions
Using the same beam, a case study was performed by modeling a damaged support as a rotational spring at the right support of the beam. The rotational stiffness of the beam boundary condition was varied from a pinned support, which is idealized as a rotational stiffness of 0 to a fully fixed support idealized as having infinite stiffness. Using equations (5) and (11), the curvature mode of the beam under the various support conditions could be determined. The results for the varying curvature of the beam are shown in Figure 5. This figure shows that as the rotational stiffness of the support increases, there is a global change in the curvature of the beam. Additionally, there is a shift to the left of the inflection point for the curvature. Knowing the curvature of the beam under the changing support condition, the NCRs were determined based on the locations selected for the strain sensors. The results for the NCRs are shown in Figure 6.
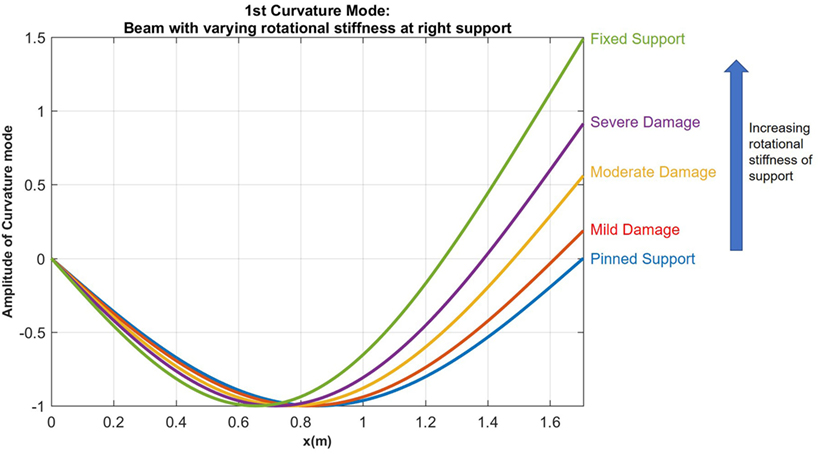
Figure 5. Case study: curvature of beam with varying rotational stiffness at support.
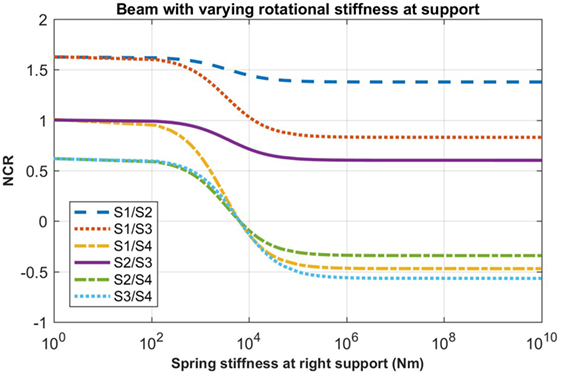
Figure 6. Case study: NCRs of beam with varying rotational stiffness at support.
This application of the NCR method to a beam with a damaged support in an analytical study shows very good results with a clear change in the NCR values that is dependent on the stiffness of the support. Therefore, this case is further tested in the laboratory with a small-scale experiment.
4. Laboratory Tests: Simply Supported Beam
Basic laboratory tests were performed and agreed with the findings of the first analytical study, confirming relatively low sensitivity of NCR method to a reduction of stiffness in the span. The tests were performed on a cantilevered beam to amplify the magnitude of curvature, while damage is simulated by varying the stiffness at predetermined location. Since these results simply confirmed low sensitivity of the method, and given the figure limitations of this paper, the focus of this section is on a beam with a support with a varying rotational stiffness, as the analytical study showed this application more promising. Additionally, preliminary experimental tests and analysis performed on the simply supported beam demonstrated the potential for this method (Kliewer and Glisic, 2015).
4.1. Experimental Setup
Small-scale laboratory tests were performed using a simply supported aluminum beam with a span of 1.71 m and dimensions of 25.4 cm wide by 0.95 cm high, as shown in Figure 7. The aluminum beam was instrumented with a total of 5 Fiber Bragg-Grating (FBG) strain sensors that are installed along the top surface of the beam. The FBG sensors are not placed symmetrically around the center line of the beam as shown in Figure 7. The sensors have a gage length of 10 cm in order to simulate long-gage fiber optic sensors on a full scale structure and the sensors are spaced 10-cm apart. A series of dynamic tests were performed where the aluminum beam was displaced at the mid-span and released in order to induce free vibration. A change in the boundary condition of the beam was simulated by altering the right roller support. The stiffness of the roller was gradually increased by placing clamps at the location of the roller support. A total of 15 trials were run for each of the 4 support conditions: a normal behaving roller and 3 conditions with increasing rotational stiffness. A sampling rate of 250 Hz was used to record the strain data from the FBG sensors.
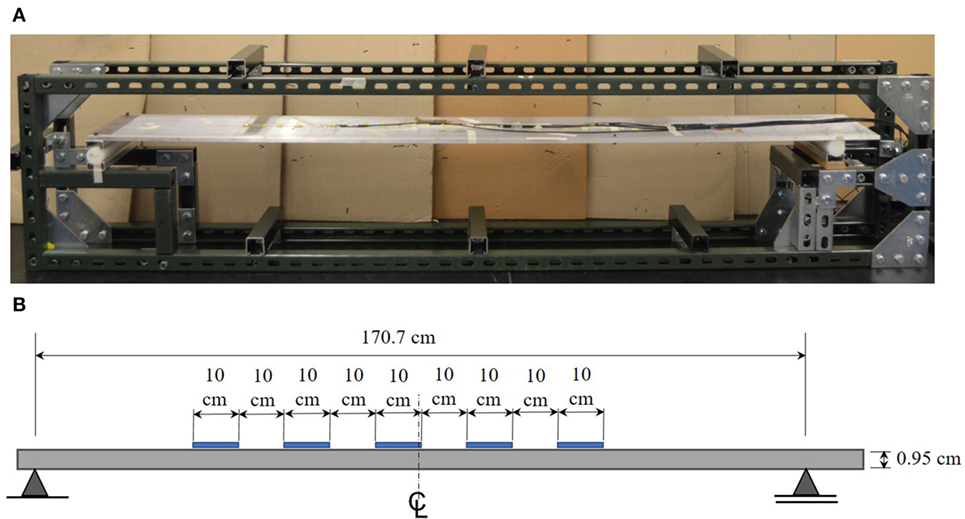
Figure 7. Laboratory setup with small scale aluminum beam: (A) image of simply supported beam experimental set up in laboratory (Kliewer and Glisic (2015)) and (B) schematic of beam dimensions and sensor layout.
4.2. Results
The typical strain response observed in the beam is shown in Figure 8A, where the initial sensor response is used as the reference period, followed by the loading of the beam and finally the free vibration. The NCR method uses only the strain response from the free vibration time period. Using the strain response from the sensors on the beam, the curvature can be determined, such as the example shown in Figure 8B. This is done for each of the sensor locations and for each time step. The FBG sensors are installed along the top surface of the aluminum beam and the height, h, of the beam is known. The strain along the bottom of the beam can be assumed to have the same magnitude and opposite sign to the strain along the top of the beam. The curvature is related to the strain at each location by the following equation where, where κ, r, εt, εb, and ε are the curvature, the radius of curvature, the strain at the top of the beam, the strain at the bottom of the beam, and the strain measured by the sensor.
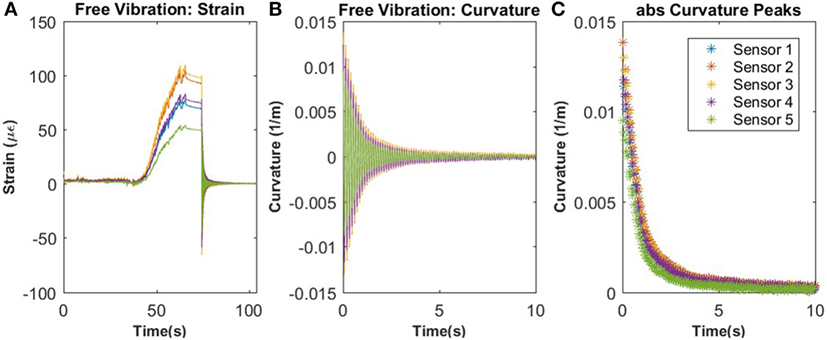
Figure 8. Typical strain and curvature response of aluminum beam during testing: (A) strain response of beam with the initial reference period, followed by the loading of the beam and last the free vibration of the beam; (B) the curvature of the beam during free vibration; (C) the peak curvature values used for analysis of the beam.
Once the curvature response is determined, the peak curvature values are then extracted and used for the remaining analysis of the results, as shown in Figure 8C. Additionally, using the dynamic response of the beam from the strain sensors, it is possible to determine the natural frequency of the beam at each sensor location.
4.3. Experimental NCR
Using the peak curvature values, shown in Figure 8C, the NCR was calculated for the beam for each test performed. In order to obtain NCRij, the curvature at sensor i was plotted against the curvature at sensor j for each boundary condition of the beam. A linear regression can be fit to this relationship and the slope of this regression provides the NCR for these two sensor locations. The NCR for each support condition was determined along with the associated uncertainty and are provided in Figure 9.
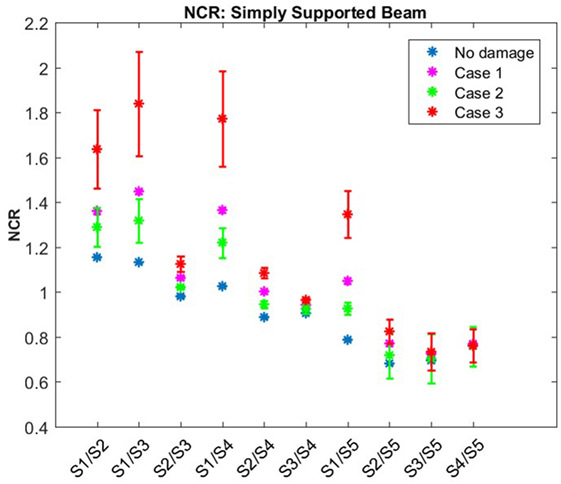
Figure 9. NCRs of aluminum beam in laboratory testing.
A Welch’s t-test was used to compare the statistical difference between the state of the altered support versus the normal roller. For all cases, there is a p-value significantly lower than 0.001. This indicates that for all damage states compared to the normal state, they are statistically different from one another. In Figure 9, there is a clear progression of each of the NCR values as the rotational stiffness of the joint is increased. Similar to the observations made in the analytical case studies, there are some sensor locations that are significantly more sensitive to changes in the rotational stiffness of the support compared to other locations. Again, this highlights the importance of planning the placement of the sensors.
4.4. Rotational Stiffness Analysis
In the tests, it was not possible to directly measure the change in stiffness of the support due to limitations of the testing set-up. However, the change of the stiffness could be determined from the measurements. Using the peak curvature values and the known boundary condition at the left support, where the support is a pin and the curvature equals zero, a line can be fit to these points using the general curvature mode provided in equation (5). When the curvature mode equation is fit to the undamaged support case, the inflection point is found to be located at the same location as the roller support on the beam as expected, as seen in Figure 10A. However, when the curvature mode equation is fit to one of the beams with an altered support state, there is a clear shift in the inflection point of the curvature mode shape to the left of the support, as shown in Figure 10B. This indicates there is a stiffening of the joint and the support now has some moment carrying capacity.
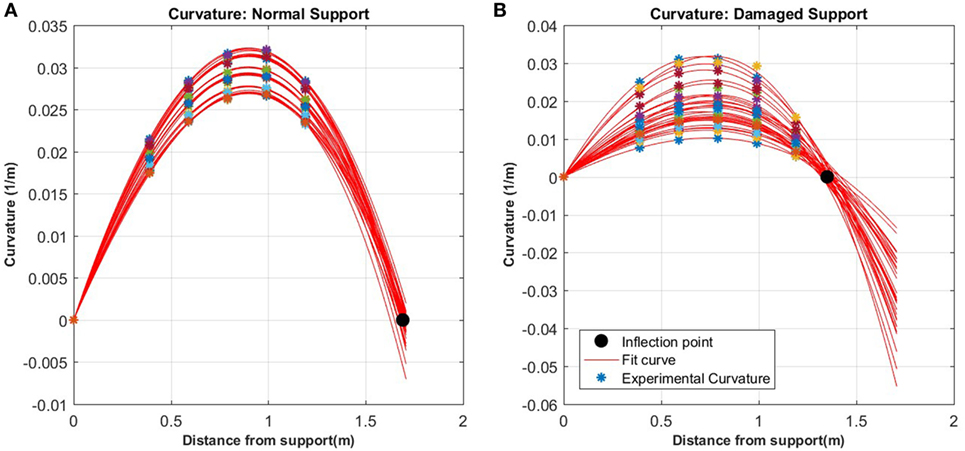
Figure 10. Generic curvature mode shape fit to experimental data for normal support condition (A) versus damaged support condition (B) and the resulting inflection point.
The theoretical relationship between the inflection point and the rotational stiffness of the support was determined for this beam using the methods presented in Section 2.1.2. For the experimental tests, four different support conditions were analyzed: undamaged condition, case 1 with minor damage to support, case 2 with moderate damage to support, and case 3 with major damage to support. For each of the support conditions analyzed, the experimental inflection point was determined through the curvature fitting process. These inflection points are then used to determine the quantitative stiffness of support based on the theoretical model of the beam, as shown in Figure 11. For the undamaged case, the inflection point is located at approximately the same location as the support location and has minimal rotational stiffness, as anticipated. As the stiffness of the support was increased using clamps located at the beam support, there is an increasing shift of the location of the curvature inflection point which corresponds to a higher theoretical rotational stiffness of the support. After successful laboratory testing, the method was applied to a real structure previously instrumented with long-gage FBG sensors, as shown in Section 5.
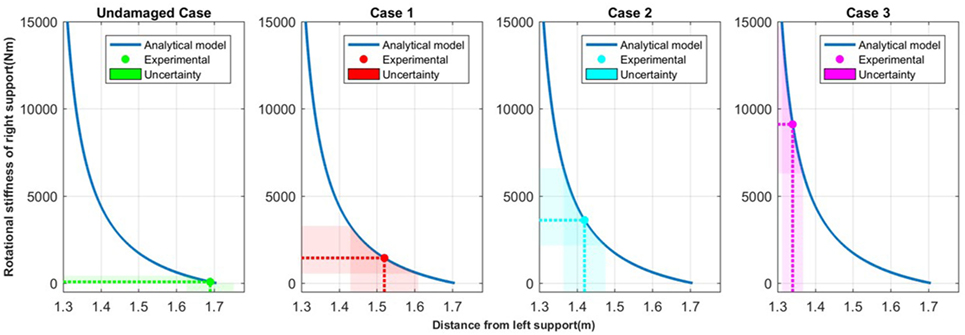
Figure 11. Quantifying the rotational stiffness of support in laboratory tests based on the inflection point of curvature.
5. Real Structure: Highway Overpass
5.1. Description of Structure and Monitoring System
The NCR Method was implemented on a real bridge instrumented with a SHM system in 2011 (within the frame of an earlier project). Preliminary results of the case study (Kliewer and Glisic, 2017) were upgraded with more refined data processing and improved uncertainty calculation, and presented in the following text.
The bridge is located in the United States and the design of the structure is representative of a typical highway overpass that is very common in the United States. Because of this, it provides the opportunity to test SHM methods on a typical structure.
The bridge contains multiple spans and consists of built-up steel girders of varying sizes and concrete deck. The structure is skewed at the north end, providing a unique structural behavior as all girders differ in length. In this research, only the southbound span of the structure was instrumented. Two of the eight girders on the span, girder 2 and girder 5, were instrumented with sensors. On both girders, FBG strain sensors were installed in three locations: the mid span and the quarter spans, as shown in Figure 12. At each location, strain sensors were installed in parallel topology on the top flange and the bottom flange for a total of 6 sensors on each girder. Additionally, a temperature sensor was installed with each strain sensor.
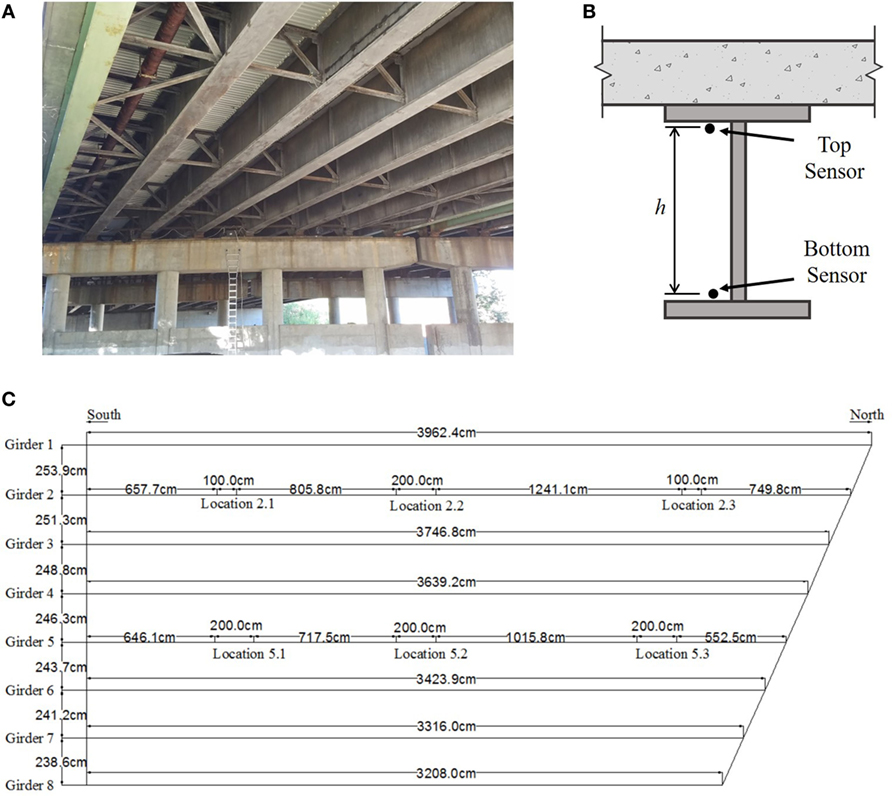
Figure 12. In-service structure utilized in study: (A) View of underside of instrumented bridge span, (B) cross-section of girder with sensor placement, and (C) plan view of bridge span with structure dimensions and sensor layout (Flanigan (2014)).
Since the installation of the monitoring system on the structure, periodic data collection sessions were carried out several times a year, and have been ongoing for almost 6 years. During the data collection sessions, the structure remains in-service and the measurements consist of the strain response of the structure caused by the traffic loading. A total of 28 measurement session have occurred from June 2011 to January 2017. The strain response of the structure was recorded for approximately 1 h for each session and the data are recorded with a sampling rate of 250 Hz. In this paper, the research will focus only on girder 5; however, similar methods were applied to analyze the response from girder 2. A typical strain response for girder 5 of the structure is shown in Figure 13. The strain response from the sensors was filtered using a fourth order Butterworth low-pass filter to remove the higher frequency noise. The figure shows several peak strain responses on the structure, which are the result of passing heavy weight vehicles, followed by periods of free vibration. It is these periods of free vibration that are used in NCR analysis.
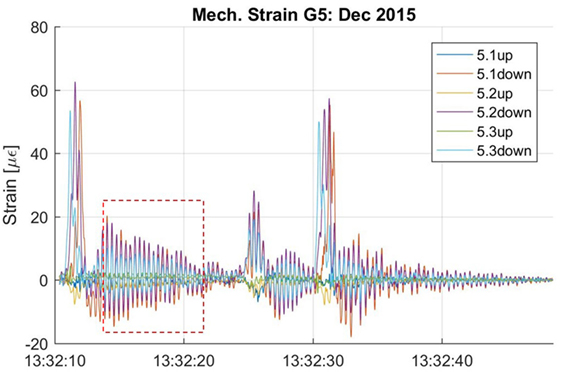
Figure 13. Typical strain response of monitored highway overpass.
5.2. Results
From the strain response from the FBG sensors, the curvature at the locations of the sensors can be calculated using the following equation:
where κ is the curvature, εt is the strain measured at the top of the cross-section, εb is the strain measured at the bottom of the cross-section, and h is the vertical distance between the sensors. Because the data measurements are obtained using existing traffic loading on the overpass, the typical dynamic strain response recorded does not have pure free vibration due to the high traffic volumes. Using the strain response of the structure, a time periods of approximately free vibration can be extracted from the full time history. As an example, the strain response shown in the red box in Figure 13 corresponds to approximately free-vibration (high strain before the box is passage of a heavy vehicle that excites the bridge to vibrate). The NCRs were calculated for each monitoring session along with the associated uncertainty of the values, calculated from uncertainty of the linear regression inherent to NCR method. These NCRs are shown in Figure 14, spanning from June 2011 to December 2016. Since the sensor were installed onto the existing structure with an unknown damage condition, as a means of comparison the theoretical NCRs were determined assuming perfect conditions. This was done by approximating the structure as simply supported and using the equations presented in Section 2.1. These theoretical values are shown in Figure 14. Overall, the NCRs showed no significant change in the values over time, which indicates no significant change of the structural performance could be noticed.
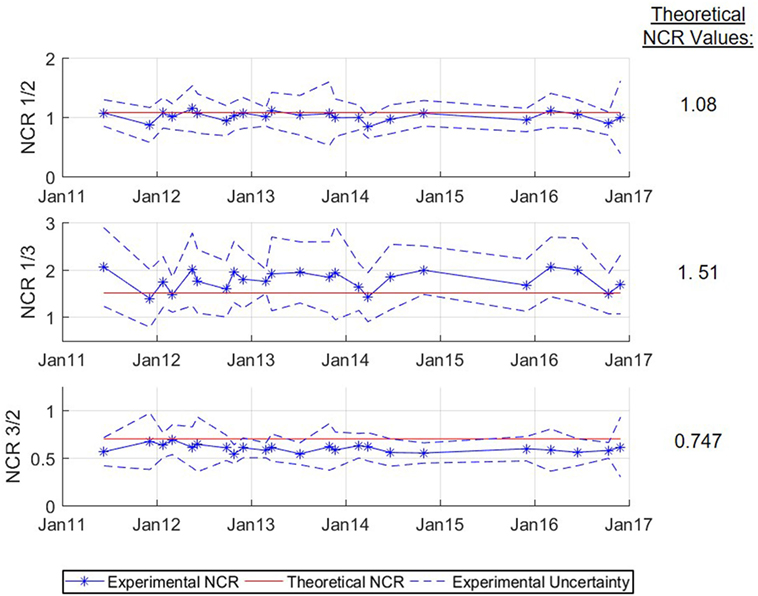
Figure 14. NCR calculated using data collected from the overpass.
There is a reasonably good agreement between the theoretical NCR and the NCR1,2 calculated using sensors at locations 5.1 and 5.2. Similarly, there is reasonable agreement between the theoretical NCR and the NCR1,3 (calculated using sensors at locations 5.1 and 5.3). The final NCR3,2 calculated using sensor location 5.3 (the last quarter span) and 5.2 (the midspan) does not have as strong of an agreement with the theoretical value of NCR, as there are locations where it falls outside of the uncertainty bounds of the results obtained from the FBG sensors. This may indicate existence of unusual behavior around or at location 5.2 or 5.3, and it is coherent with indication of unusual behavior in the structure noted by Sigurdardottir and Glisic (2013) when observing the behavior of the neutral axis of the structure. An analysis similar to the analysis presented in Section 4.3 showed that behavior of the girder 5 is not consistent with the malfunction of supports. However, it was determined that potential delamination between the steel and concrete would reduce the stiffness (EI) of the cross section by 61%. The percent loss in stiffness was determined using the cross-sectional properties of the composite section provided in the engineering design drawings. The stiffness of the section with full composite action was compared to loss of composite action between the concrete deck and steel girder, i.e., to the simple sum of stiffnesses of the two components. The 61% reduction in stiffness would correspond to severe to very severe non-symmetric damage, as per analysis in Section 3.1, which might be theoretically detectable using the NCR (see Figure 4).
A study was also performed by Domaneschi et al. (2017), where a damage detection method was implemented using dynamic curvature data obtained from the same source of data, the series of FBG strain sensors on the highway overpass that is also explored in this paper (Domaneschi et al., 2017). The results of that study reached similar conclusions regarding the condition of the highway overpass, which in part validates the NCR method. However, method presented by Domaneschi et al. needs a finite element model (FEM), whereas the NCR method does not require the FEM, which makes the latter easier to implement and more efficient damage detection method.
6. Conclusion
This paper presents a simplistic SHM method based on dynamic curvature analysis. The method uses the normalized curvature ratio (NCR) as a damage sensitive feature. The method was initially presented through an analytical study of a simply supported beam with two types of damage—reduction of cross-sectional stiffness and malfunction of support. This study illustrated the simplicity of the method and its potential for application in a real structure. However, the study also identified limitations. First, the sensitivity of the method depends on the layout of the strain sensors on the structure, and their relative position with respect to damage. Additionally, the study indicates that the method is sensitive to malfunction of support, while it features relatively low sensitivity in detecting a reduced flexural stiffness occurring in the span of the beam. Finally, the NCR method is based on determination of curvatures and thus it is limited to applications for beam-like structures subjected to bending. The method is not effective for purely axially loaded structures or structures in pure shear deformation. The analysis was then performed on a small-scale laboratory specimen subjected to a change in stiffness in a cross-section (not presented due to space limitations) and in the support. These results were consistent with analytical study. They confirmed low sensitivity to reduction of cross-sectional stiffness, and demonstrated the ability to use the NCRs as a damage sensitive feature for detection of stiffening of the support, and the ability to quantify the rotational stiffness of the support based on the dynamic strain measurements. Finally, the method was applied to a real, in-service highway overpass which was instrumented with a series of FBG strain sensors and periodically monitored. From the dynamic strain measurements on the structure, the NCRs were successfully calculated and compared with the theoretical NCR values. Comparison indicated existence of unusual behavior that is consistent with previous works based on analysis of the neutral axis. Also, it pointed that although the method features low sensitivity to reduction of cross-sectional stiffness, it can successfully be applied to composite structures, as delamination between the steel and concrete actually significantly reduces the cross-sectional stiffness. An additional advantage of this method is the use of the free vibration response of a structure. This means the method is independent of the magnitude of load applied, does not require temperature compensation, and allows the structure to remain unperturbed (in-service, with no restriction to traffic) during the data acquisition.
Author Contributions
KK had substantial contributions to the creation of methods and analysis and interpretation of data; she drafted the paper. BG advised and supervised the work, revised the draft of the paper, and approved the final version to be submitted. Both authors are accountable for all aspects of the work.
Conflict of Interest Statement
The authors declare that the research was conducted in the absence of any commercial or financial relationships that could be construed as a potential conflict of interest.
The reviewer, VD, and handling editor declared their shared affiliation, and the handling editor states that the process nevertheless met the standards of a fair and objective review.
Acknowledgments
The authors would like to thank the following individuals for their assistance with this research: Corrie Kavanaugh, Dorotea Sigurdardottir, Dennis Smith, and Joe Vocaturo. The project on the US202/NJ23 highway overpass in Wayne has been realized with the important support, great help and kind collaboration of several professionals and companies. The authors would like to thank SMARTEC SA, Switzerland; Drexel University, in particular Professor Emin Aktan, Professor Frank Moon (now at Rutgers University), and graduate student Jeff Weidner (now Assistant Professor at University of Texas, El Paso); New Jersey Department of Transportation (NJDOT), and in particular Nat Kasbekar and Eddy Germain; Long-Term Bridge Performance (LTBP) Program of Federal Highway Administration; PB Americas, Inc., Lawrenceville, NJ, in particular Mr. Michael S Morales, LTBP Site Coordinator; Rutgers University, in particular Professors Ali Maher and Nenad Gucunski; All IBS partners; and Kevin the lift operator. The authors would also like to thank Yao Yao who helped with the sensor installation.
Funding
This material is based upon work supported by NSF GRFP Grant No. 1148900, NSF CMMI-1362723, and USDOT-RITA DTRT12-G-UTC16. Any opinions, findings, and conclusion or recommendations expressed herein are those of the authors and do not necessarily reflect the views of the funding agencies.
References
Antunes, P., Travanca, R., Rodrigues, H., Melo, J., Jara, J., Varum, H., et al. (2012). Dynamic structural health monitoring of slender structures using optical sensors. Sensors 12, 6629–6644. doi: 10.3390/s120506629
ASCE. (2017). Report Card for America’s Infrastructure. Available at: http://www.infrastructurereportcard.org/
Carden, E. P., and Fanning, P. (2004). Vibration based condition monitoring: a review. Struct. Health Monit. 3, 355–377. doi:10.1177/1475921704047500
Chance, J., Tomlinson, G., and Worden, K. (1994). “A simplified approach to the numerical and experimental modeling of the dynamics of a cracked beam,” in Proceedings of 12th International Modal Analysis Conference (Honolulu: SEM).
Davis, S. L., Goldberg, D., DeGood, K., Donohue, N., and Corless, J. (2013). The Fix We’re in For: The State of Our Nation’s Bridges 2013. Washington, DC: Transportation for America.
Doebling, S. W., Farrar, C. R., Prime, M. B., et al. (1998). A summary review of vibration-based damage identification methods. Shock Vibr. Digest 30, 91–105. doi:10.1177/058310249803000201
Doebling, S. W., Farrar, C. R., Prime, M. B., and Shevitz, D. W. (1996). Damage identification and health monitoring of structural and mechanical systems from changes in their vibration characteristics: a literature review. Los Alamos, New Mexico: Los Alamos National Laboratory, LA-13070-MS.
Domaneschi, M., Sigurdardottir, D., and Glisic, B. (2017). Damage detection on output-only monitoring of dynamic curvature in composite decks. Struct. Monit. Maint. 4, 1–15. doi:10.12989/smm.2017.4.1.001
Fan, W., and Qiao, P. (2011). Vibration-based damage identification methods: a review and comparative study. Struct. Health Monit. 10, 83–111. doi:10.1177/1475921710365419
Flanigan, K. (2014). Determination of Deformed Shape from Dynamic Long-Gage Strain Measurements. Senior Thesis Princeton University.
Glisic, B., and Inaudi, D. (2007). Fibre Optic Methods for Structural Health Monitoring. West Sussex: John Wiley & Sons.
Hubbell, D., and Glisic, B. (2013). Detection and characterization of early-age thermal cracks in high-performance concrete. ACI Mater. J. 110, 323–330. doi:10.14359/51685666
Kliewer, K., and Glisic, B. (2015). “A curvature based approach in dynamic monitoring using long-gage fiber optic sensors,” in AESEANCRISST. 6th International Conferene on Advances in Experimental Structural Engineering, Urbana-Champaign.
Kliewer, K., and Glisic, B. (2017). “Application of the normalized curvature ratio to an in-service structure,” in SPIE Smart Structures and Materials+ Nondestructive Evaluation and Health Monitoring (Portland: International Society for Optics and Photonics), 101702K.
Nandan, H., and Singh, M. P. (2014). Effects of thermal environment on structural frequencies: part I–A simulation study. Eng. Struct. 81, 480–490. doi:10.1016/j.engstruct.2014.07.042
National Bridge Inspection Standards (NBIS). (1996). Code of Federal Regulations, No. 23CFR650. Washington, DC: U.S. Government Printing Office.
Pandey, A., Biswas, M., and Samman, M. (1991). Damage detection from changes in curvature mode shapes. J. Sound Vibr. 145, 321–332. doi:10.1016/0022-460X(91)90595-B
Phares, B. M., Washer, G. A., Rolander, D. D., Graybeal, B. A., and Moore, M. (2004). Routine highway bridge inspection condition documentation accuracy and reliability. J. Bridge Eng. 9, 403–413. doi:10.1061/(ASCE)1084-0702(2004)9:4(403)
Pozzi, M., Zonta, D., Wu, H., and Inaudi, D. (2008). Development and laboratory validation of in-line multiplexed low-coherence interferometric sensors. Opt. Fiber Technol. 14, 281–293. doi:10.1016/j.yofte.2008.01.006
Quaranta, G., Carboni, B., and Lacarbonara, W. (2016). Damage detection by modal curvatures: numerical issues. J. Vibr. Control 22, 1913–1927. doi:10.1177/1077546314545528
Salawu, O. (1997). Detection of structural damage through changes in frequency: a review. Eng. Struct. 19, 718–723. doi:10.1016/S0141-0296(96)00149-6
Shi, Z., Law, S., and Zhang, L. (1998). Structural damage localization from modal strain energy change. J. Sound Vibr. 218, 825–844. doi:10.1006/jsvi.1998.1878
Shi, Z., Law, S., and Zhang, L. (2000). Damage localization by directly using incomplete mode shapes. J. Eng. Mech. 126, 656–660. doi:10.1061/(ASCE)0733-9399(2000)126:6(656)
Sigurdardottir, D., and Glisic, B. (2013). Neutral axis as damage sensitive feature. Smart Mater. Struct. 22, 075030. doi:10.1088/0964-1726/22/7/075030
Sohn, H., Farrar, C. R., Hemez, F. M., Shunk, D. D., Stinemates, D. W., Nadler, B. R., et al. (2003). A Review of Structural Health Monitoring Literature: 1996–2001. USA: Los Alamos National Laboratory.
USDOT. (2015). Deficient Bridges by Highway System 2015. FHWA National Bridge Inventory. Available at: https://www.fhwa.dot.gov/Bridge/nbi/no10/defbr15.cfm
Wahab, M. A., and De Roeck, G. (1999). Damage detection in bridges using modal curvatures: application to a real damage scenario. J. Sound Vibr. 226, 217–235. doi:10.1006/jsvi.1999.2295
Yang, M., Zhong, H., Telste, M., and Gajan, S. (2016). Bridge damage localization through modified curvature method. J. Civ. Struct. Health Monit. 6, 175–188. doi:10.1007/s13349-015-0150-7
Zonta, D., Elgamal, A., Fraser, M., and Priestley, M. N. (2008). Analysis of change in dynamic properties of a frame-resistant test building. Eng. Struct. 30, 183–196. doi:10.1016/j.engstruct.2007.02.022
Keywords: structural health monitoring, curvature, dynamic strain, FBG sensor, damage sensitive feature
Citation: Kliewer K and Glisic B (2017) Normalized Curvature Ratio for Damage Detection in Beam-Like Structures. Front. Built Environ. 3:50. doi: 10.3389/fbuil.2017.00050
Received: 29 March 2017; Accepted: 02 August 2017;
Published: 30 August 2017
Edited by:
Eleni N. Chatzi, ETH Zurich, SwitzerlandReviewed by:
Vasilis K. Dertimanis, ETH Zurich, SwitzerlandHarsh Nandan, SC Solutions, United States
Copyright: © 2017 Kliewer and Glisic. This is an open-access article distributed under the terms of the Creative Commons Attribution License (CC BY). The use, distribution or reproduction in other forums is permitted, provided the original author(s) or licensor are credited and that the original publication in this journal is cited, in accordance with accepted academic practice. No use, distribution or reproduction is permitted which does not comply with these terms.
*Correspondence: Kaitlyn Kliewer, kkliewer@princeton.edu