Overview of Ground-Motion Issues for Cascadia Megathrust Events: Simulation of Ground-Motions and Earthquake Site Response
 Hadi Ghofrani
 Gail M. Atkinson
 Sheri Molnar
- Department of Earth Sciences, Western University, London, ON, Canada
Ground motions for earthquakes of M7.5 to 9.0 on the Cascadia subduction interface are simulated based on a stochastic finite-fault model and used to estimate average response spectra for reference firm soil conditions. The simulations are first validated by modeling the wealth of ground-motion data from the 2011 M9.0 Tohoku earthquake of Japan. Adjustments to the calibrated model are then made to consider average source, attenuation and site parameters for the Cascadia region. This includes an evaluation of the likely variability in stress drop for large interface earthquakes and an assessment of regional attenuation and site effects. We perform best-estimate simulations for a preferred set of input parameters. Typical results suggest mean values of 5%-damped pseudoacceleration in the range from about 100 to 200 cm/s2, at frequencies from 1 to 4 Hz, for firm-ground conditions in Vancouver. Uncertainty in most-likely value of the parameter representing stress drop causes variability in simulated response spectra of about ±50%. Uncertainties in the attenuation model produce even larger variability in response spectral amplitudes—a factor of about two at a closest distance to the rupture plane (Rcd) of 100 km, becoming even larger at greater distances. It is thus important to establish the regional attenuation model for ground-motion simulations and to bound the source properties controlling radiation of ground motion. We calculate theoretical one-dimensional spectral amplification estimates for four selected Fraser River Delta sites to show how the presence of softer sediments in the region may alter the predicted ground motions. The amplification functions are largely consistent with observed spectral amplification at Fraser River delta sites, suggesting amplification by factors of 2.5–5 at the peak frequency of the site; we note that deep sites in the delta have a low peak frequency, ∼0.3 Hz. This work will aid in seismic hazard assessment and mitigation efforts in the active Cascadia region of southwestern BC. An important consideration is that the uncertainties are large and present a dominant unknown when assessing seismic risk. We find that variability in the expected motions exceeds a factor of two even on rock-like sites, with uncertainty in site response further increasing this factor. Such large uncertainties pose a major challenge in preparing for the potential consequences of the next megathrust event in Cascadia.
Introduction
Megathrust interplate earthquakes in a subduction zone cause catastrophic damage and loss to modern society. The 2004 M9.1 Indian Ocean (Sumatra-Andaman) earthquake, the 2010 M8.8 Maule, Chile, earthquake, and the 2011 M9.0 Tohoku earthquake are recent examples of such tragic events. Ground motions due to megathrust earthquakes may cause widespread collapse of buildings and infrastructure and disrupt essential lifeline services (Goda and Tesfamariam, 2017). To mitigate seismic risk due to subduction earthquakes, it is important to take into account the effects due to both ground shaking and tsunami (Geist, 2005; De Risi and Goda, 2016; Goda et al., 2016).
The Cascadia subduction zone is one of the major subduction regions around the world, extending from Vancouver Island to Northern California (Hyndman and Wang, 1995; Flück et al., 1997; Hyndman et al., 2003; Wang et al., 2003). The zone spans more than 1,000 km in the North-South direction, whereas its width varies depending on the latitude (about 100–200 km). The tsunami observations in Japan and tsunami modeling by Satake et al. (2003) indicate that the most recent Cascadia event occurred in 1,700 and its moment magnitude is estimated as M9.0 (M8.7 to M9.2). Paleoseismic investigations of marine sediments/turbidites on/off the coast indicate that the mean recurrence period of the Cascadia subduction event ranges from 500 to 600 years (typically around 530 years) with large variability (Adams, 1990; Atwater et al., 2004; Mazzotti and Adams, 2004; Goldfinger et al., 2008, 2012). Preparation for the next megathrust Cascadia subduction event is critical. Risk mitigation measures include design and retrofitting of buildings and infrastructure, including coastal defense structures, and development of emergency management protocols. These measures require realistic estimates of the potential effects of such events.
This study focuses on estimation of ground motions from a Cascadia megathrust event and their uncertainty, using a stochastic finite fault algorithm known as EXSIM (Motazedian and Atkinson, 2005; Atkinson et al., 2009; Boore, 2009). EXSIM uses a simple representation of seismic source and path effects to simulate ground motion time-histories. The fault rupture of a large earthquake is modeled as a collection of smaller point sources. By summing the effects of individual ruptures with appropriate time delays at the observation point, overall ground motion at a site of interest, resulting from the entire fault plane, can be generated. The simulated time-histories are the fundamental input to advanced earthquake engineering applications (e.g., seismic design, non-linear dynamic analysis, and seismic loss estimation).
Previous simulations of Cascadia ground motions based on a stochastic finite-fault model were performed by Gregor et al. (2002) and Atkinson and Macias (2009). In this study, we calibrate model components of the Cascadia-EXSIM model by using the 2011 M9.0 Tohoku ground motion data, because this is the best-recorded megathrust event of comparable size. We first ensure the model can reproduce overall characteristics of the 2011 Tohoku ground motions including amplitudes, duration and attenuation of the mainshock and aftershocks. For the information on the Tohoku event, we reference a number or sources. Goda et al. (2012) provides an overview of the motions. The source rupture process, involving multiple asperities, was described by Kurahashi and Irikura (2011) and Irikura and Kurahashi (2012) among others. Site effects were investigated by Ghofrani et al. (2012). Previous simulations of the Tohoku event using EXSIM are described by Ghofrani et al. (2013).
The calibrated Tohoku-EXSIM model can be adjusted for the Cascadia subduction events by accounting for regional differences of attenuation of ground shaking and site effects. Selection of attenuation parameters for EXSIM is guided by regional ground motion studies for southwestern British Columbia by Atkinson (2005) and Babaie Mahani and Atkinson (2013). Site amplification factors for sites in the greater Vancouver area, including the Fraser River Delta, are derived using regional shear-wave velocity data and geological information (Britton et al., 1995; Hunter et al., 1998; Cassidy and Rogers, 2004). Using the developed shear-wave profiles for the selected sites, we calculate theoretical one-dimensional (1D) spectral amplification estimates using Thomson-Haskell’s approach (Thomson, 1950; Haskell, 1953) for selected Fraser River Delta sites to show how the presence of softer sediments in the region may alter the predicted ground motions, relative to those for reference firm soil conditions (site class B/C or Vs30 of 760 m/s). This will provide an overview level of ground motions in the region and their uncertainty, that can be further refined in the future.
The simulations are used to calculate ground-motion parameters [5%-damped pseudospectral acceleration (PSA)] for developing regional ground-motion prediction equations (GMPEs) for Cascadia interface events. We compare these to other GMPEs (Gregor et al., 2002; Atkinson and Boore, 2003; Zhao et al., 2006; Somerville et al., 2008; Atkinson and Macias, 2009; Ghofrani and Atkinson, 2013; Abrahamson et al., 2016) and draw conclusions on further required studies.
Stochastic Finite-Fault Modeling: EXSIM
The stochastic finite-fault method of Motazedian and Atkinson (2005) (i.e., EXSIM) subdivides an earthquake fault plane into a grid of subsources, and assigns a stochastic point source to each of them (i.e., a stochastic Green’s function). Each subsource is activated once, with an appropriate delay time based on rupture propagation from the hypocenter to the subsource. In this study, stochastic finite-fault modeling is implemented by incorporating modifications suggested by Boore (2009) [see also Atkinson et al. (2009)]. The modifications improved the performance of EXSIM in several ways: (i) scaling of high-frequency motions are based on the integral of squared acceleration spectrum, rather than velocity spectrum; (ii) there is no truncation of subsource time-history data, which avoids bias in long-period motions introduced by filtering (Boore, 2005a); and (iii) the performance in the low-frequency range is improved.
For each subsource, a stochastic point source waveform with an underlying Brune ω2-source spectrum (Brune, 1970, 1971) is generated; the model spectrum for a point source is derived by multiplication of source, path, and site spectra in the frequency domain (Boore, 1983, 2003). Following Brune (1970), the far-field displacement spectrum of a finite source is flat (proportional to M0) at low frequencies while at frequencies above the corner frequency (fc) it decays as ω−2; by contrast, the acceleration spectrum is flat at high frequencies, and decays as ω−2 at frequencies below the corner frequency. The acceleration spectrum of a point source can be given by (Boore, 1983, 2003):
where A(M0, f), P(R, f), and G(f) represent the source, path, and site spectra, respectively; M0 is the seismic moment in dyne-cm; R is hypocentral distance; and f is frequency.
The source spectrum is based on the Brune model (Brune, 1970), and its Fourier acceleration spectrum is calculated as (Boore, 1983, 2003):
where Rθϕ is the average radiation pattern over a sphere and equals 0.55; F is the free surface amplification and equals 2.0; V is the partition of energy into two horizontal components and equals 0.71; ρs is the density (gm/cm3); βs is the shear-wave velocity (in km/s); fc is the corner frequency and is given by fc = 4.9 × 10⁶βs(Δσ/M0)1/3, in which Δσ is the stress drop in bars. The path effect P(R, f), including both geometrical spreading and anelastic attenuation, needs to be specified by an appropriate regional model. The site effect G(f) includes the site amplification factor and the near-surface high-frequency diminution effects, typically modeled by the kappa parameter (Anderson and Hough, 1984).
The normalized and delayed subsource contributions are summed in the time domain as:
where A(t) is the total seismic signal at site, Hi is the normalization factor for the ith subsource that aims to conserve energy, Ai(t) is the signal of the ith subsource activation, N is the total number of subsources, Δti is the fracture initiation and wave propagation delay time of the subsource, and Ti is a fraction of rise time entered for further randomization. For each subsource, seismic moment M0i, corner frequency fci, and normalization factor Hi need to be specified. The moment of a subsource is derived from the total moment and the slip distribution:
where si is the slip of the ith subsource. EXSIM determines the corner frequency of newly activated elements based on a dynamic corner frequency concept (Motazedian and Atkinson, 2005), in which the frequency content of the radiated seismic waves shifts to lower frequencies as the rupture area grows. This process continues until the active rupture surface reaches a predefined limiting fraction of the fault area; after this fraction is reached, the corner frequency of newly activated subsources remains constant. Mathematically, the corner frequency of a subsource is given by:
where NR is the total number of active subsources at the time of the ith subsource activation, and Fpulse is the maximum fraction of the fault area for active rupture.
The normalization factor Hi is given by:
where f0 is the corner frequency of the entire fault, fj is the jth frequency ordinate, and f0i is the corner frequency of the ith subsoruce. The high-frequency energy radiated from all subsources is assumed to be equal, with the sum being constrained by the total high-frequency energy of the earthquake, as implied by its Fourier spectral acceleration amplitude level at high frequencies.
The use of the dynamic corner frequency allows subsources to generate a range of low-frequency to high-frequency spectra, such that the final waveform of the simulation will contain sufficient low-frequency energy even if a very small subsource size is chosen. The scaling of the source spectrum based on the normalization factor forces the method to generate a constant amount of energy, no matter how many subsources are contributed in the summation. In other words, the use of the dynamic corner frequency and the normalization factor based on the squared acceleration spectrum make the spectral shape and spectral level of the resultant accelerograms relatively independent of subsource size.
Calibration of EXSIM for the Tohoku Earthquake
The source characteristics of a megathrust subduction earthquake are complex and have significant impact on generated ground motions. Such complex features were highlighted during the 2011 Tohoku earthquake in Japan by observations of multiple phases of seismic wave arrivals due to local asperities, referred to as strong-motion generation areas (SMGAs) (Kurahashi and Irikura, 2011; Goda et al., 2012). Another important aspect of the Tohoku event was its remarkable site effects, leading to significant site amplification at high frequency (with little soil non-linearity), as pointed out by Ghofrani et al. (2012). From a ground-motion modeling viewpoint, the Tohoku earthquake provides an excellent and unique opportunity for detailed calibration and validation of simulation methods, due to the hundreds of high-quality ground motion records from the K-NET and KiK-net arrays. No other M9.0 events have a comparable wealth of data.
Finite-fault ground-motion modeling of the 2011 Tohoku earthquake, using EXSIM, was carried out by Ghofrani et al. (2013), providing a useful calibration exercise. Notable features of the analysis included: (i) regional attenuation models for fore-arc and back-arc sites were taken into account (Ghofrani and Atkinson, 2011); (ii) detailed investigations of site effects were incorporated by analyzing borehole and surface motions at the KiK-net sites (Ghofrani et al., 2012); and (iii) source characteristics (e.g., stress drop and rupture geometry) were modeled through both single-rupture and multiple-rupture approaches. The single-rupture model uses a rectangular fault plane, determined by source inversion analysis, using teleseismic and GPS data (Geospatial Information Authority of Japan, 2011; Shao et al., 2011). In EXSIM, an average stress drop is assigned to all subsources, while the slip distribution may be uniform, random, or specified for individual subsources. This provides limited flexibility in matching key features of strong ground motion from a megathrust earthquake at various locations. The study of Ghofrani et al. (2013) extended EXSIM to allow for multiple-rupture scenarios which can account for local SMGAs, which are distributed over the background fault plane. This is accomplished by triggering multiple EXSIM simulations that incorporate local features of the rupture, thus allowing different stress drops and moment magnitudes to be assigned to individual asperities. The generated seismic waves from different asperities are modified in the frequency domain using matching filters (to avoid double-counting of low-frequency content) and are summed up in the time domain with appropriate delays. This approach was used to implement the SMGA model of Kurahashi and Irikura (2011) suggested five SMGAs in their model of the Tohoku source, achieving reasonable agreement between real data and simulated ground motions based on the empirical Green’s function (EGF) method of Kamae et al. (1998). The difference between the EGF method and the multiple-rupture EXSIM method is that the EGF method uses carefully chosen events (either aftershocks or previous smaller events in the same region) to represent path effects, whereas EXSIM adopts a stochastic point source representation in modeling earthquake rupture and seismic wave propagation from individual subsources. Figure 1 shows the locations of the five SMGAs with respect to the fault plane and also selected times-series from stations located parallel to the strike of the event to depict the complexities of waveforms and multiple phase arrivals. The detailed descriptions of the multiple-rupture EXSIM method can be found in Ghofrani et al. (2013).
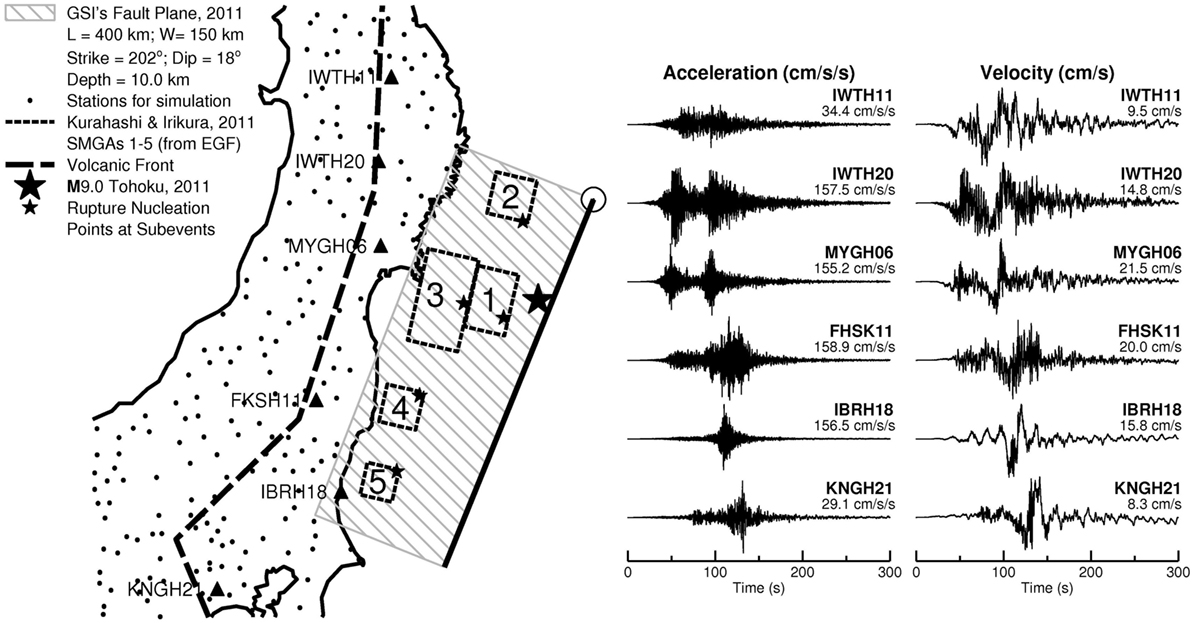
Figure 1. Map showing Tohoku fault plane and stations used for the EXSIM simulations (black dots) at closest distance from the fault plane (Rcd) ranging from 41 to 420 km. Graphical representation of the background fault plane for the mainshock, adopted from GSI (2001) finite-fault model, hatched rectangle. Hypocenter of the mainshock, large star close to the trench. Five asperities from empirical Green’s function (EGF) simulations (Kurahashi and Irikura, 2011), dashed rectangles; the star in each strong-motion generation area (SMGA) shows the nucleation point in each asperity. Details of the source model are given in Table 1. Observed time histories of ground motion (acceleration and velocity) at selected stations (triangles on the map). Numbers at the end of traces are the peak ground accelerations and velocities, respectively.
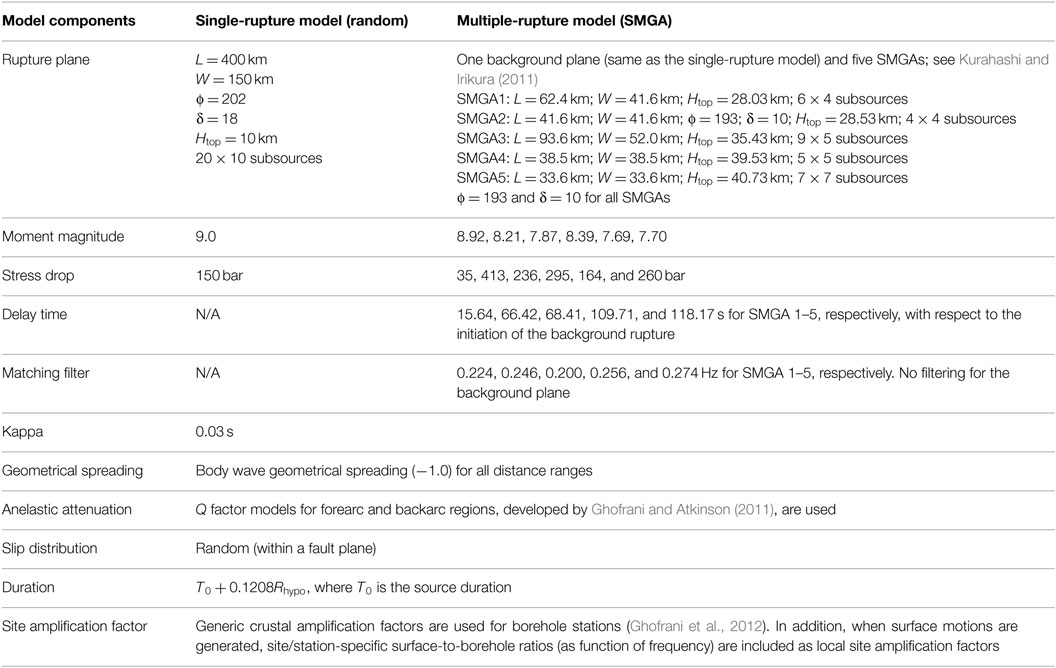
Table 1. Input parameters of Tohoku-EXSIM simulations (Ghofrani et al., 2013).
Table 1 summarizes input parameters of the Tohoku-EXSIM simulations (Ghofrani et al., 2013). The geometrical parameters of the background fault plane (fault length L, fault width W, strike ϕ, dip δ, and depth to the top of the fault plane Htop) are adopted from GSI (2011), whereas the geometrical parameters of five SMGAs as well as their source parameters (i.e., moment magnitude and stress drop) are adopted from Kurahashi and Irikura (2011). The path and site parameters, such as kappa, attenuation models, duration, and site amplification factors (both crustal and near-surface) are obtained from empirical investigations (Ghofrani and Atkinson, 2011; Ghofrani et al., 2012). We consider both single-rupture and multiple-rupture models, assuming a random slip distribution (within a fault plane) for both cases (see Ghofrani et al. (2013) for more results). It is noteworthy than the stress parameters for the single-rupture and multiple-rupture models, and corner frequencies of the matching filter for the multiple-rupture model have been calibrated against real records by minimizing the overall bias of model prediction (Ghofrani et al., 2013).
Figure 2 compares the performance of EXSIM in predicting response spectra and acceleration time series at two representative stations, for the two considered source-rupture models. Single-rupture models with random and prescribed slips tend to over-predict the observed PSA at low frequencies and require a relatively high stress parameter, of ∼150 bar (15 MPa), to match the high frequencies. By contrast, the multiple-rupture model (background fault + five SMGAs) produces an excellent match of the observed and simulated PSA over all frequency ranges for most of the selected stations. The multiple-rupture model also provides much more realistic time series; the required stress parameter for the background fault is 35 bar (3.5 MPa) to match the spectra at high frequencies. Detailed validation results in terms of peak linear and non-linear structural responses at different KiK-net stations can be found in Goda et al. (2015). The validation based on non-linear structural responses ensures that the simulated time-histories from the multiple-rupture SFF method can be substituted for real strong motion records in non-linear dynamic analysis and therefore are useful for evaluating the seismic performance of structures.
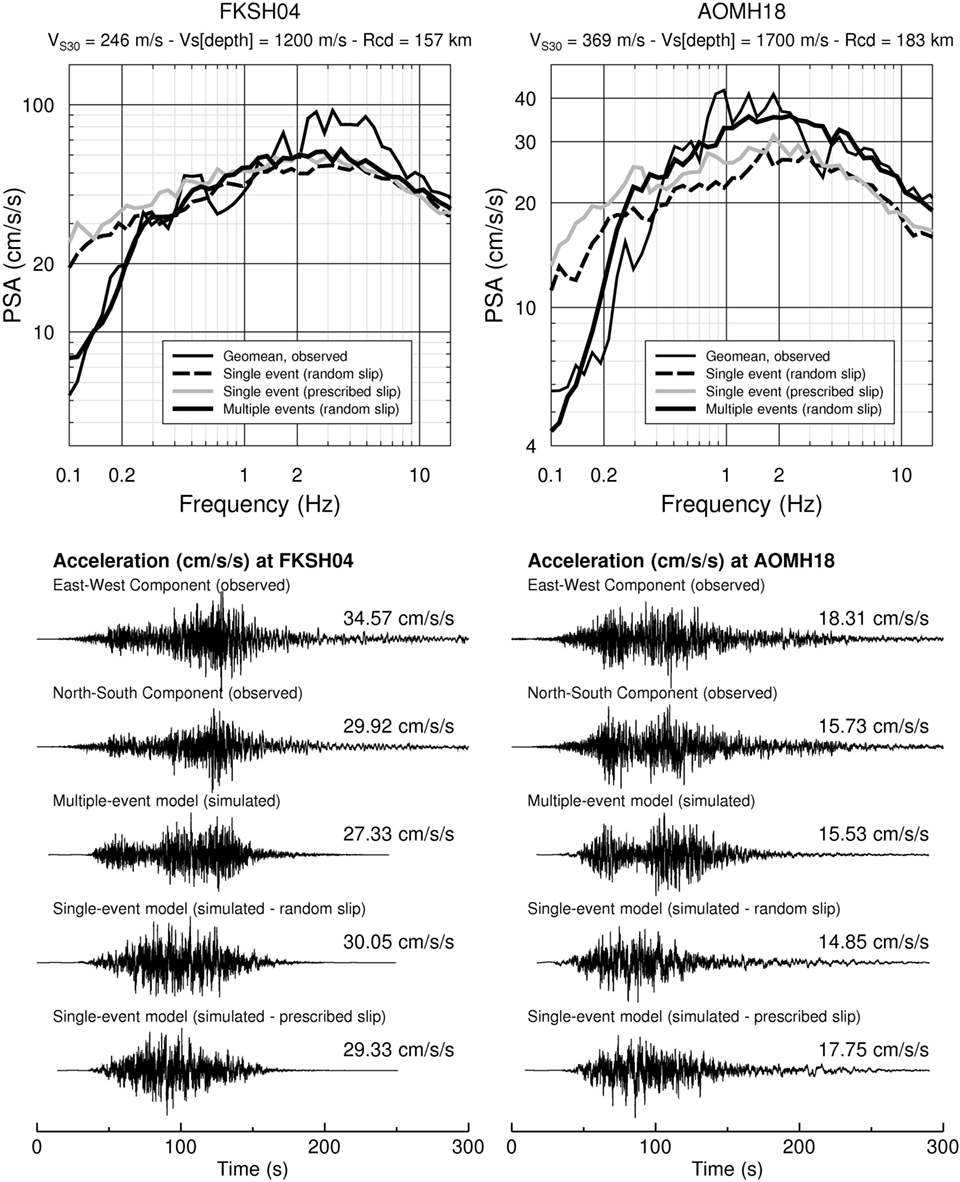
Figure 2. Comparison of observed (borehole) and simulated pseudospectral acceleration (PSA) for two selected stations. Simulated PSAs are the average of 30 trials for each case (single-rupture models with random and prescribed slip, and multiple-rupture model). Depths of borehole installation for FKSH04 and AOMH18 are 268 and 100 m, respectively.
We use the simulations for Tohoku as a starting point for a M9.0 event in Cascadia, recognizing that the multiple-rupture model may be less appropriate for this application due to the lack of knowledge concerning the details of future events along the Cascadia subduction interface. For the single-rupture model, the value assumed for the stress parameter is important to the generated high-frequency ground motion content. It is difficult to make definitive comparisons of stress parameter between this and other studies, as the stress parameter is model dependent (Atkinson et al., 2009) and is intertwined with attenuation and site parameters. Atkinson and Macias (2009) report average values of ∼170 bar for Chilean and Japanese earthquakes, with a value of 120 bar for the 2008 Tokachi-Oki mainshock. For the 2011 Tohoku event, the value is ∼150 bar for the single-rupture model.
Model Parameters for Cascadia Interface Simulations
The main simulation parameters include the fault rupture model, the geometrical spreading and anelastic attenuation model, and the site response model. In this study, we generate ground motion for a reference site condition and use time-domain non-linear modeling to determine the site response from the bedrock to the surface. In the following, we discuss the input model parameters for the simulations.
Fault Rupture Model
The Cascadia subduction zone stretches over more than 1,000 km from Vancouver Island to northern California, along the plate boundary between the oceanic Juan de Fuca and Gorda plates and the continental North American plate. The geodetic convergence rate is typically about 35–40 mm/year (Flück et al., 1997; Wang et al., 2003). Along the down-dip direction, the interface gradually becomes steeper. This subduction zone hosts megathrust M9.0 events, as indicated by various sources of evidence including tsunami, liquefaction, and paleoseismic investigations (Adams, 1990; Satake et al., 2003; Atwater et al., 2004; Goldfinger et al., 2012). The subduction zone is considered to be “locked” at the shallow plate interface, which is constrained by the geothermal conditions of crustal rocks (150–350°C; Hyndman and Wang, 1995; Flück et al., 1997). To the landward side of the locked zone there is a “transition” zone, where the temperature is estimated between 350 and 450°C. The combined area of the locked and transition zones is often taken as the seismogenic rupture plane. The uncertainty in defining the down-dip limit of the rupture area affects seismic hazard and risk assessment, as it determines the proximity of the rupture to the centers of populations (e.g., Vancouver and Victoria).
Several fault plane models have been proposed for the Cascadia subduction zone, including the 2008 USGS model (Frankel and Petersen, 2008a,b) and the 2012 GSC model (Adams et al., 2012; Rogers et al., 2015), as shown in Figure 3. These models are rather similar, with the main difference that will be important being how close the rupture area comes to cities on-land. The USGS model was adopted in the 2008 USGS National Seismic Hazard Maps, while the 2012 GSC model was adopted in the 2015 National Building Code of Canada hazard maps. The geometry of the fault plane is mainly based on 3D dislocation models by Flück et al. (1997) and Wang et al. (2003), which were updated by McCrory et al. (2006), to incorporate information from new seismic reflection/refraction studies.
Figure 3. Fault plane geometry of the 2008 USGS model (Frankel and Petersen, 2008a,b) and the 2012–2015 GSC model (Adams et al., 2012; Rogers et al., 2015). (Left) Map of the Cascadia megathrust, showing (as colored lines) the eastern edge of earthquake rupture zones. The light gray lines indicate the subduction interface from McCrory et al. (2004). (Right) Expected rupture zone of great megathrust earthquakes (in green) that is currently stuck and accumulating strain. The pink area is the approximate region of stick-slip behavior called Episodic Tremor and Slip (ETS).
In the Cascadia-EXSIM model, a complex rupture surface is represented by a rectangular plane, such as the thick dotted lines shown in Figure 4. In order to simulate a curved rupture plane, portions of the rectangle can be assigned zero slip. The slip model illustrated in Figure 4 considers the combined area of the locked and transition zones off the State of Washington (latitude between 46.5 and 48.5°). For subsources beyond the down-dip limit of the transition boundary, a negligible relative slip value is assigned, resulting in near-zero slip and energy. (Note: in EXSIM, the length, width, strike, dip, moment magnitude, stress drop, fault plane discretization, and relative slip distribution are specified, from which absolute values of the slip distribution are computed internally.)
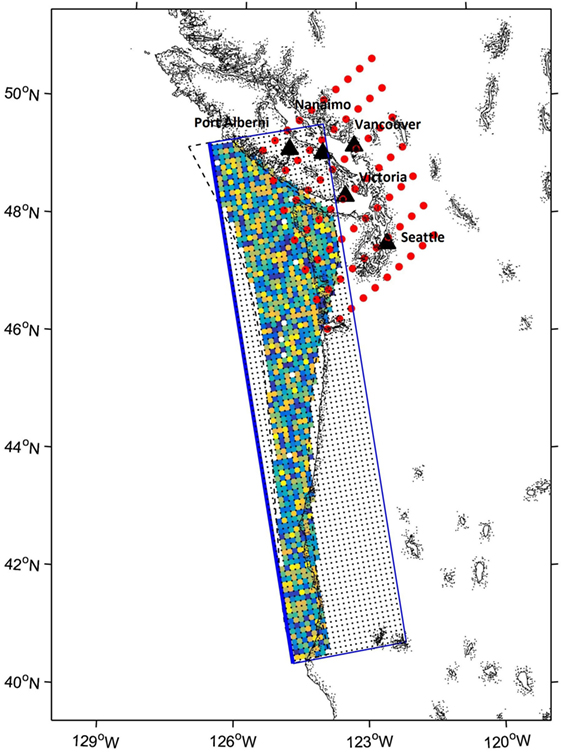
Figure 4. Locations of observation sites (red circles) and slip distributions for the random model (colorful circles distributed on the subducting interface). Black triangles show the location of major cities. Subsources within the fault boundary (dashed black polygon) have randomly generated relative slip inputs, while those outside the boundary but inside the overall fault plane (blue rectangle) are assigned near-zero values.
EXSIM can account for the heterogeneity of slip distribution over the fault plane by assigning spatially varying relative slip weights. A random slip distribution can be specified (as in Figure 4), which is equivalent to randomizing the stress drop on the fault plane (Assatourians and Atkinson, 2007). As noted in the previous section, source inversion studies of the 2011 Tohoku earthquake (Kurahashi and Irikura, 2011; Irikura and Kurahashi, 2012) indicated that observed high-frequency ground motion features of that event could be modeled by adopting the concept of strong-motion-generation-areas (SMGA; Miyake et al., 2003). Because the primary focus of this study is to assess the strong ground motion intensity at Canadian major cities, such as Vancouver and Victoria, where the details of the slip distribution for future events are unknown, we assumed a single-rupture model with an average stress parameter of 100 bar, and a random slip distribution. The actual stress and slip distribution for future events is a source of significant uncertainty.
Path Parameters
In stochastic simulations, geometrical spreading and anelastic attenuation control the decay of simulated ground motion amplitudes over distance. In the path model used by Atkinson and Macias (2009) for Cascadia ground motion modeling, the geometrical spreading function is characterized by a bilinear model with a transition point at 40 km with slopes of −1.0 and −0.5 before and after the transition point. The anelastic attenuation is governed by the regional Quality factor (an inverse measure of anelasticity), given as QS = 180f0.45. These parameters were adopted from large California crustal events (Atkinson and Silva, 2000). Investigations by Babaie Mahani and Atkinson (2013) show that moderate crustal earthquakes in the Pacific Northwest and south-western BC can be fitted with a bilinear attenuation model characterized by a transition point at 70 km with slopes of −1.24 and −0.5 before and after the transition point, with QS = 244f0.6. The actual attenuation rates for sources on the subduction interface are not known due to the lack of empirical data from such events in Cascadia, and thus the assumed path parameters are a significant source of uncertainty.
Considering the similarity of empirical path models among regions, we adopted the generic model developed by Yenier and Atkinson (2015), which is applicable in both western and eastern North America with a change in only the QS model. For this model, the geometric spreading term is R−1.3 to 50 km, and R−0.5 at greater distances, where R is an effective distance measure. In the Yenier and Atkinson model, an equivalent point-source concept is used, in which the effective distance measure accommodates near-distance saturation due to finite fault effects. In EXSIM, by contrast, finite-fault effects are inherently included due to the model geometry. We thus assume that the geometric spreading is applied from each subsource, and R becomes the distance from a subsource to the observation point. The anelastic function for western North America is given by QS = max(100,170.3f0.45) (Yenier and Atkinson, 2015); this QS model is very similar to other western North American models discussed in the foregoing.
Near-surface path effects are modeled by a diminution function, D(f), that implements the kappa filter (κ) proposed by Anderson and Hough (1984):
where κ determines the steepness of high-frequency decay of the Fourier acceleration spectrum. Typical values of κ are around 0.005–0.04 s, depending on site conditions; harder site profiles are associated with smaller κ values. For example, Atkinson (1996) suggested that κ = 0.011 for hard rock sites in British Columbia (site class A). For generic rock sites (site class C), Boore and Joyner (1997) suggested κ = 0.035. Atkinson and Macias (2009) used κ = 0.03 for a site in the Fraser River Delta (site class C) and κ = 0.02 for sites in Seattle and Victoria (site class B/C boundary). Ghofrani et al. (2012) suggested that κ = 0.04 is suitable for reference rock sites (site class B/C boundary) for Japanese stations. Thus typical κ values for western Canada may range between 0.01 and 0.04 (Atkinson, 1996; Atkinson and Macias, 2009), depending on site conditions.
Table 2 summarizes the input parameters used for EXSIM simulations for the Cascadia megathrust event. To show the effect of event size on the ground motions, we considered both an M9.0 rupture and a smaller rupture of M7.5. The M7.5 scenario event is chosen to occur at the eastern edge of the expected rupture zone, to represent an event with a smaller magnitude but at closer distance to the major cities in comparison to a M9.0 megathrust event. We note that the M7.5 event could be conceptualized as an asperity within the larger rupture plane of an M9.0 event. For the M7.5 scenario, we considered a rupture plane with a dimension of 81 km × 57 km (Strasser et al., 2010), strike = 310°, and depth-of-top ∼25 km. The fault plane is divided into 27 × 19 subfaults (3 km × 3 km). The Slip distribution is assumed to be random; the hypocenter is located at the center of the fault.
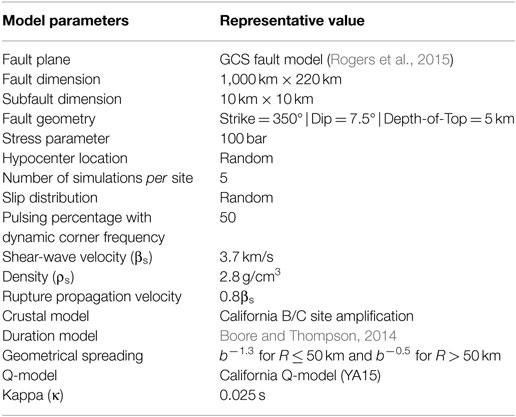
Table 2. Input parameters for Cascadia-EXSIM simulations (M9.0).
Results
Figure 5 plots the response spectral amplitudes of simulated ground motions versus distance from the EXSIM simulations for the M7.5 scenario, in comparison to the predictions of several interface GMPEs. All GMPEs are plotted for B/C site conditions, for a typical Cascadia soil profile (see Ghofrani and Atkinson, 2013 for details). For this exercise, we considered the GMPEs of Gregor et al., 2002; Atkinson and Boore, 2003 (AB03); Zhao et al., 2006 (Zhao06); Atkinson and Macias, 2009 (AM09); Ghofrani and Atkinson, 2013 (GA13); Somerville et al., 2008; and Abrahamson et al., 2016 (BC Hydro 2016). We also plotted for reference the generic GMPE of Yenier and Atkinson (2015) (hereinafter referred to as YA15) which is a regionally adjustable model developed based on equivalent point-source simulations. Although this is not a subduction GMPE, it is based on a similar stochastic model, using an equivalent point source rather than a finite fault. Additionally, it has the feature of an adjustable stress drop, which provides a useful aid in interpretation of the simulated motions. In order to make the Yenier and Atkinson point-source simulations comparable to the finite-fault simulations with EXSIM, we did not add the frequency-dependent calibration constant that Yenier and Atkinson use to match the simulations to empirical data in California. Instead, we used the generic simulation calibration factor (Csim = 3.16) described in Yenier and Atkinson (2015) which levels the simulations and observations, when using the geometric spreading term of R−1.3. This same factor was applied to the EXSIM simulations. The plotted stress for the Yenier and Atkinson GMPE, 70 bar, was selected to approximately match the EXSIM amplitude levels at short periods. (Note: the corresponding value from Yenier and Atkinson for California is 100 bar.) A noteworthy feature of Figure 5 is the wide spread of predictions among the GMPEs. The EXSIM predictions for an event of M7.5 are similar to the Yenier and Atkinson equivalent point-source model for crustal events in California at most periods—but at long periods EXSIM predicts higher motions, due to the different ways that finite-fault effects are modeled in the two algorithms.
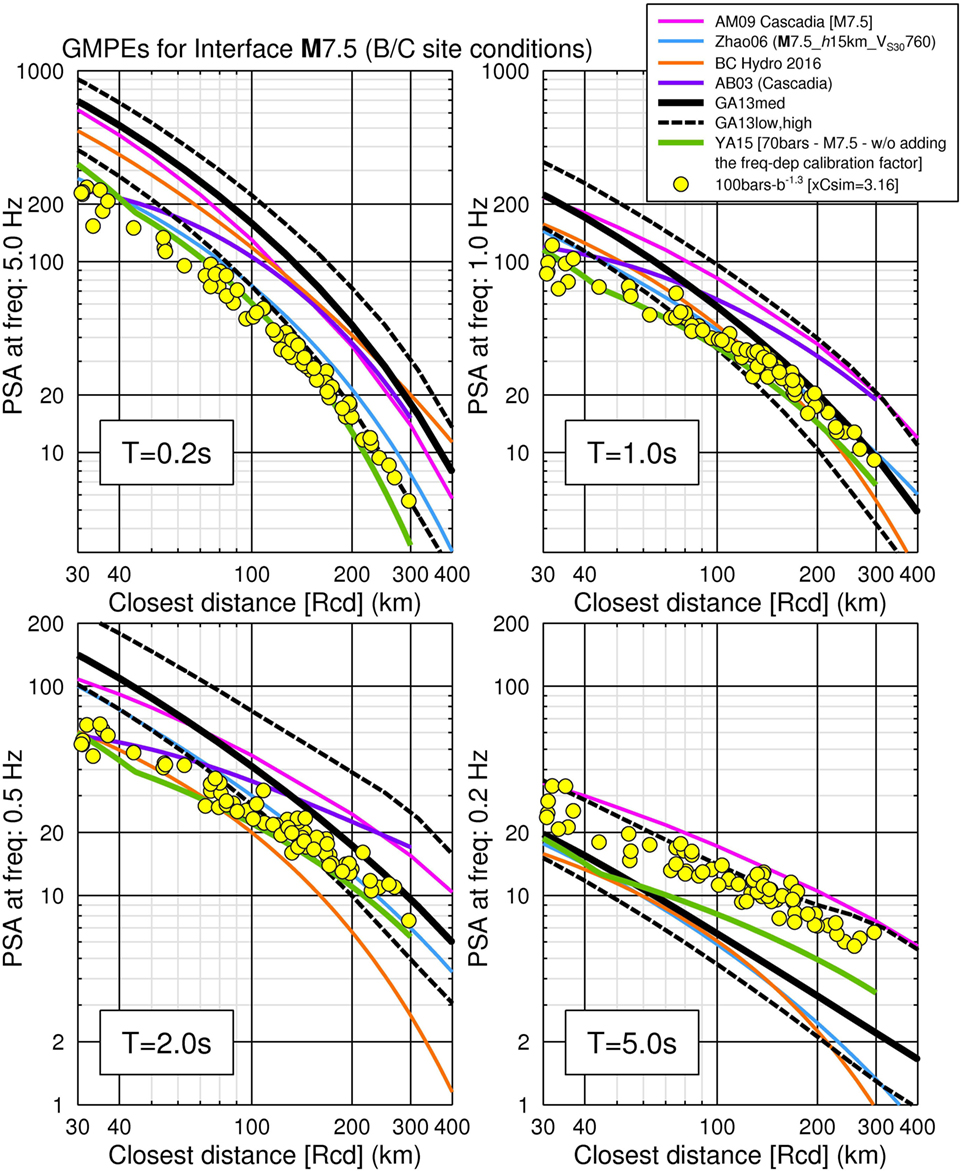
Figure 5. EXSIM-simulated motions for stress parameter of 100 bar (yellow circles) and interface ground-motion prediction equations (GMPEs) for an M7.5 interface event. The interface GMPEs are shown as magenta (AM09), cyan (Zhao06), orange (BC Hydro 2016), purple (AB03), and black (GA13) curves. YA15 point-source model (70 bar) is shown as a solid green line. Japan to Cascadia site factor corrections have been applied to both Zhao et al. (2006) and Ghofrani and Atkinson (2013) models to account for the deeper soil profiles in Cascadia compared to Japan, for the same value of Vs30 (see Ghofrani et al., 2012 for details). The models reflect forearc attenuation conditions.
Figure 6 provides insight into the frequency content of the ground motions and its dependence on the stress parameter used in the simulations. In this figure, the predicted average response spectrum of ground motions from the M7.5 scenario event is shown at a distance of 30 km from the rupture plane. As explained earlier in the text, this scenario event is chosen to occur at the eastern edge of the expected rupture zone, to represent an event with a smaller magnitude but at closer distance to the major cities in comparison to a M9.0 megathrust event. If a future megathrust event in Cascadia results in a complex source rupture process, the M7.5 event could be considered as an asperity within the larger rupture plane of an M9.0 event. To place the simulated response spectrum trend in context, we plotted the YA15 equivalent-point-source GMPE model in Figure 6 for reference. As shown in this figure, we need a stress parameter of ∼70 bar in the context of the YA15 model to match the EXSIM-simulated spectrum. This implies that crustal events in active tectonic regions (e.g., California) would tend to produce larger ground motions at high frequencies, reflecting a higher value of the stress parameter, in comparison to interface events. As explained in Yenier and Atkinson (2015), an empirical frequency-dependent calibration factor can be used to reconcile the predictions of the YA15 equivalent point-source model with observed amplitudes in a target region; the calibration factor accounts in a crude way for the overall effects of factors that are missing or misfit in simulations (e.g., discrepancies between the assumed and true values of crustal properties, near-distance attenuation effects, regional site amplification, κ0, and path duration). To explore the impact of these effects in the simulated ground-motions, we plotted the YA15 model with and without the empirical calibration factor that Yenier and Atkinson used to match their equivalent point-source simulations to the California ground-motion database. This figure suggests that the EXSIM simulations tend to produce lower ground motions for large events than do the corresponding equivalent point-source simulations of Yenier and Atkinson (2015). This likely occurs because the point source simulations concentrate the source radiation at a single point (placed at an equivalent distance), while finite-fault simulations spread it over a larger fault plane. The consequent differences in the way that attenuation from the source is handled means that the values of the stress parameter do not carry the same meaning for equivalent point source and finite fault simulations for large events (see Atkinson et al., 2009). This discrepancy will become more pronounced as magnitude grows. This points to the importance of calibration of simulation algorithms with empirical data to ensure realistic parameter values.
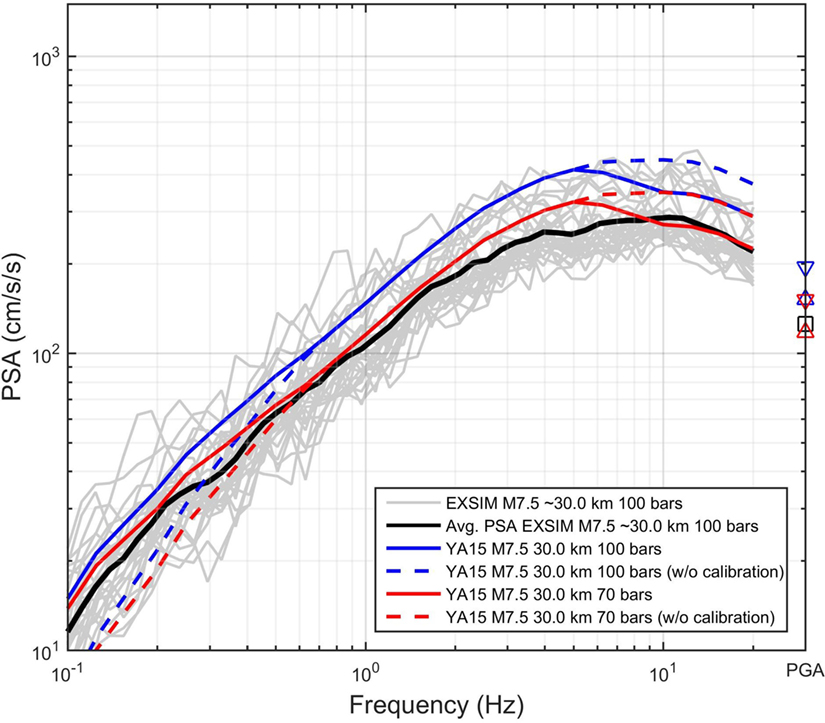
Figure 6. Magnitude scaling at Rcd = 30 km for an M7.5 event. Black line is the mean of pseudospectral acceleration (PSA) for all stations at Rcd ∼30 km (shown with gray lines). Solid Blue and red curves are YA15 model for stress parameter of 100 and 70 bar (frequency-dependent calibration factor is included), respectively. Dashed blue and red lines represent YA15 without considering the calibration factor. Black square is the mean of simulated PGA for all stations at Rcd ∼30 km, up and down blue triangle symbols are PGA based on YA15 models for stress parameter of 100 and 70 bar, respectively, and up and down red triangle symbols are PGA based on YA15 models without considering the calibration factor.
Figure 7 plots the amplitudes of simulated ground motions versus distance from the EXSIM simulations for the M9.0 scenario, in comparison to the predictions of several interface GMPEs. All GMPEs are plotted for B/C site conditions, for a typical Cascadia soil profile. The plotted stress for the Yenier and Atkinson GMPE, 40 bar, was selected to approximately match the EXSIM amplitude levels at short periods. A noteworthy feature of Figure 7 is the wide spread of predictions among the GMPEs (i.e., large epistemic uncertainty). The EXSIM simulations plot near the low end of the GMPEs at short periods, and near the high end of the GMPEs at long periods. This likely reflects the tuning of empirical GMPEs to match the motions from the Tohoku event—the only M9.0 event in the database. The Tohoku event was rich in short periods and deficient in long periods relative to what was expected based on other subduction earthquakes and ground-motion models (see discussion in Ghofrani and Atkinson, 2013). It has been suggested that the Tohoku event might be better considered as a composite of several events of M < 9.0 (Geospatial Information Authority of Japan, 2011; Maercklin et al., 2012).
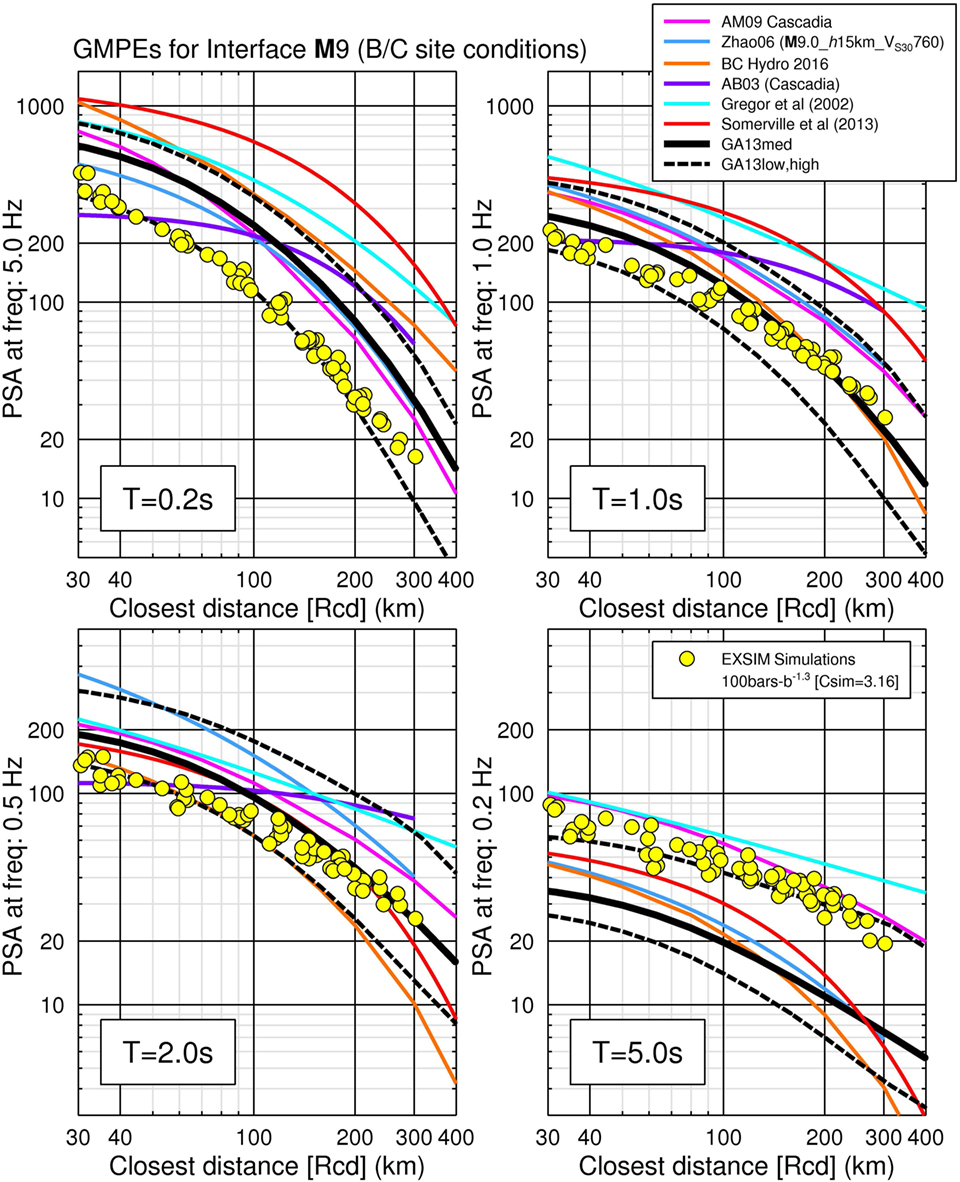
Figure 7. EXSIM-simulated motions (yellow circles) and interface ground-motion prediction equations (GMPEs) for an M9.0 interface event. The interface GMPEs are shown as magenta (AM09), blue (Zhao06), orange (BC Hydro 2016), purple (AB03), cyan (Gregor et al., 2002), red (Somerville et al., 2013), and black (GA13) curves. Japan to Cascadia site factor corrections have been applied to both Zhao et al. (2006) and Ghofrani and Atkinson (2013) models to account for the deeper soil profiles in Cascadia compared to Japan, for the same value of Vs30 (see Ghofrani et al., 2012 for details). The models reflect forearc attenuation conditions.
Figure 8 provides insight into the frequency content of the ground motions and its dependence on the stress parameter used in the simulations. In this figure, the predicted average spectrum of ground motions from the M9.0 scenario event is shown at a distance of 30 km from the rupture plane. To appreciate the level of simulated ground-motions, we plotted the YA15 GMPE model in Figure 8 for reference. As show in this figure, we need a stress parameter of ∼40 bar to match the YA15 model to the simulated spectrum, although we note that use of the YA15 model for M9.0 represents an extrapolation that should not be accorded much significance.
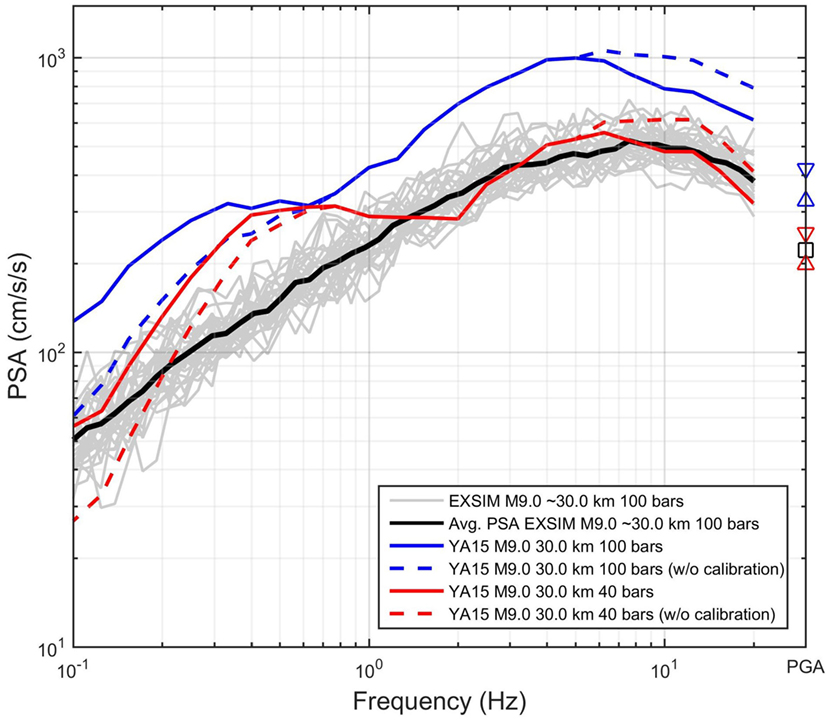
Figure 8. Alternative estimates of response spectra at Rcd = 30 km for an M9.0 event. Black line is the mean of pseudospectral acceleration (PSA) for all stations at Rcd ∼30 km (shown with gray lines). Solid Blue and red curves are YA15 model for stress parameter of 100 and 40 bar, respectively. Dashed blue and red lines represent YA15 without considering the calibration factor. Note that YA15 is an extrapolation for M9.0. Black square is the mean of simulated PGA for all stations at Rcd ∼30 km, up and down blue triangle symbols are PGA based on YA15 models for stress parameter of 100 and 40 bar, respectively, and up and down red triangle symbols are PGA based on YA15 models without considering the calibration factor.
Effects of Parameter Uncertainties
Stress Parameter
One of the key uncertainties in the source parameters that control ground-motion amplitudes in EXSIM is the subevent stress parameter. In Figure 9, we show the sensitivity of results to this stress parameter, by comparing amplitudes for values of 30 and 150 bar—these are the estimates of the lower and upper limits on the stress-drop parameter based on interface events around the world, within the context of the EXSIM model, as determined by Atkinson and Macias (2009). The comparison is for a M9.0 scenario; the effect is similar for other magnitudes. Figure 9 suggests that uncertainty in ground-motion spectral amplitudes for Cascadia events due to uncertainty in the appropriate stress parameter value is about ±50%; this uncertainty is partly epistemic (we do not know the median stress parameter value) and partly aleatory (the stress parameter for individual events will vary about the median).
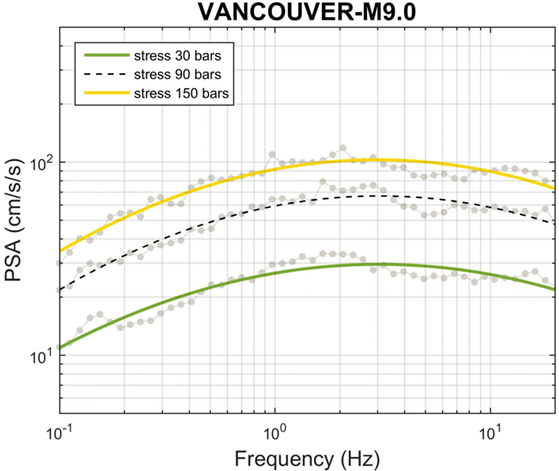
Figure 9. Uncertainty in response spectra for M9.0 at Vancouver due to stress parameter uncertainty. Light black dashed line is the average (over numerous simulations) PSA for Δσ = 90 bar; green and orange solid lines are average PSA for Δσ = 30 bar and Δσ = 150 bar, respectively. Light gray dots are the average PSA values of 30 runs for the given stress parameters. The relative effect of stress parameter at Victoria is very similar.
Regional Attenuation and Crustal Velocity Model
A key uncertainty in the path model is the geometric spreading model. Uncertainties in the path model can produce even larger uncertainties in response spectral amplitudes in comparison to uncertainties in source parameters. For example, a geometric spreading of R−1.0 results in an amplitude decay of 1.0 log10 units over the rupture distance interval from 10 to 100 km, while a spreading of R−1.3 would result in an amplitude decay of 1.3 log10 units over the same distance interval; thus there would be a difference of a factor of two (e.g., 0.3 log units) in predicted amplitude for sites at 100 km. The path parameters in simulation models such as EXSIM should be calibrated using regional data—but such data are lacking for megathrust events in Cascadia, necessitating assumptions regarding the geometric spreading parameters based on observations in other regions. The resulting uncertainty is about a factor of 2 at 100 km and would become even larger at greater distances.
Site Response of Fraser River Delta Sediments
The near-surface soil profile has significant influence on ground motions, altering both amplitude and frequency content of seismic waves. These effects are often investigated through site response analysis. Various methods, ranging from linear site response analysis (either frequency- or time-domain) to non-linear site response analysis, are available. The results from such analyses can be employed to develop site amplification factors, which are modeled as a function of soil parameters, such as average shear-wave velocity near the ground surface and fundamental site period. Development of generic site amplification factors is motivated by several practical considerations, which may include a lack of detailed soil information or the additional effort required to perform site response analysis. Moreover, the use of generic site amplification functions based on proxy indicators is inevitable for regional-scale seismic hazard and risk assessments and aids in the implementation of site response analysis in seismic hazard and risk analysis (e.g., Bazzurro and Cornell, 2004; Choi and Stewart, 2005; Cadet et al., 2012; Ghofrani et al., 2012).
Our synthetic ground motions of a scenario M9.0 Cascadia subduction earthquake are calculated here for a reference firm soil condition (site class B/C or Vs30 of 760 m/s). This condition may be a fair approximation in Vancouver, which is located on overconsolidated Pleistocene glacial tills. However, the thick unconsolidated Holocene sediments of the Fraser River delta, south of Vancouver, are softer and tend to amplify earthquake shaking. They are also susceptible to liquefaction when saturated and cohesionless sand is present. As a simple demonstration of the potential amplification effects, we calculate theoretical 1D spectral amplification estimates for four selected Fraser River Delta sites.
Shear-Wave Velocity Profiles in Fraser River Delta
The subsurface geology in southern Vancouver is comprised of three main geological units, from base to top: (i) Tertiary sedimentary rocks (bedrock), (ii) Pleistocene glacial/inter-glacial deposits, and (iii) Holocene sediments of the Fraser River (Britton et al., 1995; Hunter et al., 1998; Cassidy and Rogers, 2004). Tertiary rocks typically have a shear-wave velocity (Vs) of 1.5 km/s or greater (i.e., site class A). Pleistocene glacial till deposits are exposed on the ground surface at many locations in Vancouver and have Vs of ∼0.5 km/s (i.e., site class C) with significant variability (Cassidy and Rogers, 2004). Holocene Fraser River delta silts and sands have low Vs of about 0.1–0.2 km/s (i.e., site class D/E). The thickness of these geological units varies spatially. Holocene sediments can reach a depth of 0.3 km, whereas the surface of Tertiary bedrock varies from 0 to 0.8 km [average depth is about 0.5 km; Britton et al. (1995)].
The locations of four selected sites in the Fraser River Delta are reported in Table 3 and their Vs depth profiles are shown in Figure 10. The depth to Pleistocene material varies between 100 and 300 m among the sites, whereas depth of Tertiary bedrock is relatively consistent at ∼550 m.
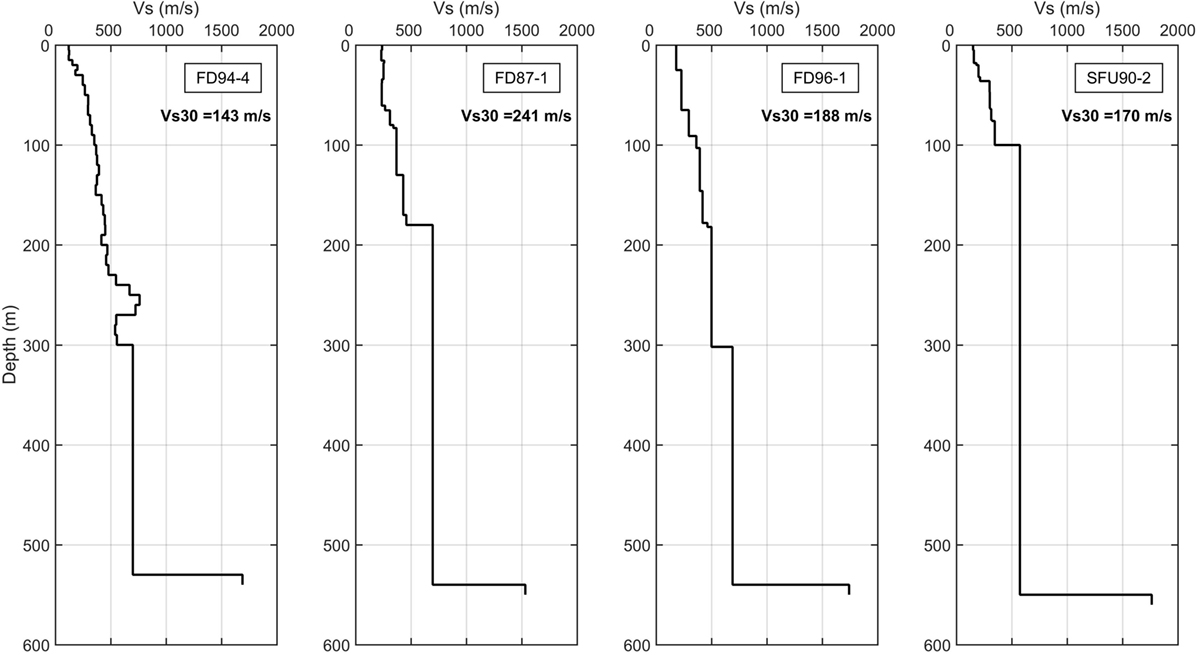
Figure 10. Shear-wave velocity profiles of the four selected sites. In the Fraser Delta, there is a pervasive layer of Pleistocene deposits that overlies the Tertiary bedrock; the Pleistocene layer has a stable Vs gradient from 400 to 1,000 m/s, while the Tertiary bedrock has an average Vs of 1,500 m/s (Hunter, 1995; Hunter et al., 1997).
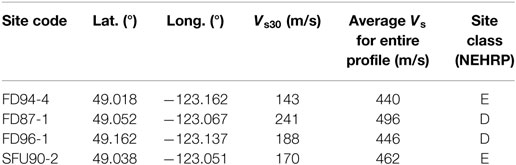
Table 3. The location of the four sites in the Fraser River Delta.
The Quarter Wavelength (QWL) Method
One of the simplest approaches for characterizing site amplification is based on the combined use of the QWL method and the kappa filter (Boore and Joyner, 1997; Boore, 2003). The overall effect of the site amplification G(f) is expressed as:
where S(f) is the amplification factor for wave propagation from source to ground surface and D(f) is the diminution function that accounts for path-independent loss of energy. S(f) is characterized by shear-wave velocity (β) and density (ρ) profiles over depth and is given by:
where βs and ρs are the shear-wave velocity and density near the source, and and are the shear-wave velocity and density averaged over a depth up to z, where z is taken as the depth corresponding to a quarter-wavelength: z = (1/4)β(z(f))/f. Note that by taking the depth corresponding to a quarter-wavelength, z becomes a function of frequency; this is considered to be the influential depth for the site amplification factor at a specific frequency (see Figure 9 in Boore and Joyner (1997)). and are defined as:
and
respectively. The advantage of this method is its basis in simple fundamental physics, as represented by the square root of the impedance ratio. This method captures the smooth tendency of the site amplification over frequency (ignoring local features due to resonance), its use in stochastic simulation as the overall frequency-dependent site amplification factor is adequate.
For the diminution function D(f), a popular choice that reflects a wealth of empirical data is the kappa (κ) filter (Anderson and Hough, 1984), which is given by Eq. 7.
Here, we are referencing the zero-distance kappa intercept [often denoted κ(0)], which reflects the near-surface component of high-frequency spectral decay after regional anelastic path effects have been removed.
Theoretical Transfer Functions
A slightly more sophisticated way to compute the theoretical site response is to calculate the 1D transfer function of horizontally stratified constant-slowness layers over an elastic bedrock, for a vertically propagating shear-wave (SH), using Thomson-Haskell’s approach (Thomson, 1950; Haskell, 1953). For this calculation, we use the Nrattle program (C. Mueller, US Geological Survey with modification by R. Herrmann) included in the Boore (2005b) ground motion simulation program SMSIM. The input data for Nrattle are the layered velocity model, specifying the thickness, density, β, and seismic attenuation (QS) factor for each layer. The other input parameters are the shear-wave velocity and density of the half-space, incident angle, and the depth with respect to which the transfer function is calculated. We set the half-space equal to the β and ρ of the deepest measured layer. The Nrattle solution is exactly equivalent to the solution computed by the equivalent-linear site response program SHAKE for linear modulus reduction and damping curves (Schnabel et al., 1972).
Evaluation of Site Amplification Factors
To conduct site amplification analysis, suitable values for shear-wave velocity, density, and damping of the near-surface materials are needed. For the four velocity profiles considered, we set βs to the value for Tertiary bedrock at the ∼550-m base of all profiles (Figure 10). The angle of incidence is set to 0. The density profile over depth is calculated based on a relationship suggested by Hunter et al. (1998): ρ(z) = min[1.770 + 0.414β(z), 2.8]. Nrattle mimics the effect of diminution at high frequencies using Quality factor or damping for each layer, rather than the kappa filter. At 0 epicentral distance, the seismic attenuation parameter kappa, κ, is related to the average near-surface shear wave velocity quality factor, , as:
where H is the total thickness of the crust over which the energy loss occurs and βSavg is the average shear wave velocity over H. It is important to note that a κ value of 0.03 s, which we used in our simulations, includes the total damping in the upper portion of the crust. By contrast, when considering the amplification effects of near-surface soils, the corresponding value of κ is that attributed to attenuation in the very shallow crust directly beneath the site (Hough and Anderson, 1988). Silva and Darragh (1995) suggest that these effects extend from the surface down to several hundred meters and possibly as deep as 1–2 km. In this study, we use a of 20 (Molnar et al., 2013) for calculating the damping effects of these near-surface materials. For comparison, we note that a value of QS = 5 used within Nrattle would be equivalent to κ = 0.03 s within the quarter-wavelength framework. This is shown in Figure 11, in which the amplifications for the four sites are plotted. Note that the near-surface materials provide significant high-frequency attenuation for the assumed value of .
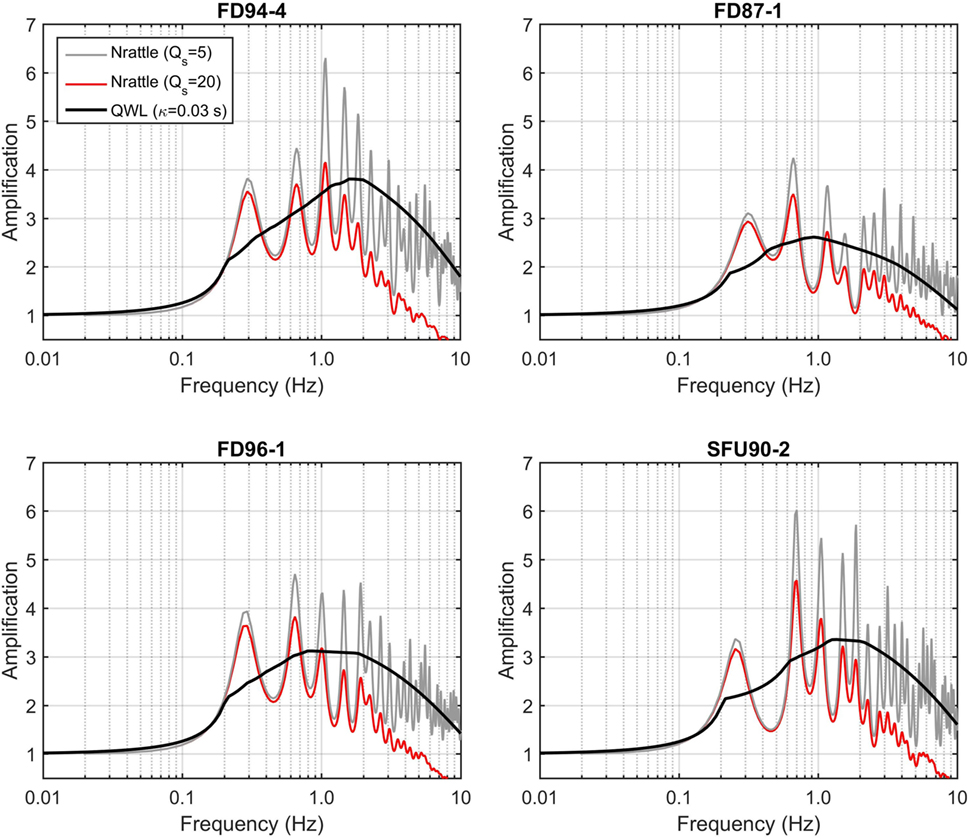
Figure 11. Transfer (i.e., linear amplification) functions of four select Fraser River Delta sites. The gray and red curves are the theoretical site response computed using Nrattle with QS = 5 and QS = 20, respectively. The black curve is the amplification factor based on the quarter-wavelength method using kappa of 0.03 s.
The peak frequency (f0) of the transfer function for the four sites is relatively stable at ∼0.3 Hz, because the depth to the largest impedance contrast is consistent, at ∼550 m. Amplification is a factor of 4 (elastic) or 3 (with attenuation) at f0. The theoretical 1D linear amplification functions in Figure 11 are largely consistent with observed spectral amplification at Fraser River delta sites. For example, Molnar et al. (2013) report peak amplifications near 0.3 Hz of 2.5 and 5, from earthquake and microtremor recordings, respectively. Caution must be exercised when site amplification factors for soft soils are used to assess ground motions due to the M9.0 Cascadia events because local soil features may not be captured by these amplification factors and expected non-linear deamplification site effects are not taken into account.
We calculated site amplification factors for selected sites as a function of frequency for Vancouver’s Fraser Delta. For other neighboring locations such as Victoria and Seattle, amplifications should be constructed separately, as studies suggest there are significant differences in shallow crustal structure. For example, a thinner layer of accreted sediments lies beneath Victoria in comparison to that beneath the Fraser Delta or Seattle (Ellis et al., 1983; McMechan and Spence, 1983; Graindorge et al., 2003; Ramachandran et al., 2006). Moreover, we have not modeled 3D basis effects that complicate observed amplifications.
Conclusion
Ground motions for earthquakes of M7.5–9.0 on the Cascadia subduction interface were simulated based on a stochastic finite-fault model and used to estimate average response spectra for firm-site conditions near the city of Vancouver. An important attribute of the simulations is that the methodology was first validated by reproducing the wealth of ground-motion data from the 2011 M9.0 Tohoku-Oki earthquake sequence of Japan. Adjustments to the calibrated model were then made to consider average source, attenuation, and site parameters for the Cascadia region, and to model the effects of parameter uncertainty. The simulations provide estimates of response spectra for firm-site conditions (B/C boundary in top of the Pleistocene in Vancouver); these motions could be input at the base of a soil layer to consider other site conditions, which may amplify the motions.
We have considered the major uncertainties in source, path and site effects. We conclude that uncertainty in stress parameter causes uncertainty in simulated response spectra of about ±50%. Uncertainties in the attenuation model produce even larger uncertainties in response spectral amplitudes—a factor of about two at 100 km, becoming even larger at greater distances. Uncertainty in site response further increases the total uncertainty. Moreover, the number of simulations and parameter combinations considered here may not be statistically sufficient for capturing extreme values that could result from the full range of potential model parameters; an exhaustive study of uncertainties was beyond the scope of this article.
We conclude that the large uncertainties in potential ground motions, due to uncertainties in regional source and attenuation parameters, are a dominant consideration when assessing seismic risk from Cascadia megathrust events. This also suggests that combining data from regions with different source and attenuation characteristics into a global subduction zone database for development of global empirical GMPEs may not be a sound practice. Future studies should aim to improve the regional attenuation model for Cascadia events and gain more information on the potential range of source parameters.
Author Contributions
HG led the drafting of the text, conducted the simulation and ground motion analyses, and prepared most of the figures. GA participated equally in guiding methodology and direction/drafting of the article. SM provided key information and insights on site characteristics in BC and assisted in site response analyses.
Conflict of Interest Statement
The authors declare that the research was conducted in the absence of any commercial or financial relationships that could be construed as a potential conflict of interest.
Acknowledgments
This work is funded by the Natural Sciences and Engineering Research Council of Canada. We are grateful to our colleague, Dr. Katsuchiro Goda, the PI of the project CRUST: Cascading Risk and Uncertainty assessment of earthquake Shaking & Tsunami, for his kind support and encouragement over the course of this project. The authors would like to thank the editor, Dr. Solomon Tesfamariam, and the reviewers, Dr. Vladimir Sokolov and Dr. Alin Radu for their constructive comments, which helped us to improve the manuscript.
References
Abrahamson, N., Gregor, N., and Addo, K. (2016). BC hydro ground motion prediction equations for subduction earthquakes. Earthquake Spectra 32, 23–44. doi:10.1193/051712EQS188MR
Adams, J. (1990). Paleoseismicity of the Cascadia subduction zone: evidence from turbidites off the Oregon-Washington margin. Tectonics 9, 569–583. doi:10.1029/TC009i004p00569
Adams, J., Halchuk, S., and Rogers, G. (2012). Cascadia Interface Subduction Source Model. Vancouver, Canada: Internal Draft Prepared for the Canadian National Committee on Earthquake Engineering (CANCEE).
Anderson, J., and Hough, S. (1984). A model for the shape of the Fourier amplitude spectrum of acceleration at high frequencies. Bull. Seismol. Soc. Am. 74, 1969–1993.
Assatourians, K., and Atkinson, M. (2007). Modeling variable-stress distribution with the stochastic finite-fault technique. Bull. Seismol. Soc. Am. 97, 1935–1949. doi:10.1785/0120060203
Atkinson, G. M. (1996). The high-frequency shape of the source spectrum for earthquakes in eastern and western Canada. Bull. Seismol. Soc. Am. 86, 1067–1112.
Atkinson, G. M. (2005). Ground motions for earthquakes in southwestern British Columbia and Northwestern Washington: crustal, in-slab, and offshore events. Bull. Seismol. Soc. Am. 95, 1027–1044. doi:10.1785/0120040182
Atkinson, G. M., Assatourians, K., Boore, D. M., Campbell, K. W., and Motazedian, D. (2009). A guide to differences between stochastic point-source and stochastic finite-fault simulations. Bull. Seismol. Soc. Am. 99, 3192–3201. doi:10.1785/0120090058
Atkinson, G. M., and Boore, D. M. (2003). Empirical ground-motion relations for subduction zone earthquakes and their application to Cascadia and other regions. Bull. Seismol. Soc. Am. 93, 1703–1729. doi:10.1785/0120020156
Atkinson, G. M., and Macias, M. (2009). Predicted ground motions for great interface earthquakes in the Cascadia subduction zone. Bull. Seismol. Soc. Am. 99, 1552–1578. doi:10.1785/0120080147
Atkinson, G. M., and Silva, W. (2000). Stochastic modeling of California ground motions. Bull. Seismol. Soc. Am. 90, 255–274. doi:10.1785/0119990064
Atwater, B. F., Tuttle, M. P., Schweig, E. S., Rubin, C. M., Yamaguchi, D. K., and Hemphill-Haley, E. (2004). “Earthquake recurrence inferred from paleoseismology,” in The Quaternary Period in the United States: Developments in Quaternary Science 1, eds A. R. Gillespie, S. C. Porter, and B. F. Atwater (Amsterdam, New York: Elsevier), 331–350.
Babaie Mahani, A., and Atkinson, G. (2013). Regional differences in ground-motion amplitudes of small-to-moderate earthquakes across North America. Bull. Seismol. Soc. Am. 103, 2604–2620. doi:10.1785/0120120350
Bazzurro, P., and Cornell, A. C. (2004). Nonlinear soil-site effects in probabilistic seismic-hazard analysis. Bull. Seismol. Soc. Am. 94, 2110–2123. doi:10.1785/0120030216
Boore, D. M. (1983). Stochastic simulation of high-frequency ground motions based on seismological models of the radiated spectra. Bull. Seismol. Soc. Am. 73, 1865–1894.
Boore, D. M. (2003). Simulation of ground motion using the stochastic method. Pure Appl. Geophys. 160, 635–676. doi:10.1007/PL00012553
Boore, D. M. (2005a). On pads and filters. Bull. Seismol. Soc. Am. 95, 745–750. doi:10.1785/0120040160
Boore, D. M. (2005b). SMSIM – FORTRAN Programs for Simulating Ground Motions from Earthquakes (Ver. 2.3). Available at: http://w.daveboore.com/software_online.html
Boore, D. M. (2009). Comparing stochastic point-source and finite-source ground-motion simulations: SMSIM and EXSIM. Bull. Seismol. Soc. Am. 99, 3202–3216. doi:10.1785/0120090056
Boore, D. M., and Joyner, W. B. (1997). Site amplifications for generic rock sites. Bull. Seismol. Soc. Am. 87, 327–341.
Boore, D. M., and Thompson, E. M. (2014). Path durations for use in the stochastic-method simulation of ground motions. Bull. Seismol. Soc. Am. 104, 2541–2552. doi:10.1785/0120140058
Britton, J., Harris, J., Hunter, J. A., and Luternauer, J. (1995). The Bedrock Surface Beneath the Fraser River Delta in British Columbia Based on Seismic Measurements. Current Research 1995-E. Geological Survey of Canada, 83–89.
Brune, J. N. (1970). Tectonic stress and the spectra of seismic shear waves from earthquakes. J. Geophys. Res. 75, 4997–5009. doi:10.1029/JB075i026p04997
Cadet, H., Bard, P. Y., Duval, A. M., and Bertrand, E. (2012). Site effect assessment using KiK-net data: part 2 – site amplification prediction equations based on f0 and Vsz. Bull. Earthquake Eng. 10, 451–489. doi:10.1007/s10518-011-9324-9
Cassidy, J. F., and Rogers, G. C. (2004). “Variation in ground shaking on the Fraser River Delta (Greater Vancouver, Canada) from analysis of moderate earthquakes,” in Proceedings of the 13th World Conference on Earthquake Engineering (Vancouver, Canada), 1010.
Choi, Y., and Stewart, J. P. (2005). Nonlinear site amplification as function of 30 m shear wave velocity. Earthquake Spectra 21, 1–30. doi:10.1193/1.1856535
De Risi, R., and Goda, K. (2016). Probabilistic earthquake-tsunami multihazard analysis: application to the Tohoku region, Japan. Front. Built Environ. 2:25. doi:10.3389/fbuil.2016.00025
Ellis, R. M., Spence, G. D., Clowes, R. M., Waldron, D. A., and Jones, I. F. (1983). The Vancouver island seismic project: a co-crust onshore-offshore study of a convergent margin. Can. J. Earth Sci. 20, 719–741. doi:10.1139/e83-065
Flück, P., Hyndman, R. D., and Wang, K. (1997). Three-dimensional dislocation model for great earthquakes of the Cascadia subduction zone. J. Geophys. Res. 102, 20539–20550. doi:10.1029/97JB01642
Frankel, A. D., and Petersen, M. D. (2008a). “Cascadia subduction zone,” in The Uniform California Earthquake Rupture Forecast, Version 2 (Renton: US Geological Survey).
Frankel, A. D., and Petersen, M. D. (2008b). Cascadia Subduction Zone (Appendix L). Open File Report 2007-1437L. Golden, Colorado: U.S. Geological Survey.
Geist, E. L. (2005). “Local tsunami hazards in the Pacific Northwest from Cascadia subduction zone earthquakes,” in Earthquake Hazards of the Pacific Northwest Coast and Marine Regions, ed. R. Kayen (U.S. Department of the Interior, U.S. Geological Survey, Professional Paper), 1661–B.
Geospatial Information Authority of Japan. (2011). Crustal Deformation and Fault Model Obtained from GEONET Data Analysis. Available at: http://www.gsi.go.jp/cais/topic110422-index-e.html
Ghofrani, H., and Atkinson, G. (2011). Forearc versus backarc attenuation of earthquake ground motion. Bull. Seismol. Soc. Am. 101, 3032–3045. doi:10.1785/0120110067
Ghofrani, H., and Atkinson, G. M. (2013). Ground-motion prediction equations for interface earthquakes of M7 to M9 based on empirical data from Japan. Bull. Earthquake Eng. 12, 549–571. doi:10.1007/s10518-013-9533-5
Ghofrani, H., Atkinson, G. M., and Goda, K. (2012). Implications of the 2011 M9.0 Tohoku Japan earthquake for the treatment of site effects in large earthquakes. Bull. Earthquake Eng. 11, 171–203. doi:10.1007/s10518-012-9413-4
Ghofrani, H., Atkinson, G. M., Goda, K., and Assatourians, K. (2013). Stochastic finite-fault simulations of the 11th March Tohoku, Japan. Earthquake Bull. Seismol. Soc. Am. 103, 1307–1320. doi:10.1785/0120120228
Goda, K., Petrone, C., De Risi, R., and Rossetto, T. (2016). Stochastic coupled simulation of strong motion and tsunami for the 2011 Tohoku, Japan earthquake. Stoch. Environ. Res. Risk Assess. 1–19. doi:10.1007/s00477-016-1352-1
Goda, K., Pomonis, A., Chian, S. C., Offord, M., Saito, K., Sammonds, P., et al. (2012). Ground motion characteristics and shaking damage of the 11th March 2011 Mw9.0 Great East Japan earthquake. Bull. Earthquake Eng. 11, 141–170. doi:10.1007/s10518-012-9371-x
Goda, K., and Tesfamariam, S. (2017). Seismic risk management of existing reinforced concrete buildings in the Cascadia subduction zone. Nat. Hazards Rev. 18, B4015003. doi:10.1061/(ASCE)NH.1527-6996.0000206
Goda, K., Wenzel, F., and De Risi, R. (2015). Empirical assessment of nonlinear seismic demand of mainshock-aftershock ground motion sequences for Japanese earthquakes. Front. Built Environ. 1:6. doi:10.3389/fbuil.2015.00006
Goldfinger, C., Grijalva, K., Bürgmann, R., Morey, A. E., Johnson, J. E., Nelson, C. H., et al. (2008). Late Holocene rupture of the Northern San Andreas fault and possible stress linkage to the Cascadia subduction zone. Bull. Seismol. Soc. Am. 98, 861–889. doi:10.1785/0120060411
Goldfinger, C., Nelson, C. H., Morey, A. E., Johnson, J. E., Patton, J., Karabanov, E., et al. (2012). Turbidite Event History – Methods and Implications for Holocene Paleoseismicity of the Cascadia Subduction Zone. U.S. Geological Survey Professional Paper 1661-F, 170.
Graindorge, D., Spence, G., Charvis, P., Collot, J. Y., Hyndman, R., and Tréhu, A. M. (2003). Crustal structure beneath the strait of Juan de Fuca and southern Vancouver island from seismic and gravity analysis. J. Geophys. Res. 108, 2484. doi:10.1029/2002JB001823
Gregor, N. J., Silva, W. J., Wong, I. G., and Youngs, R. R. (2002). Ground-motion attenuation relationships for Cascadia subduction zone megathrust earthquakes. Bull. Seismol. Soc. Am. 92, 1923–1932. doi:10.1785/0120000260
Haskell, N. A. (1953). The dispersion of surface waves on multilayered media. Bull. Seismol. Soc. Am. 72, 17–34.
Hough, S. E., and Anderson, J. G. (1988). High-frequency spectra observed at Anza, California: implications for Q structure. Bull. Seismol. Soc. Am. 78, 692–707.
Hunter, J. (1995). Shear Wave Velocities of Holocene Sediments, Fraser River Delta, British Columbia. Current Research 1995-A, Geological Survey of Canada, 29–32.
Hunter, J., Harris, J., and Britton, J. (1997). Compressional and Shear Wave Interval Velocity Data for Quaternary Sediments in the Fraser River Delta from Multichannel Seismic Reflection Surveys. Geological Survey of Canada Open-File Report 97-3325.
Hunter, J. A., Burns, R., Good, R., and Pelletier, C. (1998). A Compilation of Shear Wave Velocities and Borehole Geophysics Logs in Unconsolidated Sediments of the Fraser River Delta. Open-File Report 3622. Geological Survey of Canada.
Hyndman, R. D., Mazzotti, S., Weichert, D., and Rogers, G. C. (2003). Frequency of large crustal earthquakes in Puget Sound-southern Georgia Strait predicted from geodetic and geological deformation rates. J. Geophys. Res. 108, 2033. doi:10.1029/2001JB001710
Hyndman, R. D., and Wang, K. (1995). The rupture zone of Cascadia great earthquakes from current deformation and the thermal regime. J. Geophys. Res. 100, 22133–22154. doi:10.1029/95JB01970
Irikura, K., and Kurahashi, S. (2012). “High acceleration motions generated from the 2011 Pacific coast off Tohoku, Japan earthquake,” in Proc. 15th World Conf. Earthquake Eng (Lisbon, Portugal).
Kamae, K., Irikura, K., and Pitarka, A. (1998). A technique for simulating strong ground motion using hybrid Green’s function. Bull. Seismol. Soc. Am. 88, 357–367.
Kurahashi, S., and Irikura, K. (2011). Source model for generating strong ground motions during the 2011 off the Pacific coast of Tohoku earthquake. Earth Planets Space 63, 571–576. doi:10.5047/eps.2011.06.044
Maercklin, N., Festa, G., Colombelli, S., and Zollo, A. (2012). Twin ruptures grew to build up the giant 2011 Tohoku, Japan, earthquake. Sci. Rep. 2, 709. doi:10.1038/srep00709
Mazzotti, S., and Adams, J. (2004). Variability of near-term probability for the next great earthquake on the Cascadia subduction zone. Bull. Seismol. Soc. Am. 94, 1954–1959. doi:10.1785/012004032
McCrory, P. A., Blair, J. L., Oppenheimer, D. H., and Walter, S. R. (2004). Depth to the Juan de Fuca Slab Beneath the Cascadia Subduction Margin-A 3-D Model for Sorting Earthquakes. U.S. Geol. Surv. Data Series, 91, 1.2.
McCrory, P. A., Blair, J. L., Oppenheimer, D. H., and Walter, S. R. (2006). Depth to the Juan de Fuca Slab Beneath the Cascadia Subduction Margin – a 3-D Model for Sorting Earthquakes. Menlo Park, California: U.S. Geological Survey Data Series 91.
McMechan, G. A., and Spence, G. (1983). P-wave velocity structure of the Earth’s crust beneath Vancouver island. Can. J. Earth Sci. 20, 742–752. doi:10.1139/e83-066
Miyake, H., Iwata, T., and Irikura, K. (2003). Source characterization for broadband ground-motion simulation, kinematic heterogeneous source model and strong motion generation area. Bull. Seismol. Soc. Am. 93, 2531–2545. doi:10.1785/0120020183
Molnar, S., Cassidy, J. F., and Dosso, S. E. (2013). Uncertainty of linear earthquake site amplification via Bayesian inversion of surface seismic data. Geophysics 78, WB37–WB48. doi:10.1190/geo2012-0345.1
Motazedian, D., and Atkinson, G. M. (2005). Stochastic finite-fault modeling based on a dynamic corner frequency. Bull. Seismol. Soc. Am. 95, 995–1010. doi:10.1785/0120030207
Ramachandran, K., Hyndman, R. D., and Brocher, T. M. (2006). Regional P-wave velocity structure of the northern Cascadia subduction zone. J. Geophys. Res. 111, B12301. doi:10.1029/2005JB004108
Rogers, G., Halchuk, S., Adams, J., and Allen, T. (2015). 5th Generation (2015) Seismic Hazard Model for Southwest British Columbia, 11th Canadian Conference on Earthquake Engineering. Victoria:21–24.
Satake, K., Wang, K., and Atwater, B. F. (2003). Fault slip and seismic moment of the 1700 Cascadia earthquake inferred from Japanese tsunami descriptions. J. Geophys. Res. 108, 2535. doi:10.1029/2003JB002521
Schnabel, P. B., Lysmer, J., and Seed, H. B. (1972). SHAKE: A Computer Program for Earthquake Response Analysis of Horizontally Layered Sites. Technical Report Rept. EERC 72-12. Berkeley: Earthquake Engineering Research Center, University of California.
Shao, G., Li, X., Ji, C., and Maeda, T. (2011). Focal mechanism and slip history of the 2011 Mw9.1 off the Pacific coast of Tohoku earthquake, constrained with teleseismic body and surface waves. Earth Planets Space 63, 559–564. doi:10.5047/eps.2011.06.028
Silva, W. J., and Darragh, R. B. (1995). Engineering Characterization of Strong Ground Motion Recorded at Rock Sites. Draft Final Report Submitted to Electric Power Res. Inst., EPRI RP 2556-48.
Somerville, P., Skarlatoudis, A., and Li, W. (2013). Ground Motions and Tsunamis from Large Cascadia Subduction Earthquakes Based on the 2011 Tohoku, Japan Earthquake. U.S. Geol. Surv. Final Report. 81.
Somerville, P., Graves, R., and Collins, N. (2008). Ground Motions from Large Cascadia Subduction Earthquakes. U.S. Geol. Surv. Final Rept. Award Number 06HQGR0160.
Strasser, F. O., Arango, M. C., and Bommer, J. J. (2010). Scaling of the source dimensions of interface and intraslab subduction-zone earthquakes with moment magnitude. Seismol. Res. Lett. 81, 941–950. doi:10.1785/gssrl.81.6.941
Thomson, W. T. (1950). Transmission of elastic waves through a stratified solid. J. Appl. Phys. 21, 89–93. doi:10.1063/1.1699629
Wang, K., Wells, R., Mazzotti, S., Hyndman, R. D., and Sagiya, T. (2003). A revised dislocation model of interseismic deformation of the Cascadia subduction zone. J. Geophys. Res. 108, 2026. doi:10.1029/2001JB001227
Yenier, E., and Atkinson, G. M. (2015). Regionally adjustable generic ground-motion prediction equation based on equivalent point-source simulations: application to central and Eastern North America. Bull. Seismol. Soc. Am. 105, 1989–2009. doi:10.1785/0120140332
Keywords: cascadia megathrust earthquake, simulation of ground motions, earthquake site response, seismic hazard assessment, ground-motion prediction equations for large interface earthquakes
Citation: Ghofrani H, Atkinson GM and Molnar S (2017) Overview of Ground-Motion Issues for Cascadia Megathrust Events: Simulation of Ground-Motions and Earthquake Site Response. Front. Built Environ. 3:55. doi: 10.3389/fbuil.2017.00055
Received: 22 June 2017; Accepted: 12 September 2017;
Published: 29 September 2017
Edited by:
Solomon Tesfamariam, University of British Columbia, CanadaReviewed by:
Vladimir Sokolov, Saudi Geological Survey, Saudi ArabiaAlin Radu, University of Bristol, United Kingdom
Copyright: © 2017 Ghofrani, Atkinson and Molnar. This is an open-access article distributed under the terms of the Creative Commons Attribution License (CC BY). The use, distribution or reproduction in other forums is permitted, provided the original author(s) or licensor are credited and that the original publication in this journal is cited, in accordance with accepted academic practice. No use, distribution or reproduction is permitted which does not comply with these terms.
*Correspondence: Hadi Ghofrani, hghofra@uwo.ca