Vulnerability and Robustness of Civil Infrastructure Systems to Hurricanes
 Shuoqi Wang
 Dorothy A. Reed
- Department of Civil and Environmental Engineering, University of Washington, Seattle, WA, United States
Civil infrastructure systems play an important role in community resilience. Without proper functioning of the infrastructure, especially power delivery, society will not recover quickly from disruptive events, such as hurricanes. In this paper, the vulnerability, response, and recovery of selected infrastructure at the system level for several hurricanes in the USA are modeled using geostatistical methods, employing post-event data. Inoperability is the main variable modeled for each infrastructure system. In this paper, robustness is a property considered to be the opposite of vulnerability, and it plays an important role in the resiliency modeling. The infrastructure systems examined in this paper are electric power delivery and telecommunications. Connections among the systems are briefly explored.
Introduction
Civil infrastructure is defined as a set of interconnected lifelines and other systems upon which society depends for proper functioning. These include human or social systems, built or gray systems and natural or green systems. In this section, definitions of the infrastructure systems employed in this paper are provided.
“Human” infrastructure systems (also known as “purple infrastructure”) represent the social organization of a community primarily in terms of the activities and behaviors of the individuals that comprise the community. “Green” infrastructure is defined by the Conservation Fund (2013) as “a network of natural areas and open spaces such as woodlands, wetlands, trails and parks that conserves ecosystems, helps sustain clean air and water and provides many other benefits to people and wildlife.” Rottle (2013) has provided a taxology of urban green infrastructure as follows: (1) social, such as community outdoor spaces; (2) biological, such as greenbelts and tree canopies that support biodiversity; (3) hydrological, such as water as a resource and aquatic system, especially storm water runoff systems; (4) circulatory, such as pedestrian walkways, cycling paths, and other transportation systems; and (5) metabolic or energy producing elements, such as solar panels and other small-scale energy generators.
Gray infrastructure systems are those that are built; the “gray” often refers to the color of reinforced concrete. Chang et al. (2005) characterized the gray infrastructure as a set of 11 networked interdependent systems often referred to as “lifelines.” The lifelines include transportation, power delivery, and utilities, such as wastewater treatment and water supply. The lifelines are not independent, but have many types of interactions [e.g., Rinaldi et al. (2001)]. Interdependency is defined here as “the multi or bi-directional reliance of an asset, system, network, or collection thereof, within or across sectors, on input, interaction, or other requirement from other sources in order to function properly” (Pederson et al., 2006).
In the civil engineering literature, the modeling of interdependencies is predominantly by characterizing mathematically the relationship between constituent system elements through individual recovery models. In this paper, interdependency metrics involving gray systems are employed using input–output models derived from Reed et al. (2009, 2015) and Wang (2017) for hurricane and storm data.
Methods
Resilience Models
Importance of Spatial Scale
Resilience is defined here as “the capacity for an entity to survive, adapt to and change in the face of disruptions.” The engineering community has engaged in a wide variety of approaches to modeling resilience [e.g., Bruneau et al. (2003), Lewis (2006), Peerenboom (2007), Rose (2007), McDaniels et al. (2008), Chang (2009), Cimellaro et al. (2009), Reed et al. (2009), Satumtira and Duenas-Osorio (2010), Cox et al. (2011), Chen and Miller-Hooks (2012), and Guikema et al. (2014)]. In this paper, resilience modeling centers on the representation established by Bruneau et al. (2003) whereby “resilience” was described by the dimensions of “robustness,” “rapidity,” “resourcefulness,” and “redundancy.”
Scaling in space and time is critical for assessing the impact of hazard disruptions on communities. Complexity becomes an issue as one increases the time and spatial scales. Typically, geo-coded models are the easiest formulation for examining the influence of weather hazards on large-scale infrastructure systems such as power delivery. The spatial and temporal aspects of the green and gray scales are illustrated in Figure 1. It is noted that analogies between green systems, such as forests and lifeline networks, exist and that extending numerical models for one may apply to another. Geographical information systems [e.g., ESRI (2015)] result in the layered approach illustrated where the physical co-location of various infrastructure systems can be mapped to assess interactions.
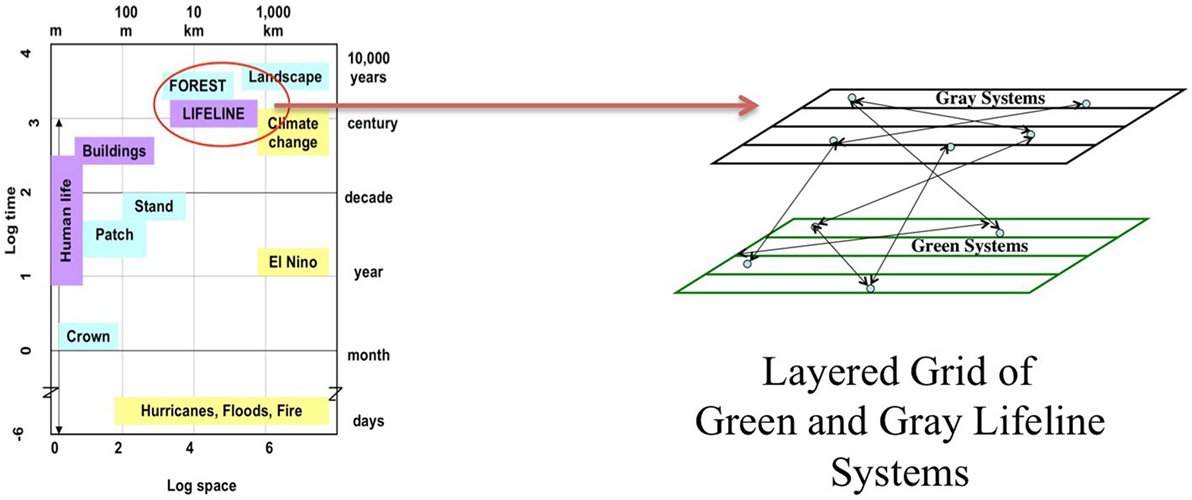
Figure 1. Space and time scales for green and gray infrastructure systems, after Gunderson and Holling (2002).
Due to the large scale of the built environment, the infrastructure system may be modeled at the scale of the community or locality, county or parish, state, region, or nationally. Mixed use models of these scales may also be employed [e.g., He and Cha (2016)]. Most modeling of infrastructure performance has been undertaken for gray systems, such as electric power delivery, telecommunications, transportation roadways, and utility services, such as water supply and treatment. Many of these models rely on the characterization of the functionality or operability of the individual and connected systems, i.e., the degree to which services are provided in order that society functions properly. Green infrastructure provides the crucial basic services of clean air and water. In addition, green systems contribute to food supply through agriculture, fisheries, and breeding of livestock, etc. Forests act as carbon sinks and contribute to the mental and physical well-being of society. Admittedly, the quality of these latter services is not as easily measured as others. Interactions with human systems may also be modeled as processes such as the planning and nurturing of green space, recycling, and choosing alternative modes of travel. In terms of being a product, sometimes green infrastructure may be substituted for gray.
Because historically electric power delivery has been identified as a critical system for overall infrastructure recovery, its structural network reliability has been studied in detail for hurricane events [e.g., Liu et al. (2005), Lee et al. (2007), Reed et al. (2010), and Kwasinski (2011)]. Because restoration of the civil infrastructure following an extreme event happens not through isolated system by isolated system, but rather as a combination of efforts, and the proper allocation of resources for restoration following any natural disaster is essential for rapid recovery, an investigation of the interdependent lifeline infrastructure is essential (Peerenboom, 2007; Peerenboom and Fisher, 2007). In this paper, individual systems are discussed first before interdependencies are considered.
Individual Systems
Resilience and recovery of lifeline systems over time are modeled here using the inoperability function X(t), derived from the operability function Q(t) as defined by Bruneau et al. (2003), as shown in Figure 2. In this figure, the inoperability X(t) is 0% when the system is fully functional, and then after landfall of the hurricane, it increases. A completely failed system would result in X(t) = 100%. The robustness and vulnerability of the system are shown in Figure 2. At the initial point of the response, i.e., X(t) when t = 0, or X0, the vulnerability can best be determined from a fragility analysis. The rapidity with which the system recovers depends in part upon the system redundancies, as well as upon the resourcefulness of the community to repair the damaged systems. It has been shown that X(t) for wind events is best fit using the mechanical analog of the free vibration of an overdamped single degree of freedom system (SDOF) as given in Eq. 1 (Reed et al., 2015):
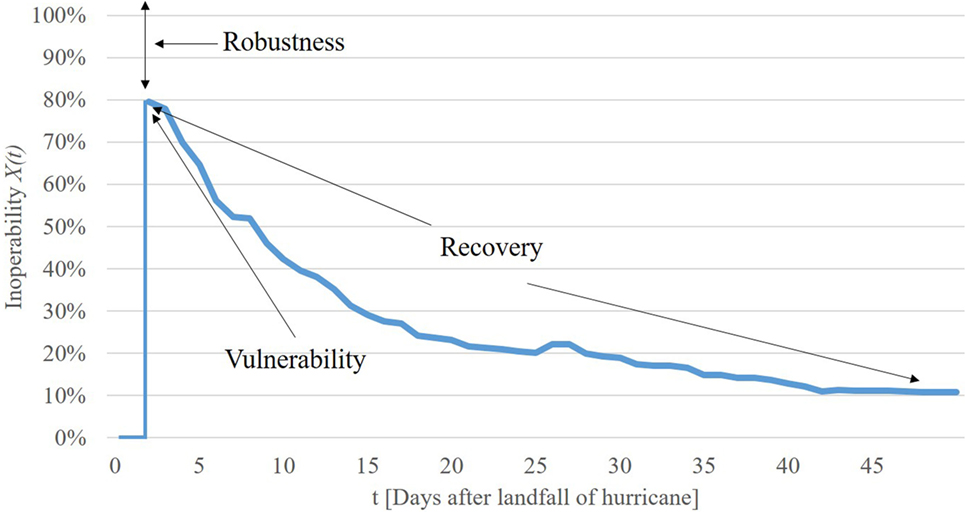
Figure 2. Inoperability X(t) function over time.
The fits of the two parameters ω and ζ to hurricane data are provided in the results section. In most hurricane events, it can be shown that X(t = 0) or X0 is the peak X(t) value also known as Xmax, and can best be characterized by a fragility function, defined as a conditional probability function in Eq. 2:
Fits of the fragilities for several storms will be discussed in the results section. The area underneath the X(t) curve is often determined as a vulnerability metric denoted here as “VUL,” as shown in Figure 3. Typically, the smaller the value of the vulnerability VUL, the more resilient the system. The parameter ROBUST used to rank the robustness is calculated from VUL as follows:
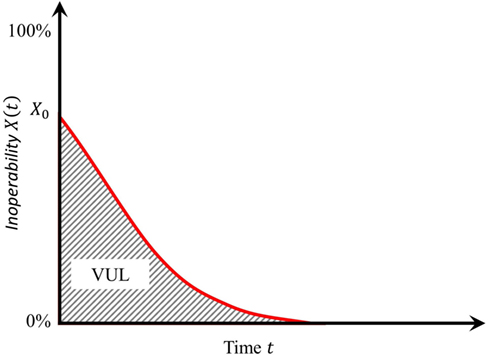
Figure 3. Inoperability function with the VUL parameter.
The resilience metric ROBUST increases as vulnerability VUL decreases. As an alternative to the mathematical formulation of the response and recovery over time via X(t), the percent of system restoration can be plotted versus time duration in days after landfall. This type of restoration plot can be useful in estimating future system damage during hurricanes.
Combined Systems
As mentioned previously, interdependency characterizes a “relationship” between systems or infrastructure entities in the context of resilience assessment. The modeling of the interdependent nature of the lifeline’s ability to function during and after an event using these resilience models for each lifeline, or lifeline subcomponent, is based in large part upon the manner in which the relationships are derived and evaluated for post-event analyses [e.g., Pederson et al. (2006) and Varga and Harris (2014)]. Network approaches and input–output models are prevalent in the literature for modeling interdependent systems regardless of hazard type [e.g., Liu et al. (2005), Lewis (2006), Lee et al. (2007), Rose (2007), Duenas-Osorio and Kwasinski (2012), He and Cha (2016)]. The advantage of input–output methods is the capability of the model to predict future performance.
In this paper, the input–output method using service outage data to characterize inoperability Xi is based upon Haimes’s extended Leontief formulation [e.g., Haimes (2004)]. The input–output inoperability model is given in matrix format in Eq. 4 (Reed et al., 2009):
Empirical data are required to estimate the influence coefficients as described in Reed et al. (2015). The fragilities can be estimated using Eq. 2. It is anticipated that analysis of multiple storms in the same region will allow for the prediction of the recovery and response metrics and models based on weather variables. The results section provides more details.
Results
Individual Systems
Electric Power Delivery
Inoperability Models
Electric power delivery in the US, given a D+ by ASCE (American Society of Civil Engineers, 2017), is designed and operated in the generation–transmission–distribution paradigm. The system is comprised of connected towers, poles, transformers, substations, and other equipment to transmit and feed power. Numerical modeling using the grid-based paradigm can become complex very quickly. State level grids for transmission systems cover larger geographical regions than do distribution grids at the neighborhood or locality level [e.g., Louisiana Public Service Commission (2012) and New York State Public Service Commission (2012)].
Typically, data for state wide outages are provided in the US through situation reports published by the Department of Energy, Energy Information Administration (Department of Energy, n.d.). Several hurricanes were examined in this investigation at the state level. Table 1 provides background information on these hurricanes derived from NOAA (National Oceanic and Atmospheric Administration, 2017). Plots of state level X(t) data over normalized time t in days for several hurricanes are shown in Figure 4. “Normalized” time is evaluated by dividing the restoration time by the total duration of restoration so that the final duration is unity. In this manner, the form of the curves may be compared. It can be seen that the data follow the exponential decay of the proposed SDOF model. The Katrina curve does not return to its original position, but rather finalizes at 90% of its pre-storm delivery. This adaptation of the system has been labeled the “new normal.” Figure 5 shows fitted SDOF models over time for each of these hurricanes separately. Table 2 provides the goodness of fit results for the model parameters using Eq. 1. The events are sorted by the resilience from highest to lowest. The total duration in days is the time reported to restore the power to pre-event capacity. The only exception is for Louisiana for Katrina, where the post-event X(t) reached a “new normal” of 10%.
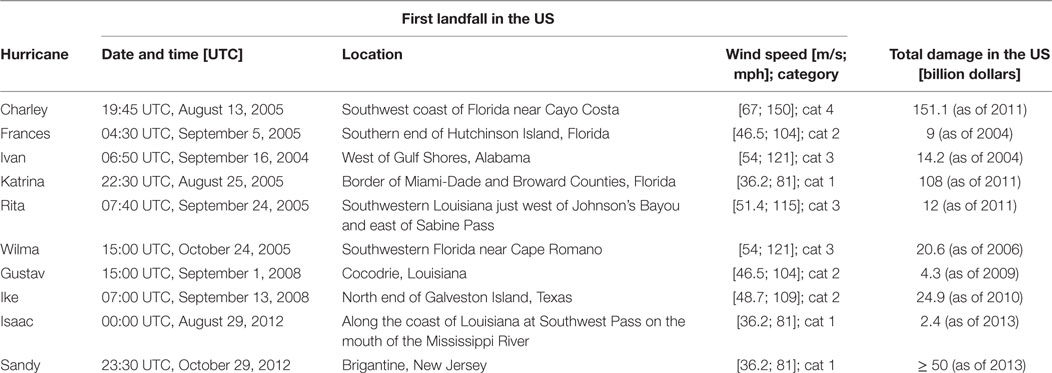
Table 1. Storm data derived from the National Hurricane Center.
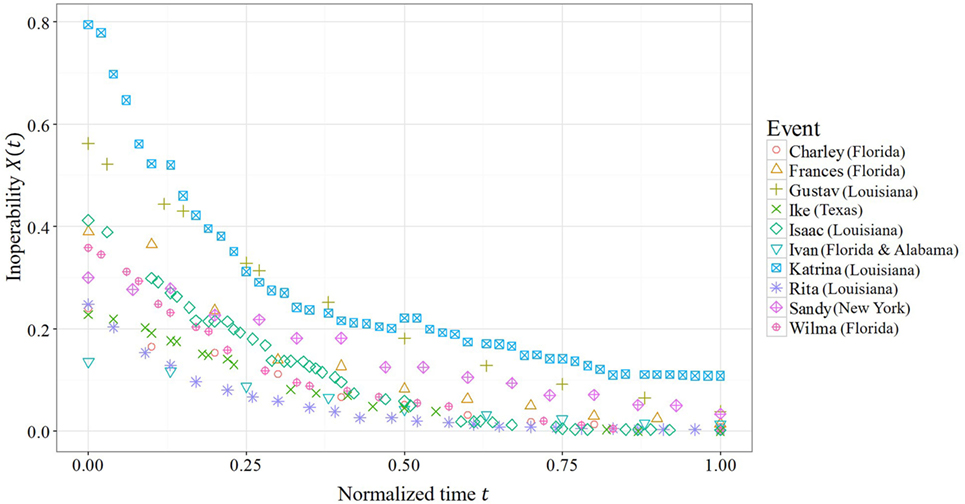
Figure 4. Inoperability data versus normalized time for several state level hurricane data sets.
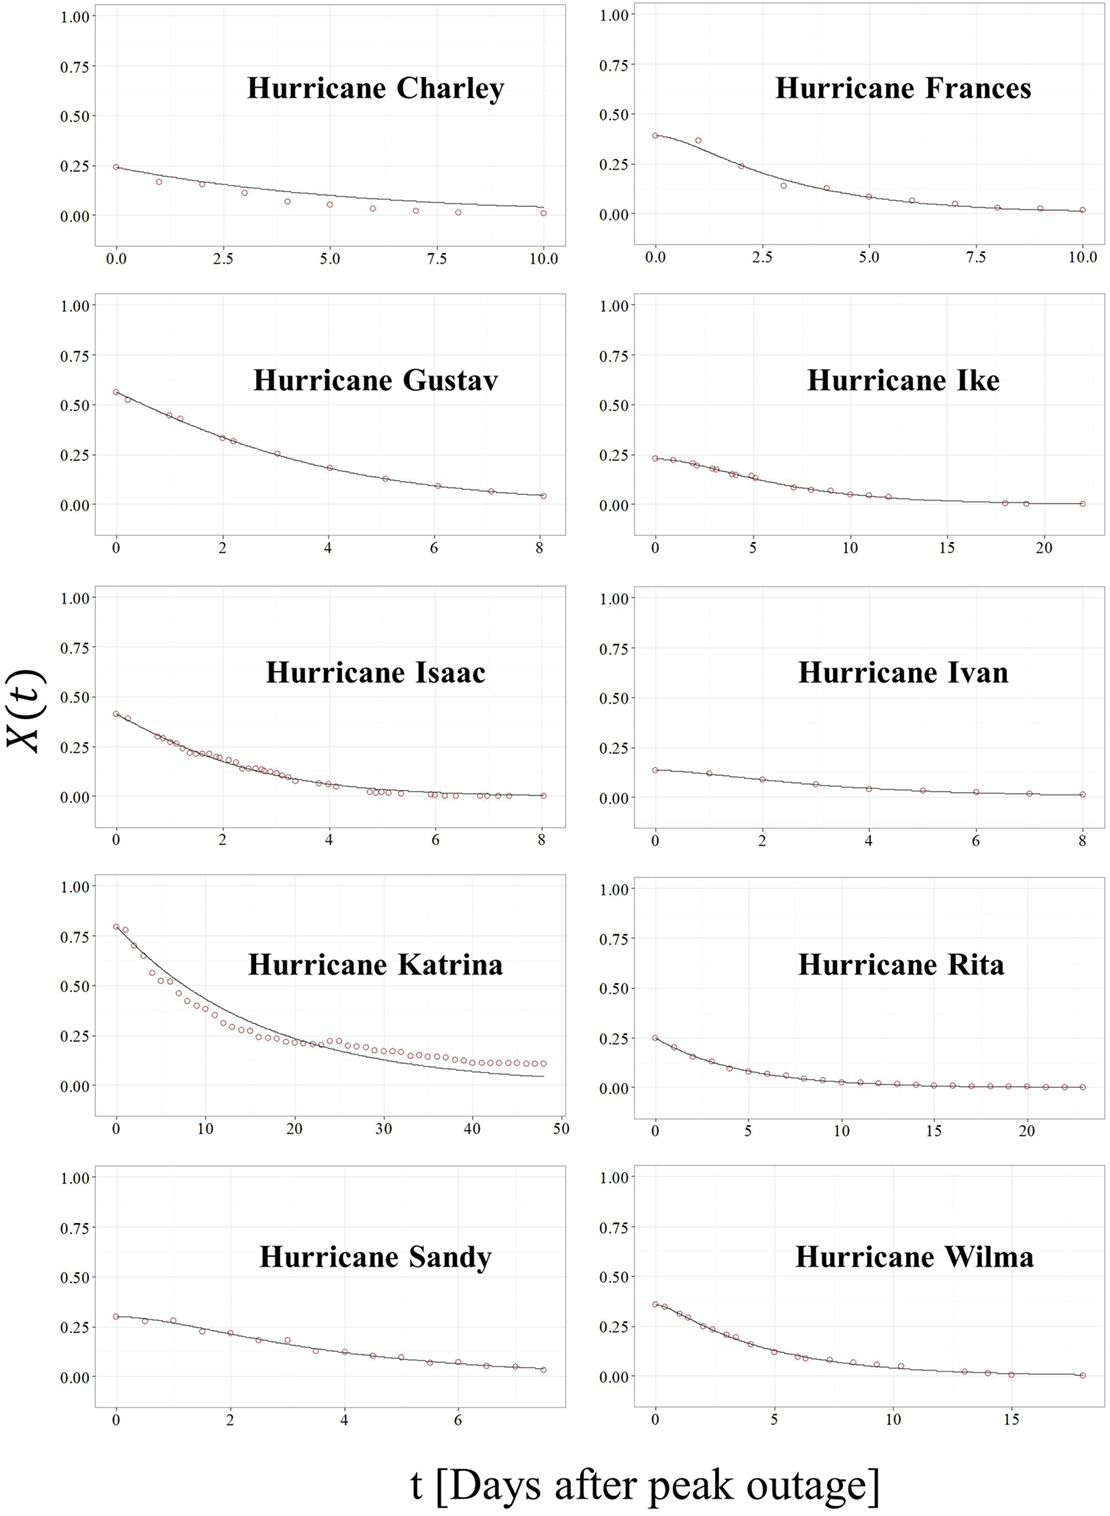
Figure 5. Inoperability X(t) fits for state level hurricane data.
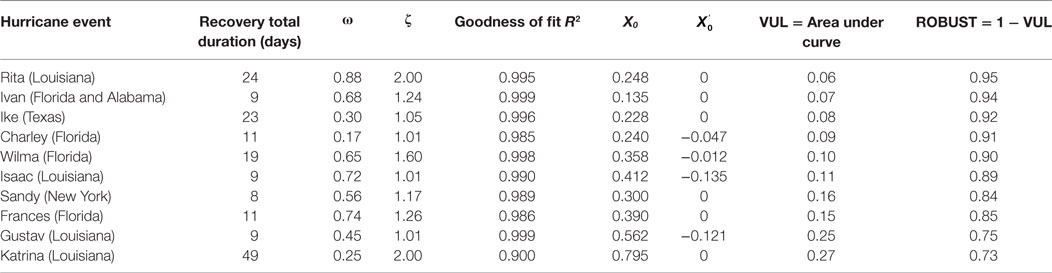
Table 2. Single degree of freedom system fits for X(t) data corresponding to the hurricanes described in Table 1.
In addition to the statewide data, inoperability data were available at the parish level for several storms in Louisiana from the Louisiana Public Service Commission (LPSC) (Louisiana Public Service Commission, 2012). The results of the SDOF models for Hurricane Isaac are given in Table 3 as an example of a parish data fit. The models are ranked from least to most resilient. It can be seen that the damping parameter ζ remains in the range of 1.01–2, whereas the frequency parameter ω varies more broadly. In addition to Hurricane Isaac, models were fit to Hurricane Sandy outage data per locality in New York City as discussed in Reed et al. (2016). The relationship between VUL parameter and the X0 value is examined in Figure 6 or the three spatial scales. The trend is similar regardless of spatial scale.
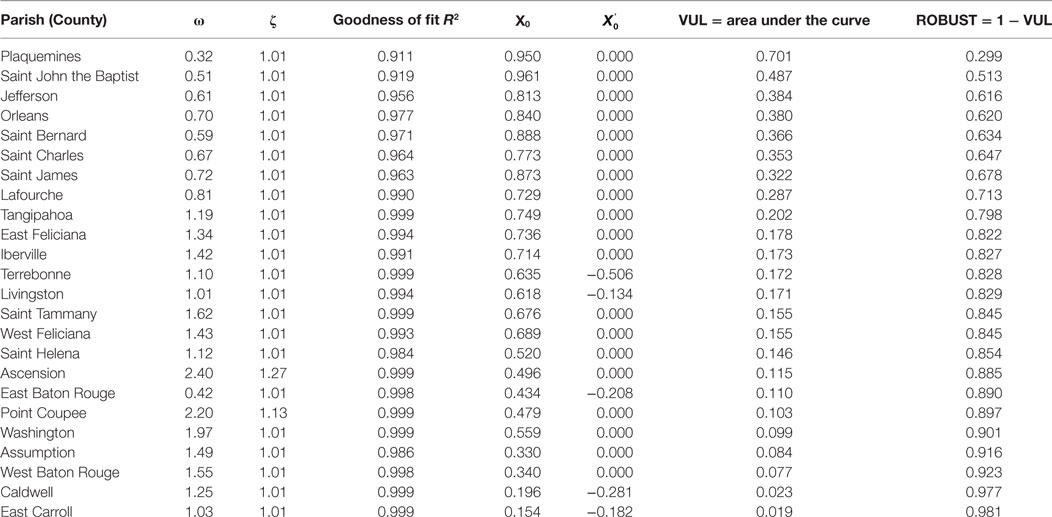
Table 3. Frequency and damping parameters for selected parishes in Louisiana for Hurricane Isaac.
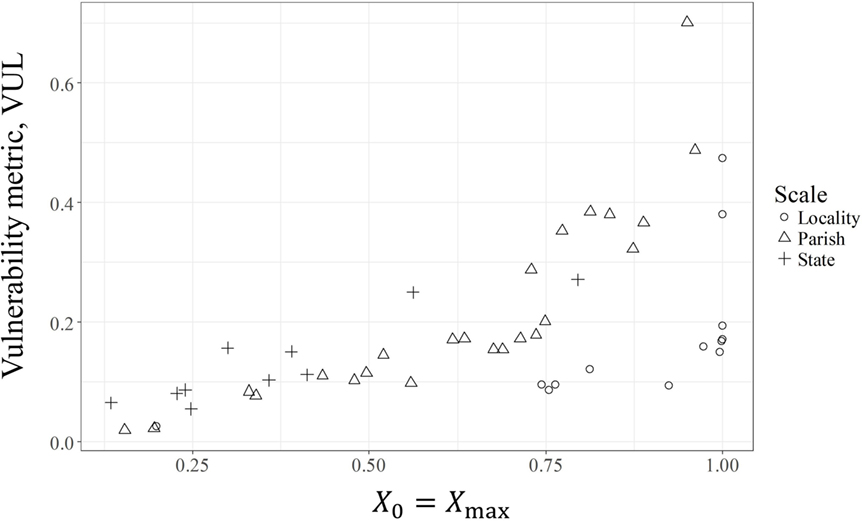
Figure 6. The relationship between the parameters VUL and X0 for hurricane data at three spatial scales.
A linear relationship between the peak wind speed V and the frequency parameter ω was investigated as shown in Figure 7 but the goodness of fit (48%) is not very convincing.
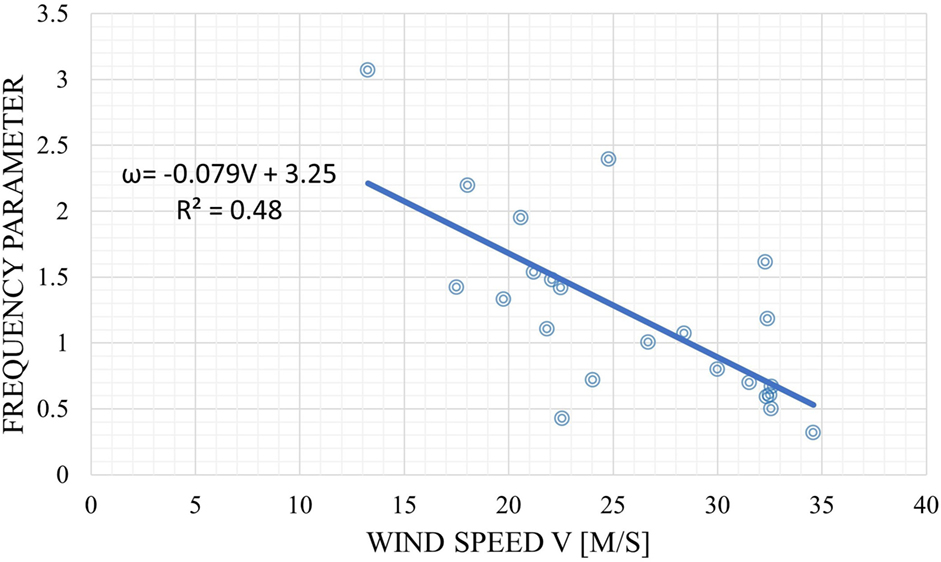
Figure 7. Relationship between the frequency parameter and wind speed V for Hurricane Isaac at the parish level.
Time to Recovery Models Based on the Restoration Curve
In order to estimate percent restoration based on time after landfall, the data for the X(t) analysis were plotted versus time to recovery in days after landfall as shown in Figure 8. For example, Louisiana had complete system recovery after 9 days for Isaac. The “rapidity” parameter of resilience may be evaluated through this type of outage characterization. Local emergency responders frequently want to know the time to restoration of power delivery services at say 50% and larger, as this enables them to plan for resource allocation pre-event. Although this result may be determined by estimating the inoperability function X(t) = 50%, it may also be found from the simple restoration curve of Figure 8. A lognormal distribution was fitted to the restoration data in Figure 8 in an attempt to better characterize the data for prediction. The results appear in Table 4, based upon the formulation in Eq. 5 [e.g., Haldar and Mahadevan (2000)]:
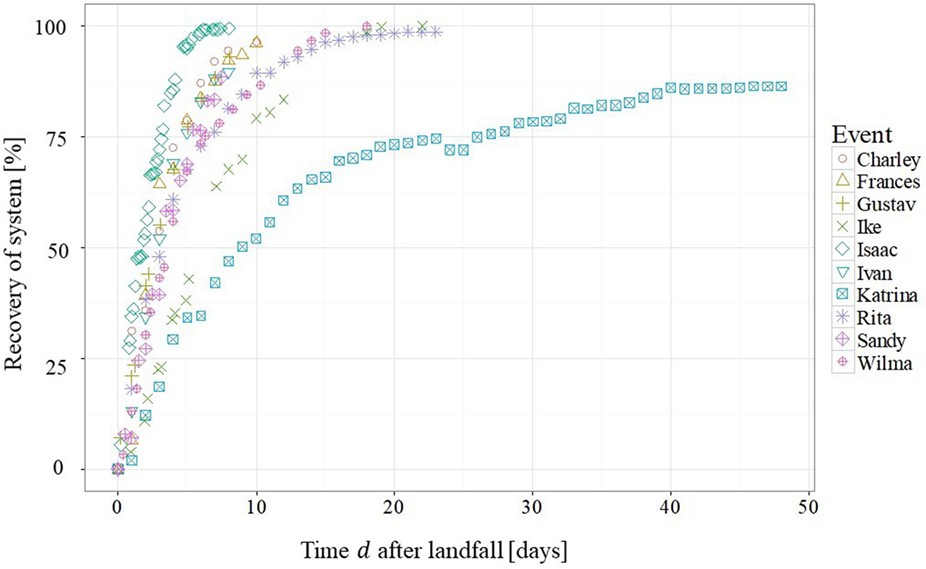
Figure 8. The cumulative probability function for the time to recovery for the state level hurricane data.
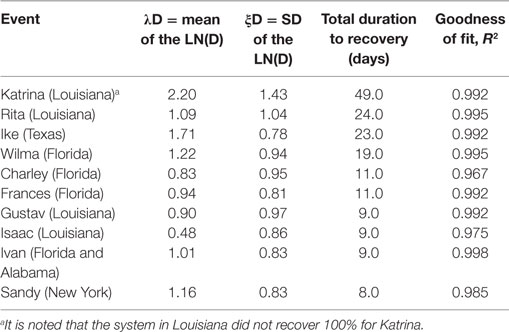
Table 4. Lognormal distribution parameters for “time to recovery” models.
The results suggest that the lognormal distribution could be used to predict the time to total or partial (say 50%) power restoration for storms with peak wind speeds in the ranges investigated. Unfortunately, simple relationships between the peak wind speed for the hurricanes and the corresponding lognormal parameters were not statistically significant.
Fragility Models Using Logistic Regression
As mentioned previously in Section “Combined Systems,” evaluating the system-level fragility enables a characterization of the infrastructure that allows for prediction of outages during future hurricanes. In order to obtain fragility models F(Xmax|H1, … Hn) at the system level for power delivery, weather variable data (H1, …, Hn) at the same geographical scale are necessary. For limited hurricane data sets, fragilities of the following logistic regression format were found, based upon previous work by Reed et al. (2016):
Equation 6 was analyzed for Isaac, Sandy, and Ike data sets. Table 5 contains limited preliminary results of the fitted models of the fragilities where the hazard variables were the peak wind speed [m/s] and storm surge [m], respectively. Ongoing studies for several data sets are underway using archived H*Wind datasets (HWind Scientific, 2015).
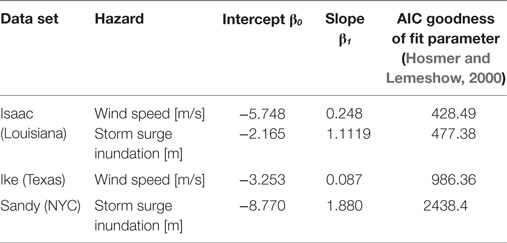
Table 5. Logistic regression results for selected storms; some results are from Reed et al. (2016).
Telecommunications
Limited sets of telecommunications customer outage data for hurricanes were available for inoperability analysis as shown in Table 6. In all cases, the telecommunications restoration lags behind the power restoration by a few days, which is not specified in the table. Typically, landlines and telecomm towers either use distribution poles or are located close-by and repair crews for power are the first in line to make repairs. Table 6 provides the details of the model fits. It is noted that the damping parameter remains constant for these data.
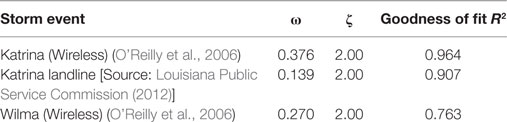
Table 6. Inoperability results for telecommunications outage data.
Combined Power-Telecommunications Models
Although interdependency relationships can be examined for power and other systems, the ability to employ models is limited by available restoration data. In this paper, the focus is on telecommunications interdependency not only because of the data available, but also because preliminary observations suggest that communications post-event are critically important.
The input–output model of Eq. 4 was fitted to three hurricane data sets for power and telecommunications systems. The two system model can be reduced to
In order to find the influence coefficients aij, the method described in Reed et al. (2015) is used, where the slope of the linear relationship between the two inoperability functions provides the coefficient a21. In this manner, it is possible to numerically simulate X2(t) given X1(t), and the appropriate fragility function as given in Eq. 2. Figure 9 provides the influence coefficients corresponding to the data sets given in Table 6. That is, the restoration of both power and telecommunications may be predicted for hurricanes in the regions studied using the fragility models in conjunction with the SDOF for the power X(t) and the interdependency relationship for the telecommunications X(t). Alternatively, the telecommunications X(t) may be evaluated through the SDOF model alone.
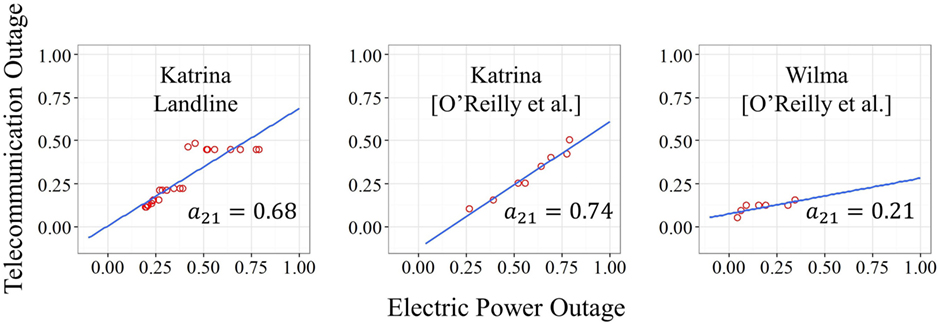
Figure 9. Linear regression to identify influence coefficients.
Summary and Conclusion
It has been shown that inoperability models for infrastructure service post-hurricane are best fit using models derived from SDOF mechanical models. Fragility models at the system level provide additional information regarding system vulnerability but require extensive geostatistical data. Ultimately the input–output models based upon inoperabilities may be used to predict performance in future storms.
As outlined in this paper, inoperability models combine fragilities, robustness, rapidity, and resourcefulness in one complete numerical system for resilience modeling. It is anticipated that designers may use these models to develop post-event recovery strategies. One particular approach is to focus on the vulnerability parameter describing inoperability of power X(t = 0). Structural hardening of power delivery components, such as individual substations, transmission lines, and distribution feeders, is a common approach to decrease vulnerability and enhance electric power system robustness. Recent research into renewable power to enhance green infrastructure suggests that the implementation of micro-grids at the community level may also result in a more robust power system overall. Another approach to system robustness is to add power generation redundancy at the individual building level through building integrated photovoltaic panels and wind turbines [e.g., Wang et al. (2016)]. Ideally the recovery of the infrastructure systems should be based upon the expectations and perspectives of the community, rather than the infrastructure operators. That is, the community may place greater importance on access to water supply and treatment than other infrastructure services such as transit and roadways (transportation services), grocery stores (food services), and ATMs (financial services). Social science investigations into the expectations and needs of the community with regard to infrastructure services are critically important for complete resilience modeling.
Author Contributions
Both authors contributed equally to this work and agreed to be accountable for the content of the work.
Conflict of Interest Statement
The authors declare that the research was conducted in the absence of any commercial or financial relationships that could be construed as a potential conflict of interest.
Acknowledgments
The writers gratefully acknowledge the NIST Center of Excellence at Colorado State University and the NSF.
Funding
This work was supported by the National Science Foundation RAPID Collaborative for Hurricane Sandy under Grant Numbers CMMI 1316290 and CMMI 1263710 RAPID Collaborative for Hurricane Isaac. Other funding was provided by the Center for Risk-Based Community Resilience Planning. The Center was funded through a cooperative agreement between the U.S. National Institute of Standards and Technology and Colorado State University (Grant Number 70NANB15H044). The views expressed are those of the writer(s), and may not represent the official position of the National Science Foundation, the National Institute of Standards and Technology or the U.S. Department of Commerce.
References
American Society of Civil Engineers. (2017). Report Card for Infrastructure. [Online]. Available at: https://www.infrastructurereportcard.org
Bruneau, M., Chang, S. E., Eguchi, R. T., Lee, G. C., O’Rourke, T. D., Reinhorn, A. M., et al. (2003). A framework to quantitatively assess and enhance the seismic resilience of communities. Earthq. Spec. 19, 733–752. doi: 10.1193/1.1623497
Chang, S., McDaniels, T., and Reed, D. A. (2005). “Mitigation of extreme events: electric power outage and infrastructure failure interactions,” in The Economic Impacts of Terrorist Attacks, eds Richardson H. W., Gordon P., and Moore J. E. II (Cheltenham: Edward Elgar Publishing), 70–90.
Chang, S. E. (2009). Urban disaster recovery: a measurement framework and its application to the 1995 Kobe earthquake. Disasters 34, 303–327. doi:10.1111/j.1467-7717.2009.01130.x
Chen, L., and Miller-Hooks, E. (2012). Resilience: an indicator of recovery capabiliuty in intermodal freight transport. Transport. Sci. 46, 109–123. doi:10.1287/trsc.1110.0376
Cimellaro, G. P., Fumo, C., Reinhorn, A. M., and Bruneau, M. (2009). Quantification of Disaster Resilience of Health Care Facilities. Buffalo, NY: MCEER.
Conservation Fund. (2013). Green Infrastructure. Available at: https://www.conservationfund.org/our-work/urban-conservation/green-infrastructure
Cox, A., Prager, F., and Rose, A. (2011). Transportation security and the role of resilience: a foundation for operational metrics. Trans. Policy 18, 307–317. doi:10.1016/j.tranpol.2010.09.004
Department of Energy. (n.d.). US Energy Information Administration (EIA). [Online]. Available at: https://www.eia.gov (accessed September 27 2017).
Duenas-Osorio, L., and Kwasinski, A. (2012). Quantification of lifeline system interdependencies after the 27 February 2010 Mw 8.8 Offshore Maule, Chile earthquake. Earthq. Spec. 28, S581–S603. doi:10.1193/1.4000054
ESRI. (2015). ArcGIS, the Mapping Platform. ESRI. Available at: www.arcgis.com
Guikema, S. D., Nateghi, R., Quiring, S. M., Staid, A., Reilly, A. C., and Gao, M. (2014). Predicting hurricane power outages to support storm response planning. IEEE Access 2, 1364–1373. doi:10.1109/ACCESS.2014.2365716
Gunderson, L., and Holling, C. S. (2002). Eds., Panarchy: Understanding Transformations in Human and Natural Systems. Washington, DC: Island Press.
Haldar, A., and Mahadevan, S. (2000). Probability, Reliability, and Statistical Methods in Engineering Design. New York, NY: John Wiley & Sons.
He, X., and Cha, E. (2016). “Modeling the operability of interdependent critical infrastructure systems for quantification of the integrated network resilience,” in EMD-PMC Conference (Nashville, TN).
HWind Scientific. (2015). Hwind Scientific Real-Time Hurricane Impact Data. H*Wind. Available at: www.hwind.co
Kwasinski, A. (2011). “Effects of notable natural disasters from 2005 to 2011 on telecommunications infrastructure: lessons from on-site damage assessments,” in IEEE 33rd International Telecommunications Energy Conference (INTELEC), (Amsterdam). doi:10.1109/INTLEC.2011.6099777
Lee, E. E. II, Mitchell, J. E., and Wallace, W. A. (2007). Restoration of services in interdependent infrastructure systems: a network flows approach. IEEE Trans. Syst. Man Cybernet. C 37, 1303–1317. doi:10.1109/TSMCC.2007.905859
Lewis, T. (2006). Critical Infrastructure Protection in Homeland Security: Defending a Networked Nation. Hoboken, NJ: Wliey-Interscience.
Liu, H., Davidson, R., Rosowsky, D. V., and Stedinger, J. R. (2005). Negative binomial regression of electric power outages in Hurricanes. J. Infrastruct. Syst. 11, 258–267. doi:10.1061/(ASCE)1076-0342(2005)11:4(258)
Louisiana Public Service Commission. (2012). Emergency Operations Center: Daily Service Outage Reports (Excel Spreadsheets for Each Day Summarizing Electric and Phone Outages). Baton Rouge, LA: Louisiana Public Service Commission (LPSC).
McDaniels, T., Chang, S., Cole, D., Mikawoz, J., and Longstaff, H. (2008). Fostering resilience to extreme events within infrastructure systems: characterizing decision contexts for mitigation and adaption. Global Environ. Change 18, 310–318. doi:10.1016/j.gloenvcha.2008.03.001
National Oceanic and Atmospheric Administration. (2017). Tropical Cyclone Reports. Available at: http://www.nhc.noaa.gov/data/tcr
New York State Public Service Commission. (2012). Hurricane Sandy Outage Data by Locality (Excel Spreadsheets of Electric Outages). Albany, NY: New York State Public Service Commission.
O’Reilly, G., Ahmad, J., Nagarajan, R., Brown, T., and Conrad, S. (2006). “Critical infrastructure analysis of telecom for natural disasters,” in Networks 2006: 12th International Telecommunications Network Strategy and Planning Symposium, New Delhi. doi:10.1109/NETWKS.2006.300396
Pederson, P., Dudenhoeffer, D., Hartley, S., and Permann, M. (2006). Critical Infrastructure Interdependency Modeling: A Survey of US and International Research. Idaho Falls: Idaho National Laboratory.
Peerenboom, J. (2007). “PNWER,” in Regional Critical Infrastructure Interdpendencies Seminar (Redmond, WA)
Peerenboom, J. P., and Fisher, R. F. (2007). “Analyzing cross-sector interdependencies,” in IEEE 40th Hawaii International Conference on System Sciences (Waikoloa, HI). doi:10.1109/HICSS.2007.78
Reed, D., Friedland, C. J., Wang, S., and Massarra, C. (2016). Multi-hazard system-level logit fragility functions. Eng. Struct. 122, 14–23. doi:10.1016/j.engstruct.2016.05.006
Reed, D., Powell, M. D., and Westerman, J. M. (2010). Energy supply system performance for hurricane katrina. J. Energy Eng. 136, 95–102. doi:10.1061/(ASCE)EY.1943-7897.0000028
Reed, D., Wang, S., Kapur, K., and Zheng, C. (2015). Systems-based approach to interdependent electric power delivery and telecommunications infrastructure resilience subject to weather-related hazards. J. Struct. Eng. 142. doi:10.1061/(ASCE)ST.1943-541X.0001395
Reed, D., Kapur, K. C., and Christie, R. D. (2009). Methodology for assessing the resilience of networked infrastructure. IEEE Syst. J. 3, 174–180. doi:10.1109/JSYST.2009.2017396
Rinaldi, S. M., Peerenboom, J. P., and Kelly, T. K. (2001). Identifying, understanding and analyzing critical infrastructure interdependencies. IEEE Control Syst. Mag. 21, 11–25. doi:10.1109/37.969131
Rose, A. (2007). Economic resilience to disasters: multidisciplinary origins and contextual dimensions. Environ. Hazard. 7, 383–398. doi:10.1016/j.envhaz.2007.10.001
Rottle, N. D. (2013). Urban green infrastructure for climate benefit: global to local. Nord. J. Arch. Res. 25, 43–66.
Satumtira, G., and Duenas-Osorio, L. (2010). “Synthesis of modeling and simulation methods on critical interdependencies research,” in Sustainable Infrastructure Systems: Simulation, Imaging and Intelligent Engineering (New York, NY: Springer-Verlag), 1–51.
Varga, L., and Harris, J. (2014). “Adaptation and resilience of interdependent infrastructure systems: a complex systems perspective,” in International Symposium for Next Generation Infrastructure Conference Proceedings: International Institute of Applied Systems Analysis (Vienna, Austria).
Wang, S. (2017). Integrated Approach and Analysis of Reliability, Robustness, Resilience and Infrastructure Applications. Seattle, WA: University of Washington.
Keywords: hurricane, wind engineering, structural engineering, resilience, fragility
Citation: Wang S and Reed DA (2017) Vulnerability and Robustness of Civil Infrastructure Systems to Hurricanes. Front. Built Environ. 3:60. doi: 10.3389/fbuil.2017.00060
Received: 01 July 2017; Accepted: 20 September 2017;
Published: 10 October 2017
Edited by:
Kurtis Robert Gurley, University of Florida, United StatesReviewed by:
Aly Mousaad Aly, Louisiana State University, United StatesFranklin Lombardo, University of Illinois at Urbana–Champaign, United States
Copyright: © 2017 Wang and Reed. This is an open-access article distributed under the terms of the Creative Commons Attribution License (CC BY). The use, distribution or reproduction in other forums is permitted, provided the original author(s) or licensor are credited and that the original publication in this journal is cited, in accordance with accepted academic practice. No use, distribution or reproduction is permitted which does not comply with these terms.
*Correspondence: Dorothy A. Reed, reed@uw.edu