A Framework for Occupancy Tracking in a Building via Structural Dynamics Sensing of Footstep Vibrations
 Jeffrey D. Poston
 R. Michael Buehrer1
  Pablo A. Tarazaga
- 1Wireless@VT, Electrical and Computer Engineering Department, Virginia Tech, Blacksburg, VA, United States
- 2VT-SIL, Mechanical Engineering Department, Virginia Tech, Blacksburg, VA, United States
Counting the number of occupants in building areas over time—occupancy tracking—provides valuable information for responding to emergencies, optimizing thermal conditions or managing personnel. This capability is distinct from tracking individual building occupants as they move within a building, has lower complexity than conventional tracking algorithms require, and avoids privacy concerns that tracking individuals may pose. The approach proposed here is a novel combination of data analytics applied to measurements from a building’s structural dynamics sensors (e.g., accelerometers or geophones). Specifically, measurements of footstep-generated structural waves provide evidence of occupancy in a building area. These footstep vibrations can be distinguished from other vibrations, and, once identified, the footsteps can be located. These locations, in turn, form the starting point of estimating occupancy in an area. In order to provide a meaningful occupancy count, however, it is first necessary to associate discrete footsteps with individuals. The proposed framework incorporates a tractable algorithm for this association task. The proposed algorithms operate online, updating occupancy count over time as new footsteps are detected. Experiments with measurements from a public building illustrate the operation of the proposed framework. This approach offers an advantage over others based on conventional technologies by avoiding the cost of a separate sensor system devoted to occupancy tracking.
1. Introduction
1.1. Research Motivation
A building’s structural dynamics instrumentation holds the potential to provide a new awareness about building occupants: occupancy tracking, counting the number of occupants in building areas over time. Recently, several research groups reported that this kind of instrumentation, namely, accelerometer or geophone sensors, could detect footstep-generated structural waves produced by building occupants (Dobbler et al., 2014; Hamilton et al., 2014; Pan et al., 2017). This understanding enabled a number of independent approaches to locating occupants by means of their footstep vibrations [e.g., Bahroun et al. (2014), Pan et al. (2014), Mirshekari et al. (2016), Poston et al. (2017)]. Furthermore, extracting features from the footstep measurements and applying the features to statistical models of human gait shows promise for distinguishing among individuals by their characteristic gait (Pan et al., 2015) or determining gender (Bales et al., 2016).
With footstep-based localization as a starting point, this paper proposes an algorithmic framework for occupancy tracking. This is valuable information for several applications. Clearly, this occupancy tracking would be vital to public safety agencies responding to an emergency in the building. Also, this information enables occupancy-based heating and cooling (Erickson et al., 2009; Goyal et al., 2013; Zhang et al., 2013), a technology that could provide more cost effective thermal control than existing practice. More generally, occupancy tracking could augment current technology for personnel management and building security.
1.2. Related Work
The survey in Teixeira et al. (2010) documents a number of systems that could count the number of occupants in an area. A great many of these rely on wireless technologies for wide sensing coverage in a building. Other technologies (e.g., floor-based pressure switch or gage, ultrasonic, pyroelectric/infrared, etc.) typically require greater sensor densities than wireless. In some wireless system designs occupants need to carry a device with the requiste technology. The references cited within Gu et al. (2009) provide examples of this kind of system. These device-oriented systems offer a means to locate individuals and then occupancy counting is a byproduct, but this approach does pose a burden on the occupant of carrying a specific device. Other designs (e.g, Woyach et al. (2006), Xu et al. (2013), Zeng et al. (2016)) free the occupant from this burden, because the system deduces occupancy by observing how a person’s body influences radio wave propagation between the system’s radio transmitters and receivers. In practice, this latter method requires a meticulous survey within the building of how an object at a given location changes radio wave propagation. Detecting, counting, and tracking persons by computer vision techniques is a well-established technology (Sarkar et al., 2005; Teixeira et al., 2009; Lu et al., 2014). Given the state-of-the-art in facial recognition, however, this camera-based technology does pose troubling privacy concerns.
Distinct from the question of selecting the sensor modality is the question of the estimation framework. In some prior work, the building occupancy is treated as a Markov chain with the states being the number of persons in each room and the transitions between states corresponding to movement between adjacent rooms. Representative examples of Markovian frameworks for occupancy include Erickson and Cerpa (2010) and Liao and Barooah (2010). As these authors acknowledge, however, formulating that kind of model requires care to avoid an enormous number of states and may need a measurement campaign in order to obtain meaningful prior distributions for the states and transitions. By contrast, if an estimation technique is meant for real time, online processing of measurements then the technique’s computational burden requires careful consideration. Moreover, for wide applicability, it is preferable to have estimations that need little or no prior characterization of building occupancy statistical distributions.
1.3. Scope and Organization
The aim of this research is to introduce an algorithmic framework for occupancy tracking derived from measurements of footstep-generated vibrations. The paper’s contributions include:
• A framework that incorporates a computationally tractable (i.e., polynomial time) method for online processing of continuous building sensor measurements.
• A framework that accommodates a variety of footstep-based localization methods reported in the literature.
• A demonstration of the framework with actual measurements from a public building, Goodwin Hall on the campus of Virginia Tech, originally instrumented only to study structural dynamics.
To expand a bit on the last point, given the myriad of possible sensor configurations, occupant movement patterns, footstep localization techniques, and statistical feature extraction, an individual experiment or simulation result cannot encompass all cases of these factors. What the demonstration experiments do offer is a template quantifying the interplay of footstep localization accuracy and movement pattern on the overall occupancy tracking accuracy. With this template, one can craft other experiments to evaluate the framework’s performance in other circumstances to assess if it meets accuracy requirements of a particular application. For example, in the previously mentioned occupancy-based heating and cooling application, one study concluded “Results show that 20% occupancy estimation errors have negligible impact (0.28%) on HVAC energy savings estimation of 14%” (Erickson et al., 2009).
The remainder of the paper is organized as follows: Section 2.1 delineates the occupancy tracking capability from existing tracking algorithms and explains algorithmic complexity considerations. Section 2.2 describes the process of detecting footsteps and distinguishing them from other vibration-generating events in a building. Section 2.3 explains the algorithm for associating detected footsteps with the proper individuals in a construct known as a track. Section 2.4 then shows how to determine from these tracks the occupancy over time in one or more regions of a building. Then, in Section 3, the paper turns to a set of experiments demonstrating operation of the framework with actual measurements from a public building, Goodwin Hall on the campus of Virginia Tech. After reviewing some background for this experimental work (Section 3.1), Section 3.2 documents the sensor configuration and the means for establishing ground truth in the experiments. Then, Section 3.3 describes the specific scenarios for building occupant movement and choice of system parameters for the demonstration experiments Section 3.4 discusses the results. Finally, the paper closes with Section 4 commenting on the limitations of this work and potential enhancements to the framework to overcome some limitations.
2. Methodology
2.1. Occupancy Tracking versus Tracking Occupants
There are important distinctions between occupancy tracking, the focus of this paper’s proposed framework, and tracking occupants. If the latter capability were implemented one could, in principle, query the estimated locations of each tracked individual and tally at regular time intervals all persons within a region of interest to generate occupancy reports. Tracking each occupant, however, has the burden of maintaining state estimates (e.g., position, velocity) for each of them even when, for example, they stop moving to sit at a desk. Nonetheless, it is worthwhile to review some prior literature on this multitarget tracking problem studied for radar and sonar systems [e.g., Bar-Shalom and Tse (1975), Reid (1979), Fortmann et al. (1983), Bar-Shalom and Fortmann (1988), Bar-Shalom (1990, 1992), Blackman and Popoli (1999), Bar-Shalom and Blair (2000)] due to common aspects of the two problems. A sequence of radar or sonar detections associated with a particular object (target) enable estimation of the object’s trajectory by techniques such as Kalman filtering (Kalman, 1960) or particle filtering (Gordon et al., 1993). The resulting sequence of state estimates is known as a track. In order for this track to be meaningful, the detections must have been assigned to the correct object. One approach known as joint probabilistic data association (JPDA) (Fortmann et al., 1983) aims to find a match by drawing from optimization techniques developed for the assignment problem (Kuhn, 1955) in operations research. There are two fundamental issues with JPDA for analyzing building occupants. First, JPDA relies on a fixed, known number of tracks. Second, it performs the matching at one instant; thus, it can only be locally optimal at that point in time. Another approach that does account for the time history of detections is the multiple hypothesis test (MHT) (Reid, 1979). At the time of each new detection MHT evaluates a set of hypotheses over the entire set totaling NT detections to date. The hypotheses for the new detection include: it is a false alarm, it belongs to track #1, #2, … , NT. This approach offers optimality in a maximum likelihood sense; however, it does pose complexity concerns. The need to consider an ever-growing set of hypotheses over all time history produces an exponental growth in computation.
Instead of seeking a jointly optimal solution, this paper’s aim is to identify assignments that are at least sequentially optimal. The step-by-step nature of a person’s walking gait lends itself to a sequential formulation. For the problem of finding the most likely sequence of events the algorithmic strategy known as dynamic programming (Bellman, 1957) finds a best fit by decomposing the global search into a series of tractable subproblems, and this strategy can accommodate cases where the input is corrupted by measurement error. Furthermore, this class of optimization offers polynomial time algorithms. Many fields of study produced dynamic programming algorithms. A few examples include genetics where sequence alignment algorithms (Needleman and Wunsch, 1970; Smith and Waterman, 1981) match gene sequences, speech processing where the dynamic time warping algorithm (Velichko and Zagoruyko, 1970) assists with word recognition and digital communications where the Viterbi algorithm (Viterbi, 1967) decodes information sent with error correcting codes. For this paper a modified form of the Viterbi algorithm and, in particular, its trellis data structure (Forney, 1973) provides the framework for organizing footsteps into per person trajectories.
The overall process of converting raw measurements from a building’s structural dynamics instrumentation into occupancy tracking estimates consists of three major stages. As illustrated in Figure 1 these stages correspond to the organization of the processing algorithms into three modules.
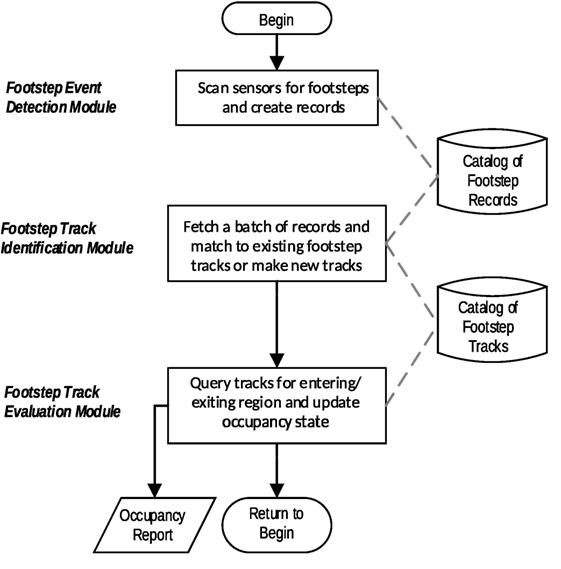
Figure 1. The overall process for converting measurements from vibration sensors to occupancy estimates. The module names on left correspond to the three major processing steps as explained in Sections 2.2–2.4 in greater detail.
First, the Footstep Event Detection Module (Section 2.2) examines vibrations observed in the building structure for evidence of a footstep, and when one is detected the module reports the footstep’s time and location. Second, the sequence of detected footsteps becomes input for the Footstep Track Identification Module (Section 2.3) that finds the most appropriate partitioning of footsteps into per person groupings. Due to the complexity of this module, there are pseudocode listings for each major algorithm, collected at the end of the paper with the figures. Third, using the identified tracks as input the Footstep Track Evaluation Module (Section 2.4) determines entry and exit of persons from a region of interest and thereby obtains the occupancy tracking results.
2.2. Footstep Event Detection Module
In the course of conducting the experimental work for this research, the authors observed that a wide range of events in a building could generate impulsive vibrations qualitatively similar to footsteps. Observed examples included items knocked off a desk, objects dropped by a person, and, especially prevalent, doors being closed. Although there are footstep-specific detectors capable of distinguishing these events from footsteps, it is helpful to have a simple, initial test to screen out events that cannot be from footsteps so that the footstep detector is not overwhelmed by irrelevant data. This practical issue was not fully addressed in the cited prior work (Bahroun et al., 2014; Pan et al., 2014; Mirshekari et al., 2016; Poston et al., 2017) on footstep localization. In fact, the technique proposed in Bahroun et al. (2014) relies exclusively on the magnitude of a sensor signal exceeding some given threshold and, consequently, is incapable of distinguishing footsteps from other impulsive, vibration-generating events of similar magnitude.
An expedient, first stage screening method is to compute the energy of the vibration signals and then to check if the duration of an event exceeding an energy threshold, γEnergy, has a plausible time duration for a footstep. Figure 2 shows the differences that occur in the duration of footsteps and one of the most prevalent sources of impulsive vibrations indoors, doors being closed. This plot comes from averaging a dozen measurements of Goodwin Hall accelerometers (PCB Piezotronics, Inc., model 352B). Figure 2 shows the accumulation of event energy observed by the sensors in millisecond increments. The footstep reaches the 90% of its total energy after a duration of 28 ms, whereas the door closing event takes 370 ms to reach 90%. This result is for hard soled shoes. For soft soled shoes the result is a somewhat longer duration (~100 ms) as previously noted in Mirshekari et al. (2016) and Poston et al. (2017) and would benefit from a separate screening check. A well-known result is that when a signal is modeled as a Gaussian random variable then the summation of a total of ν power samples produces an energy estimate that is a Chi-Square random variable, with ν degrees of freedom. The Chi-Square probability density function, , is defined in terms of the Gamma function, Γ(z), as
and for x < 0; the Gamma function definition is . The energy detector’s performance in terms of the probability of false alarm, PFA, and probability of detection, PD, given the sensor’s noise power, , that can be documented at system installantion, the incoming signal power, , and a designed detection threshold, γEnergy, is (Kay, 1998):
and . Two short examples illustrate how these performance relations guide the design of an energy detector screening test. The first example is from a conservative viewpoint of managing false alarms. If, in the absence of any actual footsteps, it is tolerable to have a false alarm on average once per 5 min then, given the case of 28-ms test periods, that means one false alarm in 1.07 × 10⁴ tests is tolerable, suggesting a false alarm specification of PFA = 10−4. An energy detector satisfies the specification with a threshold of from the relation in equation (2a), ν = 28. With this design PD ≥ 0.8 for a signal to noise ratio (SNR) of 3 dB or larger. The second example is from the viewpoint maintaining a high probability of detection of an event that might be a footstep. From the relation in equation (2b) with and a SNR of 3 dB or larger, the detector has PD > 0.99 under a relaxation to PFA = 10−1.
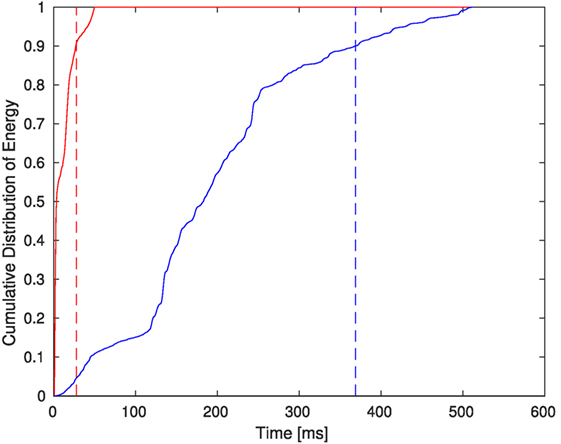
Figure 2. Comparison of the cumulative distribution of energy over time for footsteps (left, solid red curve) and doors being closed (right, solid blue curve). The dashed vertical red line at 28 ms shows where the footstep energy reaches its 90th percentile of its total energy and the dashed vertical blue line at 370 ms shows where the door closing event energy reaches its 90th percentile.
Of course, there are many kinds of vibration-generating events in buildings, and energy duration alone would be insufficient for footstep identification. When vibration signals do pass this preliminary check then a footstep detector inspects the signals more carefully by means of, for example, a matched filter test as explained in Poston et al. (2017) or some other feature statistics (e.g., Pan et al. (2014), Mirshekari et al. (2016)). This footstep detector test has its own formulation of detection criteria and has performance characteristics in terms of PFA and PD that are distinct from the energy detector.
It is known (e.g., Pan et al. (2014), Poston et al. (2017)) that the footstep detector statistics have exponentially decaying energy as range between footstep to sensor increases linearly. Hence, the possiblity of two or more footsteps happening simultaneously and causing an ambiguous detection is only a relevant concern for when they are in range of being detected by common set of sensors. In other words, the total number of building occupants is not the source of concern; instead, it is the number occupants in sustained proximity to one another. The operating assumption of this paper is that at the final output of this module each detection corresponds to exactly one footstep. In dense, moving crowds, however, making that assumption may be inappropriate. Later, Section 4 revisits this concern and discusses possible remedies.
Once a single footstep has been detected then it can be located using existing methods (e.g., Poston et al. (2017)). A located footstep also receives a grid cell annotation consistent with the footstep’s location on the building floor plan. Figure 3 shows how a building floor can be partitioned into a set of disjoint grid cells with each grid cell small enough to only contain one person at the time of a footstep. For example, the first footstep location, x1, (leftmost in Figure 3) goes into grid cell g2, the next, x2 (in the upper left doorway) goes into g5 and so forth. As explained in the next section, it is useful to consider these grid cells as states of the trellis.
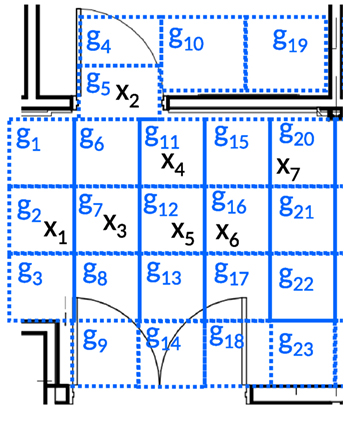
Figure 3. Example portion of a building floor plan partitioned into grid cells labeled g1, g2, … , g23. The symbols x1, x2, … , x7 mark the reported locations of detected footsteps.
To summarize, the output of this module is a sequence of footstep event records. Each record contains the attributes of the detection time, t, the estimated location, , and the location’s corresponding grid cell, g. For the remainder of this paper when it is necessary to refer to a particular attribute (e.g., time t) of a specific record (e.g., the mth detection) then the notation is f [m].t for this value.
2.3. Footstep Track Identification Module
This module partitions footstep event records into per person groupings known as tracks, 𝒯, each of which contains a unique TrackID and a set of footsteps, , assigned to the track. Figure 4 provides an overview of this module’s processing. The computations for the partitioning rely on a data structure known as a trellis. The trellis structure has an array with rows corresponding to each possible grid cell and columns corresponding to distinct time ranges. Furthermore, the trellis has branches interconnecting some adjacent array elements. These branches correspond to probabilities of transitioning from a location at a given time to another location at a later time. Readers familiar with the workings of the Viterbi algorithm (Viterbi, 1967) will recognize some similarities between that algorithm and this module’s processing; however, there are important differences, thus motivating a full description of this module’s operation. In particular, here calculations advance at an event-driven pace as footstep events are detected, not on a uniform time step basis as is customary for the Viterbi algorithm.
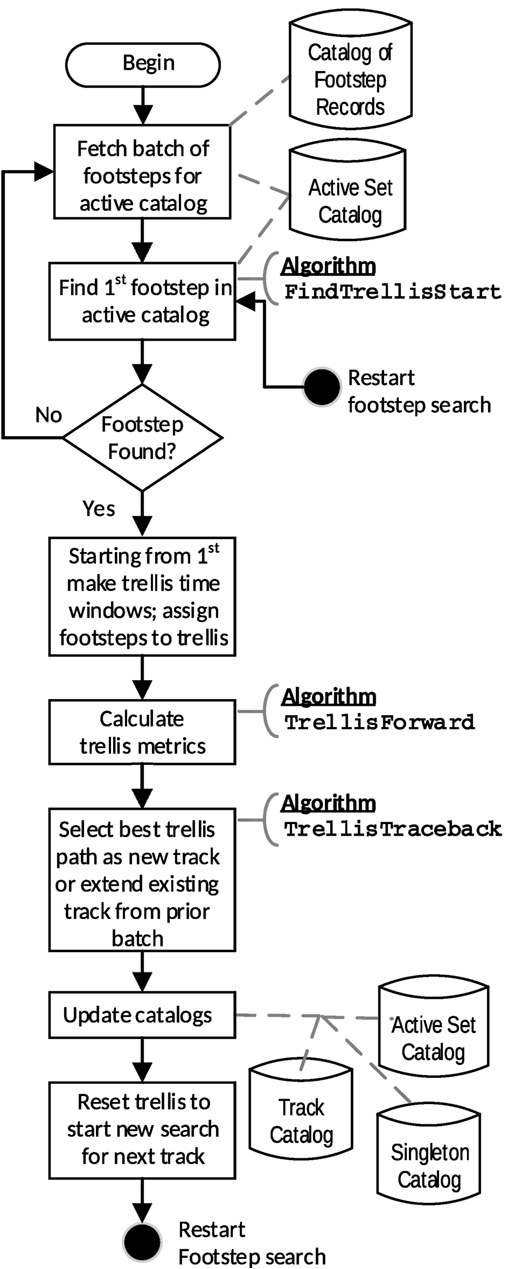
Figure 4. Overview of the Footstep Track Identification Module processing. The processing stages annotated to the right with named algorithms have detailed pseudocode listed in Algorithms 1–3.
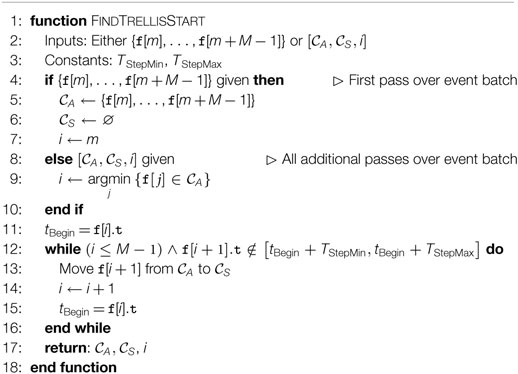
Algorithm 1. FindTrellisStart.
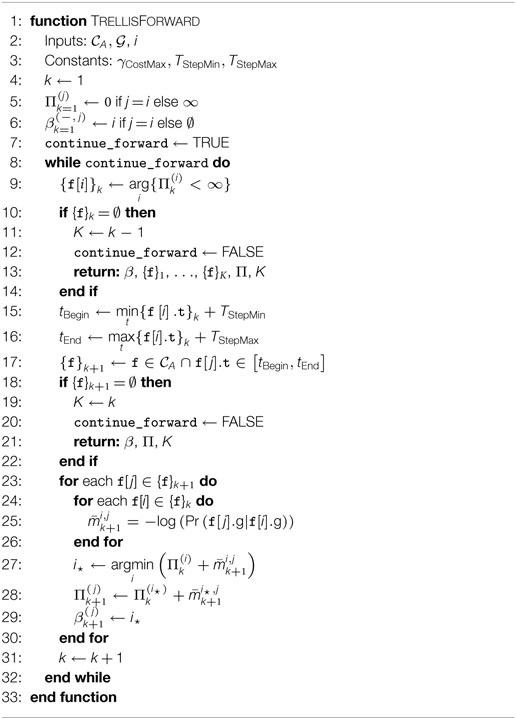
Algorithm 2. Calculate Footstep Trellis in Forward Phase.
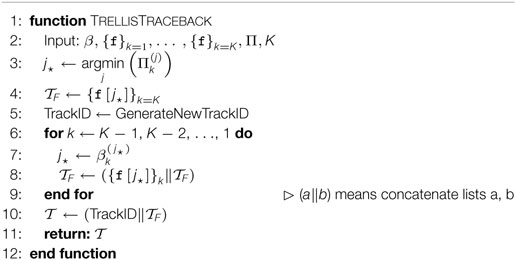
Algorithm 3. Traceback Optimal Path In Trellis.
This module processes the incoming queue of footstep events in a batch of M events at a time. These are sequential events m, m + 1, m + 2, … , m + M − 1 extending in time over t ∈ [tBatchBegin, tBatchEnd] where tBatchBegin = f [m].t, tBatchEnd = f [m + M − 1].t and the value of M is the smallest of:
(A) the number of events prior to an interevent time gap, Tgap, too large to be explained by a slow walking cadence or a missed footstep
(B) the number of events that can be accumulated while still providing a tolerable delay in reporting occupancy result.
The set of event records under consideration in the batch being processed is known as the active catalog, 𝒞A. Initially, the Footstep Track Identification Module operates with the first batch of events (i.e., starting with m = 1) from a building that was previously unoccupied. Thereafter, a current batch’s processing needs to be linked to the results produced from processing the previous batch. The linkage is explained at the end of this section.
The first task of this module is to select relevant footstep records for generating the first track and to initialize the trellis. Setting tbegin = f [m].t, the time of the first event, this module searches for events within a time window, TWin, covering the range from the fastest to slowest plausible interstep periods, resp. TStepMin and TStepMax as established in prior human gait research (e.g., Grieve and Gear (1966), Murray et al. (1966), Oberg et al. (1993), Bohannon (1997)). That is, the search is for the subset of events in the active catalog with f [i].t ∈ [tbegin + TStepMin, tbegin + TStepMax]. If this search returns no events then f [m] is removed from and added to the singleton catalog, 𝒞S, and the search process increments to the next event until finding a non-empty set of events in the time window that follows. The pseudocode listing in FindTrellisStart (Algorithm 1) implements this search procedure for both the first track generation as well as subsequent tracks.
When one or more footsteps within TWin have been located then the first two trellis time stages (array columns) are initialized as follows. The first trellis stage, k = 1, holds the first footstep identified by FindTrellisStart in a trellis row corresponding to the footstep’s grid cell, gi. The second trellis stage, k = 2, holds the set of footsteps found to be within TWin; each footstep assigned to a trellis row corresponding to the footstep’s reported grid cell. Figure 5 illustrates the formation of the trellis structure from grid cells and time windows.
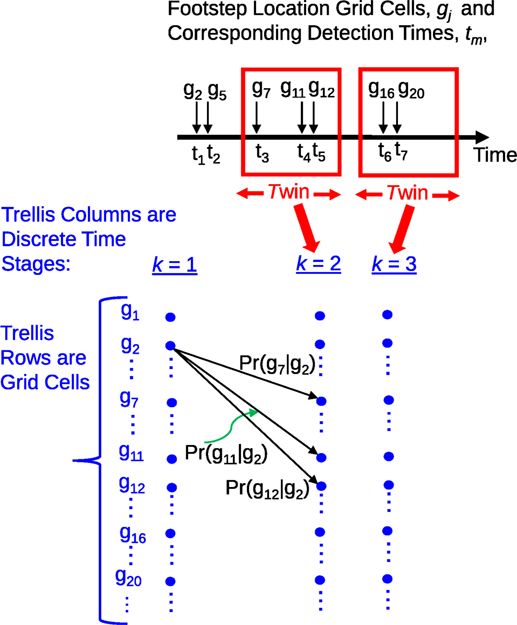
Figure 5. Trellis generation from the example footstep records shown in Figure 3. Starting from the first footstep at location x1 (in grid cell g2), the search for stage k = 2 footsteps identifies {(x3, g7), (x4, g11), (x5, g12)} as being within the required TWin. Each of these stage k = 2 footsteps has a distinct transition likelihood from stage k = 1, denoted Pr (gj|g2), j = 7, 11, 12.
Between adjacent trellis stages, there are trellis branches connecting the populated trellis array elements. These branches model the probability of moving from the ith trellis state (grid cell) at time stage k to the jth state at time stage k + 1. Stated more explicitly, the branch models a conditional likelihood Pr (f [j].g|f [i].g) of the observed step size given what is known about human gait. In practice, for reasons of numerically stability, it is preferable to work with the negative log likelihood rather than the raw transition likelihood. This log scale quantity is known as a branch metric or branch cost and is . A branch cost beyond a large threshold value, γCostMax means that the transition is so improbable that it can be removed from further consideration.
These branch costs are important, because finding the minimum cost path through the trellis equates to finding the most probable sequence of footstep events that will form a track. In order to account for these costs the trellis contains several additional parameters that are computed incrementally as the trellis progresses in time stages k = 1, 2, … , K. Every trellis state, j, at a given stage k + 1 keeps a record of which incoming branch from the previous stage, k, has the lowest cost; this is known as the best branch, . For the purpose of initializing the trellis and advancing per stage branch calculations, unoccupied trellis states (i.e., grid cells lacking footsteps) are treated as having infinite transition costs to other states, thereby removing them from further consideration. As the trellis progresses from one time stage to the next, it also records for each trellis state, i, the accumulated costs of traversing a particular sequence of previous states and branches. This accumulated costs when one arrives at a state is known as the state cost, . The first stage has a cost of zero for the only occupied state and infinite cost otherwise. For stages thereafter the state cost computation has a recursive evaluation. At stage k + 1 state j checks to find the best incoming branch and adds that branch cost to the previously computed state cost at the state i from which the best branch arrived. This sum is the new cost subtotal. This stage-by-stage process of finding footsteps in a viable time window, computing branch costs and updating state cost subtotals continues until no more viable trellis transitions exist or all footstep events in the current batch have been evaluated. This is known as the trellis forward traversal or forward phase of trellis calculations. The pseudocode listing in TrellisForward (Algorithm 2) implements these stagewise trellis computations.
Once the forward phase is complete then a backward traversal, known as the trellis traceback, identifies the optimal path as the one with the lowest total cost. The pseudocode listing in TrellisTraceback (Algorithm 3) extracts the path. The sequence of footstep events along this path constitute a track entered into the track catalog, 𝒞T, and those footstep records then are removed from the active catalog, 𝒞A.
At this point the Footstep Track Identification Module resets the trellis array, resets the trellis stage counter k to 1 and fetches the earliest available event in 𝒞A whereupon the module repeats the previously described sequence of Algorithms 1–3 to identify the next footstep track. After repeating this cycle until no more events remain in 𝒞A, this module may need to complete one more step before relinquishing the tracks in 𝒞T to the next processing module, the Footstep Track Evaluation Module.
Specifically, it is necessary to check if any tracks could extend over multiple batches of event processing and, therefore, influence the re-initialization of the Footstep Track Identification Module for the next batch of events. The check consists of identifying any that extend to the end of the time covered by the current batch of events. The set of such tracks is . The lowest cost state at the trellis end stage of each of these tracks is . In preparation for the next batch of events, the first trellis stage k = 1 has its states, gj, j = 1, 2, … , J, re-initialized with normalized cost subtotals to account for these events as well as the first event in the next batch:
With this final step completed, the Footstep Track Evaluation Module can begin assessing what the track trajectories imply for occupancy.
2.4. Footstep Track Evaluation Module
A change in occupancy state arises when a person enters or exits a monitored region. The task of determining this state change is akin to what is required in the location-based services technique known as geofencing (Munson and Gupta, 2002). In this paper, the region specification is in terms of a 2D building coordinate system (e.g., the positive Y axis faces North, and the positive X axis faces East). The region consists of a polygon with a finite number of vertices, and it may be either convex or non-convex. There are existing algorithms for determining if a queried point (e.g., a footstep location) is within either a simple polygon (Shimrat, 1962) or a non-simple (i.e., self-intersecting) polygon (Chinn and Steenrod, 1966), and these became well-established first for computer graphics (Sutherland et al., 1974) and later in techniques for processing queries to geospatial databases (Jacox and Samet, 2007; Ilarri et al., 2010). When there is only one region of interest then a point either wholly inside the polygon or on a boundary line segment is treated as being in the region. On the other hand, when floor plan is subdivided into multiple, disjoint regions to monitor there needs to be a rule for determining which one of a neighboring set of regions contains a point that falls on a boundary. A common geospatial processing convention is that a point on a South or West border of a region is treated as belonging to the region whereas a point on a North or East border belongs to a neighbor region. In formal terms, a query function, q( ), inspects a single footstep’s location f [m].x F , to determine if it is in a monitored region, ℛ,
Evaluating a sequence of footsteps in a track, 𝒯l, with this function generates an output sequence of ones and zeros corresponding to a person’s presence in or absence from the region of interest at the times of the footsteps. Moreover, evaluating the entire ensemble of tracks in the track catalog this way produces a count of the total occupancy for the region over time.
3. Experiments
3.1. Overview
The setting for the experimental work was Goodwin Hall on the campus of Virginia Tech, a public building containing offices, classrooms, and laboratories. In 2014, during the latter stages of construction, this building had sensor mounts welded to many steel girders for the original purpose of studying structural dynamics of the entire building. At present, there are over 200 accelerometers active on these mounts. The sensor mount design accomodates a triaxial (i.e., X, Y, Z) sensor configuration, if needed. All sensors measured in this study have a uniaxial configuration (Z axis facing the Earth) on steel girders that support a concrete floor slab; the next section provides specifications for the sensors in these experiments and their layout. Thus, these sensors are able observe footstep-generated vibrations originating from the above floor. The reader seeking additional information about the implementation of the sensor system and its integration with the building can consult (Hamilton et al., 2014; Hamilton, 2015).
Several considerations shaped the formulation of these demonstration experiments. One consideration is showing the influence that location estimation error and the building occupant movement patterns have on the framework’s performance. Evaluating movement patterns with several levels of sustained proximity among occupants illustrates the sensitivity of occupancy estimation to correct footstep-to-track assignment. Another consideration is accounting for non-ideal behavior of detection and localization algorithms. The formulation to address these considerations is a hybrid of actual measurements of movement patterns combined with Monte Carlo simulation of detection and localization impairments. The intent here is to offer a template for others to apply to investigate specific cases of interest rather than to attempt an experimental design that encompases all variations in sensor configuration, occupant mobility, and algorithm performance. Furthermore, to show scaling characteristics beyond what the floorplan of Goodwin Hall permits for testing, an additional experiment synthesized larger, more populated scenarios by combining separate instances of test data.
Section 3.3 elaborates on the specific parameter settings and system configurations selected to satisfy these considerations. All experiments were conducted in accordance with approved protocols for experiments involving human subjects (Institutional Review Board, 2015–2017).
3.2. Sensor Configuration and Ground Truth Determination
Figure 6 shows the test area in Goodwin Hall along with the positions of the 12 underfloor sensors. For this testing, all accelerometers were PCB Piezotronics, Inc., model 352B accelerometers with a nominal sensitivity of 1 V/g and a frequency range from 2 Hz to 10 kHz (PCB Piezotronics Inc, 2002). The sensors connect to a data acquisition system by coaxial cable installed during the building’s construction. In these experiments, the data acquisition system [VTI Instruments model EMX-2450 (VTI Instruments, 2014)] sampled all sensors synchronously at a rate of 32,768 samples per second with 24 bits of resolution.
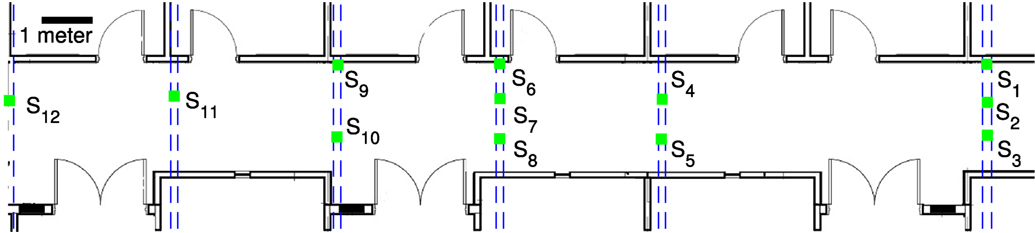
Figure 6. The test area in Goodwin hall on the campus of Virginia Tech. The pairs of dashed lines ( ) show the outlines of steel girders that have mounted sensors active in this study, and square symbols
  S1, … ,
  S12, mark the sensor locations on the girders.
In order to provide ground truth for building occupant movement a 1-D LIDAR (Garmin model LIDAR-Lite v2, accuracy ± 0.025 m) positioned behind an individual’s starting point measured their movement over time. Furthermore, a precision real-time clock (Maxim Integrated DS3231, ±2 ppm) triggered each LIDAR measurement and simultaneously sent a synchronization pulse to a spare channel of the building’s instrumentation system at a rate of 64 Hz. The measurement rate of 64 Hz limited the change in range from one sample to the next to the order of the LIDAR’s accuracy even in the case of very brisk walking. Thus, the log of LIDAR measurements was synchronized with the building’s accelerometer measurements, and this enabled the linking of the detection time of each footstep to the ground truth log of the individual’s location.
3.3. Demonstration Scenarios and Parameter Settings
The first three demonstration scenarios show several canonical motion patterns of two persons in a hallway as they walk past one another, meet and confer with one another or walk together. The scenarios are denoted the crossing scenario, the pivot scenario and the together scenario. Additionally, each scenario considered the case of two persons entering and exiting the monitored region. The choice of two persons for the first three scenarios provides a simple enough case that the influence of their movement patterns on the occupancy tracking framework can be readily understood. Additional experiment scenarios account for extensions to more populated cases as explained at the end of this section. The dimensions of the monitored region, 2 m × 6 m, are believed to be small enough to serve as a lower limit on useful region size (e.g., a shared workspace) and large enough to contain multiple footsteps from each person.
The crossing scenario shown in Figure 7 (top) has two persons start at opposite ends of a hallway and begin walking toward one another. Then, they enter the region of interest from opposite sides, pass one another and continue on their respective headings until reaching the end of the hallway. Their paths are displaced from one another by nominally 1 m in the dimension orthogonal to the length of the hallway. The pivot scenario shown in Figure 7 (middle) begins in a similar manner as the crossing scenario but without the 1 m displacement of paths. After entering the region they each pivot 180∘ and return to their respective origins. The together scenario shown in Figure 7 (bottom) has two persons begin at the same end of the hallway, displaced from one another by nominally 1 m in the dimension orthogonal to the length of the hallway. At the same starting time and at nominally the same speed they begin walking toward the opposite end of the hallway. They enter the region together, continue in the same direction, exit the region together, and maintain their heading until stopping at the end of the hallway.
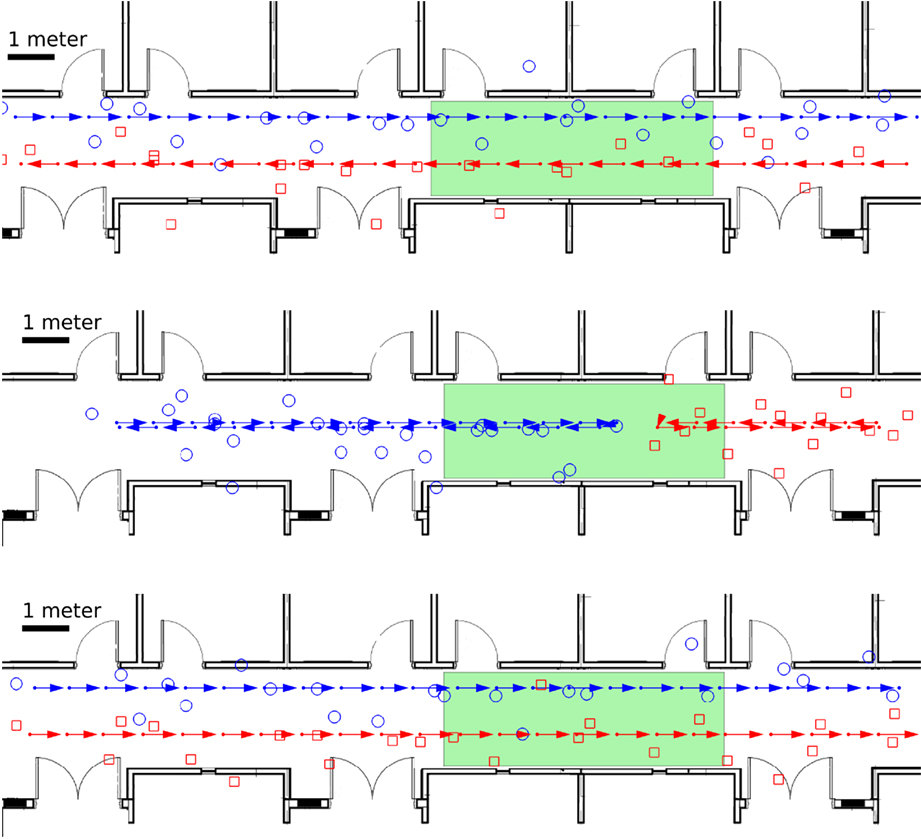
Figure 7. From top to bottom the diagrams show the crossing scenario, the pivot scenario and the together scenario. Each diagram has blue arrows  for the ground truth of movement for each step of person #1 and red arrows
  for person #2. The blue circles
  and red squares
  show examples of the estimated footstep locations produced by the localization algorithm in Poston et al. (2017) for person #1 and #2, respectively. The highlighted green area is the region of interest.
The choice of a nominal 1 m separation in all these scenarios stems from the hybrid approach of real experimental measurements coupled with Monte Carlo simulation of error sources. Observe that when the Footstep Track Identification Module operates with footstep records both the actual spatial separation of footsteps and the location estimation error combine to produce the reported interstep distance evaluated by the trellis branch cost calculation. By standarizing the nominal separation of building occupants in some way the experiment’s Monte Carlo trials can sweep one parameter related to localization accuracy. More precisely, each experiment trial was formed as follows. Starting with the ground truth of footstep detections and localizations, a series of progressively greater localization errors was created by adding to the true (X, Y) footstep coordinates a circular Gaussian random variable having zero mean and SD, σL, in each coordinate ranging from zero to to 1 m with increments of 0.1 m. For each of these localization error levels there were 1,000 trials.
Another aspect of non-ideal localization behavior is failing to provided an estimate due to missed detections. Several factors influence the probability of detection: the attenuation of the footstep-generated structural waves from footstep origin to sensor, the sensitivity of the sensor model, the detector design, the measurement noise and any other error source.
The cited related work (Bahroun et al., 2014; Mirshekari et al., 2016; Poston et al., 2017) studied these factors. For these specific experiments there was no difficulty in locating footsteps from the actual measurements; therefore, to account for non-ideal behavior there was an additional emulation stage to make localization fail stochastically. The emulation introduced a probability of a missed detection, PM, at series of increasing levels, . Each combination of scenario, localization error level and trial received this set of PM treatments.
As explained in Section 2.3, the Footstep Track Identification Module algorithms incorporate parameters TStepMin and TStepMax to account for the range of interstep periods in human gait. The parameter settings for these experiments relied on the range documented in the prior research findings of Grieve and Gear (1966), Murray et al. (1966), Oberg et al. (1993), and Bohannon (1997). Specifically, considering a step cadence from a leisurely 91 steps/minute to a very brisk 169 steps/minute established the range of interstep periods, TStepMax = 659 ms and TStepMin = 355 ms, respectively. The previously introduced time gap threshold, TGap, between events for terminating a search for tracks and starting a new search is TGap = 2TStepMax. The trellis branch metric calculations treated the distribution of step length as Gaussian with mean μS = 0.75 m and SD σS = 0.1 m. An additional assumption of these calculations is that for whatever footstep localization algorithm is in use, a location error bound has been quantified, and this error bound is available as an input parameter to the occupancy tracking algorithms. For the purpose of selecting the threshold for the maximum admissible trellis branch cost, γCostMax, the premise is that it should account for both 99% of expected step lengths as well as 99% of the location uncertanty of a pair of successive footsteps. Thus, the computation for the maximum distance was dMax = 3σS + 6σL.
These experiments collected two performance metrics, the footstep-to-track misassignment error rate and the occupancy estimation root mean square error (RMSE). For the latter, there are two ways of reporting occupancy error in order to gain insight about the contribution of a subset of the framework versus the entire framework. The first type of reporting is for the case of a given, true footstep-to-track assignment. The second report is for estimated assignments of footsteps to identified tracks. The intent of reporting occupancy error in these two ways is to examine the influence of localization error alone and in conjunction with track assignment errors. Due to limitations on space for figures, the plots related to the pivot and together scenario as well as plots for cases of missed detections are in Supplementary Material to this paper. After first reviewing experimental results under the original condition, PM = 0, of no missed detections this section then turns to examining the influence of higher PM levels.
Extending the experiments to investigate larger areas and more populated scenario despite the physical limitations of the Goodwin Hall floor plan is possible by synthesizing a new test area that combines independent replications of the existing hallway configuration and instances of test data. The enlarged area comes from n = 1, 2, … , NR replications of the original hall area and sensor network as illustrated in Figure 8. The first replication has its coordinates translated South from the original hall coordinates sufficiently to avoid overlap with the original. Thereafter, for n = 2, 3, … , NR, the nth replication has its coordinates translated South from the (n − 1)th to avoid overlap. Then, each of the NR replications receives a pair of occupants moving as in the original crossing scenario but with coordinates translated and with an independent realization of time offset and localization error. Additionally, the region for monitoring occupancy has its area increased proportionally. Thus, the density of occupants per unit area of floor plan and per unit area of the monitored region remains the same as the first three experimental scenarios. This experiment observed occupancy estimation error as the number of replications covered the range n = 0, 1, … , 9 (i.e., the number of occupants was 2, 4, … , 20).
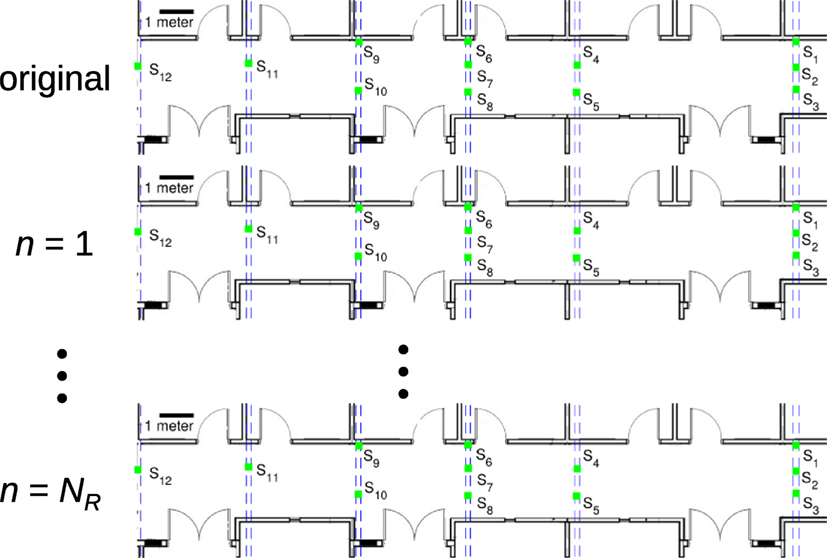
Figure 8. Method of generating a large floor plan by replicating the original Goodwin Hall test area NR times, each replication translated South (downward on the page) first from the original and thereafter from the prior replication to avoid overlap.
3.4. Results
For the crossing scenario (Figures 9–11), the misassignment rate is negligible until the localization error term . Comparision of occupancy estimation error in this scenario for a given, true track assignment (Figure 10) and for an estimated track assignment (Figure 11) shows both grow in estimation error with increasing σL, and the estimated track results also undergo some enlargement of the error confidence interval (i.e., the 95% interval enlarges by ≈ 1.5×). Thus, for this scenario the assignment error rate has a modest influence compared to the per footstep localization error.
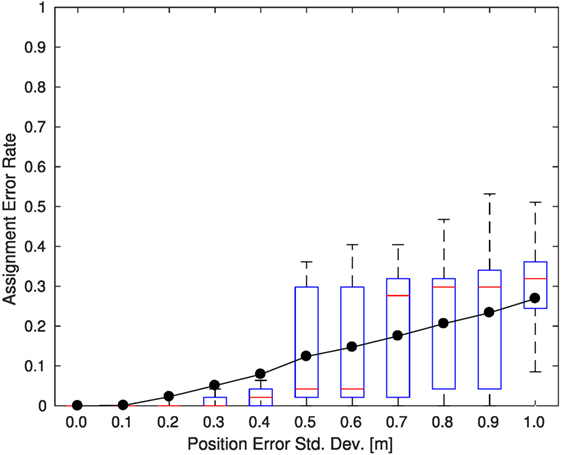
Figure 9. The misassignment rate in the crossing scenario.
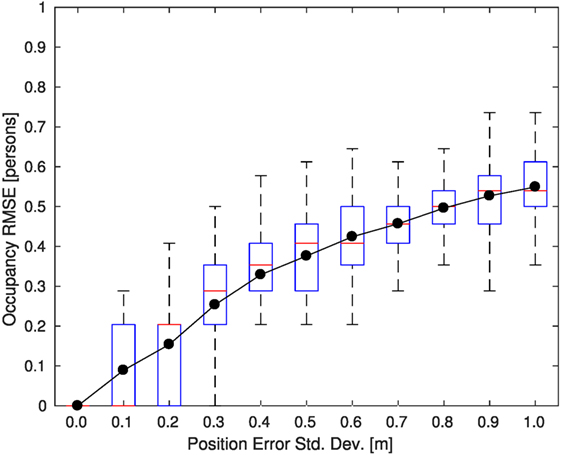
Figure 10. The occupancy count RMSE using true footstep assignment in the crossing scenario.
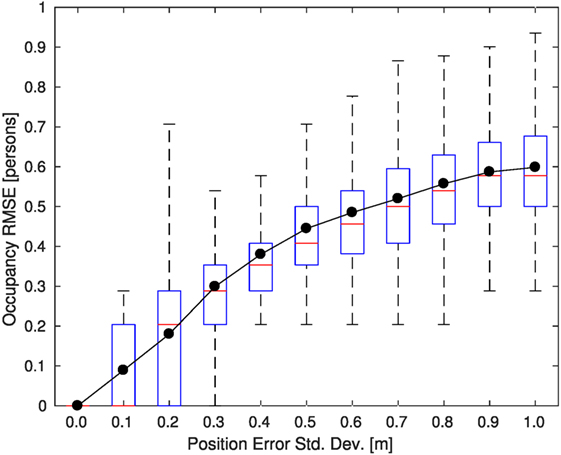
Figure 11. The occupancy count RMSE using estimated footstep assignment in the crossing scenario.
In the pivot scenario (Figures S1–S3 in Supplementary Material), the almost perfect footstep-to-track assignment performance in Figure S1 in Supplementary Material can be attributed to the effectiveness of the thesholding operation applied to the trellis branch metrics in scenarios where persons are rarely in close proximity of one another even though their footsteps occur over the same time interval. As explained in Section 2.3, the thresholding via γCostMax enables the algorithm to remove early in its processing very unlikely footstep assignments from further consideration. Consequently, the occupancy estimation results for the case of estimated track assignments (Figure S3 in Supplementary Material) is nearly identical to the case of having true track assignments (Figure S2 in Supplementary Material). This is in contrast to the previous crossing scenario that exhibited a modest growth in occupancy error with increasing assignment error.
In the together scenario (Figures S4–S6 in Supplementary Material) sustained proximity of individuals to one another means that every footstep is at risk of misassignment for non-negligible localization error. Figure S4 in Supplementary Material shows that the misassignment rate reaches 50% after the onset of non-negligible localization error, because the algorithms are operating in a regime where location estimates do not offer sufficient information for distinguishing individuals, and, thus, the algorithms have an equally probable chance of making the correct assignment or not.
When there is a nonzero probability of missed detections, PM, even a scenario containg a single person may have a poor misassignment rate but still produce accurate occupancy estimates. The reason is that a missed detection may cause premature termination of the single person’s track and the creation of a new track for any footsteps remaining after the time of the missed detection. Consequently, in the assessment of footstep-to-track assignment errors, all assignments to the new track are, strictly speaking, incorrect. From the standpoint of occupancy count, however, this generally does not influence the overall outcome, except for the gap (i.e., delayed occupancy update) caused by the missed detection. In consideration of this factor, the remainder of this section refrains from referencing misassignment rate plots and instead examines occupancy RMSE.
Evaluating the scenarios at increasing levels of miss probability, , produced insignificant error growth compared to PM = 0 until reaching PM = 10−1. At 10−1 the results in all scenarios diverged from meaningful occupancy estimates.
Figures S7–S9 in Supplementary Material show the overall estimation result that relies on identified tracks. In the original results (i.e., Figures 9–11; Figures S1–S6 in Supplementary Material) where PM = 0 the occupancy estimates had a small accuracy penalty when footstep-to-track assignment was estimated from identified tracks as compared to the case of given, true footstep-to-track assignment. By contrast, at PM = 10−1 when the true footstep-to-track assignment is known the occupancy estimation performance remains nearly on par with the PM = 0 case as shown in Figures S10–S12 in Supplementary Material, respectively. This rate of missed detections sufficiently disrupts the track formation process to thwart accurate occupancy estimation.
The experiments formed by replicating the original hall area and occupants by n = 0, 1, … , 9 times (i.e., with 2, 4, … , 20 occupants) produced the occupancy estimation error reported in Figure 12. This plot shows error normalized by the number of occupants to illustrate scaling characteristics. The consistency at large scale comes from the trellis path calculations explained in Section 2.3. Recall that the Footstep Track Identification Module evaluates the suitability of a sequence of footstep records for belonging to a track by means of the accumlated trellis state cost, . Thus, even though there are more tracks (occupants) to consider, it remains unlikely under constant occupancy density per unit area that an incorrect set of footsteps will repeatedly produce a set of best branch metrics, , necessary to produce the best state cost, . Provided the localization error remains modest with respect to the region size and step size the track identification and subsequent occupancy estimatation will maintain their accuracy.
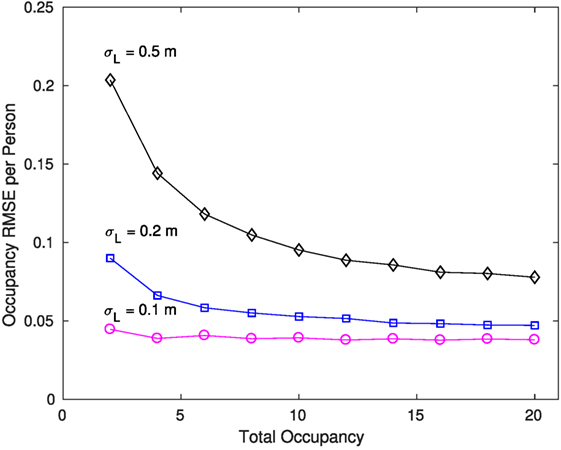
Figure 12. Occupancy estimation RMSE per person as a function of increasing numbers of occupants on a proportionally sized floor plan and monitored region as explained in Section 3.3. This normalized occupancy error is shown for several levels of localization error, σL.
4. Discussion
This paper proposed an algorithmic framework that, when coupled with an accurate footstep localization technique, provides occupancy tracking in a building; however, there are several limitations to the framework as proposed. As noted in Section 2.2, the creation of the footstep event record relies on each footstep detection corresponding to exactly one footstep. In the case of a dense, moving crowd, however, there is the possibility that two or more simultaneous footsteps would be detected by the same set of adjacent sensors. If this happens then the footstep event detection module would need to unmix the superimposed signals to extract each footstep event. This footstep signal unmixing is a version of the blind source separation task often addressed in other settings with an independent components analysis (ICA) technique (Jutten and Herault, 1991; Comon, 1994; Hyvarinen and Oja, 2000). In this setting, however, the task is not trivial. The original formulation of ICA relies on the mixture being an additive mixture of component signals. By contrast, footstep-generated structural waves can undergo reflection or refraction at structural boundaries and even within a single concrete floor slab can undergo dispersion. Thus, a more accurate formulation is treating multiple, simultaneous footsteps as a convolutive mixture of component signals. Furthermore, without prior measurement or modeling of the building’s transfer function to footstep excitation at various locations, the unmixing task carries the responsibilities of semi-blind deconvolution too. For these reasons, devising a general purpose algorithm for separating simultaneous footstep signals appears to be a substantial undertaking and has been deferred for future study.
These experiments indicate that track formation algorithms rely on the probability of missing a detection being no worse than 10−1. Furthermore, in the event of missing footsteps for either the case of a small region or the case of steps that are parallel to a boundary but straddle it, the system may be incapable of accurate occupancy counting. To overcome this limitation the framework could draw from auxiliary information from other sensor systems to corroborate the estimated number of persons entering or exiting the building region.
In some cases a building’s sensor configuration and a selected footstep localization method may not provide sufficient accuracy for an intended application. In addition to obvious remedies such as improving sensor density there may be an algorithmic remedy requiring no additional sensor infrastructure. As noted in the introduction, prior literature (Pan et al., 2015; Bales et al., 2016) extracted statistical features from footstep measurements that enable discrimination among individuals beyond the location and time parameters considered in this paper. Additionally, if the algorithms undertake actual tracking of occupants—not just occupancy tracking—the accuracy has the potential to improve, because the algorithms incorporate all information from a set of observed footsteps and per person state variables (e.g., velocity). Incorporating this additional information, of course, entails greater complexity but is a promising direction for future research.
Public safety applications motivate another direction for extending this framework. For example, it is well known that current technology for locating cellular emergency calls made from indoor locations is inaccurate due to the interaction of the cellular radio waves with the building’s structure, but this location information can be crucial in an emergency. In Abdelbar and Buehrer (2016), the authors propose a fusion technique for integrating the cellular caller’s information with a more accurate location estimate provided by some building-provided indoor localization service. In some emergencies the caller may not be the one in need of assistance, there may be many callers or the incident may be widespread. Accordingly, the public safety first responders would benefit from a fusion of the occupancy tracking information too.
Ethics Statement
This study was carried out in accordance with the recommendations of “VT IRB 15-681: Human Subject Gait Measurement (2015–2016),” Virginia Tech Institutional Review Board (VT IRB) with written informed consent from all subjects. All subjects gave written informed consent in accordance with the Declaration of Helsinki. The protocol was approved by the VT IRB.
Author Contributions
JP, RB, and PT have all contributed to the conception or design of the work, have revised the work critically, have given final approval of the version to be published, and have agreed to be accountable for all aspects of the work in ensuring that questions related to the accuracy or integrity of any part of the work are appropriately investigated and resolved.
Conflict of Interest Statement
The authors declare that the research was conducted in the absence of any commercial or financial relationships that could be construed as a potential conflict of interest.
The reviewer, PZ, and handling editor declared their shared affiliation.
Acknowledgments
The authors appreciate the comments from the anonymous reviewers on improving the paper. The experimental work was conducted in Virginia Tech’s Smart Infrastructure Laboratory (VT-SIL), a laboratory with equipment provided by Dytran Instruments, Inc., Oregano Systems, PCB Piezotronics, Inc., VTI Instruments and VT-SIL patrons.
Funding
This research was supported in part by the Virginia Tech Institute for Critical Technology and Applied Science (ICTAS).
Supplementary Material
The Supplementary Material for this article can be found online at http://www.frontiersin.org/article/10.3389/fbuil.2017.00065/full#supplementary-material.
References
Abdelbar, M., and Buehrer, R. M. (2016). “Improving cellular positioning indoors through trajectory matching,” in 2016 IEEE/ION Position, Location and Navigation Symposium (PLANS), Savannah, GA, 219–224.
Bahroun, R., Michel, O., Frassati, F., Carmona, M., and Lacoume, J. (2014). New algorithm for footstep localization using seismic sensors in an indoor environment. J. Sound Vibr. 333, 1046–1066. doi: 10.1016/j.jsv.2013.10.004
Bales, D., Tarazaga, P., Kasarda, M., Batra, D., Woolard, A., Poston, J. D., et al. (2016). Gender classification of walkers via underfloor accelerometer measurements. IEEE Internet Things J. 3, 1259–1266. doi:10.1109/JIOT.2016.2582723
Bar-Shalom, Y., and Blair, W. D. (eds) (2000). Multitarget-Multisensor Tracking: Applications and Advances, Vol. 3. Boston: Artech House.
Bar-Shalom, Y. (ed.) (1990). Multitarget-Multisensor Tracking: Applications and Advances, Vol. 1. Boston: Artech House.
Bar-Shalom, Y. (ed.) (1992). Multitarget-Multisensor Tracking: Applications and Advances, Vol. 2. Boston: Artech House.
Bar-Shalom, Y., and Fortmann, T. E. (1988). Tracking and Data Association, Vol. 179. Boston: Academic Press.
Bar-Shalom, Y., and Tse, E. (1975). Tracking in a cluttered environment with probabilistic data association. Automatica 11, 451–460. doi:10.1016/0005-1098(75)90021-7
Blackman, S. S., and Popoli, R. (1999). Design and Analysis of Modern Tracking Systems. Boston: Artech House.
Bohannon, R. W. (1997). Comfortable and maximum walking speed of adults aged 20-79 years: refernce values and determinants. Age Ageing 26, 15–19. doi:10.1093/ageing/26.1.15
Chinn, W. G., and Steenrod, N. E. (1966). First Concepts of Topology: The Geometry of Mappings of Segments, Curves, Circles, and Disks. Washington, DC: Mathematical Association of America.
Comon, P. (1994). Independent component analysis, a new concept? Sig. Process. 36, 287–314. doi:10.1016/0165-1684(94)90029-9
Dobbler, K., Fiser, M., Fellner, M., and Rettenbacher, B. (2014). “Vibroacoustic monitoring: techniques for human gait analysis in smart homes,” in Ambient Assisted Living, eds R. Wichert, and H. Klausing (Berlin: Springer), 47–58.
Erickson, V. L., and Cerpa, A. E. (2010). “Occupancy based demand response HVAC control strategy,” in Proceedings of the 2nd ACM Workshop on Embedded Sensing Systems for Energy-Efficiency in Building, Zurich, 7–12.
Erickson, V. L., Lin, Y., Kamthe, A., Brahme, R., Surana, A., Cerpa, A. E., et al. (2009). “Energy efficient building environment control strategies using real-time occupancy measurements,” in Proceedings of the First ACM Workshop on Embedded Sensing Systems for Energy-Efficiency in Buildings, Berkeley, CA, 19–24.
Forney, G. D. Jr. (1973). “The Viterbi algorithm”, Proceedings of the IEEE, 61, 268–278. doi:10.1109/PROC.1973.9030
Fortmann, T. E., Bar-Shalom, Y., and Scheffe, M. (1983). Sonar tracking of multiple targets using joint probabilistic data association. IEEE J. Oceanic Eng. OE-8, 173–184. doi:10.1109/JOE.1983.1145560
Gordon, N. J., Salmond, D. J., and Smith, A. F. M. (1993). “Novel approach to nonlinear/non-Gaussian Bayesian state estimation”, Proceedings of the IEEE, 140, 107–113. doi:10.1049/ip-f-2.1993.0015
Goyal, S., Ingley, H. A., and Barooah, P. (2013). Occupancy-based zone-climate control for energy-efficient buildings: complexity vs. performance. Appl. Energy 106, 209–221. doi:10.1016/j.apenergy.2013.01.039
Grieve, D. W., and Gear, R. J. (1966). The relationships between length of stride, step frequency, time of swing and speed of walking for children and adults. Ergonomics 9, 379–399. doi:10.1080/00140136608964399
Gu, Y., Lo, A., and Niemegeers, I. (2009). A survey of indoor positioning systems for wireless personal networks. IEEE Commun. Surv. Tutorials 11, 13–32. doi:10.1109/SURV.2009.090103
Hamilton, J. M. (2015). Design and Implementation of Vibration Data Acquisition in Goodwin Hall for Structural Health Monitoring, Human Motion, and Energy Harvesting Research. Masters Thesis, Virginia Tech.
Hamilton, J. M., Joyce, B. S., Kasarda, M. E., and Tarazaga, P. A. (2014). “Characterization of human motion through floor vibration,” in Dynamics of Civil Structures, Vol. 4, ed. F. N. Catbas (Orlando, FL: Springer), 163–170.
Hyvarinen, A., and Oja, E. (2000). Independent component analysis: algorithms and applications. Neural Net. 13, 411–430. doi:10.1016/S0893-6080(00)00026-5
Ilarri, S., Mena, E., and Illarramendi, A. (2010). Location-dependent query processing: where we are and where we are heading. ACM Comput. Surv. 42, 1–73. doi:10.1145/1670679.1670682
Institutional Review Board. (2015–2017). Virginia Tech IRB 15-681: Human Subject Gait Measurement. Blacksburg, VA: Virginia Tech.
Jacox, E. H., and Samet, H. (2007). Spatial join techniques. ACM Trans. Database Syst. 32, 1–44. doi:10.1145/1206049.1206056
Jutten, C., and Herault, J. (1991). Blind separation of sources, part I: an adaptive algorithm based on neuromimetic architecture. Sig. Process. 24, 1–10. doi:10.1016/0165-1684(91)90079-X
Kalman, R. E. (1960). A new approach to linear filtering and prediction problems. Trans. ASME 82, 35–45. doi:10.1115/1.3662552
Kay, S. M. (1998). Fundamentals of Statistical Signal Processing: Detection Theory. Englewood Cliffs, NJ: Prentice-Hall PTR.
Kuhn, H. W. (1955). The Hungarian method for the assignment problem. Naval Res. Logist. Q. 2, 83–97. doi:10.1002/nav.3800020109
Liao, C., and Barooah, P. (2010). “An integrated approach to occupancy modeling and estimation in commercial buildings,” in American Control Conference (ACC), 2010, Baltimore, MD, 3130–3135.
Lu, J., Wang, G., and Moulin, P. (2014). Human identity and gender recognition from gait sequences with arbitrary walking directions. IEEE Trans. Inf. Forensic. Sec. 9, 51–61. doi:10.1109/TIFS.2013.2291969
Mirshekari, M., Pan, S., Zhang, P., and Noh, H. Y. (2016). “Characterizing wave propagation to improve indoor step-level person localization using floor vibration,” in SPIE Smart Structures and Materials+ Nondestructive Evaluation and Health Monitoring (Las Vegas, NV: International Society for Optics and Photonics), 980305.
Munson, J. P., and Gupta, V. K. (2002). “Location-based notification as a general-purpose service,” in Proceedings of the 2nd International Workshop on Mobile Commerce (ACM), San Diego, CA, 40–44.
Murray, M. P., Kory, R. C., Clarkson, B. H., and Sepic, S. B. (1966). Comparison of free and fast speed walking patterns of normal men. Am. J. Phys. Med. Rehabil. 45, 8–24. doi:10.1097/00002060-196602000-00002
Needleman, S. B., and Wunsch, C. D. (1970). A general method applicable to the search for similarities in the amino acid sequence of two proteins. J. Mol. Biol. 48, 443–453. doi:10.1016/0022-2836(70)90057-4
Oberg, T., Karsznia, A., and Oberg, K. (1993). Basic gait parameters: reference data for normal subjects, 10-79 years of age. J. Rehabil. Res. Dev. 30, 210–223.
Pan, S., Bonde, A., Jing, J., Zhang, L., Zhang, P., and Noh, H. Y. (2014). “BOES: building occupancy estimation system using sparse ambient vibration monitoring,” in SPIE, Santa Fe, NM, 90611O–90611O.
Pan, S., Wang, N., Qian, Y., Velibeyoglu, I., Noh, H. Y., and Zhang, P. (2015). “Indoor person identification through footstep induced structural vibration,” in ACM HotMobile, Santa Fe, NM, 81–86.
Pan, S., Xu, S., Mirshekari, M., Zhang, P., and Noh, H. Y. (2017). Collaboratively adaptive vibration sensing system for high-fidelity monitoring of structural responses induced by pedestrians. Front. Built Environ. 3:28. doi:10.3389/fbuil.2017.00028
PCB Piezotronics Inc. (2002). “Model 352b High resolution, ceramic shear ICP accel., 1000 mV/g, 2 to 10k Hz, 10-32,” in Installation and Operating Manual, 10-32. Manual Number 18292, Rev. B, Depew, NY. Available at: http://www.pcb.com/contentstore/docs/PCB_Corporate/Vibration/Products/Manuals/352B.pdf
Poston, J. D., Buehrer, R. M., and Tarazaga, P. A. (2017). Indoor footstep localization from structural dynamics instrumentation. Mech. Syst. Sig. Process. 88, 224–239. doi:10.1016/j.ymssp.2016.11.023
Reid, D. B. (1979). An algorithm for tracking multiple targets. IEEE Trans. Autom. Control AC-24, 843–854. doi:10.1109/TAC.1979.1102177
Sarkar, S., Phillips, P. J., Liu, Z., Vega, I. R., Grother, P., and Bowyer, K. W. (2005). The HumanID gait challenge problem: data sets, performance, and analysis. IEEE Trans. Pattern Anal. Mach. Intell. 27, 162–177. doi:10.1109/TPAMI.2005.39
Shimrat, M. (1962). Algorithm 112: position of point relative to polygon. Commun. ACM 5, 434. doi:10.1145/368637.368653
Smith, T. F., and Waterman, M. S. (1981). Identification of common molecular subsequences. J. Mol. Biol. 147, 195–197. doi:10.1016/0022-2836(81)90087-5
Sutherland, I. E., Sproull, R. F., and Schumacker, R. A. (1974). A characterization of ten hidden-surface algorithms. ACM Comput. Surv. 6, 1–55. doi:10.1145/356625.356626
Teixeira, T., Dublon, G., and Savvides, A. (2010). A survey of human-sensing: methods for detecting presence, count, location, track, and identity. ENALAB Technical Report 09-2010. New Haven, CT: Yale University. Available at: http://thiagot.com/papers/teixeira_techrep10_survey_of_human_sensing.pdf
Teixeira, T., Jung, D., Dublon, G., and Savvides, A. (2009). “PEM-ID: identifying people by gait-matching using cameras and wearable accelerometers,” in Distributed Smart Cameras, 2009. ICDSC 2009. Third ACM/IEEE International Conference on, 1–8.
Velichko, V. M., and Zagoruyko, N. G. (1970). Automatic recognition of 200 words. Int. J. Man Mach. Stud. 2, 223–234. doi:10.1016/S0020-7373(70)80008-6
Viterbi, A. (1967). Error bounds for convolutional codes and an asymptotically optimum decoding algorithm. IEEE Trans. Inf. Theory 13, 260–269. doi:10.1109/TIT.1967.1054010
VTI Instruments. (2014). EMX-4250/4251 Data Sheet. Irvine, CA. Available at: http://www.vtiinstruments.com/files/DATASHEET/EMX_4250_4251.PDF
Woyach, K., Puccinelli, D., and Haenggi, M. (2006). “Sensorless sensing in wireless networks: implementation and measurements,” in Modeling and Optimization in Mobile, Ad hoc and Wireless Networks, 2006 4th International Symposium on, Boston, MA, 1–8.
Xu, C., Firner, B., Moore, R. S., Zhang, Y., Trappe, W., Howard, R., et al. (2013). “SCPL: Indoor device-free multi-subject counting and localization using radio signal strength,” in Information Processing in Sensor Networks (IPSN), 2013 ACM/IEEE International Conference on, Philadelphia, PA, 79–90.
Zeng, Y., Pathak, P. H., and Mohapatra, P. (2016). “WiWho: Wifi-based person identification in smart spaces,” in Proceedings of the 15th International Conference on Information Processing in Sensor Networks, Vienna, 4.
Keywords: smart building, structural dynamics, occupancy, tracking, vibration
Citation: Poston JD, Buehrer RM and Tarazaga PA (2017) A Framework for Occupancy Tracking in a Building via Structural Dynamics Sensing of Footstep Vibrations. Front. Built Environ. 3:65. doi: 10.3389/fbuil.2017.00065
Received: 11 April 2017; Accepted: 11 October 2017;
Published: 06 November 2017
Edited by:
Hae Young Noh, Carnegie Mellon University, United StatesReviewed by:
Donghyeon Ryu, New Mexico Institute of Mining and Technology, United StatesHongki Jo, University of Arizona, United States
Pei Zhang, Carnegie Mellon University, United States
Copyright: © 2017 Poston, Buehrer and Tarazaga. This is an open-access article distributed under the terms of the Creative Commons Attribution License (CC BY). The use, distribution or reproduction in other forums is permitted, provided the original author(s) or licensor are credited and that the original publication in this journal is cited, in accordance with accepted academic practice. No use, distribution or reproduction is permitted which does not comply with these terms.
*Correspondence: Jeffrey D. Poston, poston@vt.edu