An Experimental Study on the Wind-Induced Response of Variable Message Signs
 Debbie Meyer
 Ioannis Zisis
 Bodhisatta Hajra3
 Arindam Gan Chowdhury
- 1Florida’s Turnpike Enterprise, Ft. Lauderdale, FL, United States
- 2Department of Civil and Environmental Engineering, Florida International University, Miami, FL, United States
- 3International Hurricane Research Center, Florida International University, Miami, FL, United States
- 4Department of Civil and Environmental Engineering, Wall of Wind Experimental Facility, Florida International University, Miami, FL, United States
Variable message sign (VMS) systems are widely used in motorways to provide traffic information to motorists. Such systems are subjected to wind-induced structural vibration that can lead to damage due to fatigue. The limited information that is available on the safe wind design of VMS motivated a large scale testing that was conducted at the wall of wind (WOW) Experimental Facility at Florida International University (FIU). One of the objectives of the present study was to experimentally assess the wind-induced force coefficients on VMS of different geometries and utilize these results to provide improved design guidelines. A comprehensive range of VMS geometries was tested, and mean normal and lateral force coefficients, in addition to the twisting moment coefficient and eccentricity ratio, were determined using the measured data for each model, for wind directions of 0° and 45°. The results confirmed that the mean drag coefficient on a prismatic VMS is smaller than the value of 1.7 suggested by American Association of State Highway and Transportation Officials (AASHTO). An alternative to this value is presented in the form of a design matrix with coefficients ranging from 0.98 to 1.28, depending on the aspect and depth ratio of the VMS. Furthermore, results indicated that the corner modification on a VMS with chamfered edges demonstrated a reduction in the drag coefficient compared to sharper edges. Finally, the dynamic loading effects were considered by evaluating the gust effect factor, using the ASCE 7 formulations, for various VMS weights and geometries. The findings revealed a wide range of possible gust effect factors, both above and below the current AASHTO specification of 1.14. Future research may include different geometries of VMS and a wider range of wind directions.
Introduction
Variable message sign (VMS) systems are important elements of intelligent transportation systems and provide a technologically advanced alternative to static flat panel signs. These programmable traffic control devices provide real-time information about changing highway conditions and hazards such as inclement weather, traffic accidents, construction activity, congestion, and public service alerts (Park and Stallings, 2006). Wind-induced vibration can cause fatigue damage, leading to failure of VMS and signboards in high-wind regions (Kaczinski et al., 1998).
Variable message signs generally have rectangular prismatic shapes, and the wind flow around a VMS is characterized by separation from the upstream leading edges. However, the drag coefficient for a 2 dimensional flat sign panel can be significantly different from the drag coefficient for a 3 dimensional prismatic VMS. This depends in part on whether separation of the flow at the leading edges is followed by reattachment along the sides. Many researchers have studied wind flow characteristics around rectangular prisms with different depth ratios to evaluate the potential for reattachment along the sides and the resulting effect on drag (e.g., Bearman and Trueman, 1972; Schewe, 2001, Larose and D’Auteuil, 2008). In fact, Letchford (2001) conducted wind tunnel tests to investigate the effect of drag on a variety of elevated flat panel sign geometries on 1:50 scale rectangular models. Letchford’s results demonstrated that for aspect ratios greater than one, as the sign panel becomes short and wide, the mean drag force increases for as the panel is above the ground. Likewise, Zuo et al. (2014) investigated wind load effects on thirty-nine 1:50 scale rectangular box shapes with various geometric configurations in the Texas Tech University wind tunnel. Their results showed that the mean force coefficients for the rectangular box models were consistently lower than those obtained for flat panel signs with the same aspect and clearance ratios and this finding was attributed to the reattachment of flow.
The American Association of State Highway and Transportation Officials (AASHTO, 2013), suggests a drag coefficient of 1.7 to be used in the wind pressure equation for strength and fatigue design of VMS. While estimating the drag coefficient of 1.7 for VMS in AASHTO (2013) (Table 3-6), the drag force is normalized by the 3-s gust wind speed. In fact, AASHTO (2013) suggests using a drag coefficient of 1.7 for VMS until additional research can provide more accurate drag coefficient values. This motivated the need for additional experimental studies that were carried out in an atmospheric boundary layer (ABL), at the wall of wind (WOW) experimental facility at Florida International University (FIU), USA. It may be noted that studies on VMS carried out by Letchford (2001), which also appear in Chapter C29 of the ASCE 7-10 (2010) commentary, are based on “net mean force coefficients.”
In order to consider the dynamic loading effects on the VMS, assessing the gust effect factor is essential (Solari and Kareem, 1998). However, AASHTO (2013) provides a gust effect factor of 1.14, irrespective of the weight/geometry of the VMS. Therefore, the effect of various realistic weights of VMS on the ASCE 7-10 (2010) gust effect factor values, with the inclusion of aerodynamic damping, was also considered. In summary, the novelty of the current study lies in its main objectives, which are to: (a) assess through large-scale experiments the wind-induced force coefficients and gust effect factors for VMS of different geometries; (b) explore the possibility of reducing the force coefficients by corner modifications, resulting in an optimized design of VMS to reduce drag forces; and to (c) utilize the results from the present study to develop improved design guidelines. The following sections describe the experimental set up, the research findings and discussion on the implementation of the gust effect factor approach for the safe design of VMS.
WOW Experimental Setup
The experiments were conducted at the WOW experimental facility at FIU, USA. This open jet facility is 6.1 m wide, 4.3 m high and is capable of generating wind speeds exceeding 70 m/s (157 mph), which is equivalent to category 5 hurricane as per the Saffir–Simpson scale (Chowdhury et al., 2017). The 12 fans are arranged in a convex arc, while the 9.8 m flow simulation box consisting of triangular spires and floor roughness elements help develop the desired ABL profiles corresponding to open and suburban terrain exposures. This facility has been involved in pioneering research on various infrastructure systems, such as: wind loads on traffic signals (Zisis et al., 2016), wind loads on long span bridges (Kargarmoakhar et al., 2015), and wind loads on VMS (Meyer et al., 2015). For the present study, a length scale of 1:3 and velocity scale of 1:1 were used. The measured mean wind velocity used in this study at the model height of 2.3 m (6.9 m full scale) was approximately 40 m/s, while the turbulence intensity at this height was approximately 8%. The turbulence intensity of the WOW laboratory flow at the full scale height of 6.9 m is lower than the full-scale suburban terrain ABL. The spectra plotted at 2.3 m (model scale) above the WOW floor is compared to ESDU-85020 (2001) as shown in Figure 1. Data show that there is significant departure between WOW and ESDU data at the low frequency end of the spectrum. However, previous studies by Irwin (1998), Mooneghi et al. (2016), and Meyer et al. (2015) have shown that by simulating the high frequency end of the turbulence spectrum, the important turbulence effects are included which is sufficiently accurate for estimating the mean loads on the structure.
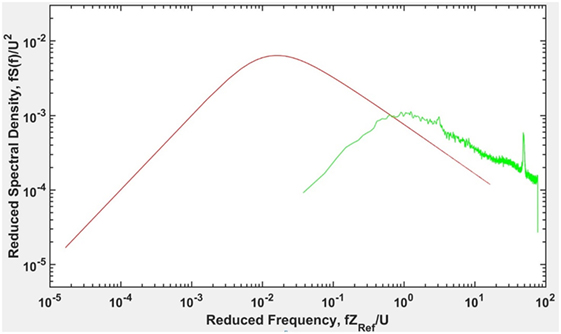
Figure 1. Longitudinal wind spectrum at height of 2.3 m (model scale) above wall of wind (WOW) floor for an open terrain.
Experimental Design
This section presents the different configurations tested in the WOW and the instrumentation used for the study. The primary focus was the investigation of aerodynamic force coefficients for VMS. Consequently, only the VMS, and not the truss structure, was modeled for testing. It is recognized that the mutual interaction of the sign and the truss structure was not taken into account. However, it is to be noted that the current design procedure (as in AASHTO, 2013) uses separate aerodynamic coefficients for the sign and the support structure, thus neglecting the interaction effect. A similar approach has been taken for this paper as it was not practical to test the large number of possible sign and truss structure configurations.
VMS Configurations Tested in the WOW
Variable message signs are substantially heavier than flat panel aluminum signs and have larger depth (dimension parallel to the direction of traffic). The additional depth and weight can have a significant effect on the aerodynamic forces and inertial loads transmitted to the support structure. Figure 2A shows the primary dimensions: lateral length b, height c, depth (parallel to highway length) d, and the distance from the ground to the top of the model h. The geometric ratios that are used throughout this study are:
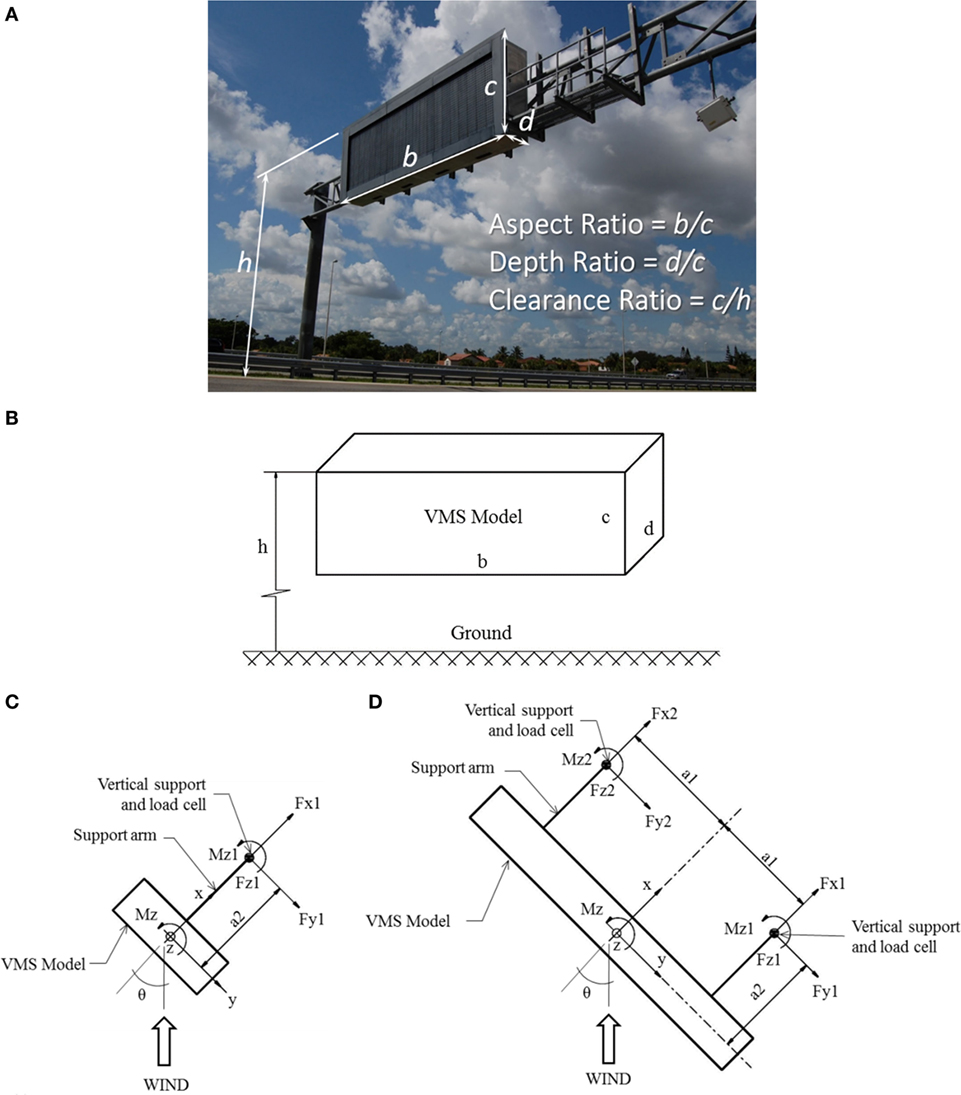
Figure 2. Variable message sign: (A) VMS on Florida’s Turnpike highway (photo by D. Meyer); (B) schematic representation of the primary dimensions; (C) single support system; (D) double support system.
Figure 2B presents a schematic representation of the VMS model and its dimensions. Figures 2C,D show the single support and double support systems, respectively. The forces in the x-axis are positive in the highway direction, while the forces in the y-axis are positive to the right. Similarly, the forces in the z-axis are positive in the upward direction, while counter-clockwise torsional moment is represented as Mz1. The forces and moments measured by individual load cells for this study are also shown. Angle θ defines the horizontal wind approach direction and 0° is defined as wind normal to the front face of the model. Due to cost constraints, the wind directions of 0° and 45° were chosen based on results obtained from Smith et al. (2014) who found the range of 0–45° to be the most critical.
Table 1 presents the dimensions of various configurations tested in the WOW. Models 1–9 have sharp edges and vary in length from 0.6 to 3 m with depths varying from 61 to 427 mm. Model 10 had 32 mm round edges (5% of the model height), and Model 11 had 32 mm chamfered edges (5% of the model height). The models were fabricated from 13 mm shop grade maple plywood and reinforced with 51 mm × 102 mm southern pine. All wood-to-wood connections were joined with 25 mm screws and structural wood glue. The model support structure consisted of either a single support (Figure 3A) or a double support system (Figure 3B). In addition, the effect of corner modification (Figures 3C,D) was also considered for the study.
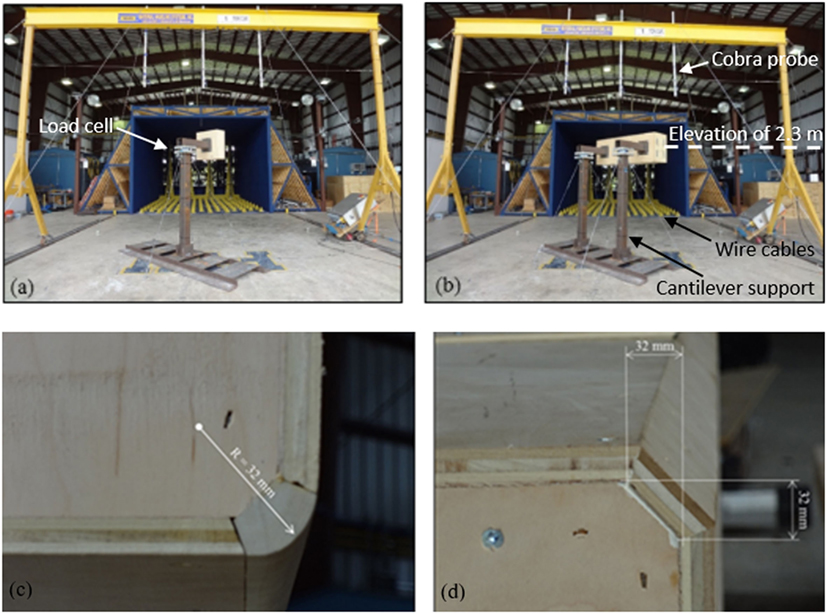
Figure 3. Testing of variable message sign (VMS) models: (A) single support system; (B) double support system; (C) round corner (Model 10); (D) chamfered corner (Model 11).
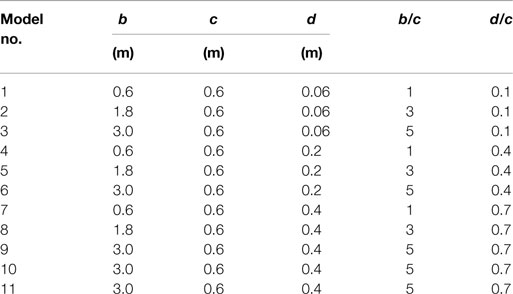
Table 1. Model dimensions and geometric ratios.
The single support system was used for testing Models 1, 4, and 7. The double support system was used for Models 2–3, 5–6, and 8–11. A total of three complete support systems were required and assembled for testing. Wind tunnel tests for each model were conducted at test wind speeds of 40 m/s (at model height of 2.3 m). The ambient temperature and air pressure readings were monitored and updated before each test. Data were sampled at 100 Hz for 1 min for each test run. Baseline data (measured at zero wind speed), sampled 1 min before and 1 min after each test run, were averaged and subtracted from the measured test data to eliminate for zero offset effects.
Instrumentation Used for the Study
A multi-axis load cell supplied by JR3, Inc. (JR3, 2012) was mounted on top of each vertical support to simultaneously measure forces and moments in the x, y, and z directions (Figure 3A). The measurements of the forces were carried at a frequency of 100 Hz. The maximum load capacity of the load cell in the “x” and “y” directions are 6,000 N and in the “z” direction is 6,600 N. The load cells were calibrated using a known force of 1,780 N specified by the instrument specifications. Their operating temperature range is −40 to +65°C. Their nominal accuracy is 0.25% of the measuring range and their digital resolution is <1 N. Cobra probes supplied by Turbulent Flow Instruments (Turbulent Flow Instrumentation, 2008) were used to measure the wind velocity and turbulence in three orthogonal directions. The particular probes have an accuracy of ±0.3 m/s. The probes were mounted vertically 0.9 m above the model at an elevation of 3.5 m above the WOW floor (Figure 3B).
Data Analysis Methods
Force Coefficient and Moment Coefficients
The mean normal (CFx) and lateral (CFy) force coefficients were calculated from the measured data for each model using the following equations:
where Fx and Fy are the resultant mean forces along the x and y axis, ρ is the density of air (~1.23 kg/m3 computed from measured data), (m/s) is the mean wind speed, b (m) is the lateral length of the VMS, d (m) is the along wind depth when the sign is normal to the mean wind direction, and c (m) is the height of the VMS.
The mean moment about the z axis is termed the twisting moment and is defined as:
The non-dimensional eccentricity ratio about the central vertical (z) axis is defined as:
where CMz is the mean twisting moment coefficient about the centroidal z axis and r is the distance from the centroid of the model to the point of application of the force.
Gust Effect Factor
The wind gustiness needs to be considered in order to account for the dynamic loading effects on the system. The ASCE 7 standard makes use of the gust effect factor which, when combined with the mean wind loads, provides reliable peak design wind loads (Solari and Kareem, 1998). The current AASHTO provides a gust effect factor of 1.14, irrespective of the weight/geometry of the VMS. Therefore, different realistic values of VMS weights and geometries were considered with the inclusion of damping ratio ζ, to assess the gust effect factor using the ASCE 7 formulation.
The analytical expressions used in ASCE 7 to estimate gust effect factors account for aerodynamic admittance and structural resonance effects and simplify the calculation in a convenient fashion suitable for a building code or standard. However, as part of the simplification process, and as a conservative approximation, the aerodynamic contribution to total damping ratio has been omitted in the ASCE 7-10 (2010) gust effect factor equation. Although this is a reasonable approach for most large structures, for flexible sign structures this can lead to significant over-estimates of the gust effect factor. Therefore, the added damping term was included in the present study and its concept is discussed below.
Aerodynamic Damping
Figure 4 shows a horizontally aligned long, line-like, flexible structure of length L, width b1, vertical depth d1, and mass per unit length m(y), with wind of uniform mean velocity normal to its length. The initial assumption is that b1 and d1 are very small relative to L; hence the term “line-like.” Later, in the analysis, the case where b1 and d1 may not be that small relative to L will be evaluated. Although the instantaneous turbulence velocities at different points are different, statistically the turbulence is homogeneous along the span. The quasi-steady assumption that the fluctuating wind loads can be determined from the aerodynamic force coefficients measured in steady flow was adopted. It can be shown that the equation of motion in a particular mode of vibration, that has frequency ϖ0 and damping ratio ζ, is:
where: m is the mass per unit length, MG is the generalized mass, and f is the force per unit length. The generalized aerodynamic force may be written as:
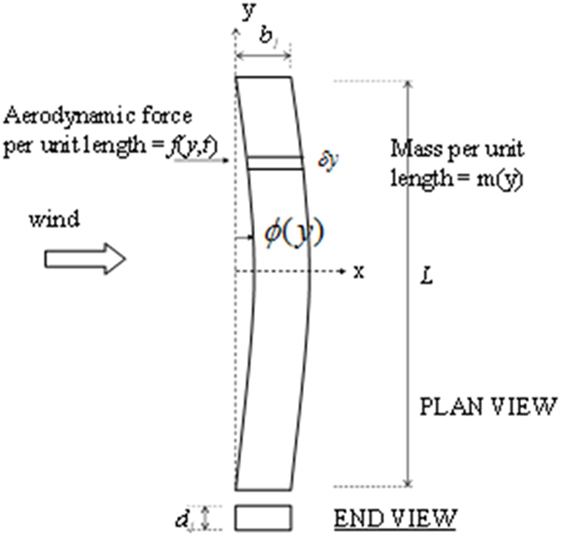
Figure 4. Schematic of flexible line like structure.
The term involving may be taken over to the left hand side of Eq. 9 and combined with the damping term already there. The equation of motion may then be written as:
The total damping ratio is now given by the structural damping ratio (ζ) plus the aerodynamic damping ratio (ζα) as follows:
Note that for the case where CFx and d1 are constant along the span, and where the mass per unit length m is also constant, ζα may be written as:
Therefore, in order to estimate the gust effect factor for VMS structures, the ASCE 7-10 (2010) procedure can be adopted with one modification, which is to add the aerodynamic damping to the structural damping. However, to provide rough estimates of the contribution of aerodynamic damping to total damping in the present study, the following simplifying assumptions have been made: (1) based on the typical ratios of VMS mass to truss mass, the generalized mass of the entire sign structure, including the sign, is assumed to be the mass of the VMS and 50% of the mass of the truss; (2) the sign is assumed to be located at the point of maximum deflection; and (3) the aerodynamic drag forces on the support structure are ignored for the calculation of aerodynamic damping. The effects of these three assumptions are expected to result in a conservative estimate of the aerodynamic damping.
In ASCE 7-10 (2010) notation the gust effect factor for dynamically sensitive structures is given by:
Equation 13 appears in Chapter 26, page 255 of the ASCE 7-10 (2010) as equation 26.9–10. All the terms are defined in ASCE 7-10 (2010) and the definitions will not be repeated here. The point of including this expression is simply to illustrate where the damping ratio enters the calculation of Gf. The damping ratio of the structure enters into the so-called resonant term in the square root. This resonant term is inversely proportional to damping ratio, called ζ in this paper but denoted by the symbol β in ASCE 7-10 (2010). In ASCE 7-10 (2010), no guidance is provided on the contribution to damping ratio from aerodynamic effects, and it is common practice to assume the damping is due to structural energy dissipation only, i.e., to ignore the aerodynamic contribution. In the current study, the gust effect factors were estimated for a selection of VMS geometries and weights as discussed later in the results and discussion section.
Results and Discussion
Force Coefficients and Design Matrix
A summary of mean force coefficient results is included in Table 2. The design matrix shown in Table 3 is a synthesis of the drag coefficient results from this research as functions of the aspect ratio (b/c) and depth ratio (d/c). A comparison of CFx results in Table 2 for the 0° and 45° wind directions indicate that the results for the 45° direction were generally lower than the results obtained for the 0° wind direction. This finding is consistent with the results reported by Zuo et al. (2014). Table 3 is provided as an alternative to the AASHTO (2013) drag coefficient value of 1.7 which neglects the effects of geometric variations. The CFx values in the matrix are based on the results obtained for the 40 m/s wind speed in the 0° horizontal wind direction since, for 8 out of the 9 models being tested, these values were larger than the values obtained for the 45° wind direction. The one exception was the value for b/c = 1 with d/c = 0.1. The value CFx = 1.21 is a rounded value that takes into account the large results obtained for the geometric configuration of Model 1 in the 45° horizontal wind direction. Intermediate values for b/c = 2 and 4 and d/c = 0.2, 0.3, 0.5, and 0.6 were interpolated from tested geometric configurations. The effect of aspect ratio on the force coefficients is discussed further.
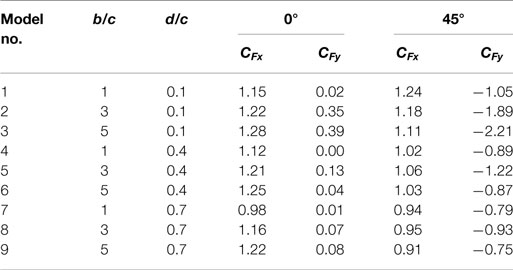
Table 2. Force coefficient results.
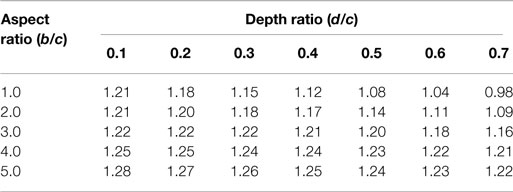
Table 3. Design matrix.
Effect of Aspect Ratio (b/c)
The variation of the normal force coefficient (CFx) as a function of aspect ratio for the 0° horizontal wind direction is presented in Figure 5A for d/c = 0.1, 0.4, and 0.7. The plotted results for 40 m/s wind speed clearly show that the drag coefficient increased with aspect ratio. This is consistent with the normal force coefficient trends noted in the studies by Letchford (2001) and Zuo et al. (2014).
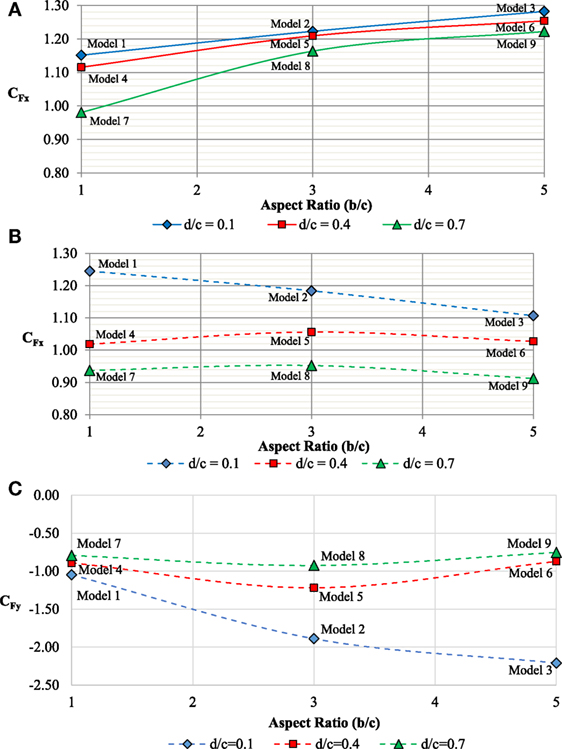
Figure 5. Effect of aspect ratio on: (A) CFx for 0°; (B) CFx for 45°; (C) CFy for 45°.
The variation of the normal force coefficient (CFx) as a function of aspect ratio (b/c) for the 45° horizontal wind direction is presented in Figure 5B for depth ratio (d/c) = 0.1, 0.4, and 0.7. The results show that for models 1, 2, and 3, at a given depth ratio of 0.1, the value of CFx decreases with increasing aspect ratios. However, for d/c of 0.4 and 0.7, the value of CFx remains nearly constant for models 4 through 9, for increasing values of b/c.
Figure 5C shows the trend of CFy as a function of aspect ratio for the 40 m/s wind speed in the 45° wind direction. As expected, all results for the 45° wind direction are negative (refer to Figure 2 for the force orientation) due to the positioning of the model with respect to the oncoming flow and the positive orientation of Fy. The graph shows that CFy increases with increasing aspect ratio for the models with the smaller depth ratio (Models 1–3) but peaks around b/c = 3 for the models with larger depth ratios (Models 4–9). The effect of depth ratio on the force coefficients is discussed further.
Effect of Depth Ratio (d/c)
Figure 6A shows the variation of the normal force coefficient (CFx) for the 0° horizontal wind approach as a function of depth ratio for b/c = 1, 3, and 5. The plotted results for 40 m/s wind speed shows a decreasing trend in CFx with increasing depth ratio for all aspect ratios tested.
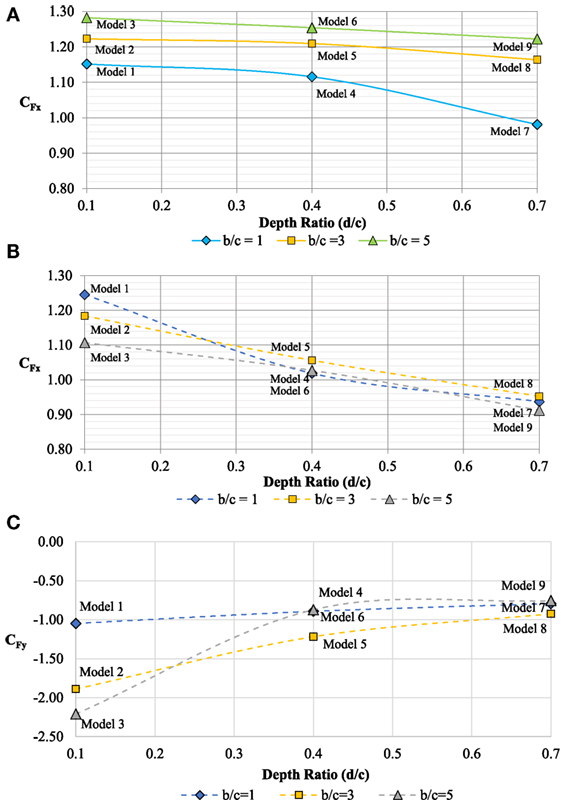
Figure 6. Effect of depth ratio on: (A) CFx for 0°; (B) CFx for 45°; (C) CFy for 45°.
These results suggest that partial reattachment of flow over a prismatic VMS reduces the drag force, resulting in a smaller drag coefficient. The sharpest decrease in normal force was noted for the square models, b/c = 1 (Models 1, 4, and 7). Model 7 (largest d/c and smallest b/c) resulted in the smallest normal force coefficient among all models tested. For 0° wind direction, CFy values were relatively small with the exception of those for Models 2 and 3 (see Table 2) with the lowest depth ratio (d/c = 0.1) and higher aspect ratios (b/c = 3 and 5). Figure 6B shows the variation of CFx for 45° wind direction as a function of depth ratio for b/c = 1, 3, and 5. Results show that CFx for the 45° wind direction also decreased with increasing depth ratio.
Figure 6C is a plot of CFy as a function of depth ratio (d/c) for aspect ratio, b/c = 1, 3, and 5 for wind direction of 45°. Results show that for a value of b/c = 3 or 5, CFy decreases in magnitude with increasing depth ratio (d/c). However, a marginal reduction in magnitude of CFy is observed despite an increase in depth ratio for b/c = 1. It is to be noted that for both 0° and 45° wind directions, CFy values were relatively larger for the higher aspect ratios (b/c = 3 and 5) when the depth ratio was the smallest (d/c = 0.1) (see Table 2).
Results for Moment Coefficients and Eccentricity Ratios
Table 4 summarizes the results for the twisting moment (CMz) and eccentricity ratio (r/b) for the 45° wind direction (the eccentricity for the 0° horizontal wind approach direction is approximately zero for all the models tested). The largest calculated eccentricity is r/b = 0.13 for Model 2, which is lower than the ASCE 7-10 (2010) suggested value of 0.2 and is consistent with the results obtained by Zuo et al. (2014). It should be noted that the current AASHTO (2013) does not include a design requirement for eccentricity.
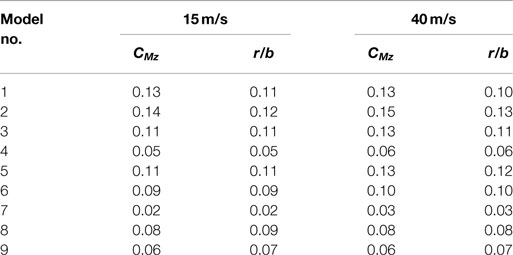
Table 4. Twisting moment coefficient and eccentricity ratio results.
Effect of Corner Modification
The current study investigated the effects of modifying the VMS model by changing the sharp corners to round (Model 10) and chamfered (Model 11) corners. To study possible Reynolds number (Re) effect on the wind-induced drag on the models with modified corners, testing was performed for two wind speeds – 15 and 40 m/s. Figure 7A shows plots of CFx for the 0° wind direction for the models with modified corners as a function of wind speed. The results for the sharp corners model (Model 9) are included in the graph for comparison. The results show that drag coefficients for models with modified corners are lower than the drag coefficients for the sharp corner models. As outlined by Tamura and Tetsuya (1999), chamfered and round corners decrease the wake width resulting in reduced drag. At a wind speed of 15 m/s, the drag coefficient is highest for the sharp corner model and lowest for the round corner model. The drag coefficient reductions for the chamfered and the round corner models are 18 and 29%, respectively. These results agree qualitatively with Tamura and Tetsuya (1999) and Yamagishi et al. (2010). Results for wind speed of 40 m/s shows that though the chamfered corner model results were insensitive to Re effects, the round corner model results were sensitive to Re effects. For the higher wind speed of 40 m/s, the drag coefficient reductions for the chamfered and the round corner models are 17 and 13%, respectively. Thus, the chamfered modification is recommended for wind load mitigation purposes since it is less sensitive to Re and is easier to fabricate.
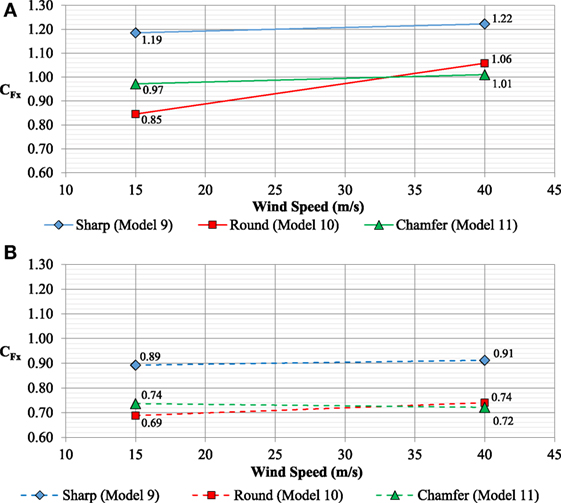
Figure 7. Comparison of sharp and modified corner results: (A) 0°; (B) 45°.
Figure 7B shows the results of CFx in the 45° wind direction. Results show that the coefficients for the modified corner models are significantly lower than the sharp corner for Model 9. Similar to the 0° wind direction, the coefficients at 45° wind direction at 15 m/s wind speed test is largest for the sharp corner model, and lowest for the round corner model.
Likewise, at 40 m/s wind speed, the coefficient is largest for the sharp corner model and lowest for the chamfered corner model. These results again show Re sensitivity for the round corner model. The drag coefficients for the sharp corner and modified corner models are tabulated in Table 5 based on the higher wind speed test results. For 0° wind direction, CFx values reduced for the rounded and chamfered corner models (Models 10 and 11), although CFy values increased. For 45° wind direction, CFx values reduced for the rounded and chamfered corner models, although CFy values were not affected by corner modifications.
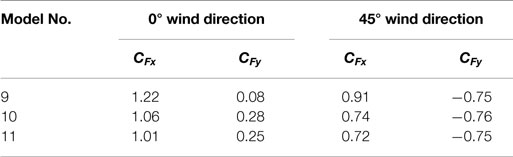
Table 5. Modified corner results.
Gust Effect Factor for Different VMS Mass Considerations
The variation of gust effect factor as a function of wind speed for different masses of VMS is presented. The gust effect factor was calculated using Eq. 13 and the following cases were considered:
• Width b = 9.1 m, height c = 2.4 m, depth d = 1.2 m; two weights were examined, 201 kg/m and 104 kg/m.
• A large sign with b = 15.2 m, c = 3.7 m and d = 1.8 m; two weights were examined, 335 kg/m and 179 kg/m.
• A small sign with b = 3.7 m, c = 1.8 m and d = 0.9 m; two weights were examined, 112 kg/m and 60 kg/m.
Figures 8 and 10 shows the behavior of the gust effect factor plotted as a function of 3 s reference gust speeds and various natural frequencies. The exposure was taken as open terrain (Exposure C of ASCE 7) and the reference wind speed was the standard speed at 10 m height in open terrain. Appropriate adjustments were made to the speed to determine the speed at the mid height of the sign. A representative drag coefficient of 1.25 was used in the calculations. The structural damping ratio was taken to be 0.005 but tended to be far outweighed by the aerodynamic damping at high wind speeds. As a result, the gust effect factor calculations were not overly sensitive to the assumed structural damping. It can be seen in Figures 8–10 that these rough estimates show a wide range of possible gust effect factors, some below the existing 1.14 value in AASHTO and some above. For the mid-sized heavier weight sign at wind speeds above 45 m/s (Figure 8A), the gust effect factor ranges from about 1.07 for a fairly stiff sign with a frequency of 3 Hz to about 1.34 for a very flexible sign with a low frequency of 1 Hz. For the light-weight mid-sized sign (Figure 8B), the aerodynamic damping is relatively higher. This reduces the gust effect factor so that at speeds above 45 m/s it ranges from about 1.00 for the stiffest case (frequency = 3 Hz) to 1.18 for the most flexible (frequency = 1 Hz). The larger sign sees generally lower gust effect factors, ranging from about 0.95 to 1.24 for speeds above 45 m/s (Figure 9). The smallest sign sees the highest gust effect factors, ranging from about 1.11 up to 1.43 at speeds above 45 m/s (Figure 10).
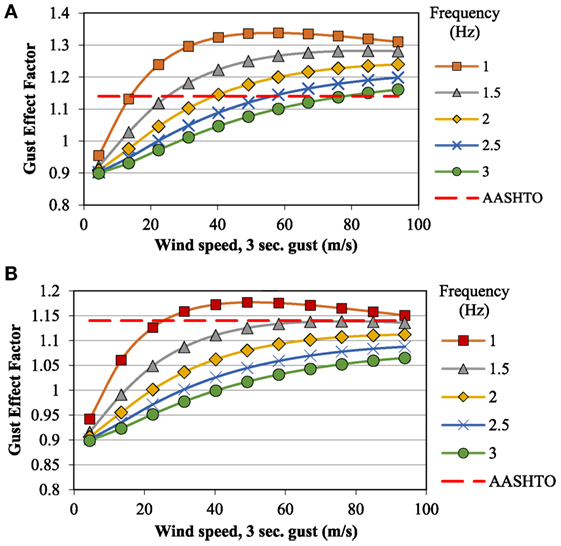
Figure 8. Estimated gust effect factor for mid-sized sign: (A) heavier weight; (B) lighter weight.
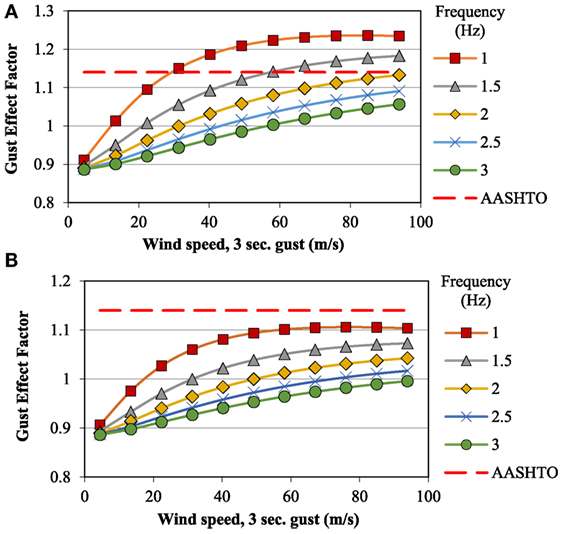
Figure 9. Estimated gust effect factor for large sign: (A) heavier weight; (B) lighter weight.
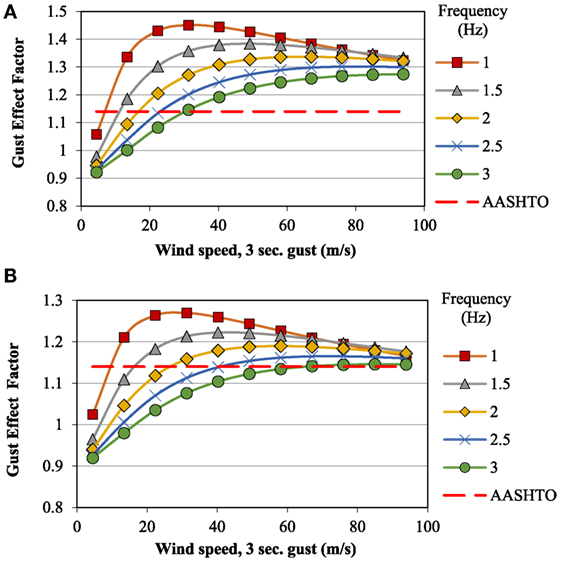
Figure 10. Estimated gust effect factor for small sign: (A) heavier weight; (B) lighter weight.
Although the scope of the current studies was focused on mean drag coefficients of VMS, this preliminary assessment of the gust effect factor allows some conclusions to be drawn on this other important factor that forms part of the aerodynamic drag calculation. It indicates that gust effect factors in excess of the standard 1.14 value assumed by AASHTO are possible for more flexible sign structures.
Conclusion
The wind-induced effects of VMS were examined through large scale testing at the WOW Experimental Facility at Florida International University (FIU). The tests confirmed that the prismatic geometry of a VMS can significantly affect wind loading. Results showed that the normal force coefficient increases with increasing aspect ratio and decreases with increasing depth ratio. Wind direction results for the 45° horizontal wind direction were consistently lower than the results obtained in the 0° direction (except for b/c = 1, d/c = 0.1). The results confirmed that the drag coefficient on a prismatic VMS is smaller than the value of 1.7 suggested by AASHTO. Based on the results, a design matrix of force coefficients were developed. The maximum value obtained for the non-dimensional eccentricity ratio for the 45° wind direction (r/b = 0.13) was lower than the current ASCE 7-10 (2010) suggested value of 0.2 but in good agreement with the study conducted by Zuo et al. (2014) which also reported eccentricity ratios below 0.15. The effect of corner modifications showed that chamfered and rounded corners produced considerable reductions in the drag coefficient values. The results from the round corner tests indicated a possible Reynolds number dependency. Effect of corner modifications on CFy values for 0° wind direction needs further investigation. Finally, gust effect factors were estimated for a selection of sign geometries and weights using the ASCE 7-10 (2010) formulations, including an additional aerodynamic damping term. Results showed a wide range of possible gust effect factors, both above and below the current AASHTO specification of 1.14.
Although the present study considered wind angles of 0° and 45°, future research should focus on investigating more wind directions to ensure that maximum force coefficient and coefficient of eccentricity are adequately estimated, especially for signs of substantial depths. The polynomial fits used in the current paper were based on limited points. In future, more cases of aspect and depth ratios should be tested in order to facilitate a more rigorous regression analysis based on several points.
Author Contributions
DM is a former Ph.D. student at CEE and has carried out the tests at the WOW, besides performing most of the data analysis. IZ is an Assistant Professor at CEE, FIU and has reviewed the results presented and developed the structure of the paper, in addition to checking all the data collected during the experiments. BH is a Research Scientist at FIU and has carried out data analysis, in addition to writing several sections of the paper. AGC is an Associate Professor at CEE and has reviewed the results from the experiments, besides assisting in the development of the paper. PI is a Professor of Practice at CEE and has provided valuable suggestions in developing the paper, besides reviewing the data analysis procedures.
Conflict of Interest Statement
The authors declare that the research was conducted in the absence of any commercial or financial relationships that could be construed as a potential conflict of interest.
Acknowledgments
This research was supported by the National Center for Transportation Systems Productivity and Management (NCTSPM). NCTSPM is a collaboration between Georgia Institute of Technology, Georgia Transportation Institute, Florida International University, University of Central Florida, University of Alabama at Birmingham, and each university’s state Department of Transportation. The instrumentation used for the experiments were funded by the National Science Foundation (NSF) [NSF MRI Award CMMI-0923365]. We acknowledge Dr. Emil Simiu for his suggestions to improve the manuscript. The authors also would like to acknowledge Walter Conklin, James Erwin, and Roy Liu Marques of Wall of Wind, FIU for their unreserved input during testing. The findings reported in this article are those of the authors alone, and do not necessarily represent the views of sponsoring agencies.
References
AASHTO. (2013). Standard Specifications for Structural Supports for Highway Signs, Luminaires and Traffic Signals, 6th Edn. Washington, DC: American Association of State Highway and Transportation Officials.
ASCE 7-10. (2010). Minimum Design Loads for Buildings and Other Structures. Reston, VA: American Society of Civil Engineers.
Bearman, P. W., and Trueman, D. M. (1972). An investigation of the flow around rectangular cylinders. Aeronaut. Q. 23, 229–237.
Chowdhury, A. G., Zisis, I., Irwin, P., Bitsuamlak, G. T., Pinelli, J. P., Hajra, B., et al. (2017). Large-scale experimentation using the 12-fan wall of wind to assess and mitigate hurricane wind and rain impacts on buildings and infrastructure systems. J. Struct. Eng. 143:04017053. doi:10.1061/(ASCE)ST.1943-541X.0001785
ESDU-85020. (2001). Characteristics of Atmosphere Turbulence Near the Ground, Part II: Single Point Data for Strong Winds (Neutral Atmosphere). Technical Report 85020. Engineering Sciences Data Unit (ESDU).
Irwin, P. A. (1998). “The role of wind tunnel modeling in the prediction of wind effects on bridges,” in The International Symposium on Advances in Bridge Aerodynamics, ed. A. L. S. Esdahl (Copenhagen, Denmark), 99–117.
JR3. (2012). Installation Manual for Force-Torque Sensors. Woodland, CA: JR3 Inc. Available at: http://www.jr3.com/
Kaczinski, M. R., Dexter, R. J., and Van Dien, J. P. (1998). Fatigue-Resistant Design of Cantilevered Signal, Sign and Light Supports. No. 412, NCHRP Report. Washington, USA: Transportation Research Board.
Kargarmoakhar, R., Irwin, P. A., and Chowdhury, A. G. (2015). Reynolds number effects on twin box girder long span bridge aerodynamics. Wind Struct. 20, 327–347. doi:10.12989/was.2015.20.2.327
Larose, G. L., and D’Auteuil, A. (2008). Experiments on 2D rectangular prisms at high Reynolds numbers in a pressurized wind tunnel. J. Wind Eng. Ind. Aerodyn. 96, 923–933. doi:10.1016/j.jweia.2007.06.018
Letchford, C. W. (2001). Wind loads on rectangular signboards and hoardings. J. Wind Eng. Ind. Aerodyn. 89, 135–151. doi:10.1016/S0167-6105(00)00068-4
Meyer, D., Chowdhury, A. G., and Irwin, P. (2015). Investigation of wind-induced dynamic and aeroelastic effects on variable message signs. Wind Struct. 20, 793–810. doi:10.12989/was.2015.20.6.793
Mooneghi, M. A., Irwin, P., and Gan Chowdhury, A. (2016). Partial turbulence simulation method for predicting peak wind loads on small structures and building appurtenances. J. Wind Eng. Ind. Aerodyn. 157, 47–62. doi:10.1016/j.jweia.2016.08.003
Park, J. S., and Stallings, J. M. (2006). Fatigue evaluations of variable message sign structures based on AASHTO specifications. KSCE J. Civil Eng. 10, 207–217. doi:10.1007/BF02824063
Schewe, G. (2001). Reynolds number effects in flow around a more-or-less bluff bodies. J. Wind Eng. Ind. Aerodyn. 89, 1267–1289. doi:10.1016/S0167-6105(01)00158-1
Smith, D. A., Zuo, D., and Mehta, K. C. (2014). Characteristics of net force and torques on a rectangular sign measured in the field. J. Wind Eng. Ind. Aerodyn. 133, 80–91. doi:10.1016/j.jweia.2014.07.010
Solari, G., and Kareem, A. (1998). On the formulation of ASCE7-95 gust effect factor. J. Wind Eng. Ind. Aerodyn. 77, 673–684. doi:10.1016/S0167-6105(98)00182-2
Tamura, T., and Tetsuya, M. (1999). The effect of turbulence on aerodynamic forces on a square cylinder with various corner shapes. J. Wind Eng. Ind. Aerodyn. 83, 135–145. doi:10.1016/S0167-6105(99)00067-7
Turbulent Flow Instrumentation. (2008). “Series 100 cobra probe manual,” in Turbulent Flow Instrumentation, 1–13. Available at: http://www.turbulentflow.com.au/
Yamagishi, Y., Kimura, S., and Makoto, O. (2010). Flow characteristics around a square cylinder with changing chamfer dimensions. J. Vis. 13, 61–68. doi:10.1007/s12650-009-0005-6
Zisis, I., Irwin, P., Berlanga, B., Chowdhury, A. G., and Hajra, B. (2016). “Assessing the performance of vehicular traffic signal assemblies during hurricane force winds,” in Proceedings of the 1st International Conference on Natural Hazards and Infrastructure (Chania, Greece).
Keywords: variable message sign, wall of wind, force coefficient, corner modification, gust effect factor
Citation: Meyer D, Zisis I, Hajra B, Gan Chowdhury A and Irwin P (2017) An Experimental Study on the Wind-Induced Response of Variable Message Signs. Front. Built Environ. 3:66. doi: 10.3389/fbuil.2017.00066
Received: 29 June 2017; Accepted: 11 October 2017;
Published: 03 November 2017
Edited by:
Kurtis Robert Gurley, University of Florida, United StatesReviewed by:
Swamy Selvi Rajan, CSIR-Structural Engineering Research Centre, IndiaLuping Yang, University of California, Berkeley, United States
Copyright: © 2017 Meyer, Zisis, Hajra, Gan Chowdhury and Irwin. This is an open-access article distributed under the terms of the Creative Commons Attribution License (CC BY). The use, distribution or reproduction in other forums is permitted, provided the original author(s) or licensor are credited and that the original publication in this journal is cited, in accordance with accepted academic practice. No use, distribution or reproduction is permitted which does not comply with these terms.
*Correspondence: Ioannis Zisis, izisis@fiu.edu