Defining and Systematic Analyses of Aggregation Indices to Evaluate Degree of Calcium Oxalate Crystal Aggregation
 Sakdithep Chaiyarit
  Visith Thongboonkerd*
- Medical Proteomics Unit, Office for Research and Development, Faculty of Medicine Siriraj Hospital; and Center for Research in Complex Systems Science, Mahidol University, Bangkok, Thailand
Crystal aggregation is one of the most crucial steps in kidney stone pathogenesis. However, previous studies of crystal aggregation were rarely done and quantitative analysis of aggregation degree was handicapped by a lack of the standard measurement. We thus performed an in vitro assay to generate aggregation of calcium oxalate monohydrate (COM) crystals with various concentrations (25–800 μg/ml) in saturated aggregation buffer. The crystal aggregates were analyzed by microscopic examination, UV-visible spectrophotometry, and GraphPad Prism6 software to define a total of 12 aggregation indices (including number of aggregates, aggregated mass index, optical density, aggregation coefficient, span, number of aggregates at plateau time-point, aggregated area index, aggregated diameter index, aggregated symmetry index, time constant, half-life, and rate constant). The data showed linear correlation between crystal concentration and almost all of these indices, except only for rate constant. Among these, number of aggregates provided the greatest regression coefficient (r = 0.997; p < 0.001), whereas the equally second rank included aggregated mass index and optical density (r = 0.993; p < 0.001 and r = −0.993; p < 0.001, respectively) and the equally forth were aggregation coefficient and span (r = 0.991; p < 0.001 for both). These five indices are thus recommended as the most appropriate indices for quantitative analysis of COM crystal aggregation in vitro.
Introduction
Crystal aggregation has been recognized as an initial important mechanism for kidney stone formation (Christmas et al., 2002). Microcrystals of calcium and other salts can be found in concentrated normal urine or renal tubular fluid. Nevertheless, the individual urinary microcrystals are too small and are normally eliminated by urinary or tubular fluid flow (Kok and Papapoulos, 1993; Christmas et al., 2002; Robertson, 2004). In addition to crystal growth and adhesion of crystals to renal tubular epithelial cells, crystal aggregation is a mechanism that causes the crystals to retain inside renal tubules by their rapidly enlarged size as a result of combining several individual crystals into an agglomerate (Kok and Papapoulos, 1993; Robertson, 2004). Moreover, previous studies have found that deficiencies of stone inhibitors are associated with large aggregated crystals in the urine of stone formers (Robertson et al., 1969; Robertson and Peacock, 1972). In addition, urinary macromolecules (e.g., Tamm-Horsfall protein) (Viswanathan et al., 2011) and various types of bacteria (Chutipongtanate et al., 2013) have been demonstrated to promote crystal aggregation.
Although crystal aggregation is a very important mechanism inducing kidney stone disease, it had been under-investigated in the past because of a limitation of available assays to examine crystal aggregation. Most of the previous studies employed microscopic examination to determine agglomerate of individual crystals to represent crystal aggregation (Thongboonkerd et al., 2008; Chutipongtanate et al., 2013). However, quantitative analysis of crystal aggregation depends only on number of the agglomerates and their size (Thongboonkerd et al., 2008; Chutipongtanate et al., 2013). Spectrophotometry is another method available for studying calcium oxalate monohydrate (COM) crystal aggregation by measuring absorbance or optical density (OD) at λ620 nm after mixing supersaturated solutions of calcium chloride and sodium oxalate (Hess et al., 1995; Baumann et al., 1997; Christmas et al., 2002). The decline of OD at λ620 nm has been used as an indirect parameter to determine degree of crystal aggregation (Hess et al., 2000; Baumann et al., 2011). However, the accuracy of such assay is doubtful as the reduction of the OD is an indirect measurement rather than the direct evidence of crystal aggregation. These limitations reflect the lack of systematic analysis of quantitative assays and indices that can be used to quantify the degree of crystal aggregation.
Accordingly, we aimed to define appropriate aggregation indices to quantify the degree of aggregation of COM crystals, which are the most common chemical composition found in kidney stones (Schubert, 2006). Various concentrations (25–800 μg/ml) of individual COM crystals were resuspended in saturated aggregation buffer and then incubated for 1 h. Subsequently, the aggregated crystals were analyzed by microscopic examination, UV-visible spectrophotometry, and GraphPad Prism6 software to define a total of 12 aggregation indices (including number of aggregates, aggregated mass index, optical density, aggregation coefficient, span, number of aggregates at plateau time-point, aggregated area index, aggregated diameter index, aggregated symmetry index, time constant, half-life, and rate constant). These indices were then systematically compared in correlation with dosage or concentration of the crystals seeded in the saturated aggregation buffer.
Materials and Methods
COM Crystal Preparation
Individual COM crystals were freshly prepared as previously described (Thongboonkerd et al., 2006, 2008), by mixing 10.0 mM CaCl2·2H2O and 1.0 mM Na2C2O4 (1:1 v/v) in a buffer containing 10 mM Tris-HCl and 90 mM NaCl (pH 7.4). The solution was incubated at room temperature (set as 25°C) overnight. COM crystals were then harvested by a centrifugation at 2,000 g for 5 min. The supernatant was discarded, whereas COM crystals were washed 3 times with methanol. After another centrifugation at 2,000 g for 5 min, methanol was discarded and the crystals were air-dried overnight at room temperature.
Preparation of Saturated Aggregation Buffer
The saturated aggregation buffer was prepared by modifying the plain artificial urine, which was made by dissolving 2.427 g urea, 0.034 g uric acid, 0.090 g creatinine, 0.297 g Na3C6H5O7·2H2O, 0.634 g NaCl, 0.450 g KCl, 0.161 g NH4Cl, 0.089 g CaCl2·2H2O, 0.100 g MgSO4·7H2O, 0.034 g NaHCO3, 0.003 g NaC2O4, 0.258 g Na2SO4, 0.100 g NaH2PO4·H2O, and 0.011 g Na2HPO4 in 200 ml deionized (18.2 MΩ·cm) water. Then, the artificial urine was made to be “saturated” with calcium and oxalate ions (namely “saturated aggregation buffer”) by adding sufficient amount of COM crystals into the plain artificial urine until the crystals could not be dissolved anymore. The suspension was then filtrated through 0.2-μm cellulose acetate membrane (Sartorius Stedim Biotech; Göttingen, Germany) and the saturated artificial urine was collected and used for all subsequent experiments.
Crystal Aggregation Assay
Crystal aggregation assay was performed by seeding individual COM crystals into a well of 6-well plate (Corning Inc.; Corning, NY) containing the saturated aggregation buffer at different concentrations (25, 50, 100, 200, 400, and 800 μg/ml). The suspension was then trembled in a shaking incubator (Zhicheng; Shanghai, China) at 150 rpm, 25°C. After 1-h incubation, crystal morphology was examined and imaged using Nikon Eclipse Ti-S inverted light microscope (Nikon; Tokyo, Japan). Thereafter, the suspension of the aggregated crystals was transferred into a cuvette and subjected to measurement of absorbance (optical density; OD) at λ620 nm using a UV-visible spectrophotometer (Analytik Jena AG; Jena, Germany) with 10-s interval over 300 s.
Aggregation Index Calculation
To quantitatively analyze degree of COM crystal aggregation, a total of 12 aggregation indices were calculated from morphological examination, UV-visible spectrophotometry, and analysis with GraphPad Prism6 software (GraphPad Software. Inc.; La Jolla, CA).
From morphological examination, aggregated crystals were defined as an assembly of three or more individual crystals tightly joined together. NIS Element D software version 4.11 (Nikon) was applied to measure number of aggregated crystals, minimal and maximal diameters of aggregated crystals, and crystal area from at least 15 fields per well.
From UV-visible spectrophotometry, the OD values at λ620 nm measured from at least 3 independent experiments were plotted along the y-axis against time, which was on the x-axis. Plateau time-point was defined as the time-point at which: (i) the ration of OD values at the closest interval time-points was <1±0.05; and (ii) t-test of the OD values at the closest interval time-points showed no statistically significant difference (p ≥ 0.05).
Finally, the OD values obtained from UV-visible spectrophotometry were entered into GraphPad Prism6 software to calculate for rate constant, half-life, span, and time-constant indices.
From these, indices #1-#8 were manually calculated using the following formulas, whereas indices #9-#12 (rate constant, half-life, span, and time-constant indices) were automatically generated by the GraphPad Prism6 software.
Index #1:
Index #2:
Index #3:
Index #4:
Index #5:
Index #6:
Index #7:
Index #8:
Note 1: “aggregate” stands for the crystal aggregate, whereas “single” stands for the non-aggregated crystal.
Note 2: Indices #9-#12 were automatically generated from the GraphPad Prism6 software.
Statistical Analysis
All the quantitative data are reported as mean ± SEM of those derived from at least 3 independent experiments. The linear correlation between aggregation index and concentration of the seeded individual COM crystals was tested by Pearson's correlation (SPSS Statistics, version 18.0). This analysis was used to determine the linear regression coefficient (r) for validation of the recommended aggregation index. P < 0.05 was considered as statistically significance.
Results and Discussion
We aimed to define appropriate aggregation indices to quantify the degree of COM crystal aggregation. Briefly, the aggregated crystals were produced by trembling individual crystals, which were seeded in the saturated aggregation buffer, at 150 rpm for 1 h at room temperature (set at 25°C) to allow crystal-crystal interactions that ultimately led to the formation of aggregation complex. Thereafter, the crystal aggregates were analyzed by microscopic examination, UV-visible spectrophotometry, and GraphPad Prism6 software.
Microscopic examination showed the increasing number and size of the crystal aggregates when the concentration of the seeded individual crystals was increased (Figure 1). These images were then analyzed by NIS Element D software and 5 aggregation indices were obtained from such measurements. Number of aggregates, aggregated diameter index, aggregated area index, aggregated mass index, and aggregated symmetry index were calculated using the formulas detailed in “Materials and Methods.” The data showed increasing of these indices when the concentration of the seeded individual crystals was increased (Figure 2).
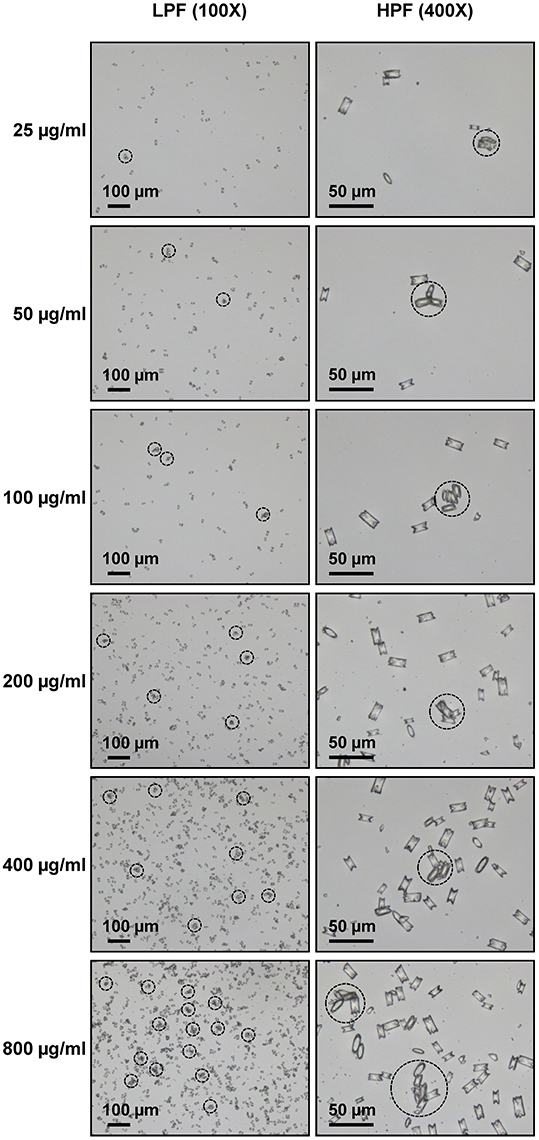
Figure 1. Morphology of COM crystal aggregates. Aggregated COM crystals were derived from various concentrations of the seeded individual COM crystals. Images were taken under Nikon Eclipse Ti-S inverted light microscope (Nikon; Tokyo, Japan) at low-power field (LPF) (100X) and high-power field (HPF) (400X). The dashed circle indicates the crystal aggregate, which was defined as an assembly of three or more individual crystals tightly joined together.
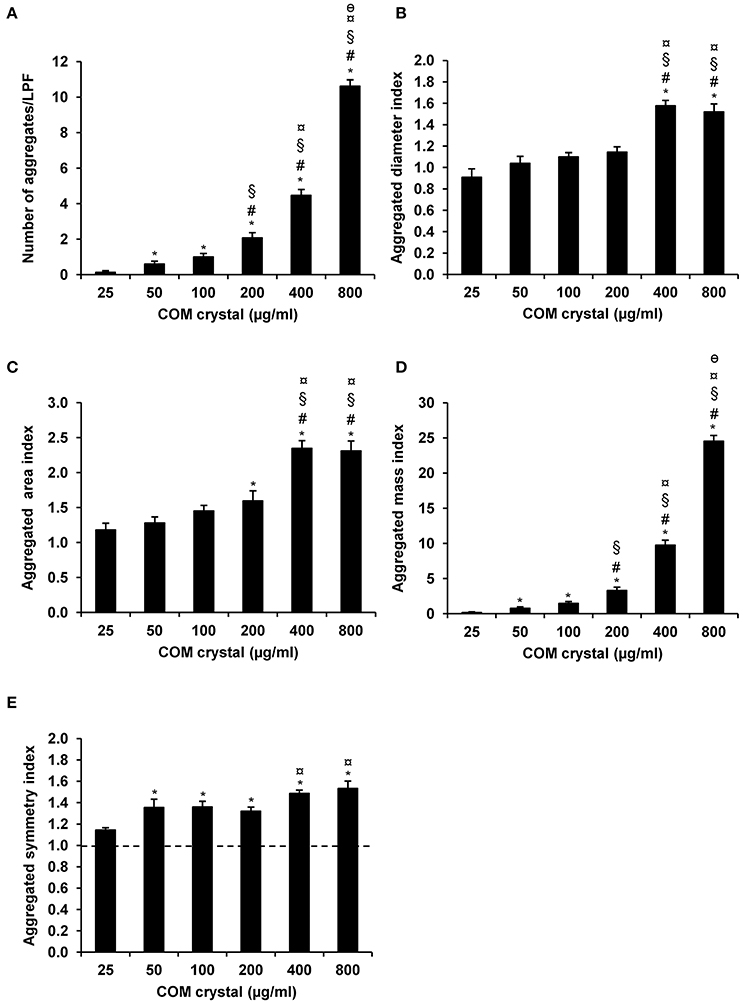
Figure 2. COM crystal aggregation indices derived from microscopic examination. Quantitative analysis following microscopic examination revealed five aggregation indices, including number of aggregates (A), aggregated diameter index (B), aggregated area index (C), aggregated mass index (D), and aggregated symmetry index (E). Each bar represents mean ± SEM of the data obtained from randomized 15 LPF/replicate and 3 independent experiments. *p < 0.05 vs. 25 μg/ml; #p < 0.05 vs. 50 μg/ml; §p < 0.05 vs. 100 μg/ml; ¤p < 0.05 vs. 200 μg/ml; and θp < 0.05 vs. 400 μg/ml.
From UV-visible spectrophotometric analysis, the absorbance (optical density; OD) of the aggregated crystal suspension was serially measured at λ620 nm every 10 s for a total of 300 s. The rationales of obtaining aggregation coefficient and defining the plateau time-point are illustrated in Figure 3A. The data showed that the optical density was inversely correlated with the concentration of the seeded individual crystals (Figure 3B). Our data were consistent with those reported in previous studies, which demonstrated that the higher degree of aggregation was correlated with the greater decline of the optical density in an inverse manner (Baumann et al., 2010). However, aggregation coefficient and number of the aggregates at plateau time-point were directly correlated with the concentration of the seeded individual crystals (Figures 3C,D, respectively).
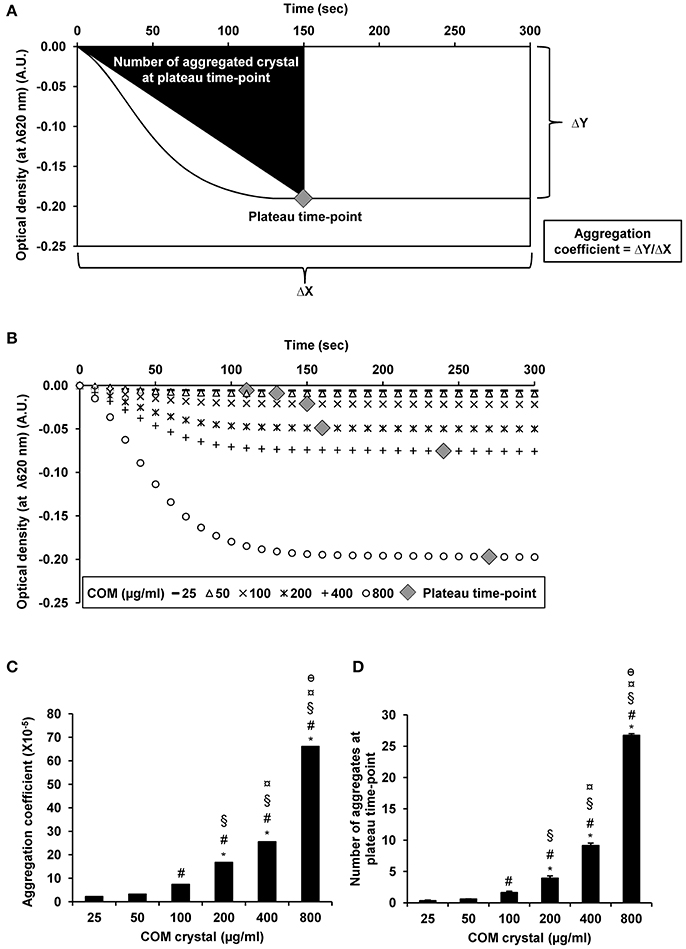
Figure 3. COM crystal aggregation indices derived from UV-visible spectrophotometry. Rationales of defining aggregation indices from UV-visible spectrophotometry are illustrated in (A). Quantitative analysis following UV-visible spectrophotometry revealed three additional aggregation indices, including optical density (B), aggregation coefficient (C), and number of aggregates at plateau time-point (D). Each bar represents mean ± SEM of the data obtained from 3 independent experiments. A.U., arbitrary unit. *p < 0.05 vs. 25 μg/ml; #p < 0.05 vs. 50 μg/ml; §p < 0.05 vs. 100 μg/ml; ¤p < 0.05 vs. 200 μg/ml; θp < 0.05 vs. 400 μg/ml.
Furthermore, OD values derived from all measurements by UV-visible spectrophotometry were also submitted to GraphPad Prism6 software for defining other aggregation indices, including rate constant, half-life, span, and time constant. The rationales of obtaining these indices are summarized in Figures 4A,B. All these additional aggregation indices demonstrated the tendency of dose-dependent increase of these indices along with the increasing dosage of the seeded individual crystals (Figures 4D–F), except only for the rate constant that did not show such trend (Figure 4C).
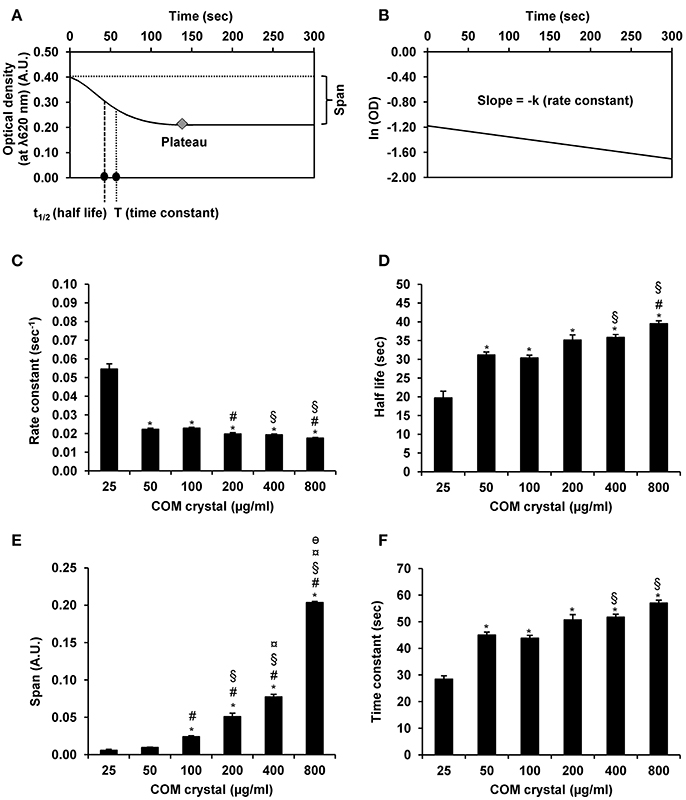
Figure 4. COM crystal aggregation indices derived from GraphPad Prism6 software. Rationales of defining aggregation indices from GraphPad Prism6 software are illustrated in (A,B). Quantitative analysis using GraphPad Prism6 software revealed four additional aggregation indices, including rate constant (C), half-life (D), span (E), and time constant (F). Each bar represents mean ± SEM of the data obtained from 3 independent experiments. A.U., arbitrary unit. *p < 0.05 vs. 25 μg/ml; #p < 0.05 vs. 50 μg/ml; §p < 0.05 vs. 100 μg/ml; ¤p < 0.05 vs. 200 μg/ml; θp < 0.05 vs. 400 μg/ml.
Finally, Pearson's correlation analysis was performed to validate the tendency of correlation observed from all measurements as detailed above. The data showed linear correlation of almost all of these indices (except only for rate constant) with crystal concentration (Figure 5 and Table 1). Among these, number of aggregates provided the greatest regression coefficient (r = 0.997; p < 0.001), whereas the equally second rank included aggregated mass index and optical density (r = 0.993; p < 0.001 and r = −0.993; p < 0.001, respectively) and the equally forth were aggregation coefficient and span (r = 0.991; p < 0.001 for both) (Figure 5 and Table 1).
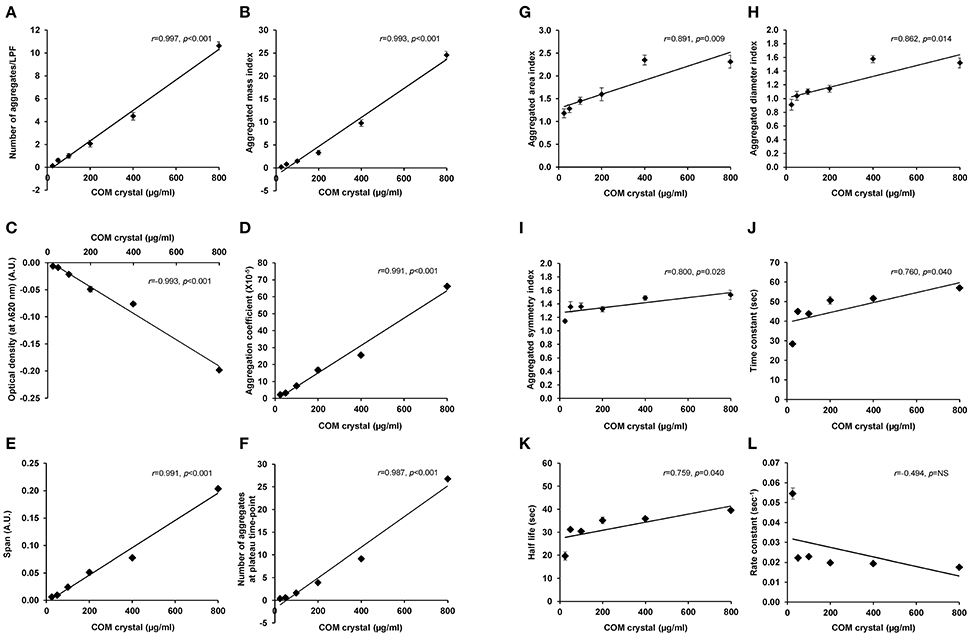
Figure 5. Pearson's correlation analysis of each aggregation index and concentration of the seeded individual COM crystals. Pearson's correlation analysis (SPSS Statistics, version 18.0) was performed to evaluate the linear correlation between concentration of the seeded individual COM crystals and number of aggregates (A), aggregated mass index (B), optical density (C), aggregation coefficient (D), span (E), number of aggregates at plateau-time point (F), aggregated area index (G), aggregated diameter index (H), aggregated symmetry index (I), time constant (J), half-life (K), and rate constant (L). Each data point represents mean ± SEM of the data obtained from 3 independent experiments. A.U., arbitrary unit; NS, not statistically significant.
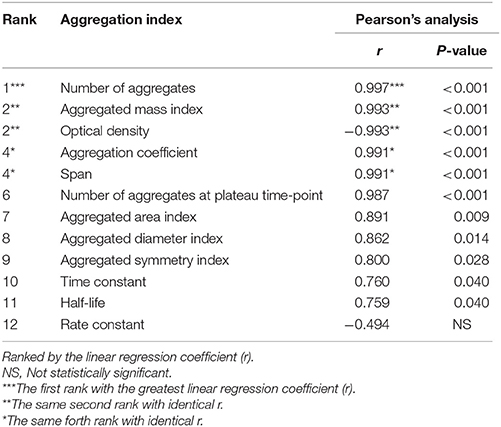
Table 1. Pearson's analysis of correlation between concentration of the seeded individual COM crystals and each aggregation index.
Herein, we have developed a simple method for quantitative analysis of COM crystal aggregation. The controllable and measurable seeded COM crystals were used as the starting materials for determining and measuring crystal aggregation. In contrast, the methods described in other previous studies mostly generated crystal aggregation directly from mixing CaCl2 with Na2C2O4 in a cuvette without determination of the saturation of such suspension prior to crystal aggregation assay (Kulaksizoglu et al., 2007). Having done as described in the previous studies, the degree and amount of crystal aggregates were hard to be controlled and measurement of crystal aggregation, thus, could be erroneous (Kulaksizoglu et al., 2007). Moreover, the crystal aggregation could be mixed up with (neo-) crystallization and nucleation. Using our method, in which the aggregation buffer was made to be saturated with calcium and oxalate ions before the seeded individual COM crystals were added, neocrystallization could be excluded and measurements of the amount and degree of crystal aggregates should be more precise. Also, our strategy of using this saturated aggregation buffer together with the fixed and controllable amount of the seeded COM crystals was that we did not want to have any effects from dissolution (such as when the crystals were seeded into other solutions, for example plain artificial urine or even deionized water, without saturation of calcium and oxalate ions) that can affect crystal sizes because sizes of COM crystals can affect crystal aggregation (Gan et al., 2016).
In addition, we intended to simulate the physiological condition of kidney stone formation in the urinary tract. Many lines of evidence have shown that patients with calcium oxalate kidney stones (stone formers) frequently have supersaturation of calcium and oxalate ions in their urine (Parks et al., 1997; Lingeman et al., 1999; Coe et al., 2001). Thus we attempted to mimic the in vivo model for studying kidney stone formation mechanisms. Moreover, various protocols of the saturated buffers have been used and reported for evaluation of COM crystal aggregation (Hess et al., 1989; Wesson et al., 2005; Viswanathan et al., 2011), similar to our saturated aggregation buffer to reduce the crystal dissolution.
Our method is also easier to perform, as it does not need to continuously stir the suspension inside a small cuvette by using magnetic mini-bar as in the case of the previous protocols (Kulaksizoglu et al., 2007). Continuous stirring may be associated with alterations in size of individual crystals and their aggregates. This can generate variations during analysis of the crystal aggregates, and thus making quantitative analysis of crystal aggregation easily erroneous in the past. Furthermore, we performed this assay by gentle trembling of the seeded crystals in the saturated aggregation buffer that can mimic the turbulent flow inside renal tubules and calyceal system of the kidney, whereas the protocols established previously might apply a more rigorous force that were not the normal physiologic condition to generate crystal aggregates.
Nevertheless, limitations of our approach should be also noted. Our measurements were done entirely “in vitro” that might not represent all the “in vivo” events of COM crystal aggregation and kidney stone formation. In the kidney, the co-occurrence of crystal aggregation and neocrystallization can be expected. In the present study, we attempted to precisely define the most appropriate index to measure degree of COM crystal aggregation without any effects from neocrystallization that might not be applicable to the in vivo phenomena. Moreover, although COM is the most common type of kidney stones, a mixture of crystal types in one stone former (patient) can be also expected. These confounding factors should be concerned when these assays and indices are to be applied for in vivo study.
In conclusion, we have defined simple and reproducible aggregated indices for in vitro quantitative analysis of COM crystal aggregation. Among all 12 indices calculated, number of aggregates, aggregated mass index, optical density, aggregation coefficient, and span are highly recommended for practical use in quantitative analysis of the crystal aggregation in kidney stone research.
Author Contributions
SC and VT designed research; SC performed experiments; SC and VT analyzed data; SC and VT wrote the manuscript; All authors reviewed the manuscript.
Conflict of Interest Statement
The authors declare that the research was conducted in the absence of any commercial or financial relationships that could be construed as a potential conflict of interest.
Acknowledgments
We are grateful to Kanda Ekcharoenkul for her technical assistance. This study was supported by Mahidol University research grant, Office of the Higher Education Commission and Mahidol University under the National Research Universities Initiative, and the Thailand Research Fund (RTA5680004, IRG5980006, and IRN60W0004). SC and VT are also supported by Faculty of Medicine Siriraj Hospital.
References
Baumann, J. M., Affolter, B., Brenneisen, J., and Siegrist, H. P. (1997). Measurement of metastability, growth and aggregation of calcium oxalate in native urine. A new approach for clinical and experimental stone research. Urol. Int. 59, 214–220. doi: 10.1159/000283066
Baumann, J. M., Affolter, B., and Casella, R. (2011). Aggregation of freshly precipitated calcium oxalate crystals in urine of calcium stone patients and controls. Urol. Res. 39, 421–427. doi: 10.1007/s00240-011-0382-x
Baumann, J. M., Affolter, B., and Meyer, R. (2010). Crystal sedimentation and stone formation. Urol. Res. 38, 21–27. doi: 10.1007/s00240-009-0239-8
Christmas, K. G., Gower, L. B., and Khan, S. R. (2002). Aggregation and dispersion characteristics of calcium oxalate monohydrate: effect of urinary species. J. Colloid. Interface Sci. 256, 168–174. doi: 10.1006/jcis.2002.8283
Chutipongtanate, S., Sutthimethakorn, S., Chiangjong, W., and Thongboonkerd, V. (2013). Bacteria can promote calcium oxalate crystal growth and aggregation. J. Biol. Inorg. Chem. 18, 299–308. doi: 10.1007/s00775-012-0974-0
Coe, F. L., Wise, H., Parks, J. H., and Asplin, J. R. (2001). Proportional reduction of urine supersaturation during nephrolithiasis treatment. J. Urol. 166, 1247–1251. doi: 10.1016/S0022-5347(05)65746-1
Gan, Q. Z., Sun, X. Y., Bhadja, P., Yao, X. Q., and Ouyang, J. M. (2016). Reinjury risk of nano-calcium oxalate monohydrate and calcium oxalate dihydrate crystals on injured renal epithelial cells: aggravation of crystal adhesion and aggregation. Int. J. Nanomed. 11, 2839–2854. doi: 10.2147/IJN.S104505
Hess, B., Jordi, S., Zipperle, L., Ettinger, E., and Giovanoli, R. (2000). Citrate determines calcium oxalate crystallization kinetics and crystal morphology-studies in the presence of Tamm-Horsfall protein of a healthy subject and a severely recurrent calcium stone former. Nephrol. Dial. Transplant. 15, 366–374. doi: 10.1093/ndt/15.3.366
Hess, B., Meinhardt, U., Zipperle, L., Giovanoli, R., and Jaeger, P. (1995). Simultaneous measurements of calcium oxalate crystal nucleation and aggregation: impact of various modifiers. Urol. Res. 23, 231–238. doi: 10.1007/BF00393304
Hess, B., Nakagawa, Y., and Coe, F. L. (1989). Inhibition of calcium oxalate monohydrate crystal aggregation by urine proteins. Am. J. Physiol. 257, F99–F106.
Kok, D. J., and Papapoulos, S. E. (1993). Physicochemical considerations in the development and prevention of calcium oxalate urolithiasis. Bone Miner. 20, 1–15. doi: 10.1016/S0169-6009(08)80033-5
Kulaksizoglu, S., Sofikerim, M., and Cevik, C. (2007). Impact of various modifiers on calcium oxalate crystallization. Int. J. Urol. 14, 214–218. doi: 10.1111/j.1442-2042.2007.01688.x
Lingeman, J., Kahnoski, R., Mardis, H., Goldfarb, D. S., Grasso, M., Lacy, S., et al. (1999). Divergence between stone composition and urine supersaturation: clinical and laboratory implications. J. Urol. 161, 1077–1081. doi: 10.1016/S0022-5347(01)61594-5
Parks, J. H., Coward, M., and Coe, F. L. (1997). Correspondence between stone composition and urine supersaturation in nephrolithiasis. Kidney Int. 51, 894–900. doi: 10.1038/ki.1997.126
Robertson, W. G. (2004). Kidney models of calcium oxalate stone formation. Nephron Physiol. 98, 21–30. doi: 10.1159/000080260
Robertson, W. G., and Peacock, M. (1972). Calcium oxalate crystalluria and inhibitors of crystallization in recurrent renal stone-formers. Clin. Sci. 43, 499–506. doi: 10.1042/cs0430499
Robertson, W. G., Peacock, M., and Nordin, B. E. (1969). Calcium crystalluria in recurrent renal-stone formers. Lancet 2, 21–24. doi: 10.1016/S0140-6736(69)92598-7
Thongboonkerd, V., Chutipongtanate, S., Semangoen, T., and Malasit, P. (2008). Urinary trefoil factor 1 is a novel potent inhibitor of calcium oxalate crystal growth and aggregation. J. Urol. 179, 1615–1619. doi: 10.1016/j.juro.2007.11.041
Thongboonkerd, V., Semangoen, T., and Chutipongtanate, S. (2006). Factors determining types and morphologies of calcium oxalate crystals: molar concentrations, buffering, pH, stirring and temperature. Clin. Chim. Acta 367, 120–131. doi: 10.1016/j.cca.2005.11.033
Viswanathan, P., Rimer, J. D., Kolbach, A. M., Ward, M. D., Kleinman, J. G., and Wesson, J. A. (2011). Calcium oxalate monohydrate aggregation induced by aggregation of desialylated Tamm-Horsfall protein. Urol. Res. 39, 269–282. doi: 10.1007/s00240-010-0353-7
Keywords: aggregation assay, aggregation index, CaOx, COM, kidney stone, nephrolithiasis
Citation: Chaiyarit S and Thongboonkerd V (2017) Defining and Systematic Analyses of Aggregation Indices to Evaluate Degree of Calcium Oxalate Crystal Aggregation. Front. Chem. 5:113. doi: 10.3389/fchem.2017.00113
Received: 25 August 2017; Accepted: 22 November 2017;
Published: 07 December 2017.
Edited by:
Zifeng Yan, China University of Petroleum (Huadong), ChinaReviewed by:
Guo-Hong Tao, Sichuan University, ChinaSidney J. L. Ribeiro, Universidade Estadual Paulista Júlio de Mesquita Filho (UNESP), Brazil
Copyright © 2017 Chaiyarit and Thongboonkerd. This is an open-access article distributed under the terms of the Creative Commons Attribution License (CC BY). The use, distribution or reproduction in other forums is permitted, provided the original author(s) or licensor are credited and that the original publication in this journal is cited, in accordance with accepted academic practice. No use, distribution or reproduction is permitted which does not comply with these terms.
*Correspondence: Visith Thongboonkerd, thongboonkerd@dr.com; vthongbo@yahoo.com