
94% of researchers rate our articles as excellent or good
Learn more about the work of our research integrity team to safeguard the quality of each article we publish.
Find out more
ORIGINAL RESEARCH article
Front. Chem. , 02 March 2018
Sec. Catalysis and Photocatalysis
Volume 6 - 2018 | https://doi.org/10.3389/fchem.2018.00044
 Kamila Kočí1*Ivana Troppová1Martin Reli1Lenka Matějová1Miroslava Edelmannová1Helena Drobná2Lada Dubnová2Anna Rokicińska3Piotr Kuśtrowski3Libor Čapek2
Neodymium enriched TiO2 anatase-brookite powders were prepared by unconventional method via using pressurized hot fluids for TiO2 crystallization and purification. The photocatalysts were tested in the CH3OH photocatalytic decomposition and they were characterized with respect to the textural (nitrogen adsorption), structural (XRD, XPS, and Raman spectroscopies), chemical (XRF), and optical (DR UV-Vis spectroscopy) and photoelectrochemical measurement. All prepared materials were nanocrystalline, had biphasic (anatase- brookite) structure and relatively large specific surface area (125 m2.g−1). The research work indicates that the doping of neodymium on TiO2 photocatalysts significantly enhances the efficiency of photocatalytic reaction. The photocatalytic activity increased with increasing portion of hydroxyl oxygen to the total amount of oxygen species. It was ascertained that the optimal amount of 1 wt% Nd in TiO2 accomplished the increasing of hydrogen production by 70% in comparison with pure TiO2. The neodymium doped on the titanium dioxide act as sites with accumulation of electrons. The higher efficiency of photocatalytic process was achieved due to improved electron-hole separation on the modified TiO2 photocatalysts. This result was confirmed by electrochemical measurements, the most active photocatalysts proved the highest photocurrent responses.
Nowadays, a clean energy production from renewable sources is one of the most discussion topics. An excellent alternative to H2 production is the use of heterogeneous photocatalytic process. Since the pioneering work of Fujishima and Honda (1972) many research teams have focused to water splitting on semiconductor photocatalysts.
Due to the fact, that water splitting is difficult the reaction is often realized in the presence sacrificial reagent such as methanol. The addition of organic compounds such as alcohols to the water solution showed to be prosperous to overpass such limitations (Dozzi et al., 2017). In the presence of methanol (an electron donor), photogenerated the holes which are generated in the valence band can oxidize methanol in place of water. For this reason the reduction of water is decreasing by conduction band electrons. But it is necessary to the bottom of the conduction band to be situated above the water reduction potential (Maeda, 2011).
Amongst the possible photocatalysts for this application, titanium dioxide still remains the most investigated material, mainly because of its remarkable physical and chemical properties such as strong resistance to chemical and photocorrosion, low cost, and significantly low energy consumption (Ma et al., 2014; Schneider et al., 2014; Bai et al., 2015, 2016). However, the TiO2 application is limited due to its relatively high energy bandgap (3.2 eV) which required UV radiation and making it poor in the processes associated with solar photocatalytic applications (Xu and Song, 2016).
Rare earth elements doped or deposited on TiO2 are expected to show various effects on the TiO2 photocatalytic activity. The advantages of doping TiO2 with lanthanides can be namely (i) better TiO2 thermal stability, (ii) inhibition of TiO2 crystallite growth, (iii) limitation of the defect amount, and (iv) improvement of the photocatalytic activity (Meksi et al., 2016).
In the present article, the photocatalytic decomposition of methanol is studied in the presence of Nd/TiO2 anatase-brookite for the first time. These photocatalysts were prepared unconventionally via using flow processing by pressurized hot fluids for TiO2 crystallization and purification. This processing differs from the hydrothermal and solvothermal syntheses. While hydrothermal and solvothermal syntheses being carried out in a closed batch system, which is heated and pressurized, with liquid (aqueous or alcoholic) precursor solution inside, i.e., the precipitation and crystallization of nanostructured material occur simultaneously in one system which is heated and pressurized, the processing by pressurized hot fluids in our study is performed in a flow regime. The flow processing by pressurized hot fluids is performed and understood as a “post-treatment” of the gel precursors from sol-gel synthesis. This processing may be applied as a post-treatment of sol-gel derived precursors (formed gels) or precipitated amorphous solids as an alternative to standard calcination (thermal treatment). The flow arrangement of the pressurized hot fluid processing/crystallization offers following advantages: (i) faster heating, (ii) change of the chemical composition of the fluid/medium (e.g., to water, to water/methanol mixture, water/ethanol mixture) during the processing can affect the solubility of used organic precursors for-sol gel synthesis and, thus the purity and further crystallization of sol-gel derived nanomaterials. This processing results in nanocrystalline TiO2 of anatase-brookite crystal structure showing higher surface area then calcined analog of anatase crystal structure (Kocí et al., 2017). The aim of this study is to investigate the influence of the Nd dopant in TiO2 anatase-brookite on the H2 yields in photocatalytic decomposition of methanol.
Nd/TiO2 with various low neodymium (Nd) loadings (0.2–1.5 wt.%) and parent TiO2 were prepared by using a sol-gel process and a processing by pressurized hot fluids.
Chemicals for sol-gel synthesis: cyclohexane (HPLC grade), absolute ethanol (water content max. 0.2 vol.%), non-ionic surfactant Triton X 114 [(1,1,3,3-tetramethylbutyl)phenyl-polyethylene glycol, C29H52O8.5, Aldrich], titanium (IV) isopropoxide (99.999%, Aldrich), lanthanum(III) nitrate hexahydrate (Aldrich), neodymium(III) nitrate hexahydrate (Aldrich), and distilled water.
Neodymium doped TiO2 gels were synthesized via the sol-gel process controlled in the reverse micelles of non-ionic surfactant Triton X-114 in cyclohexane. Neodymium doped titania sols, resulting in gels after a gelation period, were prepared as follows: In the first step, the neodymium(III)-containing sol was prepared. The appropriate amount of neodymium(III) nitrate hexahydrate was dissolved in absolute ethanol (3 mL) under intense stirring. In the second step, cyclohexane was mixed with Triton X-114 and distilled water followed by the addition of neodymium(III)-containing sol. The sol was stirred for 20 min. In the final step, titanium (IV) isopropoxide was injected into the mixture. This neodymium doped titania micellar sol was stirred for next 20 min. Then the homogeneous yellow transparent sol was poured into Petri's dishes in a thin layer (~4 mm) and the dishes were left standing on air for gelation for 48 h. In general, the neodymium doped titania sols were prepared keeping the molar ratio of cyclohexane: Triton X-114: H2O: Ti(OCH(CH3)2)4+ Nd(NO3)3·6H2O at 11: 1: 1: 1 (Reli et al., 2015; Kocí et al., 2017). After the gelation period, the gels were ground to small pieces (~2 × 2 mm) and were processed by pressurized hot fluids.
Parent TiO2 was prepared by the same sol-gel process as mentioned above, but the preparation was simpler. In the first step, an appropriate amount of cyclohexane was mixed with Triton X-114 and distilled water and this sol was mixed for 20 min. After that titanium (IV) isopropoxide was injected into the mixture and titania micellar sol was stirred for next 20 min. The homogeneous transparent sol was poured into Petri's dishes in a thin layer (~4 mm) and the dishes were left standing on air for gelation for 48 h. In general, titania sol was prepared keeping the molar ratio of cyclohexane: Triton X-114: H2O: Ti(OCH(CH3)2)4 at 11: 1: 1: 1 (Matějová et al., 2010, 2012). After the gelation period, the gels were ground to small pieces (~2 × 2 mm) and were processed by pressurized hot fluids.
Chemicals for processing: deionized water (electrical conductivity ~0.06–0.08 μS/cm) and methanol (HPLC grade).
The reasons of using both solvents (water and methanol) for gel processing were following: (i) water causes the crystallization of titania and dissolves a part of organic precursors, (ii) methanol dissolves the part of organic precursors being dissoluble in water. In final, excellently pure photocatalysts are prepared (Matějová et al., 2012).
Processing by pressurized hot water followed by processing by pressurized hot methanol was carried out in a laboratory-made unit equipped with a HPLC BETA10 Plus gradient pump (Ecom s.r.o., Czech Republic), a chromatographic oven operating in the temperature range of 25–400°C, capillary cooling and a restrictor operating at ambient temperature. A detailed description of the experimental setup is shown in Matejova et al. (2015) and Troppová et al. (2017). The gels, placed in 24-mL high-temperature stainless-steel cells, were processed in a flow regime at pressure 10 MPa and temperature 225°C, using the sequence of solvents 1.5 L deionized water −0.25 L methanol −0.1 L deionized water. The flow rates of solvents during the processing were kept at 3.8–4.2 mL/min. Produced powder photocatalysts were sieved to particle-size fraction <0.160 mm. This particle-size fraction was used for the characterizations as well as the photocatalytic tests.
Concentration (w/w) of Nd at TiO2 samples was analyzed with using Elva X energy-dispersive X-ray fluorescence spectrometer (Elvatech Ltd., Kiev, Ukraine) equipped with a Pd X-ray tube and thermoelectrically cooled Si-pin detector PF 550 (MOXTEC, USA). Power supply of X-ray tube was operated at 12 kV and 10 μA. The spectra at wavelength region of 0–10 keV were integrated for 120 s and Nd Lα line (5.2 KeV) was used as the analytical line. The sample chamber was flushed with He to suppress Ar interference. Powder samples were simply poured into plastic micro-vial covered by Mylar film. Every sample was analyzed at three replicates.
Nitrogen physisorption at 77 K was performed on a 3Flex automated volumetric apparatus (Micromeritics Instruments, USA) after degassing of materials at 150°C for more than 24 h under vacuum below 1 Torr. Degassing was applied to remove physisorbed water, but having no influence on the porous morphology of the developed materials. The specific surface area, SBET, was calculated according to the classical Brunauer–Emmett–Teller (BET) theory for the p/p0 range of 0.05–0.30 (Gregg and Sing, 1982). As the specific surface area, SBET, is not a proper parameter in the case of mesoporous solids containing micropores (Schneider, 1995), the mesopore surface area, Smeso, and the micropore volume, Vmicro, were also evaluated based on the t-plot method (de Boer et al., 1966). The net pore volume, Vnet, was determined from the nitrogen adsorption isotherm at maximum p/p0 (~0.99). The pore-size distribution was evaluated from the adsorption branch of the nitrogen adsorption-desorption isotherm by the Barrett–Joyner–Halenda (BJH) method (Barrett et al., 1951) using the de Boer standard isotherm and assuming cylindrical pore geometry.
X-ray powder diffraction (XRD) patterns were obtained using a Rigaku SmartLab diffractometer (Rigaku, Japan) with detector D/teX Ultra 250. The source of X-ray irradiation was Co tube (CoKα, λ1 = 0.178892 nm, λ2 = 0.179278 nm) operated at 40 kV and 40 mA. Incident and diffracted beam optics were equipped with 5° Soller slits; incident slits were set up to irradiate area of the sample 10 × 10 mm (automatic divergence slits) constantly. Slits on the diffracted beam were set up to fixed value 8 and 14 mm. The powder materials were measured in the reflection mode (Bragg-Brentano geometry). The samples rotated (30 rpm) during the measurement to eliminate preferred orientation effect. The XRD patterns were collected in a 2θ range 5–90° with a step size of 0.01° and speed 0.5 deg.min−1. Measured XRD patterns were evaluated using PDXL 2 software (version 2.4.2.0) and compared with database PDF-2, release 2015. XRD patterns were analyzed using LeBail method (software PDXL2) to refine the lattice parameters of anatase. Background of the patterns was determined using the B-Spline function, peak shapes were modeled with a pseudo-Voigt function accounting for a peak asymmetry due to axial divergence. Crystallite size was calculated using Halder-Wagner method (software PDXL 2). Plotting β2/tan2θ against β/tan θ · sin θ based on the results makes it possible to obtain crystallite size from the gradient of the approximation line, where β is integral width of the sample diffraction peak and θ is diffraction peak position. Crystallite size of the anatase phase was calculated using reflections (101), (200), (105), (211), (116), and (220).
DRS spectra of the Nd/TiO2 materials were measured in quartz cuvettes by using a GBS CINTRA 303 spectrometer (GBC Scientific Equipment, Australia) equipped with integrating sphere. The spectra of catalysts were scanned in the wavelength range 190–900 nm, scan speed 100 nm.min−1, step size 1 nm and slit width of 2 nm. Reflectance was recalculated into the dependence of Kubelka–Munk function (Reli et al., 2015) based on the equation F(R∞) = (1-R∞)2/(2·R∞), where R∞ is the diffuse reflectance from a semi-infinite layer. This equation were transformed to the dependency (F(R∞)·h·ν)1/2 described as (α·h·ν)1/2 against photon energy for determination of band gap energy of indirect semiconductor.
Raman spectroscopy was measured using a Nicolet DXR SmartRaman spectrometer (Thermo Fisher Scientific, USA) equipped with 780 nm NIR excitation laser. The laser power on the sample was 1 mW, spectra were recorded by collecting of 200 scans and the spectrograph aperture was a 50 μm slit. Raman spectra were recorded in the 55–3,500 cm−1 wavenumber range.
XPS spectra were collected on a Prevac photoelectron spectrometer using Al Kα (E = 1486.6 eV) as a X-ray radiation source at a constant pass energy of 100 eV for survey and high resolution modes. A low energy electron flood gun (FS40A-PS) was used to compensate a surface charge. Powdered samples mounted on a sample holder were introduced by a load lock into an analytical chamber with a base pressure of 5 × 10⁻⁹ mbar. Binding energies of Ti 2p, O 1s, Nd 3d, Nd 4d, and C 1s photoelectron peaks were referenced to the C 1s core level (Eb = 285.0 eV). The fitting of high resolution spectra was provided through the Casa XPS software.
Photoelectrochemical measurements were conducted using classical three electrode system (Instytut Fotonowy, Poland), where Pt wire and saturated Ag/AgCl were used as counter and reference electrodes, respectively. The working electrode was prepared according to the following procedure: Small amount of photocatalyst was placed into a mortar and ground to a fine powder. Afterwards, two drops of demineralized water were added and suspension was created. Finally, the suspension was deposited on the conductive side of the ITO foil using the pestle. The suspension was deposited in a way it created uniform layer. The ITO foil with the suspension was into a hot air stream (hair drier) until the suspension dried out. The active area of electrode was 41 mm2. The 0.1M KNO3 solution was used as an electrolyte. Photoelectric spectrometer was coupled with potentiostat and the 150 W Xe lamp was used as irradiation source. In order to obtain better resolution around 300 nm grating was used. Photocurrent responses were measured in the wavelength range of 240–500 nm (10 nm step) and the potential range of −0.2 to 1.0 V (0.1 V step). The free oxygen environment was reached by purging the electrolyte in measuring cell by argon for 15 min before the measurement itself and during the whole measurement as well. Photoelectrochemical measurements were conducted in order to compare the amount of generated charge carriers for each photocatalyst.
The photocatalytic decomposition of methanol was performed in a homemade stirred batch photoreactor illuminated by UV 8 W Hg lamp (365 nm) under ambient temperature and pressure. The photocatalysts powder (concentration 1g.L−1) was suspended in methanol solution. Firstly, argon was purged through the suspension with a constant flow to remove air and then the reactor was sealed. The reaction products were analyzed by GC/BID. The photocatalytic reaction was done in time intervals of 0–4 h. The details of the photocatalytic decomposition of methanol were depicted in our previous publication (Kocí et al., 2017).
Measured nitrogen physisorption isotherms, evaluated pore-size distributions and determined textural properties of investigated photocatalysts including parent TiO2 are shown in Figures 1A,B and Table 1. It is evidenced (Figures 1A,B) that all the photocatalysts are mesoporous solids with negligible comparable amount of micropores (~31 .g−1). Nd doped TiO2-based photocatalysts show also similar volume and size-distribution of pores (Figures 1A,B and Table 1).
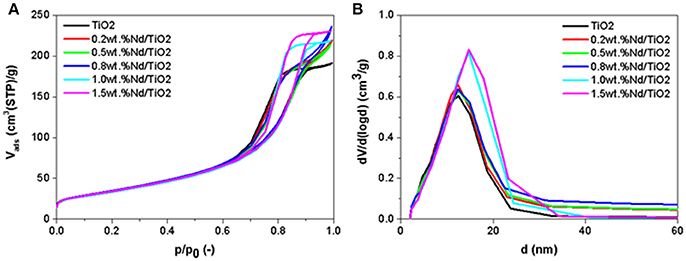
Figure 1. (A) Measured nitrogen adsorption-desorption isotherms and (B) evaluated pore-size distributions of investigated photocatalysts.
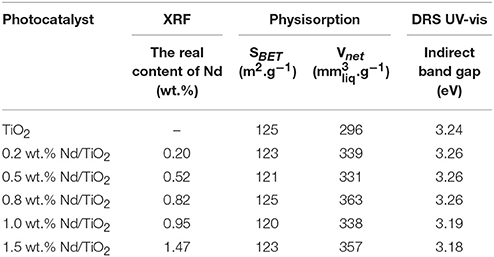
Table 1. Chemical composition, textural, and optical properties of investigated photocatalysts.
XRD patterns of pure TiO2 and Nd3+ ions doped TiO2 are shown in Figure 2. Presented diffraction lines correspond to the tetragonal TiO2 anatase (PDF-2 card No. 00-021-1272) and to the orthorhombic TiO2 brookite (PDF-2 card No. 01-071-4943). Brookite was detected in parent TiO2 as well as in all Nd/TiO2, thus the presence of brookite arises from the preparation process, namely the pressurized hot fluids processing, and it is not affected by Nd3+ ions doping. All the investigated photocatalysts are of anatase-brookite crystal structure. The effect of the preparation process on the crystallization of TiO2 was also observed in Gotić et al. (1996) and Musić et al. (1997). Any additional polymorphic forms of TiO2 (e.g., rutile) or Nd related phases (e.g., Nd2O3, Nd titanates) were not detected. Refined TiO2 anatase crystallite size, anatase lattice parameters, and cell volumes are summarized in Table 2. It is evident that the anatase lattice parameters and cell volume did not change with Nd addition. The anatase crystallites changed in the range of 8.5–10.2 nm. In the case of Nd3+ doped TiO2 photocatalysts, Nd3+ ions could go to the interstitial positions as a consequence of ionic radii; Nd3+ is 1.123 Å large and Ti4+ is about 0.745 Å. From this reason any substitution of Nd3+ ion for Ti4+ ion in the TiO2 lattice would introduce a distortion (Jalajakumari et al., 1999).
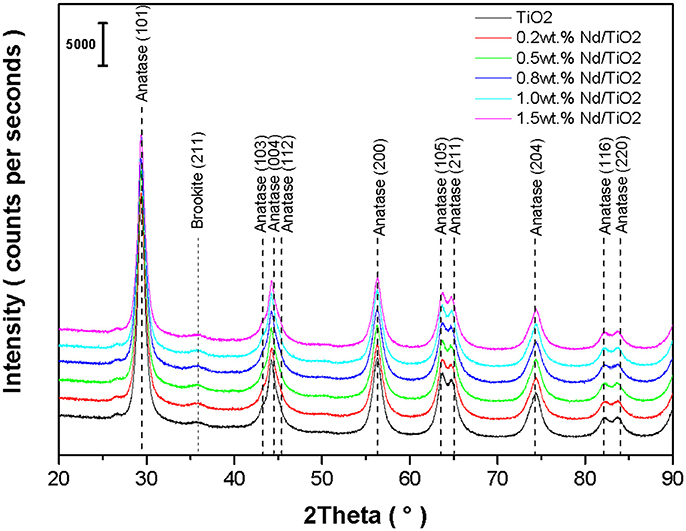
Figure 2. XRD patterns of investigated Nd/TiO2 photocatalysts and parent TiO2.
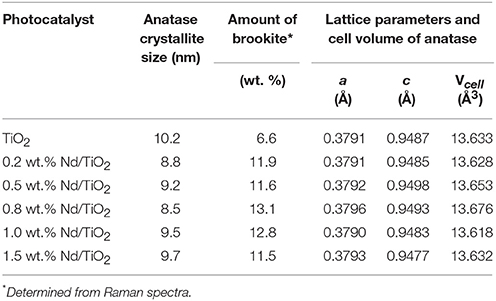
Table 2. Structural and microstructural properties of investigated photocatalysts.
Phase composition of Nd/TiO2 photocatalysts was determined by Raman spectroscopy (Figure 3). The Raman spectra of pure anatase and brookite forms of TiO2 are shown at inlet graph of Figure 3. Anatase form of TiO2 exhibits the bands at 143, 195, 396, 516, and 640 cm−1. In contrast to anatase form of TiO2, Raman spectrum of brookite phase of TiO2 contains more than 15 bands in the range from 50 to 700 cm−1. The phase composition was determined from the most intensive independent bands at 245 cm−1 for brookite phase and at 516 cm−1 for anatase phase. The ratios of these two bands indicate the brookite weight content (Table 2). While the lowest brookite phase content exhibits pure TiO2, the highest one contains Nd/TiO2 photocatalyst with 0.8 wt.% of Nd.
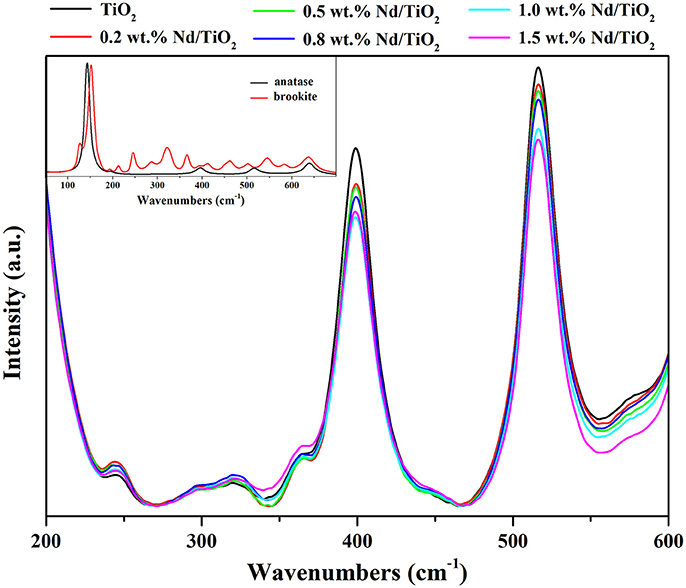
Figure 3. Raman spectra of Nd/TiO2 photocatalysts (main graph) and of pure TiO2 anatase and brookite phases (inlet graph).
Figure 4 shows diffuse reflectance spectra that were recalculated to the dependencies (α·h·ν)1/2 against energy in order to obtain the values of the indirect band gap energies that value was approximately the same for all studied Nd/TiO2 materials (Table 1).
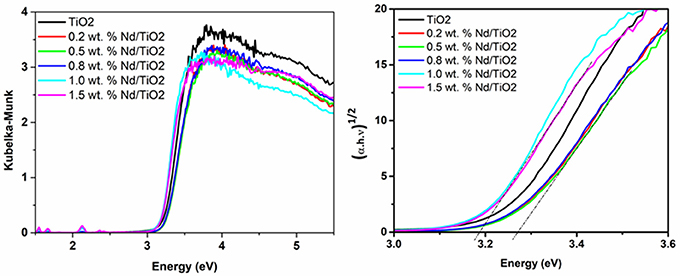
Figure 4. UV-vis DRS spectra of pure TiO2 and Nd/TiO2 photocatalyst.
Four various elements were identified on the photocatalyst surface in the survey XPS spectra—Ti, O, Nd, and contaminating C. Unfortunately, the determination of neodymium content was practically impossible due to overlapping of Nd 3d peaks with O KLL Auger lines and very low intensity of Nd 4d peaks. The surface concentration of the other main components is demonstrated in Table 3. The Nd-free TiO2 shows two photoelectron peaks at 458.1 and 463.8 eV, which correspond to Ti 2p3/2 and Ti 2p1/2 levels and confirm the existence Ti4+ exclusively (Reli et al., 2017). A shift of these peaks to higher binding energies (about 0.2–0.3 eV) is observed after the modification of TiO2 with Nd. This finding confirms the strong interaction of introduced Nd ions with the titania structure. In the O 1s spectra, two forms of surface oxygen can be distinguished. The peak at 529.3–529.7 eV is related to the photoemission from lattice O2−, whereas another peak at 530.6–531.4 eV corresponds to the presence of hydroxyls (Reli et al., 2016). Changes in the distribution of both oxygen components are found after the doping of TiO2 with Nd. After the introduction of the lowest amount of Nd—only 7.3% of surface O forms hydroxyls. For the photocatalysts with higher Nd loadings the contribution of OH− becomes much more akin to that of undoped TiO2. Furthermore, the valence band maximum (VBM) energy levels were analyzed based on the collected XPS spectra. The VBM values were calculated as the distance between 0 eV (the Fermi energy level) and the X intercept obtained by extrapolation of the descending part of the signal, as shown in Figure 5. The bare TiO2 exhibits the VBM of 1.71 eV, whereas this material modified with 1 wt.% of Nd −2.16 eV. So clear shift in the VBM values can be explained by various phase compositions of both samples. As is presented in Table 2, the content of brookite increases from 6.6 (pure titania) to 12.8 wt.% (titania containing Nd). The previous studies for different TiO2 polymorphs revealed that brookite has a conduction band minima higher in energy than anatase or rutile (Buckeridge et al., 2015).
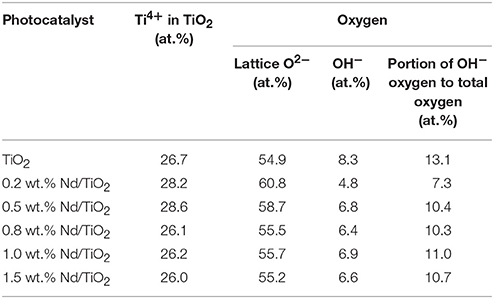
Table 3. Surface composition of Nd-doped TiO2 photocatalysts determined by XPS.

Figure 5. XPS valence-band spectra of bare TiO2 and 1.0 wt.% Nd/TiO2.
The photoelectrochemical properties of the photocatalyst are essential in the photocatalysis. The photocurrent measurements are useful to predict the photocatalytic activity of the photocatalyst or to discuss if the photocatalyst is capable of generation of electron-hole pairs under specific wavelength irradiation. The dependence of the generated current on wavelength in the presence of each tested photocatalyst is shown in Figure 6. The depicted current dependencies were measured in the presence of maximum applied potential of 1,000 mV. The potential was applied in order to separate the generated electrons and holes. The measurements confirmed that each of the prepared photocatalysts is generating rapid increase of current under irradiation in the range of wavelength of 320–380 nm. Unfortunately, the current response under 320 nm is not observed due to technical limitations of the device.
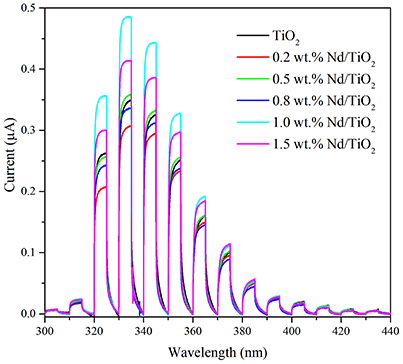
Figure 6. Current generation in the presence of Nd/TiO2 and parent TiO2 photocatalysts at 1 V vs. Ag/AgCl.
The photocatalytic evolution of hydrogen during UVA illumination of the pure TiO2, and Nd/TiO2 photocatalysts in methanol decomposition is shown in Figure 7. All studied photocatalysts possessed significantly higher amount of the formed H2 in comparison with photolysis. All doped photocatalysts shown higher production of hydrogen than pure TiO2 with exception of 0.2 wt.% Nd. The Nd photocatalysts performance is decreasing in ranking: 1 wt.% Nd/TiO2 > 1.5 wt.% Nd/TiO2 > 0.5 wt.% Nd/TiO2 > 0.8 wt.% Nd/TiO2 > TiO2 > 0.2 wt.% Nd/TiO2. These trends indicate the existence of optimum Nd loading in TiO2 anatase-brookite photocatalyst working under UVA light. The 1 wt.% Nd/TiO2 had 70% higher activity as compared to undoped one.
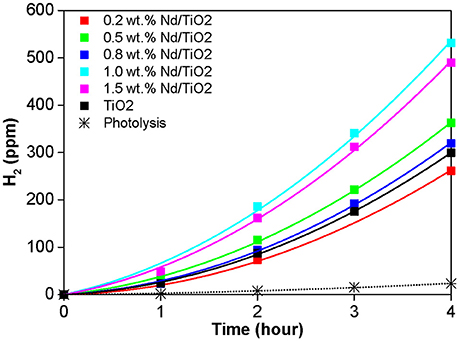
Figure 7. Generation of hydrogen in the photocatalytic oxidation of methanol in the presence of Nd/TiO2 and parent TiO2 photocatalysts.
The Nd/TiO2 photocatalyst absorbed photons from UVA irradiation and generated electron-hole pairs. However, the recombination of h+/e− is one the most substantial elements, which can decrease the photoactivity (Du et al., 2013). The higher photocatalytic activity of Nd/TiO2, can be because of a combination of the following factors: (i) the trapping of electrons and holes to lead decreasing recombination of h+/e− pairs during photocatalytic reaction, (ii) portion of lattice and surface O species to total oxygen, and (iii) the optimal crystallite size.
Figure 7 shows the correlation between the photocurrent response and the amount of formed hydrogen. This result confirms the ability of the Nd species in separation of photogenerated electron–hole pairs (Nie et al., 2013; Siah et al., 2017). The 1.0 wt.% Nd/TiO2 photocatalyst had both the highest current response and the photocatalytic activity as well (Figure 8). This is clearly pointing toward the optimal neodymium loading, which is around 1 wt.%. Altogether, the trend of current responses of Nd/TiO2 photocatalysts matches their photocatalytic activity trend (Figure 8 inset). This result is suggesting there is a better separation of charge carriers. Low current means lower amount of charge carriers generated after irradiation but moderate photocatalytic activity is pointing toward their better utilization.
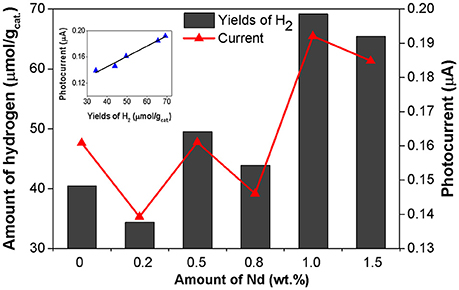
Figure 8. Correlation between the photocatalytic activity in the CH3OH photocatalytic decomposition in the presence of Nd/TiO2 photocatalysts and current generation. Current responses were obtained at 360 nm under external potential of 1.0 V.
It is evident from nitrogen physisorption, XRD and DR UV-Vis results that the Nd dopation did not cause any significant differences in the surface area and band gap energy of Nd/TiO2 photocatalysts. Contrary to that some differences in the surface properties were recognized, namely in the surface hydroxylation of photocatalysts. Nd/TiO2 photocatalysts differ in the proportional representation of lattice oxygen and oxygen comprised in surface OH− (hydroxyl) groups. The hydrogen yields increased with the increasing amount of hydroxyls species obtained from XPS (Figure 9A). The highest yield of hydrogen was achieved for 1 wt.% Nd/TiO2 photocatalyst with the highest portion of hydroxyl O species to the total amount of oxygen (11%). The hydroxyl free radicals can be formed by reaction of the photogenerated holes with surface hydroxyl groups. Hydroxyl free radicals are a strong oxidizing agent and significantly support the separation of the h+/e− pairs (Lu et al., 2011). Similarly, they can serve as adsorption sites for methanol or water. Therefore, the accrual of surface hydroxyl groups can make easier to the improvement of photoactivity.
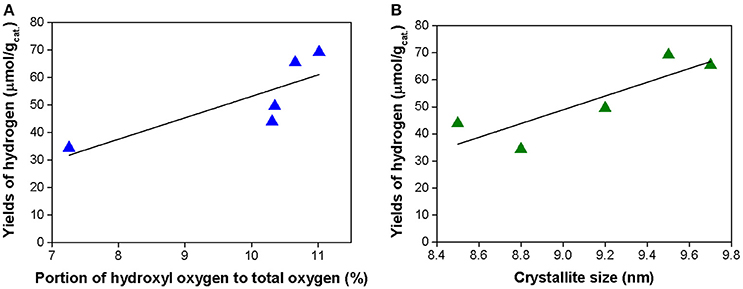
Figure 9. Correlation between the yield of hydrogen in the CH3OH photocatalytic oxidation and content of lattice oxygen to sum of oxygen (A) and crystallite size (B).
Finally, the crystallite size of anatase is also one of the parameter in the photocatalytic reaction. The very small particles exhibit less photocatalytic activity. Correlation of crystallite size and photoactivity of investigated Nd/TiO2 is shown in Figure 9B. This phenomenon can be caused by two factors: (i) reduction of the crystallite size increased recombination centers and consequently it led to decreased activity (Grela and Colussi, 1996; Zhang et al., 1998; Lin et al., 2006; Kočí et al., 2009) and (ii) due to the flocculation of very small particles, the number of active sites can reduce (Maira et al., 2000; Lin et al., 2006). The 0.2 wt.% Nd/TiO2 and 0.8 wt.% Nd/TiO2 proved the smallest particle size (8.8 and 8.5 nm, respectively) and the smallest photoactivity, simultaneously. Beside the crystallite size also the portion of hydroxyl oxygen to total oxygen influence the final photocatalytic activity of the photocatalyst. These two factors are the reason why 0.2 wt.% Nd/TiO2 showed lower photocatalytic activity than pure TiO2. The 0.2 wt.% Nd/TiO2 has not only small crystallite size but also the lowest portion of hydroxyl oxygen to total oxygen.
It was found that an appropriate neodymium amount had a beneficial effect on the efficiency of methanol decomposition. In case of 1 wt.% Nd/TiO2 the decomposition of methanol was the most dynamic and this photocatalyst had the highest photocatalytic activity. Slightly worse results were obtained for the 1.5 wt.% Nd/TiO2. This means that there is an optimum neodymium amount. Khalid et al. (2013) studied methyl orange degradation in the presence Nd/TiO2 photocatalysts. In their studies, 1 at. % of Nd was an optimum value for the photocatalysis, and the efficiency of methyl orange decomposition was 20% better than for pure titania. Bokare et al. (2013) also got at the similar result. He dealt with the investigation of antibacterial activities Nd doped TiO2 photocatalyst. In the case of their TiO2:Nd nanopowders, the optimal value of Nd was 1 at. %, which resulted in 30% higher activity in comparison with undoped one. Wojcieszak et al. (2014) reporter for methyl orange degradation the optimal amount of Nd doped to be 3 at. %. The same optimal amount of Nd was found also by Rengaraj et al. (2007) during photoreduction of Cr(VI).
It also should be mentioned that previously we focused on lanthanoids doped TiO2 photocatalysts (La/TiO2) prepared by sol-gel method followed by the calcination of material at 500°C. In that case, La/TiO2 with 0.2 wt. % La showed higher amount of hydrogen formed in the methanol decomposition than La/TiO2 with 1.0 wt. % La (Kocí et al., 2017), but it should be stressed that the amount of formed hydrogen is almost 5 times higher for Nd/TiO2 photocatalysts prepared by unconventional method via using pressurized hot fluids for TiO2 crystallization and purification (Figure 7) in contrast to La/TiO2 photocatalysts prepared by sol-gel method followed by the calcination of material at 500°C (Kocí et al., 2017). However, while La/TiO2 photocatalysts prepared by sol-gel method followed by the calcination represented pure anatase form, Nd/TiO2 photocatalysts prepared by unconventional method via using pressurized hot fluids for TiO2 crystallization and purification represent anatase-brookite phase. It could be suggested that the biphasic photocatalysts show higher activity then monophasic photocatalysts. Biphasic photocatalysts allowed more effective separation of generated electron-hole pair thereby increased efficiency of photocatalytic reaction. These interesting results prove that unconventionally prepared Nd/TiO2 anatase-brookite based photocatalysts could greatly enhance the methanol photocatalytic decomposition, enhancing hydrogen production.
The betterment of the photocatalytic activity of TiO2 for the methanol decomposition due to the dopation of Nd can be explained by the following mechanisms: Nd on titanium dioxide behave as electron traps, increasing the e−/h+ separation and the ensuing transmittal of the trapped e− to the adsorbed H+ which serves as an electron acceptor. This can be described by the following mechanism. The photocatalyst absorbed photons from UVA irradiation and generated of electrons and holes (Equation 1). The presence of Nd can easy the e−/h+ separation process by attracting e− (Equation 2; Rengaraj et al., 2007). This reaction allows the holes h+ to react with the adsorbed CH3OH and H2O to form H+ (Equations 3 and 4). In the same way, the e− can react with H+ to H2 (Equation 5). The presence of Nd on the titanium dioxide favors the transfer of photogenerated e− to Nd, so improving the separation of charge carriers. Thereafter, the e− migrate from Nd to the H+ ion and formed H2 molecules.
The photocatalytic properties of the investigated Nd/TiO2 photocatalysts were evaluated by photocatalytic decomposition of CH3OH. The all as-prepared materials had anatase- brookite nanocrystalline structure. The specific surface area was relatively large (125 m2.g−1) and it was independent on the amount of Nd. On the other hand, Nd doping caused differences in surface properties namely in the surface hydroxylation of photocatalysts. Thanks to neodymium doping, the efficiency of photocatalytic decomposition of methanol was substantially increased in comparison with undoped TiO2 with exception of Nd/TiO2 with 0.2 wt.% Nd. The optimum amount of neodymium was established as 1 wt. % Nd. This photocatalyst had the highest portion of hydroxyl O species to the total amount of oxygen, which can facilitate to the improvement of photoactivity. The neodymium which was doped on the TiO2, act as sites with accumulation of electrons. The better separation of charge carriers on the modified TiO2 permits direction of the electrons and holes into the desirable oxidation and reduction reactions that is more efficient than the recombination reactions. This conclusion was also confirmed by electrochemical measurements.
KK and LČ: Analysis of the correlation between the structural, textural, optical, electrochemical properties and the photocatalytic activity, preparation of publication; IT: Preparation of photocatalysts and its characterization by N2 adsorption; MR: Characterization of photocatalysts by photoelectrochemical measurement, analysis of the correlation between the structural, textural, optical, electrochemical properties and the photocatalytic activity; LM: Evaluation of N2 physisorption and correlation of the data with other characterization techniques; ME: photocatalytic tests; HD: Characterization of photocatalysts by Raman spectroscopy; LD: Preparation of photocatalysts and its characterization by using DRS; AR: Characterization of photocatalysts by using XPS; PK: Evaluation of XPS data and correlation of the results with photocatalytic data.
The authors declare that the research was conducted in the absence of any commercial or financial relationships that could be construed as a potential conflict of interest.
The financial support of the Grant Agency of the Czech Republic (projects No. 17-20737S) and also by EU project No. CZ.1.05/2.1.00/19.0388. The XPS measurements were carried out with the equipment purchased thanks to the financial support of the European Regional Development Fund in the framework of the Polish Innovation Economy Operational Program (contract No. POIG.02.01.00-12-023/08).
Bai, S., Jiang, J., Zhang, Q., and Xiong, Y. (2015). Steering charge kinetics in photocatalysis: intersection of materials syntheses, characterization techniques and theoretical simulations. Chem. Soc. Rev. 44, 2893–2939. doi: 10.1039/C5CS00064E
Bai, S., Yin, W., Wang, L., Li, Z., and Xiong, Y. (2016). Surface and interface design in cocatalysts for photocatalytic water splitting and CO2 reduction. RSC Adv. 6, 57446–57463. doi: 10.1039/C6RA10539D
Barrett, E. P., Joyner, L. G., and Halenda, P. P. (1951). The determination of pore volume and area distributions in porous substances .1. Computations from nitrogen isotherms. J. Am. Chem. Soc. 73, 373–380.
Bokare, A., Sanap, A., Pai, M., Sabharwal, S., and Athawale, A. A. (2013). Antibacterial activities of Nd doped and Ag coated TiO2 nanoparticles under solar light irradiation. Colloids Surf. B Biointerfaces 102, 273–280. doi: 10.1016/j.colsurfb.2012.08.030
Buckeridge, J., Butler, K. T., Catlow, C. R. A., Logsdail, A. J., Scanlon, D. O., Shevlin, S. A., et al. (2015). Polymorph engineering of TiO2: demonstrating how absolute reference potentials are determined by local coordination. Chem. Mater. 27, 3844–3851. doi: 10.1021/acs.chemmater.5b00230
de Boer, J. H., Lippens, B. C., Linsen, B. G., Broekhof, J. C. P., van den Heuvel, A., and Osinga, T. J. (1966). T-curve of multimolecular N2-adsorption. J. Colloid Interface Sci. 21, 405–414.
Dozzi, M. V., Chiarello, G. L., Pedroni, M., Livraghi, S., Giamello, E., and Selli, E. (2017). High photocatalytic hydrogen production on Cu(II) pre-grafted Pt/TiO2. Appl. Catal. B 209, 417–428. doi: 10.1016/j.apcatb.2017.03.007
Du, J., Chen, H., Yang, H., Sang, R., Qian, Y., Li, Y., et al. (2013). A facile sol–gel method for synthesis of porous Nd-doped TiO2 monolith with enhanced photocatalytic activity under UV–Vis irradiation. Microporous Mesoporous Mater. 182, 87–94. doi: 10.1016/j.micromeso.2013.08.023
Fujishima, A., and Honda, K. (1972). Electrochemical photolysis of water at a semiconductor electrode. Nature 238, 37–38. doi: 10.1038/238037a0
Gotić, M., Ivanda, M., Sekulić, A., Musić, S., Popović, S., Turković, A., et al. (1996). Microstructure of nanosized TiO2 obtained by sol-gel synthesis. Mater. Lett. 28, 225–229.
Gregg, S. J., and Sing, K. S. W. (1982). Adsorption, Surface Area and Porosity. London, NY: Academic Press.
Grela, M. A., and Colussi, A. J. (1996). Kinetics of stochastic charge transfer and recombination events in semiconductor colloids. Relevance to photocatalysis efficiency. J. Phys. Chem. 100, 18214–18221. doi: 10.1021/jp961936q
Jalajakumari, N., Padmakumar, N., Fujio, M., Yoshinao, O., and Tatsuya, O. (1999). Microstructure and phase transformation behavior of doped nanostructured titania. Mater. Res. Bull. 34, 1275–1290. doi: 10.1016/S0025-5408(99)00113-0
Khalid, N. R., Ahmed, E., Hong, Z. L., Zhang, Y. W., Ullah, M., and Ahmed, M. (2013). Graphene modified Nd/TiO2 photocatalyst for methyl orange degradation under visible light irradiation. Ceram. Int. 39, 3569–3575. doi: 10.1016/j.ceramint.2012.10.183
Kočí, K., Obalová, L., Matějová, L., Plachá, D., Lacný, Z., Jirkovský, J., et al. (2009). Effect of TiO2 particle siz on the photocatalytic reduction of CO2. Appl. Catal. B 89, 494–502. doi: 10.1016/j.apcatb.2009.01.010
Kocí, K., Troppová, I., Edelmannová, M., Starostka, J., Matejová, L., Lang, J., et al. (2017). Photocatalytic decomposition of methanol over La/TiO2 materials. Environ. Sci. Pollut. Res. doi: 10.1007/s11356-017-0460-x. [Epub ahead of print].
Lin, H., Huang, C. P., Li, W., Ni, C., Shah, S. I., and Tseng, Y. H. (2006). Size dependency of nanocrystalline TiO2 on its optical property and photocatalytic reactivity exemplified by 2-chlorophenol. Appl. Catal. B 68, 1–11. doi: 10.1016/j.apcatb.2006.07.018
Lu, Z. Y., Jiang, H. Q., Yan, P. P., Li, J. S., and Wang, Q. Y. (2011). Influences of Tm and N doping on surface properties and photoactivities of anatase-TiO2 nanoparticles. Adv. Mat. Res. 399–401, 519–526. doi: 10.4028/www.scientific.net/AMR.399-401.519
Ma, Y., Wang, X., Jia, Y., Chen, X., Han, H., and Li, C. (2014). Titanium dioxide-based nanomaterials for photocatalytic fuel generations. Chem. Rev. 114, 9987–10043. doi: 10.1021/cr500008u
Maeda, K. (2011). Photocatalytic water splitting using semiconductor particles: history and recent developments. J. Photochem. Photobiol. C 12, 237–268. doi: 10.1016/j.jphotochemrev.2011.07.001
Maira, A. J., Yeung, K. L., Lee, C. Y., Yue, P. L., and Chan, C. K. (2000). Size effects in gas-phase photo-oxidation of trichloroethylene using nanometer-sized TiO2 catalysts. J. Catal. 192, 185–196. doi: 10.1006/jcat.2000.2838
Matejova, L., Brunatova, T., and Danis, S. (2015). TiO2-CeO2 prepared by using pressurized and supercritical fluids: effect of processing parameters and cerium amount on (micro)structural and morphological properties. Res. Chem. Intermed. 41, 9243–9257. doi: 10.1007/s11164-015-1990-9
Matějová, L., Cajthaml, T., Matej, Z., Benada, O., Kluson, P., and Solcova, O. (2010). Super/subcritical fluid extractions for preparation of the crystalline titania. J. Supercrit. Fluids 52, 215–221. doi: 10.1016/j.supflu.2009.12.008
Matějová, L., Matěj, Z., Fajgar, R., Cajthaml, T., and Šolcová, O. (2012). TiO2 powders synthesized by pressurized fluid extraction and supercritical drying: effect of water and methanol on structural properties and purity. Mater. Res. Bull. 47, 3573–3579. doi: 10.1016/j.materresbull.2012.06.062
Meksi, M., Turki, A., Kochkar, H., Bousselmi, L., Guillard, C., and Berhault, G. (2016). The role of lanthanum in the enhancement of photocatalytic properties of TiO2 nanomaterials obtained by calcination of hydrogenotitanate nanotubes. Appl. Catal. B 181, 651–660. doi: 10.1016/j.apcatb.2015.08.037
Musić, S., Gotic, M., Ivanda, S., Popovic, A., Turkovic, R., Trojko, A., et al. (1997). Chemical and microstructural properties of TiO2 synthesized by sol-gel procedure. Mater. Sci. Eng. B 47, 33–40.
Nie, J., Mo, Y., Zheng, B., Yuan, H., and Xiao, D. (2013). Electrochemical fabrication of lanthanum-doped TiO2 nanotube array electrode and investigation of its photoelectrochemical capability. Electrochim. Acta 90, 589–596. doi: 10.1016/j.electacta.2012.12.049
Reli, M., Ambrozova, N., Sihor, M., Matejova, L., Capek, L., Obalova, L., et al. (2015). Novel cerium doped titania catalysts for photocatalytic decomposition of ammonia. Appl. Catal. B Environ. 178, 108–116. doi: 10.1016/j.apcatb.2014.10.021
Reli, M., Huo, P., Sihor, M., Ambrozova, N., Troppova, I., Matejova, L., et al. (2016). Novel TiO2/C3N4 photocatalysts for photocatalytic reduction of CO2 and for photocatalytic decomposition of N2O. J. Phys. Chem. A 120, 8564–8573. doi: 10.1021/acs.jpca.6b07236
Reli, M., Kobielusz, M., Matějová, L., Daniš, S., Macyk, W., Obalová, L., et al. (2017). TiO2 processed by pressurized hot solvents as a novel photocatalyst for photocatalytic reduction of carbon dioxide. Appl. Surf. Sci. 391, 282–287. doi: 10.1016/j.apsusc.2016.06.061
Rengaraj, S., Venkataraj, S., Yeon, J.-W., Kim, Y., Li, X. Z., and Pang, G. K. H. (2007). Preparation, characterization and application of Nd–TiO2 photocatalyst for the reduction of Cr(VI) under UV light illumination. Appl. Catal. B 77, 157–165. doi: 10.1016/j.apcatb.2007.07.016
Schneider, J., Matsuoka, M., Takeuchi, M., Zhang, J., Horiuchi, Y., Anpo, M., et al. (2014). Understanding TiO2 photocatalysis: mechanisms and materials. Chem. Rev. 114, 9919–9986. doi: 10.1021/cr5001892
Schneider, P. (1995). Adsorption-isotherms of microporous mesoporous solids revisited. Appl. Catal. A 129, 157–165. doi: 10.1016/0926-860X(95)00110-7
Siah, W. R., Lintang, H. O., and Yuliati, L. (2017). Role of lanthanum species in improving the photocatalytic activity of titanium dioxide. Catal. Sci. Technol. 7, 159–167. doi: 10.1039/C6CY01991A
Troppová, I., Lang, J., and Matějová, L. (2017). Optimization of pressurized water and pressurized/supercritical methanol processing of Zr0.1Ti0.9On mixed oxide designed for mitigation of model dye Acid orange 7-polluted water Waste Forum 2, 64–76.
Wojcieszak, D., Mazur, M., Kurnatowska, M., Kaczmarek, D., Domaradzki, J., Kepinski, L., et al. (2014). Influence of Nd-doping on photocatalytic properties of TiO2 nanoparticles and thin film coatings. Int. J. Photoenergy 2014:463034. doi: 10.1155/2014/463034
Xu, X., and Song, W. (2016). Enhanced H2 production activity under solar irradiation over N-doped TiO2 prepared using pyridine as a precursor: a typical sample of N-doped TiO2 series. Mater. Technol. 32, 52–63. doi: 10.1080/10667857.2015.1118587
Keywords: neodymium, TiO2 anatase-brookite, CH3OH photocatalytic decomposition, hydrogen production, photocatalysis, electron-hole separation
Citation: Kočí K, Troppová I, Reli M, Matějová L, Edelmannová M, Drobná H, Dubnová L, Rokicińska A, Kuśtrowski P and Čapek L (2018) Nd/TiO2 Anatase-Brookite Photocatalysts for Photocatalytic Decomposition of Methanol. Front. Chem. 6:44. doi: 10.3389/fchem.2018.00044
Received: 22 December 2017; Accepted: 19 February 2018;
Published: 02 March 2018.
Edited by:
Simelys Hernández, Politecnico di Torino, ItalyReviewed by:
Diego Cazorla-Amoros, University of Alicante, SpainCopyright © 2018 Kočí, Troppová, Reli, Matějová, Edelmannová, Drobná, Dubnová, Rokicińska, Kuśtrowski and Čapek. This is an open-access article distributed under the terms of the Creative Commons Attribution License (CC BY). The use, distribution or reproduction in other forums is permitted, provided the original author(s) and the copyright owner are credited and that the original publication in this journal is cited, in accordance with accepted academic practice. No use, distribution or reproduction is permitted which does not comply with these terms.
*Correspondence: Kamila Kočí, kamila.koci@vsb.cz
Disclaimer: All claims expressed in this article are solely those of the authors and do not necessarily represent those of their affiliated organizations, or those of the publisher, the editors and the reviewers. Any product that may be evaluated in this article or claim that may be made by its manufacturer is not guaranteed or endorsed by the publisher.
Research integrity at Frontiers
Learn more about the work of our research integrity team to safeguard the quality of each article we publish.