Development of a murine nose-only inhalation model of influenza: comparison of disease caused by instilled and inhaled A/PR/8/34
- 1Infectious Diseases Research, Aerobiology, Southern Research Institute, Birmingham, AL, USA
- 2CBER, US FDA, Bethesda, MD, USA
Influenza continues to cause widespread disease and death during winter months. In preclinical studies to evaluate the potential efficacy of drugs and vaccines, influenza challenge virus is usually instilled into the noses of animals in the form of large liquid drops. Since inhalation of aerosolized influenza is commonly associated with human transmission, instillation of challenge virus raises uncertainty about the applicability of results. In order to compare the challenge methods, we established conditions to generate influenza aerosols with a mass median aerodynamic diameter (MMAD) of 1 μm that were delivered to mice in a nose-only inhalation system. In this report, we describe the system and compare the 50% lethal dose (LD50) of instilled and inhaled A/PR/8/34 (PR8) in BALB/c mice. The estimated LD50 for inhaled virus was 8.7 plaque forming units (PFU) and the mean time to death was 7.7 days, whereas the estimated LD50 for instilled virus was 51.6 PFU and the mean time to death was 8.2 days. Our results show that mice are more sensitive to inhaled virus than virus delivered by intranasal instillation. The murine nose-only inhalation model of influenza infection can be used to infect large numbers of animals simultaneously with well-characterized, homogenous PR8 bioaerosol in a controlled and reproducible manner. This model provides the means to evaluate the efficacy of drug and vaccine candidates against the relevant route of challenge, thereby providing data that may better predict clinical outcome.
Introduction
Influenza is a widespread respiratory disease that results in approximately 40,000 deaths in the USA and at least one million deaths worldwide annually (Dushoff et al., 2006; Osterholm, 2006). To better understand the disease and the prevention of it, mice, guinea pigs, and ferrets are commonly used in studies of influenza immunity and pathogenesis. These animal models typically utilize an intranasal or intratracheal route of virus challenge, with virus delivered in liquid drops to anesthetized animals so that natural reflexes to swallow or sneeze are avoided. The volume administered is substantial, allowing virus to be deposited in the lower respiratory tract.
Transmission of influenza may occur when virus-containing aerosol droplets are inhaled into the lung, settle in the upper respiratory tract, or are sprayed onto the mucous membrane of a recipient when the infected individual sneezes or coughs. Alternatively, virus on surfaces can be transmitted when transferred to mucous membranes of a susceptible individual. Intranasal and intratracheal instillation of virus does not reflect any of these transmission routes and, therefore, more relevant administration methods may provide additional information regarding influenza pathogenesis and immunity. The “natural” route of influenza infection in man is likely to depend on virus fitness (for example, contact is clearly needed for infection by H5N1 viruses) and environmental circumstances (for example, aerosol transmission may be more likely in a closed room when the virus concentration in respirable particles is high). Contact transmission has been reported as the predominant transmission route in many studies (Brankston et al., 2007; Jones and Adida, 2011), but the greater infectivity noted for very small aerosol droplets in human studies (Teunis et al., 2010), the sustained presence of virus in respirable droplets in emergency rooms (Blachere et al., 2009) as well as studies conducted in animal models, suggest aerosol transmission is an important means by which disease is spread (Tellier, 2009). Influenza infection by the inhalation route has been documented in mice (Tate et al., 2008), ferrets (Lednicky et al., 2010; Tuttle et al., 2010), and human volunteers (Alford et al., 1966).
Inhalation has historically been considered a relevant route of influenza infection (Henle et al., 1946), with droplets of various sizes containing virus transmitted from persons who are sneezing and coughing (Killingley et al., 2012). When virus-containing aerosols that are ≤10 μm in aerodynamic diameter are inhaled, the virus is more likely to reach the lower respiratory tract, a site at which virus replication is very efficient (Knight, 1980). Since some level of technical expertise is required for animal studies that include challenge with an aerosolized influenza preparation, inhalation studies are rarely performed. Instead, intranasal and intratracheal instillation of influenza is routinely used to challenge animals when testing the efficacy or new vaccines and antiviral drugs. Intranasal and intratracheal instillation often results in a non-homogenous distribution of virus in the lungs that can affect early intrapulmonary distribution as well as viral retention and clearance kinetics (Nayak et al., 1965; Driscoll et al., 2000).
Whole-body inhalation systems are often used to expose mice to aerosolized virus, however, these systems generally require large amounts of challenge material because of their large internal volumes and high operating volumetric flow rates (Wong et al., 2010). Additionally, animals that are challenged in whole-body inhalation systems receive extensive dermal and ocular doses which may exacerbate the natural progression of influenza. Furthermore, mice that are challenged as a group may huddle together resulting in unequal inhaled doses (IDs). Even mice that are singly challenged in a whole-body inhalation system may curl up, thus effectively shielding their nares and adversely affecting ID. Animals that are challenged with influenza in a nose-only inhalation system are more likely to be challenged with a uniform dose and do not have the potential of carrying infectious virus on their fur.
Individual nasal nebulizers have been engineered to deliver virus or live, attenuated vaccine in small droplets of defined size to mice and ferrets (Smith et al., 2011, 2012). This device, (AeroLife or a mass campaign nebulizer), is very easy to use but may not consistently deliver the expected dose if the person administering the virus is not adequately trained or experienced. In contrast, nebulizers and delivery methods in which air flow and particle size are controlled precisely can be used in the laboratory setting to provide consistent delivery of dose, yielding reproducible results in a number of infectious disease models (Bakker-Woudenberg, 2003), including anthrax (Loving et al., 2007), tuberculosis (Williams et al., 2000), and influenza (Gustin et al., 2011). In this report, we describe the characterization of a murine model of influenza infection using a nose-only inhalation challenge system, and compare the LD50 of instilled and inhaled virus in BALB/c mice.
Materials and Methods
Mice
BALB/c mice were purchased from The Jackson Laboratories (Bar Harbor, ME) and housed at Center for Biologics Evaluation and Research (CBER). Mice that were subjected to nose-only inhalation challenge were shipped to Southern Research Institute (SR) approximately one week before the start of the study. Cage size and animal care conformed to the guidelines of the Guide for the Care and Use of Laboratory Animals, the US Department of Agriculture through the Animal Welfare Act, and to the applicable Standard Operating Procedures (SOPs) of CBER and SR.
Mice were challenged by instillation at CBER, and inhalation at SR following procedures approved by the respective Institutional Animal Care and Use Committees. On Day 6, each mouse at SR was uniquely identified by an implantable micro-identification device (IPTT-300 Chip; Biomedic Data Systems Inc., Seaford, DE) inserted subcutaneously between the shoulder blades. The micro-identification chips also provided body temperature data and if the chip was not responding, temperatures were taken manually. On Day 0 of the inhalation and instillation studies, the mice were approximately 15 weeks of age and weighed between 19.7 and 26.1 g.
Virus
Mouse-adapted A/PR/8/34 (PR8) was grown in 10–11 day-old-chicken eggs at 33°C for 60–72 h. The allantoic fluid of each egg was then harvested into 50 ml tubes and cellular debris pelleted. The supernatant was snap-frozen and stored at −80°C. On the day of inoculation, virus dilutions were made in phosphate buffered saline (PBS); each dilution was kept at 4°C prior to the infection.
The virus titer was determined by plaque assay as previously described (Xie et al., 2007). Briefly, confluent layers of MDCK cells were prepared in sterile 6-well plates. After washing the cells in serum-free medium, 1 mL of each virus dilution was added to duplicate wells, and the plates incubated at 37°C for 1 h before removal of the inoculum and addition of an agarose overlay. The plates were incubated for three days before the cells were fixed with cold acetone. After removal of the overlay the cells were stained with crystal violet, and the plaques counted after washing the well. To determine the number of plaque forming units (PFU), whole lungs were homogenized in 2 mL using sterile glass Dounce homogenizers, and the cellular debris pelleted by centrifugation. The supernatant was divided into two aliquots, snap-frozen, and stored at −80°C. Immediately prior to performing the plaque assay, the lung homogenate was thawed, and 10-fold dilutions made in PBS. Since the undiluted sample was usually toxic to the cells, the lowest dilution added to the monolayers was 1/10. Alternatively, lung homogenates were titrated in a 50% tissue culture infectious dose (TCID50) assay as previously described (Ottolini et al., 2005).
Inhalation Challenge System
The murine inhalation challenge system consisted of six components: a compressed air source, a bioaerosol delivery line, a 24-port radial nose-only inhalation challenge plenum, a bioaerosol characterization platform, an air handling station, and an exhaust platform. The bioaerosol delivery line consisted of a Collison 3-Jet Nebulizer (BGI Inc., Waltham, MA), a radial in-line aerosol mixer (In-Tox Products, LLC, Albuquerque, NM), and a filtered air passive dilutor. The radial nose-only inhalation challenge plenum (In-Tox Products) was fitted with Positive Flow-By™ restraint tubes (In-Tox Products) and isoaxial sample collection ports that interfaced with the bioaerosol characterization platform. The bioaerosol characterization platform included air sampling impingers, Model 7541 (Ace Glass, Inc., Vineland, NJ), and an Aerosol Particle Sizer™ Spectrometer (APS, TSI Inc., Shoreview, MN). The air handling station interfaced with the bioaerosol delivery line, the bioaerosol characterization platform, and the exhaust platform and consisted of computer regulated gas flow and pressure controllers (Alicat Scientific, Inc., Tucson, AZ). The exhaust platform consisted of HEPA filters, a differential pressure magnehelic, and a vacuum pump. The bioaerosol delivery line, inhalation challenge plenum, and bioaerosol characterization platform were placed inside a SterilGARD® III Advance™ (Baker Company, Sanford, ME) biological safety cabinet (BSC). The inhalation challenge plenum was maintained at a slightly negative pressure relative to the BSC. The BSC was maintained at a slightly negative pressure with respect to the Animal Biosafety Level-2 laboratory. Temperature and relative humidity within the inhalation challenge plenum were monitored using a Humidity Temperature Meter (Omega Engineering, Stamford, CT). Inhalation challenge plenum oxygen levels were monitored continuously during all challenges with a Model 5800 Intelligent Oxygen Monitor (Hudson RCI, Durham, NC).
Inhalation Challenge
On three consecutive days prior to inhalation challenge, mice were trained in the nose-only inhalation restraint tubes. On the first day of training mice were loaded into nose-only inhalation restraint tubes and placed in a horizontal position for approximately 15 min. On the second and third days, animals were loaded into nose-only restraint tubes and connected to a ventilated plenum for approximately 30 min. Mice were monitored continuously during training to confirm that orientation was correct and respiration was not dyspneic.
On the day of challenge (Day 0), mice were placed in the nose-only inhalation restraint tubes and connected to the inhalation challenge plenum using Positive Flow-By™ nose cones (In-Tox Products). An air sampling impinger and the APS were connected to individual sampling ports on the plenum using conductive tubing. The Collison 3-Jet Nebulizer was filled with nebulizer stock suspension and connected to the bioaerosol delivery line. A pre-spray nebulizer suspension sample was collected for analysis by plaque assay. The start of the challenge period (T = 0) began once the nebulizer was activated and set at 30 psi. All groups of mice (n = 8) were challenged with PR8 aerosol or vehicle (PBS) for 30 min. Following inhalation challenge, the mice were removed from the nose-only inhalation restraint tubes and returned to their cages for monitoring.
Instillation Challenge
Groups of mice (n = 8) were anesthetized by exposure to 3% isoflurane in the presence of 3% O2 and inoculated with 30 μL of PR8 diluted in PBS, by applying droplets of the suspension to both nares.
Animal Monitoring
All mice were observed twice daily during quarantine and study periods for signs of moribundity and mortality. Detailed clinical observations were performed daily beginning on Day 2 and continued through the end of the study on Day 14. Body weights were obtained on Day 6 for randomization and then daily beginning on Day 2 through the end of the study on Day 14. Animals that were moribund prior to Day 14 were euthanized. On Day 14, all surviving mice were euthanized via CO2 asphyxiation.
Statistical Analyses
Group means and standard deviations were calculated when appropriate for body weights and body temperatures. Statistical analyses for body weight data and body temperature data were performed using the Provantis automated data collection system (Instem, Staffordshire, UK). The mean, standard deviation, and coefficient of variance were calculated for aerobiology data using EXCEL (Microsoft Excel 2003, Redmond, WA) or SigmaPlot (Systat Software, Inc., San Jose, CA) when appropriate. Statistical differences between the dose groups were evaluated using probit analysis. The independent variable for the probit analysis was dose, and the dependent variable was survival.
Results
Particle Size Distribution
PR8 particle size distribution, reported as mass median aerodynamic diameter (MMAD), count median aerodynamic diameter (CMAD), and their respective geometric standard deviations (GSDs), was determined by the analysis of aerosol samples collected from the inhalation challenge plenum by the Aerodynamic Particle Sizer (APS). An APS Diluter, fitted with a 1:100 capillary tube, was used to reduce the total number of particles sampled. All APS samples were 20 s in duration and collected at approximately T = 15 min of the challenge. The MMAD was 1.0 μm and the GSD was 1.8. This confirmed that the aerosol was respirable and maximized for pulmonary-alveolar deposition in mice, with MMAD < 3.5 μm (Schlesinger, 1985). The CMAD was 0.7 μm and the GSD was 1.3. Although the particle size distribution was polydisperse by definition [GSD > 1.2 (Mercer, 1973)], both the mass and count GSDs were less than 2.0. Therefore, the total deposition of aerosol in the respiratory tract of the mice would not be substantially different from a monodisperse aerosol (McClellan, 1989). Representative plots of the mass and count cumulative particle size distributions are shown in Figure 1.
Figure 1. Distribution of particle size mass and count in PR8 aerosols. APS samples collected from the challenge plenum were used to determine, (A) the distribution of particle size mass; dM is the mass of the particles collected in the range (total mass) and dlogDp is the difference in the log of the channel width; and (B) the distribution of particle size count; dN is the number of the particles collected in the range (total concentration), and dlogDp is the difference in the log of the channel width.
Bioaerosol Concentration
Based on data from the aerosol concentration (AC) characterization tests, target nebulizer suspension concentrations were prepared. Immediately before inhalation challenge, pre-spray samples of PR8 nebulizer suspension were collected and the actual concentrations were determined by plaque analysis. Pre-spray PR8 nebulizer suspension concentrations were 0, 8500, 180,000, 1,400,000, and 3,200,000 PFU/mL, respectively (Table 1).
Table 1. PR8 bioaerosol concentration.
The concentration (PFU/L) of PR8 in the aerosol was determined from plaque assay of air sampling impinger samples collected from the inhalation challenge plenum. AC was calculated as: AC = (Ci • Vi)/(Qi • Ts), where Ci is the impinger concentration (PFU/mL), Vi is the final volume (mL) of the PBS in the impinger, Qi is the impinger volumetric flow rate (L/min), and Ts is the sample collection duration (min). Impingers were prepared with 20 mL PBS. Target bioaerosol concentration was varied by increasing nebulizer suspension concentration. All impinger samples were collected for 30 min using a critical pressure flow of approximately 6 L/min. The concentrations of live virus in the aerosol (AC) for each of the nebulizer suspensions listed, were: 0, 7.6, 96, 860, and 1200 PFU/L, respectively.
Comparison of Lung Deposition of Inhaled and Instilled Virus
Groups of eight mice were challenged with PR8 as an aerosol (nose-only) and liquid suspension at the highest dose used in the LD50 study i.e., 1000 PFU instilled, and 1200 PFU/L inhaled for 30 min. Using a minute ventilation rate of 0.060 L/min (Flandre et al., 2003), the ID calculated was 2200 PFU. To determine how much virus was deposited in the lower respiratory tract, all the mice were euthanized within 15 min of challenge, and lungs prepared for virus titration. The sensitivity of the plaque assay precluded measurement of a virus titer in all lungs of the mice inoculated with aerosol. Virus was measured in only one of these eight mice, with a titer of 120 PFU/lung. The deposition fraction measured for this one animal was 5.5%, a value that is predicted from studies comparing efficiency of deposition for aerosol particles of different MMAD (Schlesinger, 1985). To be able to compare pulmonary deposition of inhaled and instilled virus, we determined virus titers in lungs as well as the virus inoculum by a more sensitive TCID50 assay. The TCID50 results in Table 2 reflect this greater sensitivity (one PFU is equivalent to approximately 102 TCID50 of PR8). While the amount of virus inhaled and instilled was similar, the amount of instilled PR8 measured in the lungs was almost 10-fold greater than when virus was inhaled. While additional studies with greater inoculation doses are needed to confirm deposition efficiency in our system, these results show that deposition of virus into the lower respiratory tract was more efficient when virus was instilled intranasally under anesthesia.

Table 2. PR8 deposition in lungs.
Comparison of Inhalation and Instillation LD50
Five groups of eight BALB/c mice were infected with virus by inhalation of PR8 at the ACs given in the previous section. ID was calculated using the following equation: ID = AC • Vm • Tc, where AC is the virus AC (PFU/L), Vm is the murine minute ventilation (L/min), and Tc is the inhalation challenge duration (min). Based on data for restrained BALB/c mice of similar weight to those used in this study, a minute ventilation of 0.060 L/min (Flandre et al., 2003), was used to calculate IDs of 0, 14, 170, 1500, and 2200 PFU for mice in Groups 1–5 of the inhalation LD50 study, respectively. Thirty-one of 32 mice were found dead or euthanized in moribund condition by Day 12 in the inhalation study. A survival plot is shown in Figure 2A. The mean time to death for mice challenged with PR8 aerosol was 7.7 days. The inhalation LD50 for mice challenged with PR8 virus was estimated to be 8.7 PFU (Figure 3A). Since there was only one surviving mouse, 95% confidence intervals could not be calculated.
Figure 2. (A) Inhalation and (B) instillation survival plots for mice exposed to PR8. A key indicating color code for each dose group is provided on the figure.
Figure 3. Probit analysis to determine LD50 for (A) inhaled, and (B) instilled PR8. Dashed lines show 95% confidence interval for the analysis. Since >50% of mice died in the lowest aerosol challenge group, 95% confidence intervals are not shown for inhaled PR8.
Five groups of eight female BALB/c mice were infected with PR8 virus by intranasal instillation. Mice were anesthetized and inoculated with 30 μL PR8 diluted in PBS to yield instillation doses of 1.6, 8, 40, 200, and 1000 PFU/mouse. Nineteen of 40 mice were found dead or euthanized in moribund condition by Day 9. A survival plot is shown in Figure 2B. The instillation LD50 for mice challenged with PR8 virus was estimated to be 51.6 PFU, with 95% confidence interval of 20.7–119.1 PFU (Figure 3B). The mean time to death for mice challenged with PR8 virus by intranasal instillation was 8.2 days.
Body weight was recorded daily during the inhalation and instillation studies. Significant weight loss in the highest dose groups was observed two days after both inhalation and instillation of PR8 (Figure 4). There was a trend toward recovery to baseline weights for surviving mice, however, recovery after inhalation was delayed by 2–3 days compared with the mice that were inoculated by instillation (increased weights measured on days 8 or 9). Signs of disease such as lack of grooming, hunched posture, squinting, tachypnea, and dyspnea were observed after both inhalation and instillation in a dose-dependent manner. Temperature was only measured in the inhalation group. The degree of hypothermia was similar for all mice challenged with doses ≥170 PFU, but mice challenged at the lowest dose experienced significantly less hypothermia (Figure 5) and weight loss (Figure 4A), even though most mice in this group died.
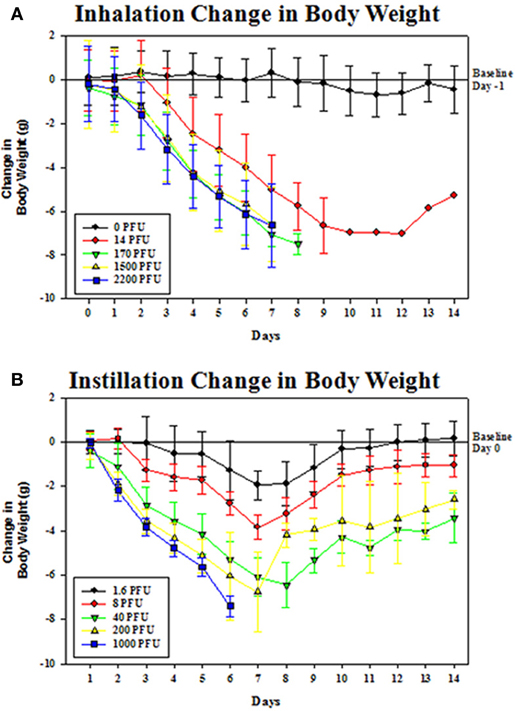
Figure 4. Change in body weight for groups of mice challenged with PR8 by (A) inhalation, and (B) instillation. Mice in each group (n = 8) were weighed individually on each day after challenge. Each graph shows the group mean change in weight relative to the Day 0 (inhalation) and Day 1 (instillation) baseline body weights. Error bars are ± standard deviation of the mean.
Figure 5. Change in body temperature for groups of mice challenged with PR8 aerosol. Temperatures of mice in each group (n = 8) were recorded individually on each day after challenge. The graph shows group mean change in temperature relative to the baseline temperature collected prior to challenge on Day 0 Error bars are ± standard deviation of the mean.
Discussion
In this report, we identify differences in influenza morbidity and mortality in BALB/c mice that were challenged with PR8 by inhalation of aerosol particles and by intranasal instillation of liquid drops. Less PR8 virus in the nose-only inhalation model resulted in death than intranasal instillation, with an estimated inhalation LD50 of approximately 8.7 PFU, while the estimated instillation LD50 was 51.6 PFU. This result concurs with past studies comparing instillation and inhalation routes that show higher doses of an H3N2 virus are required for infection when applied as liquid drops intranasally (Larson et al., 1976), suggesting this finding is generally applicable.
The severity and frequency of most clinical signs after either inhalation or instillation increased with dose, suggesting that disease is proportional to the number of virus particles. It was, therefore, somewhat surprising that mortality was greatest in the animals exposed to aerosolized virus as titration of virus immediately after inoculation showed that the amount of virus deposited in the lungs was only a small proportion of the ID. In our model the amount of virus deposited into the lungs was = 7% of the ID, a deposition efficiency demonstrated previously for mice inoculated with monodisperse aerosol particles having mean diameter of approximately 1 μm (Schlesinger, 1985). This was less efficient than deposition of instilled virus, and yet mice exposed to inhaled virus were more sensitive to death. We, therefore, hypothesized that the region of the lung or cell type infected by aerosolized virus, rather than the overall virus dose, accounts for the difference in lethality.
Infection with mouse-adapted PR8 is known to result in viral pneumonia (Yetter et al., 1980), and animal experiments (Loosli et al., 1975), as well as immunostaining of lung sections from infected people (Uiprasertkul et al., 2005; Basu et al., 2011), show infection of Type II pneumocytes in alveoli as a primary site of replication. Since we generated aerosol droplets of a size that have the ability to reach the alveoli, we predict that this form of delivery allows more efficient infection of these cells in the alveoli, resulting in a lower LD50 than virus instilled into the nares as a liquid suspension. Even though the latter administration is conducted under anesthesia and the bulk of the inoculum reaches the lower respiratory tract (Larson et al., 1976), it is likely that these large drops would be retained in the bronchioles where virus can be eliminated after binding to mucins (Rogers, 2003) or inactivated by a number of other innate soluble or cellular mechanisms. This may include inactivation by collectins such as surfactant protein D, alone or through activation of neutrophils (Hartshorn et al., 1994), inactivation by phosphatidylglycerol (Numata et al., 2012), or removal by macrophages (Wang et al., 2012). Our future studies will determine whether there is differential distribution of infected cells in the lower respiratory tract after inhalation and instillation challenge.
Immune responses such as HA-specific antibodies that block binding of virus particles to cellular receptors and NA-specific antibodies that limit access of virus to the epithelium by preventing influenza's release from mucins, play a key role in preventing disease and death following exposure to influenza. While mucosal antibodies of the IgA isotype prevent infection in the upper respiratory tract, IgG that transudates into brochi and alveoli restricts virus replication in the lower respiratory tract (Renegar et al., 2004). It is not known whether the effective titer of HA- or NA-specific antibodies is the same for inhaled and instilled virus. Our future studies will examine whether antibody and cell-mediated immune responses provide equivalent protection against aerosol and liquid forms of virus.
In conclusion, this study demonstrated that challenge of BALB/c mice with PR8 by nose-only inhalation resulted in more severe disease, and death at a lower dose, than virus instilled into the nose as a liquid formulation. Mice challenged with aerosolized influenza may consequently provide additional data to support the safety and efficacy of drugs and vaccines that are currently under development.
Conflict of Interest Statement
The authors declare that the research was conducted in the absence of any commercial or financial relationships that could be construed as a potential conflict of interest.
Acknowledgments
This study was supported by CBER PanFlu funds. We thank the CBER and Southern Research Institute animal facility technical support staff for excellent care of the animals, Arash Hassantoufighi for technical support, and Alpha StatConsult, Damascus, MD for statistical analysis of data.
References
Alford, R. H., Kasel, J. A., Gerone, P. J., and Knight, V. (1966). Human influenza resulting from aerosol inhalation. Proc. Soc. Exp. Biol. Med. 122, 800–804.
Bakker-Woudenberg, I. A. (2003). Experimental models of pulmonary infection. J. Microbiol. Methods 54, 295–313.
Basu, A., Shelke, V., Chadha, M., Kadam, D., Sangle, S., Gangodkar, S., and Mishra, A. (2011). Direct imaging of pH1N1 2009 influenza virus replication in alveolar pneumocytes in fatal cases by transmission electron microscopy. J. Electron Microsc. (Tokyo) 60, 89–93.
Blachere, F., Lindsley, W., Pearce, T., Anderson, S., Fisher, M., Khakoo, R., Meade, B., Lander, O., Davis, S., Thewlis, R., Celik, I., Chen, B., and Beezhold, D. (2009). Measurement of airborne influenza virus in a hospital emergency department. Clin. Infect. Dis. 48, 438–440.
Brankston, G., Gitterman, L., Hirji, Z., Lemieux, C., and Gardam, M. (2007). Transmission of influenza A in human beings. Lancet Infect. Dis. 7, 257–265.
Driscoll, K. E., Costa, D. L., Hatch, G., Henderson, R., Oberdorster, G., Salem, H., and Schlesinger, R. B. (2000). Intratracheal instillation as an exposure technique for the evaluation of respiratory tract toxicity: uses and limitations. Toxicol. Sci. 55, 24–35.
Dushoff, J., Plotkin, J., Viboud, C., Earn, D. J. D., and Simonsen, L. (2006). Mortality due to influenza in the United States–an annualized regression approach using multiple-cause mortality data. Am. J. Epidemiol. 163, 181–187.
Flandre, T., Leroy, P., and Desmecht, D. J. M. (2003). Effect of somatic growth, strain, and sex on double-chamber plethysmographic respiratory function values in healthy mice. J. Appl. Physiol. 94, 1129–1136.
Gustin, K. M., Belser, J. A., Wadford, D. A., Pearce, M. B., Katz, J. M., Tumpey, T. M., and Maines, T. R. (2011). Influenza virus aerosol exposure and analytical system for ferrets. Proc. Natl. Acad. Sci. U.S.A. 108, 8432–8437.
Hartshorn, K. L., Crouch, E. C., White, M. R., Eggleton, P., Tauber, A. I., Chang, D., and Sastry, K. (1994). Evidence for a protective role of pulmonary surfactant protein D (SP-D) against influenza A viruses. J. Clin. Invest. 94, 311–319.
Henle, W., Henle, G., Stokes, J., and Maris, E. P. (1946). Experimental exposure of human subjects to viruses of influenza. J. Immunol. 52, 145–165.
Jones, R. M., and Adida, E. (2011). Influenza infection risk and predominate exposure route: uncertainty analysis. Risk Anal. 31, 1622–1631.
Killingley, B., Enstone, J. E., Greatorex, J., Gilbert, A. S., Lambkin-Williams, R., Cauchemez, S., Katz, J. M., Booy, R., Hayward, A., Oxford, J., Bridges, C. B., Ferguson, N. M., and Nguyen Van-Tam, J. S. (2012). Use of a human influenza challenge model to assess person-to-person transmission: proof-of-concept study. J. Infect. Dis. 205, 35–43.
Larson, E. W., Dominik, J. W., Rowberg, A. H., and Higbee, G. A. (1976). Influenza virus population dynamics in the respiratory tract of experimentally infected mice. Infect. Immun. 13, 438–447.
Lednicky, J. A., Hamilton, S. B., Tuttle, R. S., Sosna, W. A., Daniels, D. E., and Swayne, D. E. (2010). Ferrets develop fatal influenza after inhaling small particle aerosols of highly pathogenic avian influenza virus A/Vietnam/1203/2004 (H5N1). Virol. J. 7, 231.
Loosli, C. G., Stinson, S. F., Ryan, D. P., Hertweck, M. S., Hardy, J. D., and Serebrin, R. (1975). The destruction of type 2 pneumocytes by airborne influenza PR8-A virus; its effect on surfactant and lecithin content of the pneumonic lesions of mice. Chest 67, 7S–14S.
Loving, C. L., Kennett, M., Lee, G. M., Grippe, V. K., and Merkel, T. J. (2007). Murine aerosol challenge model of anthrax. Infect. Immun. 75, 2689–2698.
Mercer, T. T. American Industrial Hygiene Association, and U. S. Atomic Energy Commission. (1973). Aerosol Technology in Hazard Evaluation. New York, NY: Academic Press.
Nayak, D. P., Kelley, G. W., and Underdahl, N. R. (1965). The effect of varied inoculums on the distribution and progression of Influenza virus (S-15) in lungs of mice. Am. J. Vet. Res. 26, 984–990.
Numata, M., Kandasamy, P., Nagashima, Y., Posey, J., Hartshorn, K., Woodland, D., and Voelker, D. (2012). Phosphatidylglycerol suppresses influenza a virus infection. Am. J. Respir. Cell Mol. Biol. 46, 479–487.
Ottolini, M., Blanco, J. C. G., Eichelberger, M., Porter, D., Pletneva, L., Richardson, J., and Prince, G. (2005). The cotton rat provides a useful small-animal model for the study of influenza virus pathogenesis. J. Gen. Virol. 86, 2823–2830.
Renegar, K. B., Small, P. A. Jr., Boykins, L. G., and Wright, P. F. (2004). Role of IgA versus IgG in the control of influenza viral infection in the murine respiratory tract. J. Immunol. 173, 1978–1986.
Schlesinger, R. B. (1985). Comparative deposition of inhaled aerosols in experimental animals and humans: a review. J. Toxicol. Environ. Health 15, 197–214.
Smith, J. H., Nagy, T., Barber, J., Brooks, P., Tompkins, S. M., and Tripp, R. A. (2011). Aerosol inoculation with a sub-lethal influenza virus leads to exacerbated morbidity and pulmonary disease pathogenesis. Viral Immunol. 24, 131–142.
Smith, J. H., Papania, M., Knaus, D., Brooks, P., Haas, D. L., Mair, R., Barry, J., Tompkins, S. M., and Tripp, R. A. (2012). Nebulized live-attenuated influenza vaccine provides protection in ferrets at a reduced dose. Vaccine 30, 3026–3033.
Tate, M. D., Brooks, A. G., and Reading, P. C. (2008). The role of neutrophils in the upper and lower respiratory tract during influenza virus infection of mice. Respir. Res. 9, 57–70.
Tellier, R. (2009). Aerosol transmission of influenza A virus: a review of new studies. J. R. Soc. Interface 6, S783–S790.
Teunis, P. F., Brienen, N., and Kretzschmar, M. E. (2010). High infectivity and pathogenicity of influenza A virus via aerosol and droplet transmission. Epidemics 2, 215–222.
Tuttle, R. S., Sosna, W. A., Daniels, D. E., Hamilton, S. B., and Lednicky, J. A. (2010). Design, assembly, and validation of a nose-only inhalation exposure system for studies of aerosolized viable influenza H5N1 virus in ferrets. Virol. J. 7, 135.
Uiprasertkul, M., Puthavathana, P., Sangsiriwut, K., Pooruk, P., Srisook, K., Peiris, M., Nicholls, J. M., Chokephaibulkit, K., Vanprapar, N., and Auewarakul, P. (2005). Influenza A H5N1 replication sites in humans. Emerg. Infect. Dis. 11, 1036–1041.
Wang, J., Nikrad, M., Travanty, E., Zhou, B., Phang, T., Gao, B., Alford, T., Ito, Y., Nahreini, P., Hartshorn, K., Wentworth, D., Dinarello, C., and Mason, R. (2012). Innate immune response of human alveolar macrophages during influenza A infection. PLoS ONE 7:e29879. doi: 10.1371/journal.pone.0029879
Williams, A., Davies, A., Marsh, P. D., Chambers, M. A., and Hewinson, R. G. (2000). Comparison of the protective efficacy of bacille calmette-Guerin vaccination against aerosol challenge with Mycobacterium tuberculosis and Mycobacterium bovis. Clin. Infect. Dis. 3(Suppl. 30), S299–S301.
Wong, J. P., Christopher, M. E., Viswanathan, S., Schnell, G., Dai, X., Van Loon, D., and Stephen, E. R. (2010). Aerosol and nasal delivery of vaccines and antiviral drugs against seasonal and pandemic influenza. Expert Rev. Respir. Med. 4, 171–177.
Xie, H., Liu, T., Chen, H., Huang, X. Y., and Ye, Z. P. (2007). Evaluating the vaccine potential of an influenza A viral hemagglutinin and matrix double insertion DNA plasmid. Vaccine 25, 7649–7655.
Keywords: influenza, inhalation, instillation, aerosol, mouse
Citation: Bowen LE, Rivers K, Trombley JE, Bohannon JK, Li SX, Boydston JA and Eichelberger MC (2012) Development of a murine nose-only inhalation model of influenza: comparison of disease caused by instilled and inhaled A/PR/8/34. Front. Cell. Inf. Microbio. 2:74. doi: 10.3389/fcimb.2012.00074
Received: 08 March 2012; Accepted: 10 May 2012;
Published online: 30 May 2012.
Edited by:
Chad J. Roy, Tulane University, USAReviewed by:
Gill Diamond, University of Medicine and Dentistry of New Jersey, USAHua Xie, Meharry Medical College, USA
Copyright: © 2012 Bowen, Rivers, Trombley, Bohannon, Li, Boydston and Eichelberger. This is an open-access article distributed under the terms of the Creative Commons Attribution Non Commercial License, which permits non-commercial use, distribution, and reproduction in other forums, provided the original authors and source are credited.
*Correspondence: Larry E. Bowen, Infectious Disease Research, Southern Research Institute, 2000 9th Avenue South, Birmingham, AL 35205, USA. e-mail: l.bowen@southernresearch.org