Toxoplasma gondii Infection Is Associated with Mitochondrial Dysfunction in-Vitro
 Genevieve Syn
 Denise Anderson
  Jenefer M. Blackwell
 Sarra E. Jamieson
- Genetics and Health, Telethon Kids Institute, University of Western Australia, Subiaco, WA, Australia
Upon invasion of host cells, the ubiquitous pathogen Toxoplasma gondii manipulates several host processes, including re-organization of host organelles, to create a replicative niche. Host mitochondrial association to T. gondii parasitophorous vacuoles is rapid and has roles in modulating host immune responses. Here gene expression profiling of T. gondii infected cells reveals enrichment of genes involved in oxidative phosphorylation (OXPHOS) and mitochondrial dysfunction 6 h post-infection. We identified 11 hub genes (HIF-1α, CASP8, FN1, POU5F1, CD44, ISG15, HNRNPA1, MDM2, RPL35, VHL, and NUPR1) and 10 predicted upstream regulators, including 4 endogenous regulators RICTOR, KDM5A, RB1, and D-glucose. We characterized a number of mitochondrial parameters in T. gondii infected human foreskin fibroblast cells over a 36 h time-course. In addition to the usual rapid recruitment and apparent enlargement of mitochondria around the parasitophorous vacuole we observed fragmented host mitochondria in infected cells, not linked to cellular apoptosis, from 24 h post-infection. An increase in mitochondrial superoxide levels in T. gondii infected cells was observed that required active parasite invasion and peaked at 30 h post-infection. Measurement of OXPHOS proteins showed decreased expression of Complex IV in infected cells at 24 h post-infection, followed by decreased expression of Complexes I and II at 36 h post-infection. No change occurred in Complex V. No difference in host mitochondrial membrane potential between infected and mock-infected cells was observed at any time. Our results show perturbation of host mitochondrial function following T. gondii infection that likely impacts on pathogenesis of disease.
Introduction
Mitochondria are powerhouses of the cell, generating most of the cellular energy in the form of adenosine triphosphate (ATP) through oxidative phosphorylation (OXPHOS). This process occurs at the electron transport chain found on the inner mitochondrial membrane comprising of the OXPHOS complexes. Complex I to IV are four multi-subunit enzymes working together to create an electrochemical proton gradient across the mitochondrial inner membrane. ATP synthase (Complex V) then uses the proton gradient to generate ATP. In addition to their central role in metabolism, mitochondria also regulate cellular processes such as cell cycle (Antico Arciuch et al., 2012), innate immunity (West et al., 2011), and apoptosis (Wang and Youle, 2009). During an infection with the ubiquitous pathogen Toxoplasma gondii, these same processes are modulated in the host cell suggesting a central role for host mitochondria in establishing infection in host cells. T. gondii infection is common in man, although most infections are asymptomatic. However, congenital disease arising from vertical transmission following primary infection during pregnancy, or acquired infection in immunocompromised individuals, can result in a range of debilitating and potentially fatal ocular and/or brain lesions. The mechanisms leading to these clinical signs in both acquired and congenital toxoplasmosis remain poorly understood.
Upon invasion of the host cell, T. gondii must manipulate several of its host's processes to survive and replicate. It dysregulates the host cell cycle (Molestina et al., 2008), inhibits mitochondrial-dependent host apoptosis (Goebel et al., 2001; Lüder and Gross, 2005), subverts the host innate immune system (Lambert and Barragan, 2010) and recruits host mitochondria to the parasitophorous vacuole (de Melo et al., 1992; Lindsay et al., 1993; Sinai et al., 1997; Pernas et al., 2014) following infection. Association of the mitochondria to T. gondii's parasitophorous vacuole membrane (PVM) occurs as quickly as 10 min after invasion (Sinai and Joiner, 2001). Contact between the outer mitochondrial membrane and PVM was observed to be continuous over the length of the mitochondrial profile and the extent of PVM-mitochondria association did not change over time even as the PVM grew larger to accommodate increased numbers of parasites (Sinai et al., 1997). The PVM-associated mitochondria are morphologically distinct from cytosolic mitochondria, labeling more intensely with membrane potential sensitive dyes (Sinai et al., 1997) and with cross-sections that are ~3-fold larger than cytosolic mitochondria when measured at 18 h post-infection (Pernas et al., 2014). PVM-mitochondria association is also parasite strain-specific; the mouse-virulent type I and III strains show host mitochondrial association while the avirulent type II strain does not (Pernas et al., 2014) suggesting that recruitment of host mitochondria may have a role to play in determining pathogenicity and the severity of clinical signs associated with toxoplasmosis.
The importance of mitochondria during T. gondii infection has been further highlighted in a study carried out by Nelson et al. (2008) characterizing host cell proteomic changes following T. gondii infection which showed one-third of modulated proteins were mitochondrial. Initially hypothesized to be for the acquisition of nutrients, such as glucose and amino acids unable to be synthesized by T. gondii (Sinai et al., 1997), PVM-mitochondrial association has also been linked to the modulation of the innate immune response (Pernas et al., 2014).
Given T. gondii's intricate relationship with the host mitochondria, we wanted to understand in more detail what the effects of this PVM-mitochondrial association were on host mitochondrial function. Here we present results of a microarray study that shows OXPHOS and mitochondrial pathways as the top canonical pathways perturbed during infection of human foreskin fibroblast (HFF) cells with T. gondii RH strain (type I). We further characterize the effect of T. gondii on mitochondrial function by demonstrating modulation of the host mitochondrial morphology, superoxide production, and OXPHOS protein expression over time, pointing to a perturbation of mitochondrial function. We also highlight similarities between the clinical signs of patients suffering from mitochondrial dysfunction and toxoplasmosis.
Materials and Methods
Parasite and Cell Culture
Primary Human Foreskin Fibroblast (HFF) monolayers were cultured in Dulbecco's Modified Eagle's Medium (DMEM) (Gibco®, Life Technologies) supplemented with 2 mM GlutaMAXTM (Gibco®, Life Technologies), 100 U/ml Penicillin/100 μg/ml Streptomycin (Gibco®, Life Technologies) and 10% heat-inactivated fetal calf serum (Gibco®). Wild-type RH type I strain T. gondii tachyzoites (gift from Dr Tanya Armstrong, Murdoch University) and green fluorescent protein (GFP)- and mCherry-expressing RH type I strain T. gondii tachyzoites (gift from Dr. Chris Tonkin, Walter and Eliza Hall Institute of Medical Research) were maintained in-vitro in HFF monolayers grown in infection medium (DMEM supplemented as previously described but with 1% heat-inactivated fetal calf serum). All cultures were grown in a 37°C humidified CO2 (5%) incubator. Continuous passage of the parasites was carried out by harvesting infected HFF monolayer with a cell scraper (Sarstedt) and passing it twice through a 27 gauge needle (Becton) to forcibly rupture and release the parasites from any intact infected HFF cells. Host cell debris was removed by passing the parasite suspension through 5 micron pore Millex® syringe filter units (Merck Millipore). The filtered parasites were then used to infect other cell monolayers. In experimental studies, mock-infected cells were used as controls, i.e., cells treated with media containing uninfected cells harvested and treated through the same processes as when harvesting and purifying parasites. Microscopic counts of parasites and flow cytometry was used to demonstrate infection rates and survival of GFP-expressing (44.7% ± 10.3) and mCherry-expressing (61.3% ± 4.3) and untransfected wild-type RH strain tachyzoites (30.2% ± 7.9).
RNA Extractions
HFF cells (1 × 10⁶) were seeded into each well of a six-well tissue culture treated plate (Becton) and infected with wild type T. gondii at a multiplicity of infection (MOI) of 10:1. Two biological replicates were carried out for each experimental condition. Two hours after addition of parasites, cells were washed twice with infection medium, to remove any extracellular parasites and the medium replaced with fresh infection medium to minimize continued T. gondii invasion at later time points. Mock-infected HFF cells were prepared in the same way as infected cells but treated with media prepared as described above. Cells were harvested at 2, 6, and 24 h post-infection using Tri-reagent® (Sigma-Aldrich) and total RNA was extracted using Direct-ZolTM RNA Miniprep kit (Zymo Research) following manufacturer's instructions.
Gene Expression Profiling and Analysis
Generation of microarray data on the Illumina HumanHT-12 v4 Expression Beadchips was carried out at the Australian Genome Research Facility (Melbourne node, Australia). All data analysis was carried out in R Version 3.1.3 (Smooth Sidewalk - https://www.r-project.org/) and RStudio (version 0.99.484). The Bioconductor package lumi (Du et al., 2008) was used to read in raw expression values and perform quality control, background correction and normalization of the data. Pre-processing of the microarray data and removal of probes previously shown to have unreliable annotation (Barbosa-Morais et al., 2010) resulted in 28,584 probes which passed QC requirements. The data discussed in this manuscript have been deposited in NCBI's Gene Expression Omnibus (Edgar et al., 2002) and are accessible through GEO Series accession number GSE98677 (https://www.ncbi.nlm.nih.gov/geo/query/acc.cgi?acc=GSE98677). Differential expression analysis using linear modeling and empirical Bayes methods was carried out in the Bioconductor package limma (Ritchie et al., 2015) with comparison of infected cells vs. mock-infected controls at each time point. Following Benjamini-Hochberg correction (Benjamini and Hochberg, 1995) for multiple testing, genes with an adjusted p-value < 0.05 and a fold change of ≥ 1.5 formed the top sets of genes taken forward into in-silico pathway and network analyses.
Bioinformatics Analyses of Differentially Expressed Genes
Ingenuity Pathway Analysis (IPA) (Ingenuity Systems, www.ingenuity.com) was used to identify canonical pathways associated with the differentially expressed genes. IPA uses the Ingenuity Knowledge Base, an extensive database comprising of biological pathways and functional annotations derived from the interactions between genes, proteins, complexes, drugs, tissues, and disease, to carry out all its analyses. Benjamini-Hochberg correction was applied where appropriate and an adjusted p-value < 0.05 was used to filter all results. Upstream Regulator Analysis within IPA was employed to predict if there were any upstream regulators, including transcription factors, chemicals and drugs/compounds, which may be responsible for the observed gene expression patterns. A p-value < 0.05 was used to determine significance. If an upstream regulator is identified, an activation z-score is calculated based on the fold change values of its target genes within the dataset. A z-score ≥ 2 suggests that an upstream regulator is activated, whereas a z-score ≤ −2 suggests it is inhibited, in our experimental group vs. the control. In all of our analyses the mock-infected cells formed the baseline comparator. Networks were constructed in IPA by selecting all genes within each time point and using the “Connect” option under the “Build” functionality. Genes with no previously documented interactions were removed from the diagram and the functions of each network were inferred from the remaining connected genes at each time point.
Assessment of Mitochondrial Function
All mitochondrial function assays were performed using HFF cells infected with either wild-type, mCherry- or GFP-expressing T. gondii tachyzoites, as indicated, at a MOI of 10:1. Two hours after addition of parasites, the cells were washed twice with warmed sterile Hank's Balanced Salt Solution (HBSS) (Sigma-Aldrich) and the medium replaced with fresh infection media to minimize continued T. gondii invasion. Cells were harvested over a time-course of 6, 12, 18, 24, 30, and 36 h post-infection. Mock-infected HFF cells (as previously described) were used as controls.
Analysis of Mitochondrial Morphology
Cells were seeded onto 13 mm round glass coverslips #1 thickness (ProSciTech) and infection was carried out using GFP-expressing parasites. Mitochondria in live intact cells were stained with 500 nM MitoTracker™ Orange CMTRos (Life Technologies) in infection medium in a 37°C humidified CO2 (5%) incubator for 45 min, followed by nuclear staining with NucBlue ® Live ReadyProbes ® Reagent (Life Technologies) for 10 min. Cells were fixed with 4% paraformaldehyde (Sigma-Aldrich) for 20 min, washed thrice with Phosphate Buffered Saline (PBS) (Medicago, Astral Scientific) and mounted onto glass slides with ShanndonTM Immu-MountTM (Thermo Fisher Scientific) before visualization under Nikon C2+ Confocal Microscopy at 60X magnification under oil immersion. Black and white images of mitochondria, GFP-expressing parasites and nucleus captured in different channels were imported into ImageJ (Schneider et al., 2012) and overlaid with colors red, green, and blue respectively. Colors were optimized to similar intensities and the images merged to form a composite figure. Three biological experiments were performed. To determine the extent of mitochondrial fragmentation, parasitophorous vacuoles were quantified from these composite images for intact or disrupted mitochondria at each time-point. Host mitochondria surrounding the parasitophorous vacuole as one continuous structure were classed as “intact” and host mitochondria surrounding the parasitophorous vacuole in segments were classed as “disrupted”.
Annexin V
Infection was carried out in 24-well plates with non-fluorescent wild-type parasites. Cells were dislodged using TrypLETM Express and re-suspended in 100 μl of 1X Annexin V Buffer (Life Technologies) containing 5 μl of Annexin V Alexa Fluor 647 conjugate (Life Technologies). Cells were incubated in a 37°C humidified CO2 (5%) incubator for 15 min. Annexin V staining was determined using flow cytometry and the data were processed in FlowJoTM (v10) (Treestar, USA). The number of Annexin V positive cells was exported into a spreadsheet, plotted and statistical analysis performed as per section Statistical Analyses. This experiment was done once with three technical replicates.
Measurement of Mitochondrial Superoxide
Infection was carried out in 24-well plates (50,000 cells/well) using GFP-expressing parasites. Two biological experiments were carried out with three technical replicates per biological experiment. Cells were stained with 5 μM of MitoSOXTM Red (Life Technologies) in infection medium in a 37°C humidified CO2 (5%) incubator for 30 min. As a positive control, cells were treated with 10 μM antimycin-A (Sigma-Aldrich) during staining to generate mitochondrial ROS. Cells were washed once with warmed HBSS and dislodged using TrypLETM Express. After centrifugation at 1,000 × g for 5 min at 10°C, cells were re-suspended in HBSS FACS Buffer [HBSS + 5 mM EDTA (Ambion®, ThermoFisher Scientific) + 1% Bovine Serum Albumin (BSA) (Sigma-Aldrich)]. MitoSOXTM fluorescence was detected using flow cytometry (BD LSRFortessaTM) and the data processed using FlowJo® (v10). Forward scatter (FSC) and side scatter (SSC) parameters were used to exclude cellular debris, dead cells, and doublets to retain viable single cell events. As GFP-expressing parasites were used in this experiment, infected cells (GFP-positive) could be differentiated from uninfected cells (GFP-negative) in the same population. When GFP parasites replicate within a cell, the GFP fluorescent intensity of infected cells increases over time. Since we were interested in the dynamics of superoxide production in infected cells over time, we segregated cells situated at the lower end of the GFP fluorescent intensity spectrum (newly-infected cells) from those at the higher end (cells with an established infection) in later time points. The median fluorescent intensities of MitoSOXTM in each treatment group (established infection, newly infected, uninfected, and mock-infected) were exported into a spreadsheet, values plotted, and statistical analyses performed as described in section Statistical Analyses.
OXHPOS Western Blot Analyses
Infection was carried out using mCherry-expressing parasites. At each time point post-infection, cells were dislodged using TrypLETM Express (Life Technologies) and infected (mCherry positive) and uninfected (mCherry negative) cells were separated using a cell sorter (BD FACS Aria III sorter). Infected cells were pelleted at 6,000 × g for 3 min and total protein was extracted using Radioimmunoprecipitation Assay (RIPA) buffer. Proteins were quantified with Direct-Detect® Infrared Spectrometer (Merck Millipore). NuPAGE® LDS Sample Buffer (4X) (Life Technologies). NuPAGE® Sample Reducing Agent (10X) (Life Technologies) was added to 20 μg of protein per sample as per manufacturer's instructions and incubated at 37°C for 30 min before being quenched on ice for at least 2 min. Proteins were separated by gel electrophoresis on NuPAGE Bis-Tris 4-12% protein gels (Life Technologies) and blotted onto Polyvinylidene fluoride (PVDF) membranes. Membranes were blocked with 5% skim milk for an hour in Tris Buffered Saline with 0.1% Tween-20 (Sigma-Aldrich) (TBST) prior to incubation at 4°C overnight with mouse anti-OXPHOS antibody cocktail (1:1,000; ab110413; Abcam) and mouse monoclonal anti-β-actin antibody (1:5,000; A1978–200 μl; Sigma–Aldrich) as a loading control. Secondary staining with horseradish peroxidase-conjugated sheep anti-mouse antibodies (1:10,000; NA931–100UL; GE Healthcare) was carried out for at least 2 h before chemiluminescence detection. Following addition of Amersham ECL Western Blotting Detection Reagent (GE Healthcare), imaging of the PVDF membranes were done with the Biorad ChemiDocTM MP imaging system.
The difference in band intensities between treatment groups was quantified using ImageJ (Schneider et al., 2012). After importing the membrane images into ImageJ, the bands to be analyzed were selected using the “Rectangular Select” tool and presented as histograms representing the relative density of the bands. To remove background noise, a line was drawn across the bottom of the histogram with the “Straight Line” tool to enclose the peak. The area under the curve was translated into a numerical value by clicking inside the peak using the “Wand (tracing)” tool; the brighter the band the higher the value. These values were then imported into a spreadsheet and all band intensities of the OXPHOS complexes were normalized to the loading control β-actin. The normalized values of infected cells at each time point were then compared to their respective mock-infected cells, their mean percentage difference plotted, and statistical analyses performed as described in section Statistical Analyses. Three independent biological experiments were performed.
Measurement of Mitochondrial Membrane Potential
As the fluorescent emission of JC-1 overlapped with the emission spectra of GFP- and mCherry-expressing parasites, infection was carried out in 24-well plates (50,000 cells/well) with non-fluorescent wild-type parasites. Three independent biological experiments with three technical replicates each were performed. Cells were incubated with 2 μM of JC-1 (Life Technologies) in infection medium in a 37°C humidified CO2 (5%) incubator for 30 min. As a positive control, 50 μM of carbonyl cyanide m-chlorophenyl hydrazone (CCCP) (Life Technologies) was added to uninfected cells during staining to depolarise the mitochondrial membrane. Cells were washed once with warmed HBSS, dislodged using TrypLETM Express and re-suspended in 200 μl of HBSS. Changes in mitochondrial membrane potential were determined using flow cytometry and the data were processed in FlowJoTM (v10). Cellular debris, dead cells, and doublets were excluded from the analysis. As non-fluorescent parasites were used in the infection experiments, we were unable to differentiate between infected and uninfected cells thus cells from the whole population were analyzed. Membrane potential was visualized as a ratio of red fluorescence (conjugated form of JC-1 due to negative membrane potential) to green fluorescence (unconjugated form of JC-1 due to positive membrane potential). Cells treated with CCCP were used to set the gates defining cells with depolarized mitochondrial membranes.
Statistical Analyses
All graphs and statistics were generated using GraphPad Prism version 7.00 for Windows (GraphPad Software, La Jolla California USA, www.graphpad.com). A two-way ANOVA test was performed to compare the population means of treatment groups and Bonferroni correction for multiple testing was applied. Comparisons with an adjusted p-value ≤ 0.05 were considered to be significant.
Results
T. gondii Infection Results in Numerous Differentially Expressed Genes at 6 H Post-infection
Gene expression values of T. gondii infected HFF cells were compared against mock-infected HFF cells (baseline) at each time point. At 2 h post-infection, 30 genes were differentially expressed in infected cells; 16 genes had increased expression; and 14 genes had decreased expression (Supplementary Table 1). At 6 h post-infection, there were 498 differentially expressed genes; 172 genes had increased expression; and 326 genes had decreased expression following T. gondii infection (Supplementary Table 1). At 24 h post-infection, four genes were differentially expressed; three genes had increased expression and one gene had decreased expression in T. gondii infected cells (Supplementary Table 1). Figure 1 shows a volcano plot highlighting the 498 genes with an adjusted p-value of < 0.05 and an absolute fold change of ≥ 1.5 at 6 h post-infection. These genes were deemed of interest for in-silico pathway analyses.
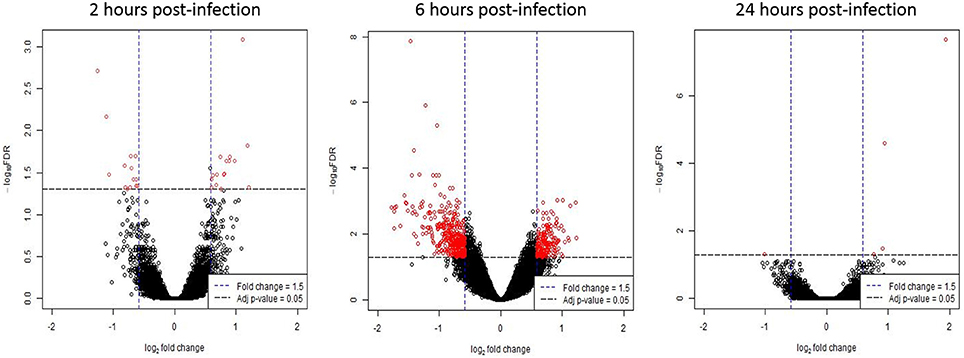
Figure 1. Differentially expressed genes following T. gondii infection. Results of tests for differential expression at each time point are presented in a volcano plot which plots statistical significance against fold change for each gene. Genes colored in red have Benjamini and Hochberg adjusted p-values of < 0.05 and absolute fold changes of ≥ 1.5 and are deemed of interest for in-silico pathway analyses.
Network and Pathway Analyses of Genes Differentially Expressed at 6 H Post T. gondii Infection Reveals Dysregulation of Mitochondrial Pathways
In order to understand more about the effect of T. gondii on the biology of host cells the data for differentially expressed genes at 6 h post-infection was analyzed using IPA. There were insufficient numbers of differentially expressed genes at 2 and 24 h post-infection for meaningful pathway analyses. Of the 498 differentially expressed genes at 6 h post-infection (6 h dataset), 495 genes (99%) mapped to their respective molecules within the Ingenuity Knowledge Base.
As genes work in concert to carry out systemic functions, we used network analysis in IPA to visualize how the differentially expressed genes at 6 h post-infection interacted with each other. Mapping of gene interactions between the 498 genes identified one large network containing 283 genes (57%), with 11 hub genes (i.e., genes which are highly connected) identified (Figure 2); Von Hippel-Lindau Tumor Suppressor (VHL), nuclear protein 1, transcriptional regulator (NUPR1), hypoxia inducible transcription factor 1 alpha (HIF-1α), ISG15 ubiquitin-like modifier (ISG15), CD44 molecule (CD44), POU class 5 homeobox 1 (POU5F1), caspase 8 (CASP8), fibronectin 1 (FN1), heterogenous nuclear ribonucleoprotein 1 (HNRNPA1), MDM2 proto-oncogene (MDM2), and ribosomal protein L35 (RPL35). Canonical Pathway Analysis was then used to search for classical pathways enriched for genes in the 6 h dataset (Table 1). The top two pathways identified were the inter-related pathways of oxidative phosphorylation (adjusted p-value = 6.30 × 10⁻¹⁹) (Figure 3) and mitochondrial dysfunction (adjusted p-value = 7.94 × 10⁻¹⁷). The majority of the differentially expressed genes in these pathways fall within complexes I, III, IV, and V of the OXPHOS pathway and are part of the network in Figure 2.
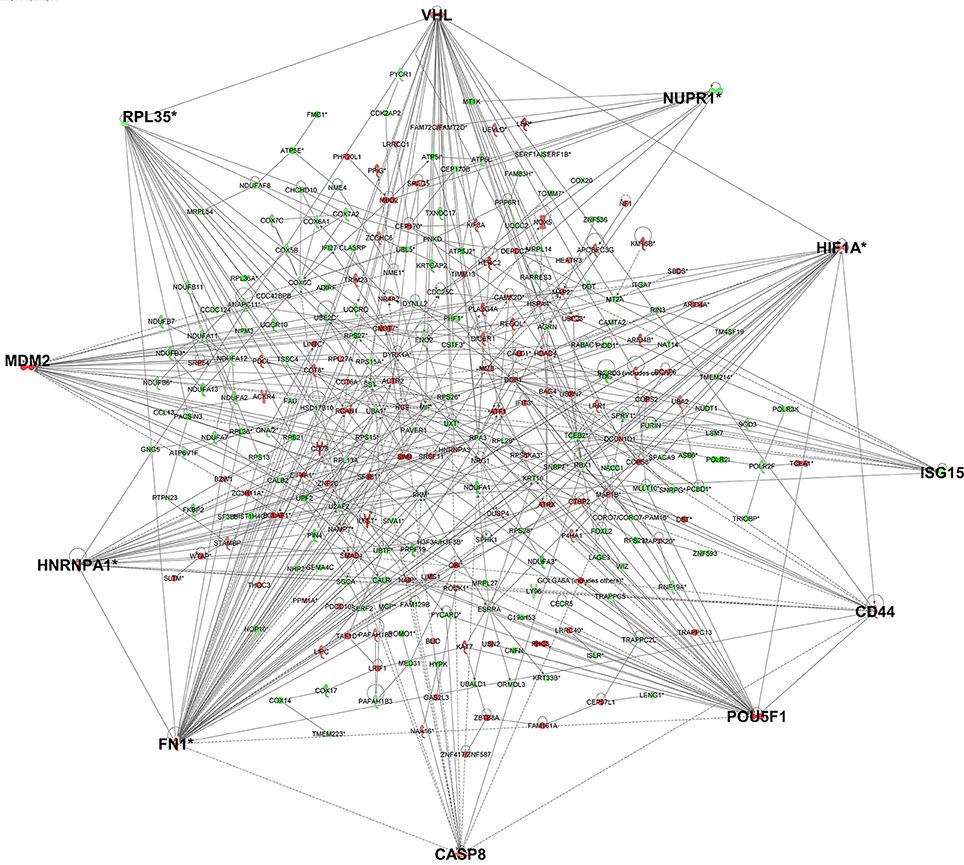
Figure 2. Gene networks generated in IPA for the genes differentially expressed in cells infected for 6 h identified 11 hub genes. Genes in red have increased expression and genes in green have decreased expression in T. gondii infected cells. The more intense the color, the higher the fold change values. Genes highlighted in bold are hub genes.
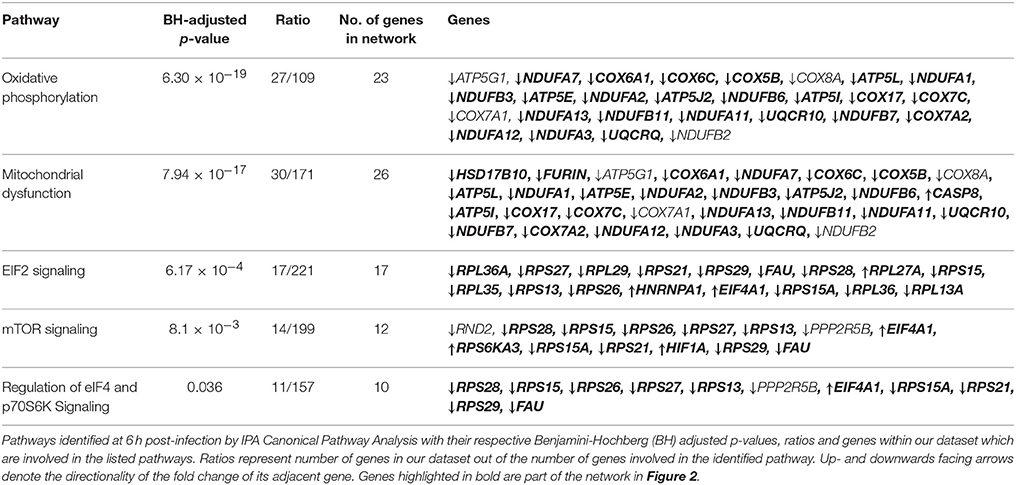
Table 1. List of pathways identified by IPA Canonical Pathway Analysis.
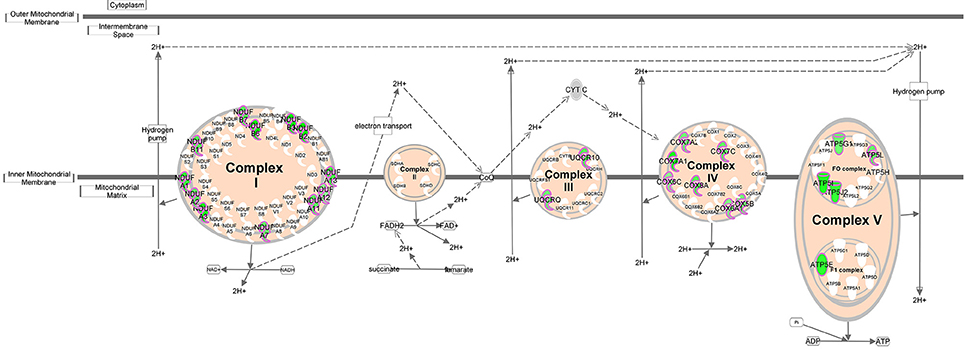
Figure 3. Oxidative phosphorylation pathway. Schematic representation of the oxidative phosphorylation pathway (adapted from Ingenuity). Molecules outlined in purple are differentially expressed within our dataset. Genes in green have decreased expression in T. gondii infected cells 6 h post-infection.
Dysregulation of individual gene expression is caused by upstream regulators such as transcription factors or chemicals exerting their effects upstream of these genes. Evidence for upstream regulator activity on their target genes was investigated (Table 2) to determine if they were related to our identified pathways (Table 1) or network (Figure 2). There were 238 upstream regulators (p-value < 0.05) identified for our dataset of which 10 had robust predicted changes in activity with z-score ≤ −2 (= inhibited) or ≥2 (= activated) in T. gondii infected cells (Table 2). The most prominent endogenous regulator predicted to be activated is rapamycin-insensitive companion of mammalian target of rapamycin (RICTOR) which targets genes involved in all five pathways identified in Table 1. Other endogenous upstream regulators predicted include two transcriptional regulators; lysine (K)-specific demethylase 5B (KDM5B) (activated) and retinoblastoma 1 (RB1) (inhibited) and endogenous chemical D-glucose (activated) found in mammals (Table 2).
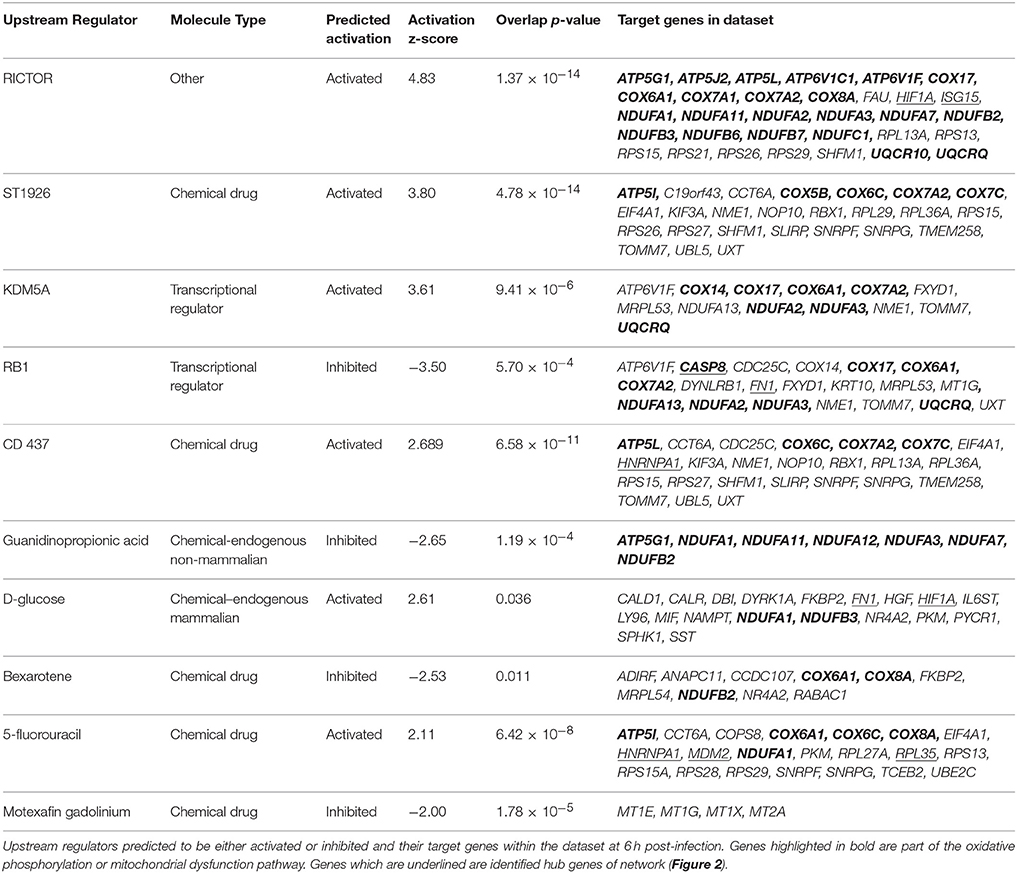
Table 2. Upstream regulator activities and their target genes in the dataset at 6 h post-infection.
Mitochondrial Morphology following T. gondii Infection
Recruitment of host mitochondria to T. gondii's parasitophorous vacuole (PV) has been well-documented (Sinai et al., 1997; Magno et al., 2005; Pernas et al., 2014), occurring as quickly as 10 min post-infection (Sinai and Joiner, 2001). To obtain more detailed information on changes in mitochondrial morphology over time, we used MitoTracker™ Orange together with GFP-expressing T. gondii to monitor host mitochondria morphology over 36 h post-infection. When stained with MitoTracker™ Orange, the mitochondria in mock-infected cells presented as long, filamentous organelles concentrating in perinuclear regions and extending out toward the cell membrane (Figure 4). Their morphology did not change over the 36 h. In contrast, T. gondii infected cells show strong staining of mitochondria recruited to the PVM of intracellular parasites at 6 h post-infection with associated changes in morphology including apparent enlargement and changes in shape.
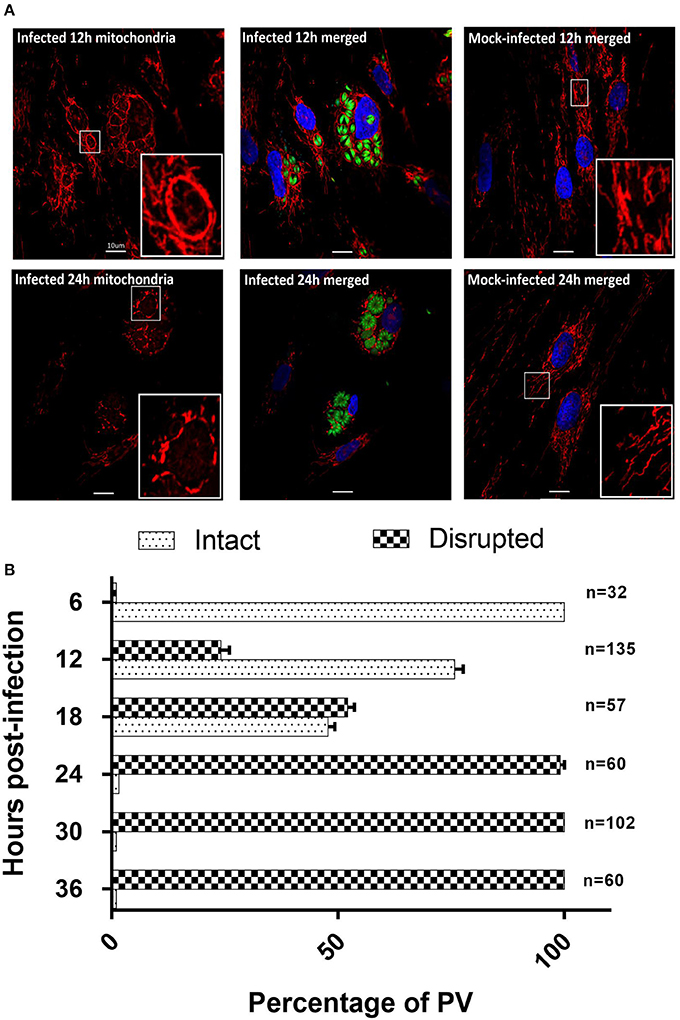
Figure 4. T. gondii infected HFF cells reveals changes in morphology at 12 and 24 h post-infection. (A) MitotrackerTM Orange (red) and DAPI (blue) to stain the mitochondria and nucleus respectively (See Supplementary Figure 1 for all time points). Results for the 12 h (12 h) and 24 h (24 h) time points are shown here. At 12 h host mitochondria in T. gondii infected cells are re-organized and appear as a clear ring around the PVM. At 24 h post-infection host mitochondria around the PVM appear fragmented. MitotrackerTM Orange was also observed staining the mitochondrion of T. gondii. Mitochondria in mock-infected cells are structurally different from T. gondii infected HFFs at the same time points. Bars represent 10 μM; insert boxes are enlarged mitochondria. (B) Percentage ± SEM of the three biological replicate experiments of intact or disrupted mitochondria surrounding the parasitophorous vacuoles from 6 h post-infection to 36 h post-infection. The number of parasitophorous vacuoles quantified per time-point are indicated on the right side of the bar graphs.
The non-PVM-associated mitochondria in infected cells are morphologically similar to the mitochondria in mock-infected cells. At 12 and 18 h post-infection (Figure 4), there is continuous association of mitochondria around the enlarged PVM in which the parasites have multiplied. At the resolution of confocal microscopy it was not possible to determine whether the increase in intensity of mitochondrial staining associated with the PVM was due to increase in size of individual mitochondria or to fusion with additional mitochondria being recruited to the PVM. At these time points, we continued to observe filamentous non-PVM-associated mitochondria in these infected cells. At 24–36 h post-infection the continuous network of mitochondria previously observed surrounding the PVM now presented as fragmented mitochondria, and non-PVM-associated filamentous mitochondria were no longer observed (Figure 4A). We are unable to tell if the fragmented host mitochondria are a result of normal mitochondrial fission in response to the cellular environment or are being selectively degraded as part of mitophagy. To determine the extent of mitochondrial fragmentation, we classified the mitochondria around the PV as either intact or disrupted from three biological replicate infection experiments (Figure 4B). The percentage of intact mitochondria was 100% at 6 h post-infection, 75.8 ± 3.2% at 12 h post-infection, 47.8 ± 2.5% at 18 h post-infection, 2.9 ± 1.7% at 24 h post-infection, and there were no intact mitochondria present at 30 and 36 h post-infection (Figure 4B). Overall results of this analysis confirm previous studies (de Melo et al., 1992; Lindsay et al., 1993; Sinai et al., 1997; Pernas et al., 2014) showing that the parasite has an impact on mitochondrial morphology during infection, and furthermore that this is dynamic over time post-infection including eventual fragmentation of mitochondria which has not previously been reported (See Supplementary Figure 1).
The presence of fragmented mitochondria has previously been observed prior to apoptotic cell death (Lee et al., 2004). We therefore determined whether this change in mitochondrial morphology was associated with an increase in apoptosis. However, we did not observe any differences in the rate of apoptosis between infected and mock-infected cells from 12 to 36 h post-infection (Figure 5), suggesting that apoptosis is not responsible for the fragmented mitochondrial morphology observed at later time points in T. gondii infected cells.
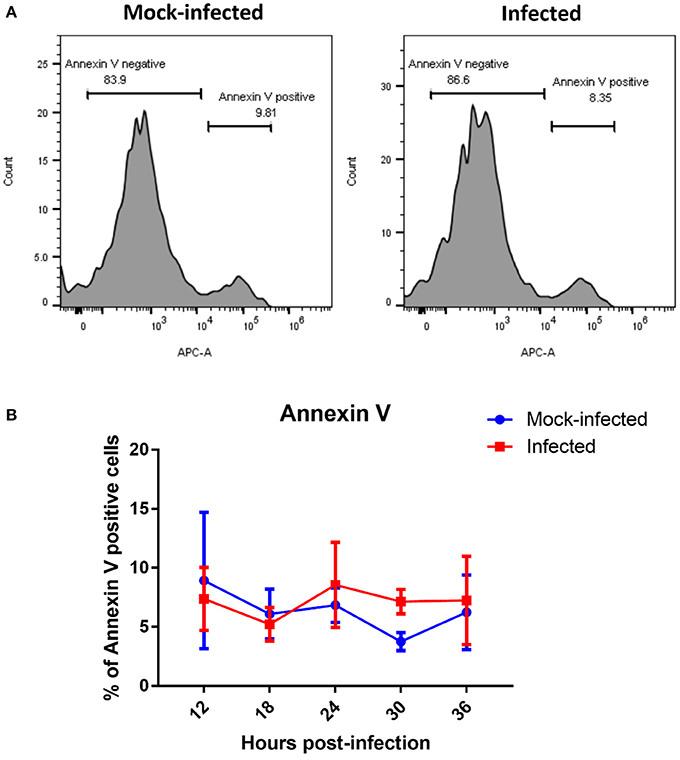
Figure 5. Measurement of apoptotic cells by flow cytometry analysis of Annexin V. (A) Representative histograms of mock-infected and infected cells stained with Annexin V at 36 h post-infection showing bimodal distribution of Annexin V negative non-apoptosing cells and positive apoptosing cells. (B) Analysis of Annexin-V by flow cytometry revealed no significant difference in percentage of Annexin V positive cells between T. gondii mock-infected and infected cells at from 12 to 36 h post-infection. Values represent the mean ± SD of one representative experiment with three replicates. Similar results were obtained in two further experiments (data not shown).
Mitochondrial Superoxide Levels
Mitochondrial oxidative stress can also cause mitochondrial fragmentation (Wu et al., 2011). We therefore measured levels of mitochondrial superoxide as an indicator of oxidative stress over time in T. gondii infected and mock-infected cell populations using the mitochondrial-targeted probe MitoSOXTM Red. This assay fluoresces when oxidized by superoxide, and is mitochondrial specific as the fluorophore is targeted to the mitochondria. We measured mitochondrial superoxide over 36 h post infection, sampling every 6 h, and using flow cytometry to compare median fluorescent intensities between three groups of cells: (i) mock-infected cells; (ii) infected cells (cells containing GFP-expressing parasites); and (iii) uninfected cells (cells from infection culture not containing a GFP-expressing parasite). As GFP-expressing parasites replicate within the cells, the fluorescence intensity of GFP increases over time (Figure 6A) making it possible to distinguish on the scatter plots those cells with multiple parasites, representing replicating infection, from newly infected cells (Figure 6A). We therefore gated on these two different infected cell populations to measure mitochondrial superoxide production over the course of infection (Figure 6A).
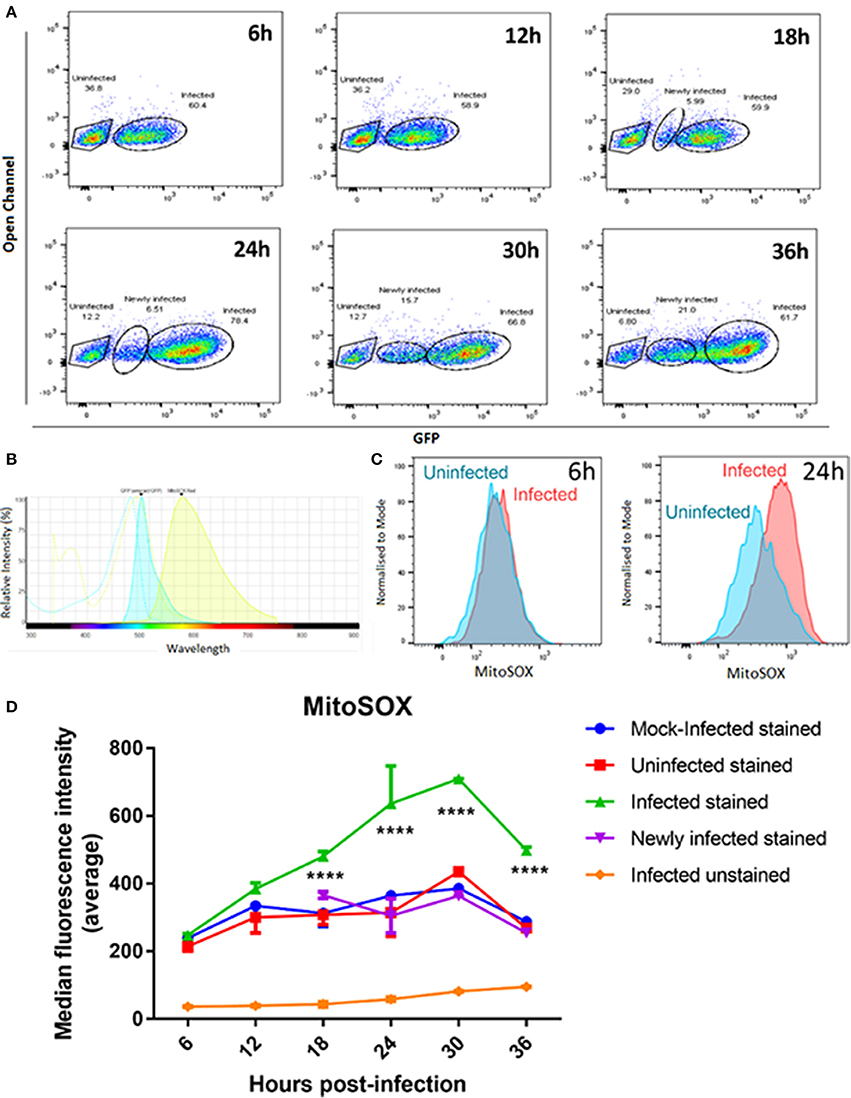
Figure 6. MitoSOXTM staining of mitochondrial superoxide in mock-infected, uninfected, and T. gondii infected cells. (A) Our gating strategy showing the segregation of uninfected, newly infected and infected cells with replicating parasites within the same population. Cells showing lower GFP fluorescence intensities at later time points were treated as a separate group from the infected cell population as they likely represent cells newly infected with GFP-expressing T. gondii. (B) Histogram shows the spectra overlap between GFP and MitoSOXTM fluorophores. (C) Representative histograms showing MitoSOXTM fluorescence intensities of uninfected and T. gondii infected cells. There is a shift of MitoSOXTM fluorescence to the right in infected cells at 24 h post-infection indicating higher levels of mitochondrial superoxide present. (D) Significant increases in superoxide levels in infected cells with replicating parasites (****adjusted p-value < 0.001) compared to either mock-infected, newly-infected or uninfected cells are observed from 18 h post-infection. Values represent the mean values of median fluorescence intensity ± SEM of two experiments with three replicates each.
As there is a small overlap in fluorescence spectrum between GFP and MitoSOXTM fluorophores (Figure 6B) we compared the MitoSOXTM fluorescence in both infected and mock/uninfected cells not stained with MitoSOXTM to determine if the increasing number of GFP-expressing parasites in the cells affected MitoSOXTM fluorescence. There was no significant difference in MitoSOXTM fluorescence intensities between unstained cells infected with GFP-expressing parasites (Figure 6D) and unstained mock- or unstained uninfected cells (data not shown). Thus, bleed-through of GFP fluorescence does not contribute to an increase in MitoSOXTM fluorescence. Uninfected cells behaved in a similar manner to mock-infected cells, i.e., levels of superoxide did not differ significantly between them throughout the 36 h time course (Figure 6D). The newly infected cell population, measured at 18, 24, 30, and 36 h post-infection, also showed no significant difference in superoxide production compared to uninfected cells. This indicates that exclusion of newly infected cells from the infected cell population with replicating parasites observed at the later time points is necessary for accurate measurements of mitochondrial superoxide over the course of infection. In contrast, infected cells with replicating parasites showed a steady increase in superoxide levels post-infection, rising to a 2.5-fold increase at 30 h post-infection before declining at 36 h. Figure 6C shows there is a larger difference in MitoSOXTM staining in T. gondii infected cells at 24 h post-infection compared to uninfected cells than at 6 h post-infection.The levels of superoxide in infected cells with replicating parasites are significantly higher than mock-infected and uninfected cells at 18, 24, 30, and 36 h (Figure 6D). Since we are measuring uninfected cells, newly infected, and cells with established replicating parasites in the same population, these results indicate that stimulation of superoxide is dependent on active parasite invasion and replication of parasites, i.e., that superoxide generation requires intracellular establishment of T. gondii and is not stimulated by factors secreted by the parasite or neighboring infected cells. It is also possible that MitoSOXTM can stain T. gondii-derived superoxide in addition to human mitochondrial superoxide. However, the fact that the highest parasite load occurs concurrent with the maximum decrease in levels of MitoSOXTM at 36 h post-infection (Figure 6D) suggests that parasite-derived superoxide is not contributing significantly to the result.
OXPHOS Complex Protein Levels in Infected Cells
OXPHOS is a process that generates high amounts of energy in the form of adenosine triphosphate (ATP) and is the major contributor of mitochondrial superoxide production. It occurs on the inner membrane on the mitochondria through the four complexes of the electron transport chain (ETC) creating a proton gradient that powers ATP synthase to generate ATP from adenosine diphosphate (ADP) and phosphate. Our gene expression microarray revealed an enrichment of genes with decreased expression in OXPHOS complexes I, III, IV, and V (Figure 3) following T. gondii infection. To determine whether this translated to an effect at the protein level which would subsequently play a role in increased superoxide production observed in T. gondiii infected cells, we compared the protein levels of all five complexes between infected and mock-infected cells at the same infection time points as the MitoSOX experiments.
Western blot analysis was performed using an anti-OXPHOS antibody cocktail targeted to proteins in the different complexes. We were unable to consistently detect the protein band for complex III in our samples (Figure 7A). To investigate whether the anti-OXPHOS antibody cocktail had cross-reacted with parasite mitochondrion, we performed a western blot analysis of preparations of purified proteins from isolated T. gondii parasites. Faint bands were present at the expected sizes for human Complex IV and V which we interpreted as host cell contamination (Figure 7B). As T. gondii are obligate intracellular parasites, protein extraction of purified parasites depended on lysis of infected host cells. Though we used a 5 μm filter to remove host cell debris, host cell fragments may still pass through. No other bands were present that might represent parasite-derived cross-contamination (Figure 7B). As we were unable to definitively rule out cross-species contamination, we checked the protein sequences of the five OXPHOS complex against the Toxoplasma genome using BLAST and there were no homologous sequences within the whole Toxoplasma genome which suggests that these mitochondrial probes have no cross-reactivity.
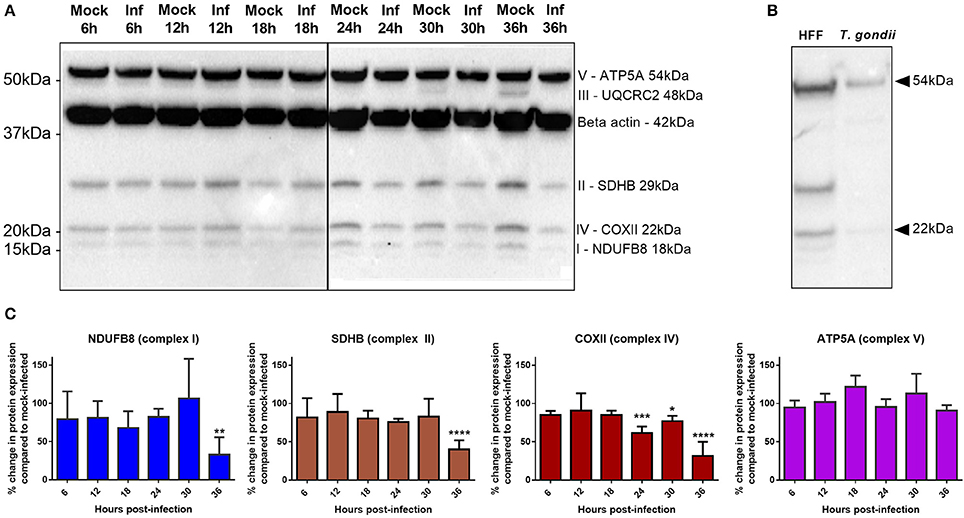
Figure 7. Comparison of OXPHOS protein expression between T. gondii infected cells and mock-infected cells. (A) Western blots of infected and mock-infected cells stained with OXPHOS antibody cocktail and β-actin antibody. Protein bands from complexes I, II, IV, and V and β-actin are consistently detected in our sample while complex III is only detected in mock-infected cells at 30 and 36 h time points in this experiment, and not detected in two repeat experiments (not shown). (B) Western blot of uninfected HFF cells and purified T. gondii parasites stained with OXPHOS antibody cocktail only (no β-actin antibody staining). Presence of faint bands detected at the expected sizes of human Complex IV and V, suggesting host cell contamination. No other bands were present to represent parasite cross-reactivity. (C) Quantitative analysis of the western blots using densitometry (normalized to β-actin) show a significant decrease in complex I and II at 36 h post-infection and a decrease in complex IV from 24 h post-infection. No significant changes in complex V proteins were observed over the time course of these experiments. Values represent mean ± SD of three experiments. (*adjusted p-value = 0.0352 **adjusted p-value = 0.0052, ***adjusted p-value = 0.0002, ****adjusted p-value = <0.0001).
Results show that the protein levels of complexes I, II, IV, and V remain stable up to 18 h post-infection with T. gondii; no significant difference in protein levels is detected up to this time point between infected and mock-infected cells (Figure 7C) or between infected and flow sorted uninfected cells (data not shown). However, from 24 h post-infection complex IV shows a decrease in protein level in infected relative to mock-infected cells, with complexes I and II also showing a significant decrease in protein level at 36 h post-infection. Complex V does not significantly differ in protein level between mock-infected and infected cells at any time point post-infection (Figure 7C).
Mitochondrial Membrane Potential
OXPHOS through the ETC and ATP synthase is reliant on a hyperpolarized mitochondrial membrane potential (MMP) so measurement of MMP allows us to determine if a change in MMP is the underlying cause for decreased OXPHOS protein expression. Using the dual fluorescent JC-1 dye, we could determine whether infection leads to a depolarization of MMP (a shift from red to green fluorescence) using flow cytometry. The drug CCCP, which permeabilizes the inner mitochondrial membrane (Minamikawa et al., 1999) leading to MMP depolarization, was used as a positive control to set the gates for depolarized MMP (Figure 8A). No significant changes were observed in the number of cells with depolarized MMP between infected and mock-infected cells at any time point between 6 and 36 h post-infection (Figure 8B). The MMP of both experimental groups remained steady over time.
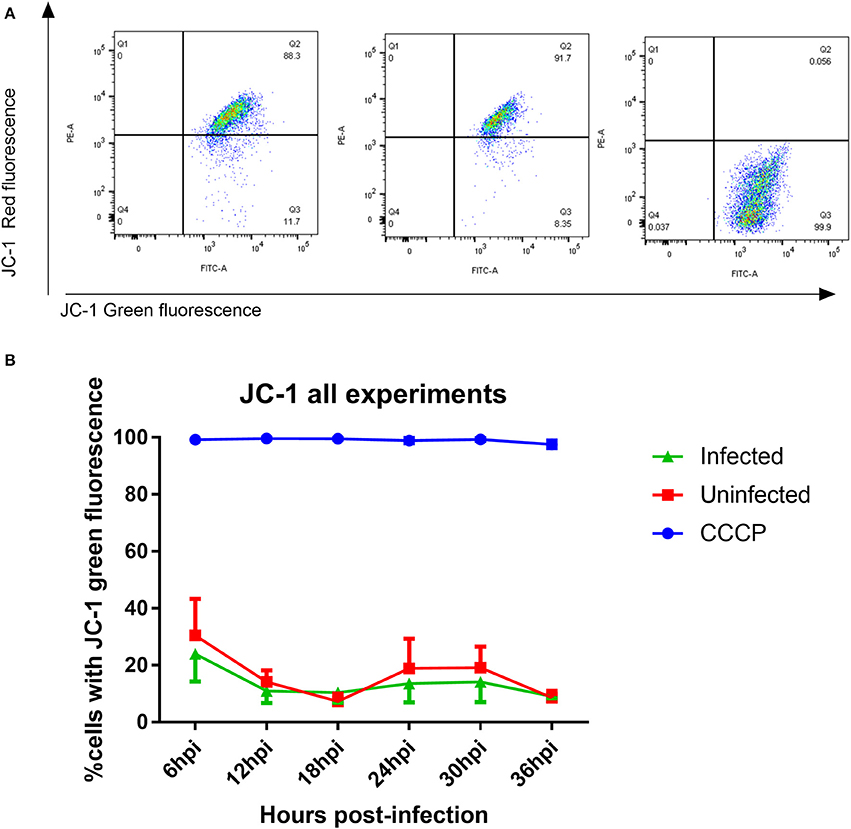
Figure 8. Measurement of mitochondrial membrane potential using JC-1 dye (A) JC-1 analysis of mock-infected and T. gondii infected cells. Changes in red vs. green fluorescence were used to measure mitochondrial membrane potential following infection. CCCP-treated cells were used as positive controls to establish gating strategies. Cells which appear in quadrant 3 represent cells with depolarized mitochondrial membranes. (B) Representative figure showing the mitochondrial membrane potential was stable over time in both infected (green) and mock-infected cells (red). There was no significant difference in mitochondrial membrane potential between infected and uninfected cells. One hundred percent of cells treated with CCCP (blue) had depolarized mitochondrial membranes. Values represent mean percentage of cells with depolarized mitochondrial membrane ± SEM of three experiments with three replicates each.
Discussion
Although host mitochondrial association to T. gondii's PVM has been described for several decades, studies on how T. gondii interacts with the host mitochondria and the role it plays during infection are only recently emerging. The impact of this rapid, strain-specific association is revealed by proteomic (Nelson et al., 2008) and transcriptomic studies (Blader et al., 2001; He et al., 2016), including the present study, showing perturbations of mitochondrial metabolic pathways such as glycolysis (Blader et al., 2001) and OXPHOS [(He et al., 2016) and our study] in T. gondii infected cells. Host mitochondrial association has also been associated with transcriptional changes of host innate immunity (Pernas et al., 2014). Since T. gondii closely interacts with the host mitochondria during infection, we wanted to study in more detail the functional changes of host mitochondria in the acute stages of infection.
Mitochondria undergo continual fission and fusion to maintain their morphology and function in response to stimuli (Chauhan et al., 2014). We therefore examined in detail the changes in host mitochondrial morphology that occurred over the course of a 36 h infection in-vitro. Consistent with previous studies (Sinai et al., 1997; Sinai and Joiner, 2001; Pernas et al., 2014), we observed recruitment and apparent enlargement of mitochondria to the PVM early in the infection. However, as infection progressed beyond 24 h, we observed the presence of fragmented host mitochondria surrounding the PVM that has not previously been reported. This likely reflects the fact that no previous studies have followed mitochondrial changes for more than 24 h post-infection. Mitochondrial fragmentation has been linked to cellular apoptosis (Lee et al., 2004) but our Annexin V assay showed no increase in cells undergoing apoptotic death following T. gondii infection. Since mitochondrial morphology is clearly impacted by T. gondii infection, we undertook further studies to determine whether there were effects on mitochondrial function.
Mitochondrial superoxide production, OXPHOS, and mitochondrial membrane potential are intrinsically linked. Electrons transferred through the ETC comprising complexes I to IV generate the mitochondrial proton motive force across the inner mitochondrial membrane used to power ATP synthase (also known as Complex V) to generate ATP from ADP and phosphate. The proton motive force consists of two components; the mitochondrial membrane potential, which represents the major portion of the proton motive force, and the pH difference across the inner mitochondrial membrane. The proton motive force regulates the activity of the ETC complexes: high membrane potential inhibits further proton pumping, whereas a decrease of proton motive force through proton utilization e.g., by ATP synthase, would allow the ETC to re-establish the proton motive force (Hüttemann et al., 2008). During the process of OXPHOS, electrons may leak from the ETC Complexes I and III and react with oxygen to form superoxide. In our study, we observed an increase in mitochondrial superoxide production without the concomitant increase in OXPHOS complexes or changes in mitochondrial membrane potential usually observed in OXPHOS. This suggests that the increase in superoxide production may not be due to an increase in aerobic respiration through OXPHOS. This is supported by our transcriptomic data indicating a down-regulation of OXPHOS following T. gondii infection and our western blot analyses showing decreased protein expression of Complex IV at 24–36 h post-infection, and decreases in Complexes I and II at 36 h post-infection.
Conversely, decreased OXPHOS has also been shown to increase superoxide levels (Dawson et al., 1993; Batandier et al., 2006; Murphy, 2009). A reduced ETC may stimulate superoxide formation by Complex III by favoring reverse electron transfer from Complex II to Complex I (Batandier et al., 2006; Murphy, 2009) and inhibition of Complex IV enhances superoxide generation by increased reduction of redox centers in complex I or complex III promoting electron leak and ROS generation from these complexes (Dawson et al., 1993). A down-regulation of OXPHOS is usually accompanied by increased cellular glycolysis, the process of breaking down glucose into pyruvate, which feeds into the citric acid cycle producing substrates such as NADH and FADH for OXPHOS complexes to generate ATP. A high glycolytic flux, which is the rate at which molecules pass through glycolysis, has been associated with enhanced superoxide production (Zhou et al., 2005). Several studies have shown increased host glycolysis following T. gondii infection (Blader et al., 2001; Nelson et al., 2008; Menendez et al., 2015) which is regulated by host HIF-1α (a hub gene in our network) and hexokinase 2 (HK2) (Menendez et al., 2015). Activation of HIF-1α and HK2 is dependent on mTOR complex 2 (mTORC2) (Toschi et al., 2008; Betz et al., 2013), previously shown to play a central role in mitochondrial distribution following T. gondii infection (Wang et al., 2010). Consistent with this, we observed enrichment of differentially expressed genes in the mTOR pathway, while RICTOR, a component of mTORC2, was the top predicted endogenous upstream regulator with increased activity. RICTOR knockdown leads to an increase in mitochondrial respiration (Schieke et al., 2006) and dysregulation of mTORC2 is associated with mitochondrial defects (Betz et al., 2013). Through Akt signaling, mTORC2 promotes HK2 phosphorylation of glucose stimulating glycolysis (Hagiwara et al., 2012). HK2 is also associated with switching cellular metabolism from OXPHOS to glycolysis (Wolf et al., 2011).
Given the down-regulation of OXPHOS complexes in T. gondii infected cells, it is of interest to consider how the mitochondrion is maintaining its ETC-reliant membrane potential. The glycolysis process itself generates ATP but with much less efficiency than OXPHOS. In cells that rely heavily on aerobic glycolysis instead of OXPHOS for energy, glycolytic ATP is essential for maintaining the mitochondrial membrane potential and preventing apoptotic death (Chevrollier et al., 2011). Adenine nucleotide translocator 2 (ANT2) imports glycolytic ATP into the mitochondria which the reversible proton pump ATP synthase (OXPHOS Complex V) then hydrolyses to pump protons back into the inner mitochondrial membrane to sustain the mitochondrial membrane potential (Chevrollier et al., 2011). This could explain the lack of change in mitochondrial membrane potential and ATP synthase protein expression in T. gondii infected cells we observed despite increased levels of superoxide production and a down-regulation of ETC protein expression.
As glycolytic flux is regulated by glucose uptake, we hypothesize that there is increased glucose uptake in a T. gondii infected cell. This would be consistent with our observation that D-glucose was a strongly predicted endogenous upstream regulator, influencing expression of multiple genes including the hub genes FN1 and HIF-1α. Exposing cells to high glucose in-vitro has been shown to induce mitochondrial fragmentation by fission through glucose-dependent ROS overproduction (Yu et al., 2006). This, in turn, may account for the fragmented mitochondria seen occurring from 24 h post-infection. It was previously proposed that a change in mitochondrial morphology is required to produce more ROS, possibly due to a bigger relative membrane surface (Yu et al., 2006). In recent years, ROS production has been shown to play a role in signaling between mitochondria and other cellular processes in response to stress (Sena and Chandel, 2012). However, when production of ROS is left unchecked, this can lead to oxidative stress and, in turn, mitochondrial dysfunction.
Recently, maternal infection with T. gondii Wh3 isolate of genotype Chinese 1 strain was observed to induce mitochondrial dysfunction associated trophoblast apoptosis in pregnant mice (Xu et al., 2015). Of interest, transcriptomic analysis of mitochondria-DNA depleted breast epithelial cells and normal cells undertaken to understand pathogenesis of breast tumorigenesis (Kulawiec et al., 2008) revealed increased expression of FN1, which was also the hub gene of one of the major gene networks identified in their study. The observation of FN1 as a focal gene in seemingly unrelated diseases suggests that FN1 may have a role in the pathogenesis of diseases stemming from dysfunctional mitochondria. On a systemic level, mitochondrial dysfunction can affect multiple organs in the body but the organs most affected are those which require the highest mitochondrial activity such as the eye, brain, and muscle. These organs have large numbers of mitochondria to cope with their increased cellular metabolic needs. Mitochondrial dysfunction has been linked to ophthalmic, neurological, and muscular diseases such as Leber's hereditary optic neuropathy (Brown, 1999) and Leigh's syndrome (Thorburn et al., 1993–2017). This is of interest in relation to our study as T. gondii preferentially infects the eye, brain and muscles. The eye and brain are also sites of clinical manifestations following T. gondii infection; for example, the classic triad of retinochorioditis, hydrocephalus, and intracranial calcifications in congenital toxoplasmosis, and toxoplasmic encephalitis in immunosuppressed patients with acquired toxoplasmosis. Mitochondrial dysfunction is also associated with neurodegenerative diseases such as Parkinson's disease (Miman et al., 2010), Alzheimer's disease (Kusbeci et al., 2011), and schizophrenia (Prabakaran et al., 2004). Again, this is of interest as associations between T. gondii infection and Parkinson's, Alzheimer's disease (Kusbeci et al., 2011; Jung et al., 2012) and schizophrenia (Wang et al., 2013) have been proposed. These findings suggest that the disruption of host mitochondria may play a role in the pathogenesis of toxoplasmosis and clinical signs observed in congenital and acquired infections.
In summary, our transcriptomic data, supported by the characterization of host mitochondrial parameters such as morphology, superoxide production, OXPHOS protein levels, and membrane potential, suggest a perturbation of the host mitochondrial processes following T. gondii infection. It is unclear whether these modified mitochondrial functions occur as a consequence of the host response to T. gondii or direct manipulation by the parasite. Previous transcriptional (Ngô et al., 2017) and functional studies (Pernas et al., 2014) have indicated that the effects on host mitochondria following infection are strain-specific. Current literature (Xu et al., 2015) and our study have reported perturbations in host mitochondrial functions of experimental models infected only with the Type I mouse-virulent strains. Thus, further studies should be carried out to characterize the host mitochondrial functions of cells infected with other T. gondii strains. Mitochondria with decreased functions have been implicated in ophthalmological and neural disease, including neurodegenerative and psychiatric disorders, thus providing new avenues for research into the clinical signs of both congenital and acquired toxoplasmosis.
Author Contributions
GS, DA, JB, and SJ: Conceived and designed the experiments; GS: Performed the experiments; GS, DA: Analyzed the data; GS, DA, JB, and SJ: Wrote the paper.
Conflict of Interest Statement
The authors declare that the research was conducted in the absence of any commercial or financial relationships that could be construed as a potential conflict of interest.
Acknowledgments
This research was supported by the seed funding grant provided by the Wesfarmers Centre of Vaccines and Infectious Disease. We like to thanks Dr. Arunesh Mohandas and Dr. Tamara Abel from the Telethon Kids Institute for sharing their technical expertise on flow cytometry and confocal microscopy respectively.
Supplementary Material
The Supplementary Material for this article can be found online at: https://www.frontiersin.org/articles/10.3389/fcimb.2017.00512/full#supplementary-material
Supplementary Figure 1. Toxoplasma gondii infected cells show distinct morphology changes when compared to mock-infected cells at their respective time-points. HFF cells were infected with GFP-expressing T. gondii (green) for 36 h and labeled with Mitotracker TM Orange (red) and DAPI (Blue) to stain the mitochondria and nucleus, respectively.
Supplementary Table 1. List of genes that are differentially expressed at each time-point. Genes that have an adjusted p-value of <0.05 and a fold change >1.5 are deemed to be differentially expressed. Genes highlighted in yellow play a role in inter-related pathways oxidative phosphorylation and mitochondrial dysfunction.
References
Antico Arciuch, V. G., Elguero, M. E., Poderoso, J. J., and Carreras, M. C. (2012). Mitochondrial regulation of cell cycle and proliferation. Antioxid. Redox Signal. 16, 1150–1180. doi: 10.1089/ars.2011.4085
Barbosa-Morais, N. L., Dunning, M. J., Samarajiwa, S. A., Darot, J. F., Ritchie, M. E., Lynch, A. G., et al. (2010). A re-annotation pipeline for Illumina BeadArrays: improving the interpretation of gene expression data. Nucleic Acids Res. 38:e17. doi: 10.1093/nar/gkp942
Batandier, C., Guigas, B., Detaille, D., El-Mir, M. Y., Fontaine, E., Rigoulet, M., et al. (2006). The ROS production induced by a reverse-electron flux at respiratory-chain complex 1 is hampered by metformin. J. Bioenerg. Biomembr. 38, 33–42. doi: 10.1007/s10863-006-9003-8
Benjamini, Y., and Hochberg, Y. (1995). Controlling the false discovery rate: a practical and powerful approach to multiple testing. J. R. Stat. Soc. Ser. B 57, 289–300.
Betz, C., Stracka, D., Prescianotto-Baschong, C., Frieden, M., Demaurex, N., and Hall, M. N. (2013). mTOR complex 2-Akt signaling at mitochondria-associated endoplasmic reticulum membranes (MAM) regulates mitochondrial physiology. Proc. Natl. Acad. Sci. U.S.A. 110, 12526–12534. doi: 10.1073/pnas.1302455110
Blader, I. J., Manger, I. D., and Boothroyd, J. C. (2001). Microarray analysis reveals previously unknown changes in Toxoplasma gondii-infected human cells. J. Biol. Chem. 276, 24223–24231. doi: 10.1074/jbc.M100951200
Brown, M. D. (1999). The enigmatic relationship between mitochondrial dysfunction and Leber's hereditary optic neuropathy. J. Neurol. Sci. 165, 1–5. doi: 10.1016/S0022-510X00087-8
Chauhan, A., Vera, J., and Wolkenhauer, O. (2014). The systems biology of mitochondrial fission and fusion and implications for disease and aging. Biogerontology 15, 1–12. doi: 10.1007/s10522-013-9474-z
Chevrollier, A., Loiseau, D., Reynier, P., and Stepien, G. (2011). Adenine nucleotide translocase 2 is a key mitochondrial protein in cancer metabolism. Biochim. Biophys. Acta 1807, 562–567. doi: 10.1016/j.bbabio.2010.10.008
Dawson, T. L., Gores, G. J., Nieminen, A. L., Herman, B., and Lemasters, J. J. (1993). Mitochondria as a source of reactive oxygen species during reductive stress in rat hepatocytes. Am. J. Physiol. 264(4 Pt 1), C961–C967.
de Melo, E. J., de Carvalho, T. U., and de Souza, W. (1992). Penetration of Toxoplasma gondii into host cells induces changes in the distribution of the mitochondria and the endoplasmic reticulum. Cell Struct. Funct. 17, 311–317. doi: 10.1247/csf.17.311
Du, P., Kibbe, W. A., and Lin, S. M. (2008). lumi: a pipeline for processing Illumina microarray. Bioinformatics 24, 1547–1548. doi: 10.1093/bioinformatics/btn224
Edgar, R., Domrachev, M., and Lash, A. E. (2002). Gene Expression omnibus: NCBI gene expression and hybridization array data repository. Nucleic Acids Res. 30, 207–210. doi: 10.1093/nar/30.1.207
Goebel, S., Gross, U., and Lüder, C. G. (2001). Inhibition of host cell apoptosis by Toxoplasma gondii is accompanied by reduced activation of the caspase cascade and alterations of poly(ADP-ribose) polymerase expression. J. Cell Sci. 114(Pt 19), 3495–3505.
Hagiwara, A., Cornu, M., Cybulski, N., Polak, P., Betz, C., Trapani, F., et al. (2012). Hepatic mTORC2 activates glycolysis and lipogenesis through Akt, glucokinase, and SREBP1c. Cell Metab. 15, 725–738. doi: 10.1016/j.cmet.2012.03.015
He, J. J., Ma, J., Li, F. C., Song, H. Q., Xu, M. J., and Zhu, X. Q. (2016). Transcriptional changes of mouse splenocyte organelle components following acute infection with Toxoplasma gondii. Exp. Parasitol. 167, 7–16. doi: 10.1016/j.exppara.2016.04.019
Hüttemann, M., Lee, I., Pecinova, A., Pecina, P., Przyklenk, K., and Doan, J. W. (2008). Regulation of oxidative phosphorylation, the mitochondrial membrane potential, and their role in human disease. J. Bioenerg. Biomembr. 40, 445–456. doi: 10.1007/s10863-008-9169-3
Jung, B.-K., Pyo, K.-H., Shin, K. Y., Hwang, Y. S., Lim, H., Lee, S. J., et al. (2012). Toxoplasma gondii infection in the brain inhibits neuronal degeneration and learning and memory impairments in a murine model of Alzheimer's disease. PLoS ONE 7:e33312. doi: 10.1371/journal.pone.0033312
Kulawiec, M., Safina, A., Desouki, M. M., Still, I., Matsui, S., Bakin, A., et al. (2008). Tumorigenic transformation of human breast epithelial cells induced by mitochondrial DNA depletion. Cancer Biol. Ther. 7, 1732–1743. doi: 10.4161/cbt.7.11.6729
Kusbeci, O. Y., Miman, O., Yaman, M., Aktepe, O. C., and Yazar, S. (2011). Could Toxoplasma gondii have any role in Alzheimer disease? Alzheimer Dis. Assoc. Disord. 25, 1–3. doi: 10.1097/WAD.0b013e3181f73bc2
Lambert, H., and Barragan, A. (2010). Modelling parasite dissemination: host cell subversion and immune evasion by Toxoplasma gondii. Cell. Microbiol. 12, 292–300. doi: 10.1111/j.1462-5822.2009.01417.x
Lee, Y. J., Jeong, S. Y., Karbowski, M., Smith, C. L., and Youle, R. J. (2004). Roles of the mammalian mitochondrial fission and fusion mediators Fis1, Drp1, and Opa1 in apoptosis. Mol. Biol. Cell 15, 5001–5011. doi: 10.1091/mbc.E04-04-0294
Lindsay, D. S., Mitschler, R. R., Toivio-Kinnucan, M. A., Upton, S. J., Dubey, J. P., and Blagburn, B. L. (1993). Association of host cell mitochondria with developing Toxoplasma gondii tissue cysts. Am. J. Vet. Res. 54, 1663–1667.
Lüder, C. G., and Gross, U. (2005). Apoptosis and its modulation during infection with Toxoplasma gondii: molecular mechanisms and role in pathogenesis. Curr. Top. Microbiol. Immunol. 289, 219–237. doi: 10.1007/3-540-27320-4_10
Magno, R. C., Straker, L. C., de Souza, W., and Attias, M. (2005). Interrelations between the parasitophorous vacuole of Toxoplasma gondii and host cell organelles. Microsc. Microanal. 11, 166–174. doi: 10.1017/S1431927605050129
Menendez, M. T., Teygong, C., Wade, K., Florimond, C., and Blader, I. J. (2015). siRNA screening identifies the host hexokinase 2 (HK2) gene as an important hypoxia-inducible transcription factor 1 (HIF-1) target gene in Toxoplasma gondii-infected cells. MBio 6:e00462. doi: 10.1128/mBio.00462-15
Miman, O., Kusbeci, O. Y., Aktepe, O. C., and Cetinkaya, Z. (2010). The probable relation between Toxoplasma gondii and Parkinson's disease. Neurosci. Lett. 475, 129–131. doi: 10.1016/j.neulet.2010.03.057
Minamikawa, T., Williams, D. A., Bowser, D. N., and Nagley, P. (1999). Mitochondrial permeability transition and swelling can occur reversibly without inducing cell death in intact human cells. Exp. Cell Res. 246, 26–37. doi: 10.1006/excr.1998.4290
Molestina, R. E., El-Guendy, N., and Sinai, A. P. (2008). Infection with Toxoplasma gondii results in dysregulation of the host cell cycle. Cell. Microbiol. 10, 1153–1165. doi: 10.1111/j.1462-5822.2008.01117.x
Murphy, M. P. (2009). How mitochondria produce reactive oxygen species. Biochem. J. 417, 1–13. doi: 10.1042/BJ20081386
Nelson, M. M., Jones, A. R., Carmen, J. C., Sinai, A. P., Burchmore, R., and Wastling, J. M. (2008). Modulation of the host cell proteome by the intracellular apicomplexan parasite Toxoplasma gondii. Infect. Immun. 76, 828–844. doi: 10.1128/IAI.01115-07
Ngô, H. M., Zhou, Y., Lorenzi, H., Wang, K., Kim, T. K., Zhou, Y., et al. (2017). Toxoplasma modulates signature pathways of human epilepsy, neurodegeneration & cancer. Sci. Rep. 7:11496. doi: 10.1038/s41598-017-10675-6
Pernas, L., Adomako-Ankomah, Y., Shastri, A. J., Ewald, S. E., Treeck, M., Boyle, J. P., et al. (2014). Toxoplasma effector MAF1 mediates recruitment of host mitochondria and impacts the host response. PLoS Biol. 12:e1001845. doi: 10.1371/journal.pbio.1001845
Prabakaran, S., Swatton, J. E., Ryan, M. M., Huffaker, S. J., Huang, J. T., Griffin, J. L., et al. (2004). Mitochondrial dysfunction in schizophrenia: evidence for compromised brain metabolism and oxidative stress. Mol. Psychiatry 9, 684–697, 643. doi: 10.1038/sj.mp.4001511
Ritchie, M. E., Phipson, B., Wu, D., Hu, Y., Law, C. W., Shi, W., et al. (2015). limma powers differential expression analyses for RNA-sequencing and microarray studies. Nucleic Acids Res. 43:e47. doi: 10.1093/nar/gkv007
Schieke, S. M., Phillips, D., McCoy, J. P. Jr., Aponte, A. M., Shen, R. F., Balaban, R. S., et al. (2006). The mammalian target of rapamycin (mTOR) pathway regulates mitochondrial oxygen consumption and oxidative capacity. J. Biol. Chem. 281, 27643–27652. doi: 10.1074/jbc.M603536200
Schneider, C. A., Rasband, W. S., and Eliceiri, K. W. (2012). NIH Image to ImageJ: 25 years of image analysis. Nat. Methods 9, 671–675. doi: 10.1038/nmeth.2089
Sena, L. A., and Chandel, N. S. (2012). Physiological roles of mitochondrial reactive oxygen species. Mol. Cell 48, 158–167. doi: 10.1016/j.molcel.2012.09.025
Sinai, A. P., and Joiner, K. A. (2001). The Toxoplasma gondii protein ROP2 mediates host organelle association with the parasitophorous vacuole membrane. J. Cell Biol. 154, 95–108. doi: 10.1083/jcb.200101073
Sinai, A. P., Webster, P., and Joiner, K. A. (1997). Association of host cell endoplasmic reticulum and mitochondria with the Toxoplasma gondii parasitophorous vacuole membrane: a high affinity interaction. J. Cell. Sci. 110(Pt 17), 2117–2128.
Thorburn, D. R., Rahman, J., and Rahman, S. (1993–2017). “Mitochondrial DNA-associated Leigh syndrome NARP,” in GeneReviews®, eds M. P. Adam, H. H. Ardinger, R. A. Pagon, S. E. Wallace, L. J. H. Bean, H. C. Mefford, K. Stephens, A. Amemiya, N. Ledbetter (Seattle, WA: University of Washington). Available online at: https://www.ncbi.nlm.nih.gov/books/NBK1173/ (retrieved from NCBI Bookshelf) (Oct 30, 2003; Updated Sep 28, 2017).
Toschi, A., Lee, E., Gadir, N., Ohh, M., and Foster, D. A. (2008). Differential dependence of hypoxia-inducible factors 1 alpha and 2 alpha on mTORC1 and mTORC2. J. Biol. Chem. 283, 34495–34499. doi: 10.1074/jbc.C800170200
Wang, C., and Youle, R. J. (2009). The role of mitochondria in apoptosis*. Annu. Rev. Genet. 43, 95–118. doi: 10.1146/annurev-genet-102108-134850
Wang, T., Tang, Z. H., Li, J. F., Li, X. N., Wang, X., and Zhao, Z. J. (2013). A potential association between Toxoplasma gondii infection and schizophrenia in mouse models. Exp. Parasitol. 135, 497–502. doi: 10.1016/j.exppara.2013.08.012
Wang, Y., Weiss, L. M., and Orlofsky, A. (2010). Coordinate control of host centrosome position, organelle distribution, and migratory response by Toxoplasma gondii via host mTORC2. J. Biol. Chem. 285, 15611–15618. doi: 10.1074/jbc.M109.095778
West, A. P., Shadel, G. S., and Ghosh, S. (2011). Mitochondria in innate immune responses. Nat. Rev. Immunol. 11, 389–402. doi: 10.1038/nri2975
Wolf, A., Agnihotri, S., Micallef, J., Mukherjee, J., Sabha, N., Cairns, R., et al. (2011). Hexokinase 2 is a key mediator of aerobic glycolysis and promotes tumor growth in human glioblastoma multiforme. J. Exp. Med. 208, 313–326. doi: 10.1084/jem.20101470
Wu, S., Zhou, F., Zhang, Z., and Xing, D. (2011). Mitochondrial oxidative stress causes mitochondrial fragmentation via differential modulation of mitochondrial fission-fusion proteins. FEBS J. 278, 941–954. doi: 10.1111/j.1742-4658.2011.08010.x
Xu, X., He, L., Zhang, A., Li, Q., Hu, W., Chen, H., et al. (2015). Toxoplasma gondii isolate with genotype Chinese 1 triggers trophoblast apoptosis through oxidative stress and mitochondrial dysfunction in mice. Exp. Parasitol. 154, 51–61. doi: 10.1016/j.exppara.2015.04.008
Yu, T., Robotham, J. L., and Yoon, Y. (2006). Increased production of reactive oxygen species in hyperglycemic conditions requires dynamic change of mitochondrial morphology. Proc. Natl. Acad. Sci. U.S.A. 103, 2653–2658. doi: 10.1073/pnas.0511154103
Zhou, J., Deo, B. K., Hosoya, K., Terasaki, T., Obrosova, I. G., Brosius, F. C. III, et al. (2005). Increased JNK phosphorylation and oxidative stress in response to increased glucose flux through increased GLUT1 expression in rat retinal endothelial cells. Invest. Ophthalmol. Vis. Sci. 46, 3403–3410. doi: 10.1167/iovs.04-1064
Keywords: Toxoplasma gondii, mitochondria dysfunction, oxidative phosphorylation, gene expression profiling, membrane potential, mitochondrial superoxide, congenital toxoplasmosis, latent toxoplasmosis
Citation: Syn G, Anderson D, Blackwell JM and Jamieson SE (2017) Toxoplasma gondii Infection Is Associated with Mitochondrial Dysfunction in-Vitro. Front. Cell. Infect. Microbiol. 7:512. doi: 10.3389/fcimb.2017.00512
Received: 27 September 2017; Accepted: 28 November 2017;
Published: 12 December 2017.
Edited by:
Lilach Sheiner, Wellcome Trust Centre for Molecular Parasitology (WT), United KingdomReviewed by:
Wanderley De Souza, Universidade Federal do Rio de Janeiro, BrazilEva Frickel, Francis Crick Institute, United Kingdom
Copyright © 2017 Syn, Anderson, Blackwell and Jamieson. This is an open-access article distributed under the terms of the Creative Commons Attribution License (CC BY). The use, distribution or reproduction in other forums is permitted, provided the original author(s) or licensor are credited and that the original publication in this journal is cited, in accordance with accepted academic practice. No use, distribution or reproduction is permitted which does not comply with these terms.
*Correspondence: Genevieve Syn, genevieve.syn@telethonkids.org.au