Adaptation Planning: An Integrated Approach to Understanding Vulnerability in the Lake Victoria Basin
 Celia Petty1,2*
  Stella Ngoleka2 Rosalind Cornforth1 Eunice Achiro3 James Acidri2
  Andrew Ainslie5
  John Owuor4
  Grady Walker1
- 1Walker Institute, University of Reading, Reading, United Kingdom
- 2Evidence for Development, Reading, United Kingdom
- 3Faculty of Science, Gulu University, Gulu, Uganda
- 4Department of Development Studies, Maseno University, Kisumu, Kenya
- 5School of Agriculture, Policy and Development, University of Reading, Reading, United Kingdom
Decision makers need actionable information on the factors that inhibit household adaptation to climate variability and other changes, especially those changes reinforcing environmentally unsustainable livelihood strategies. In this paper, we show how a combination of quantitative and qualitative data can help assess current livelihood vulnerability and the social and institutional obstacles facing specific population groups that lock in risk and undermine opportunities. Detailed analysis of current household economies in two case study communities (one in Uganda and one in Kenya) in the Lake Victoria Basin, East Africa, was combined with a qualitative, intersectional exploration of constraints on income adaptation and diversification. Quantitative household economy analysis showed low levels of household disposable income overall and additionally, poor returns on investment from enterprises typically controlled by women. Qualitative research highlighted changes in gender roles driven by women's entrepreneurial responses to reduced household income from traditional agricultural and natural resource-based activities. However, due to unequal access to finance and culturally mediated norms and expectations, many women's enterprises were small scale and insecure. The broader political economy context is one of limited national investment in education and infrastructure, further constraining local opportunities for human and economic development. The approach described here was directed by the need to understand and quantify economic vulnerability, along with the cultural and institutional constraints on adaptation, as a basis for making better adaptation policies and interventions to build resilience over the longer term.
Introduction
Adaptive capacity is influenced by actors' abilities to capitalize on available opportunities that ease the planning and implementation of adaptation as well as constraints that make adaptation processes more difficult for both human and natural systems (Klein et al., 2014).
In the past decade, many discipline-based guidelines, frameworks and indices have addressed environmental and social aspects of adaptation and resilience (Patel et al., 2017; Tanner et al., 2017). Miller et al. (2010) have called for the conceptual insights that have emerged from these discipline-based approaches to adaptation, to be “translated into operational assessment methodologies, guidelines, and procedures that are easily accessible to practitioners and decision makers.”
The approach described in this study was directed by the need to understand and quantify the economic, as well as the cultural and institutional constraints on adaptation, as a basis for actionable policies and interventions and was designed to address the immediate problem: “What information do local policy and decision makers need now, to reduce vulnerability and enhance resilience?” To ensure that these measures are timely, proportionate, and well-targeted we show how a combination of disaggregated quantitative and qualitative data can be assembled by local teams to assess current vulnerability and adaptive capability. This information can be used to identify those social and economic obstacles that lock in risk and undermine opportunities among specific population groups, providing the robust, policy relevant evidence required for building resilience over the longer term.
The wealth of research driven by the climate emergency has produced new understandings of the nature and limits of resilience and adaptive capability in poor rural communities (e.g., Tanner et al., 2014; Clay, 2017; Ford et al., 2018; Hallegatte et al., 2018; Singh et al., 2019); these have highlighted the incremental drivers of vulnerability, with an increasing focus on the role of gender and intersectional issues in shaping responses (Nyantakyi-Frimpong and Bezner-Kerr, 2015; Call and Sellers, 2019). This work has also shown the importance of collaboration across disciplines (e.g., Furberg et al., 2018) as a key element in both scenario development work (Birkmann et al., 2015) and the exploration of adaptation pathways (Wise et al., 2014). Adaptation pathways research has also opened new avenues for better integration and dialogue between disciplines (Werners et al., 2021).
Despite this high level of activity, policy makers still face the practical dilemma: “How can these insights be put to work, to address immediate and compelling problems of marginality and poverty?” Quantitative climate and livelihoods data, combined with local testimony and deliberation, are needed to guide short term interventions and populate the “what if” models that are increasingly used to explore livelihood and environmental tipping points (Haasnoot et al., 2013; Young et al., 2020).
This study was undertaken as part of the multi-disciplinary HyCRISTAL project (http://www.walker.ac.uk/research/projects/hycristal-integrating-hydro-climate-science-into-policy-decisions-for-climate-resilient-infrastructure-and-livelihoods/), within the FCDO/NERC Future Climate for Africa programme (FCFA) (https://futureclimateafrica.org). FCFA aims to generate “fundamentally new climate science focused on Africa, and to ensure that this science has an impact on human development across the continent.” Case study material draws on data from field research conducted in the Lake Victoria Basin which used both quantitative and qualitative methods to explore different dimensions of livelihood resilience and vulnerability, in populations where climate change was just one of many factors impacting on the ability of households to adapt to contemporary challenges. The methods used are replicable, bridge the “quantitative-qualitative” divide (Onwuegbuzie and Leech, 2005) and are designed to provide policy and decision makers with a comprehensive, evidence-based understanding of the boundaries of resilience and adaptation, from local to national and international levels.
The Individual Household Method (IHM; Seaman et al., 2014) was selected for the quantitative livelihood analysis, based on its rigorous approach to data collection and the empirical insight it provides into the sensitivity of households to different shocks or changes affecting their livelihoods. This includes:
• A measure of disposable Income (Figure 4A).
• Detailed analysis of the main sources of cash income (Figure 4B).
• Analysis of the main sources of food (Figure 4C).
• A detailed breakdown of the main crops grown (Figure 6).
• Asset holdings including land, livestock (Figure 4D)
The quantitative IHM data was complemented by a series of age- and gender-differentiated focus group interviews at each site, conducted by experienced social scientists and using a common protocol. Discussions focused on current livelihood options, changes that had taken place in recent decades, investment opportunities and other factors that influenced livelihood choices.
The Household Economy Approach (HEA) and the Individual Household Method (IHM): Background and Extent of Use.
The Household Economy Approach (HEA) was developed in the 1990's as a method of famine prediction that could be applied at scale, to predict the impact of a defined shock e.g., crop failure, on the income and food access of defined population groups, and provide governments and donors with relevant information e.g., to determine the amount of food aid or cash required to avoid the forced sale of assets (Seaman et al., 2014). The HEA is well-established and used by USAID FEWSNET and governments, UN agencies and others across Africa and in parts of the Middle East, the Caribbean, and South Asia, to assess food security at national level (see www.fews.net). The Individual Household Method (IHM) is an extension of the Household Economy Approach.
HEA arose from Amartya Sen's entitlement theory of famine (Sen, 1981), with its key insight that famine was caused by people's inability to access food, rather than the absence of food. Understanding how a crop failure or some other “shock” will affect people's food access requires knowledge of the way in which people normally acquire food and cash income, how this varies from place to place and between poorer and better off households, and the ability of households to “cope.” The HEA was designed to collect this data set quickly and at scale (Seaman et al., 2014), and is now widely and successfully used by governments and donors and NGOs across sub-Saharan Africa.
The extensive HEA experience of gathering income data suggested that a similar method based on individual household measurements would be useful where a more detailed understanding of poverty and the variation in poverty within populations is needed. The IHM was developed for this purpose and has proved to be a valuable research tool. It has been used by researchers and non-government agencies for project baseline and impact studies and for longitudinal monitoring in FCDO and Irish Aid funded programmes (Petty and Savage, 2007; Petty and Ellis, 2015a).
The IHM provides a measure of household disposable income (i.e., cash remaining after the household has met its basic food energy requirements) and a “standard of living threshold,” indicating a level of income sufficient to meet social inclusion norms in the study sites. This data is crucial in understanding the potential capability of households to invest, pay interest on loans and cope with natural disasters, price shocks, and adverse life events. Resilience and adaptive capability are indicated by levels of disposable income and by asset holdings, which are documented in the household interview. Customized software (OpenIHM)1 is used to analyse the IHM survey data This allows users to explore the impact of different shocks on all sources of household income, which are comprehensively documented in household interviews, and hence to identify the characteristics of specific threats or risks in relation to different population groups. Users can generate reports on income sources, land, livestock and other assets, and can compare households with different demographic characteristics (e.g., female headed/non female headed).
Figure 1 shows levels of data collection in HEA and IHM studies, and the greater level of disaggregation possible in IHM studies. Data is collected at an individual household level in IHM studies, and at “Wealth Group” level in HEA studies.
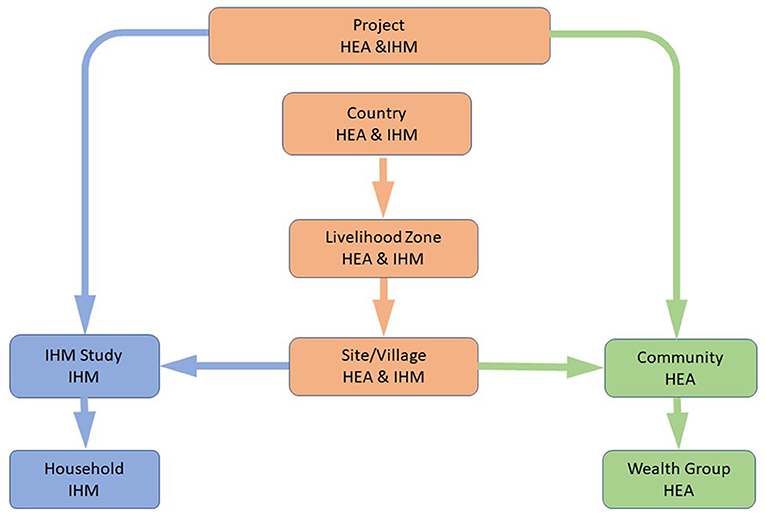
Figure 1. The HEA and IHM: levels of data collection. Source: own elaboration based on images with “no copyright reserved” (Creative Commons Attribution Non Commercial No Derivatives 4.0 International license).
This methodology allowed us to explore current year income levels in the case study assessments (these were the most recent full agricultural years and were described by local residents as “neither particularly good nor bad, compared with other recent years”). Further analysis of income allowed us to identify specific sensitivities to shock at household level. Finally, by looking at the current investment costs associated with different local enterprises, we were able to assess the potential for income diversification and adaptation across the population. Whilst recognizing that this study is only a snapshot of recent case study years, findings are indicative of the scale to which households at different levels of income are “trapped” in current patterns of economic activity, and help to answer questions such as, “What level of income is needed to invest and diversify income streams?” Follow on qualitative interviews allowed us to explore the options and opportunities that are available to different groups within the population, and in this process, to link up quantitative and qualitative aspects of the study, generating policy-relevant findings (see Section Implications for Policy).
The IHM uses a semi-structured interview framework to record the household's productive assets (land, labor, livestock, etc) and the way in which these are used to generate food, food stocks, and cash income. A preliminary survey is conducted by the assessment team before individual interviews begin. This includes locating the survey site within a wider “livelihood zone” i.e., an agro-ecological area within which households have access to a similar range of markets and economic opportunities [see Seaman et al. (2014) and examples of livelihood zones at https://fews.net/fews-data/335], and mapping the village and its immediate locality, to show land use, main infrastructure and physical features. Information is also collected from focus groups and key informants on crops grown and livestock kept, seasonality of labor, pay rates, crop returns, government and NGO programmes implemented locally, as well as the essential items of expenditure required by people in that community to meet the norms for “social inclusion.” Information from the various focus groups is shared before individual household interviews begin. This means that interviewers have a good initial grasp of the local economy, can identify inconsistencies in responses, and can probe further and cross question where appropriate, e.g., if a crop yield seems implausible or unlikely.
The interview framework is designed to avoid known sources of error, including a tendency to underestimate or omit sources of income (Kasprzyk, 2005). Data checking is an essential part of the interviewer training process and takes place at all stages of field work and analysis. Data is consolidated, checked, and entered in the OIHM database on the day of collection. Where there is no plausible explanation for apparent inconsistencies, or where there appear to be gaps in the information, households are re-visited the following day. It has been found that, in nearly all cases, the information gap can be filled if households are given a clear explanation for the return visit.
Depending on the purpose of the research, additional focus groups are conducted, for example on water sources and costs, access to credit, use of fertilizer, etc. The approach is fundamentally different from the standard questionnaire approach, where the interviewer records answers (generally yes/no or a number) designed for automated processing. Interviews are held at a time that is convenient to the interviewee, and fatigue that can affect both the interviewer and interviewee is avoided by keeping interviews relatively short (most interviews are completed within an hour). At the end of the conversation, the interviewee, as well as the interviewer, will have an overview of his or her household's individual livelihood system and comments from the interviewee on the value of the interaction are not uncommon.
Whilst other methods of income measurement, for example the extrapolation of income from consumption data (Lipton and Ravallion, 1995; Baulch, 1996) may be useful for macro-economic accounting, these methods cannot be used with the same accuracy and specificity to assess livelihood vulnerability and resilience at household level. For this purpose, details of income sources are needed. Cognisant of known sources of error in the collection of household data (Moore et al., 2000; Kasprzyk, 2005), rigorous quality control checks and the use of analytical software in the field allows error sources to be quickly identified and corrected, for example, by re-visiting interviewees or by further contextual enquiry.
Standardized Income Metric
A reliable measure of income is an essential, although not sufficient, in answering our research question “What information do local policy and decision makers need now, to reduce vulnerability and enhance resilience.” To better understand the financial limitations on adaptation in our study communities, we use the standardized measure of “Disposable Income.” In IHM studies, this is defined as the amount of money available to the household after its food energy requirements have been met, based on World Health Organisation (1985) reference values.
In rural areas in many developing countries, household income is made up of food produced or otherwise obtained by the household and consumed (“food income”) and income in other forms—for practical purposes this means income as cash. A measure of household income requires a method of combining “food income” and “cash income” into a single result. This could be done by imputing a cash value for all food income and adding this to cash income. However, not all food produced in rural areas is traded so it can be difficult to price (e.g., wild foods, or in some places perishable foods such as milk). The alternative is to calculate the money left to the household after it has met its food energy needs, considering the kilocalorie (Kcal) value of food produced and consumed by the household. This is the approach used in IHM studies and is referred to as “disposable income.”
The IHM data structure is shown in Figure 2.
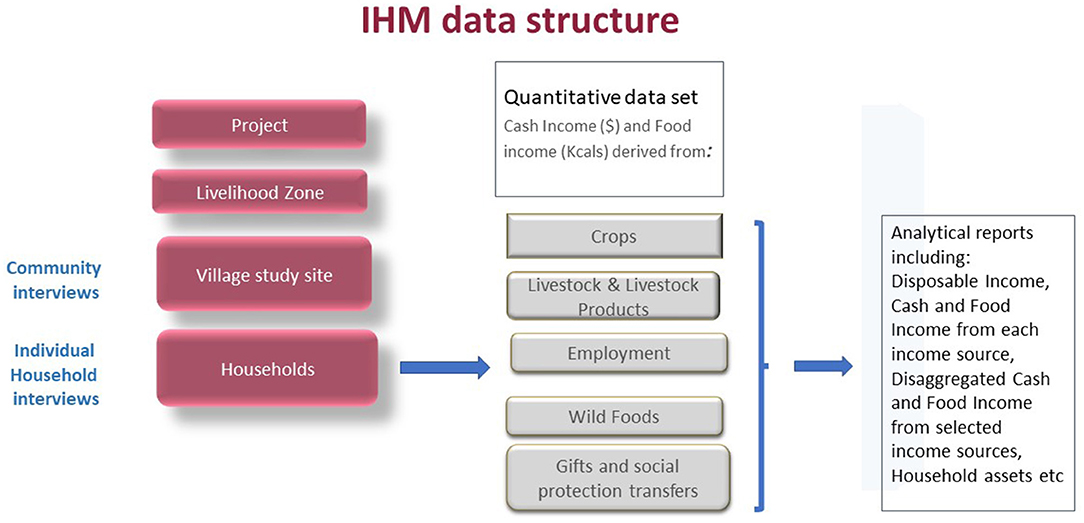
Figure 2. The IHM data structure. Source: own elaboration based on images with “no copyright reserved” (Creative Commons Attribution Non Commercial No Derivatives 4.0 International license).
Households that do not have sufficient income to meet their WHO reference standard food energy requirement are considered to be below the food poverty line. To allow for comparison between households of different size and demography, income is further standardized by “adult equivalent” (AE), giving disposable income (DI) per adult equivalent (DI per AE). Finally, a “standard of living threshold” (SoLT) is set. This represents the cost of a locally defined basket of essential items required to meet the community's norms for social inclusion. According to context, this generally includes items such as water, soap, fuel, sanitation, primary education, clothes, shelter, etc. Households that cannot afford the full set of items in the study year are described as being below the standard of living threshold. Information is generally collected for a twelve-month period covering the most recent “agricultural year,” which is established in consultation with the study community at the start of the assessment. In longitudinal studies, the project baseline year is compared with subsequent years (e.g., Martin et al., 2009; Petty and Ellis, 2015b). This approach provides an easily understood indicator of a household's capacity to meet on-going costs, absorb the year on year impact of climate and other shocks, or invest in new enterprises.
The Study Context: Lake Victoria Basin
In line with the objectives of the HyCRISTAL project, the IHM studies were conducted as part of rural pilot studies in lakeshore communities within the Lake Victoria Basin (LVB), between 2015 and 2018. The LVB covers an area of 194,200 km2 and includes Kenya, Tanzania, Uganda, Burundi, and Rwanda. It has a population of around 45 million (World Bank, 2018) which is growing rapidly-for example, at around 3.2% per annum in Uganda (Worldometers, 2018). The area has been designated by the East African Community as an “area of common economic interest” and a “regional economic growth zone to be developed jointly by the Partner States” (Lake Victoria Basin Commission).2
Fisheries provide an important source of revenue for both national governments through fish exports and for local communities bordering the lake in Tanzania, Kenya, and Uganda. Between 2011 and 2014, estimated total fish landings from the lake was around 1 million metric tons, with a beach value in 2014 of around US $ 840 Million (Lake Victoria Fisheries Organisation Secretariat, 2016). Loss of habitat, the introduction of the invasive Nile Perch species and overfishing have all contributed to a decline in the fisheries industry in recent decades (Njiru et al., 2018). Policies and regulations introduced to address these issues and manage the fisheries sustainably are described by Njiru et al. as “sectorial, disjointed and unharmonized and have not reduced the declining fish catch rates.”3
Study sites within the basin are subject to different rainfall regimes and different dependencies on fishing and agriculture. With advice from colleagues leading the HyCRISTAL climate science work (Finney et al., 2019) and from local NGO partners, the search was narrowed down to Mukono District in Uganda and Homa Bay in Kenya. Mukono rainfall is more uniform during the year than Homa Bay, which experiences much larger contrasts.
National statistics indicate “average” poverty levels in Mukono (15–30% below the national poverty line) and a young population, with 52% of the population under 18 years (World Resources Institute, 2005; World Bank, 2016). Unicef data for Kenya show child poverty rates in Homa Bay, measured by “average deprivation intensity,” slightly above the national average (UNICEF Child Poverty in Kenya, 2017). The proportion of the population under 18 years (59%) is also higher than the national average of 49% (Unicef, op.cit.). Rainfall at both sites is bimodal, with the peak rainy season from March to May (“Long Rains”) and a second shorter season in October/November (“Short Rains”), although historically, rainfall has been more evenly distributed in Mukono than in Homa Bay. Average annual rainfall in Mukono is 1,390 mm and average annual temperature 21.5 degrees C (Mukono, World weather online).4 Homa Bay has a slightly lower average annual rainfall of 1,200 mm with peaks in April/May and October/November. Average temperatures are around 22.5°C (Homa Bay, World weather online).5
The selected village sites were identified in scoping studies carried out in advance of field work (Acidri, 2015; Machuki and Owuor, 2017). The Uganda study was conducted in the “Fishing-forestry-sandmining” livelihood zone of Mukono District (Seaman et al., 2016) and the Kenya study in the “Lake Shore Fishing, Sandmining and Stone Quarry” livelihood zone of Homa Bay (Acidri et al., 2018). Criteria for selection included distance to Mukono town on Homa Bay (maximum 90 min drive) and rural rather than urban or peri-urban communities. We also wanted to study communities with a mix of both agriculture and fishing to include a wider range of potential climate-related impacts.
IHM Survey Implementation
Field research was carried out in two villages, shown in Figure 3. The Uganda site had over 200 households, so it was necessary to carry out a sample survey, rather than a whole village assessment.
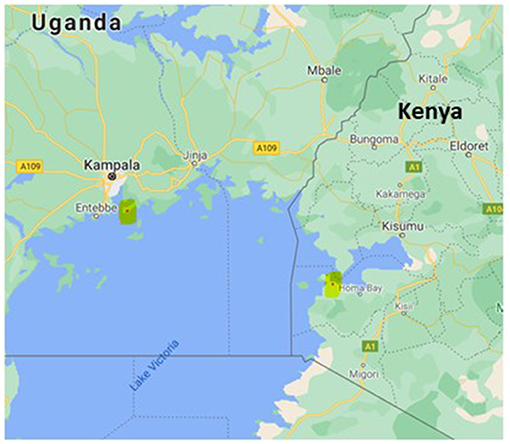
Figure 3. BS (Uganda) and NB (Kenya). Source: Google maps. Authors' own based on images with “no copyright reserved” (Creative Commons Attribution Non Commercial No Derivatives 4.0 International license).
A total of 105 households were interviewed and all were included in the final analysis. The Kenya site was a smaller community with just 53 households, so it was possible to include all available households in the survey. Due to the absence of some households, 41 households were included in the final analysis. The “absent” households were all identified as having their main residence and businesses in urban centers including Homa Bay town.6 The survey teams were led by Evidence for Development (EfD) local associates, who are highly experienced practitioners with between 10 and 15 years in household economy survey work. They were supported by local partners from Gulu university and Maseno University who received additional on-site training as part of an on-going capacity building process.
The studies provide a contemporaneous, cross-sectional view of current socio-economic status in the 12 months agricultural year for which data was collected.
Within the study populations, and in the study year, the main sources of income were recorded. Customized software was used to analyse how this income was distributed across the population, the disposable income available to households after their basic survival needs had been met, and the assets and natural resources to which households had access. This provided an indication of the potential impact of defined shocks (e.g., a fall in price or production of a main food crop; a pest infestation destroying an important cash crop) on population sub-groups.
Analysis of income source was also used to identify the specific sensitivities to, and potential vulnerabilities of, groups within the two sites which are exposed to a range of climatic and economic hazards. The agricultural years in both sites (2014–2015 in BS; 2016–2017 in NB) were described as “normal”—neither exceptionally good nor exceptionally bad—compared with recent years.
Overview and Discussion of Household Economy Findings From BS (Uganda) and HB (Kenya)
In this section, we look at the way in which disaggregated baseline household economy data can be used to assess the nature of economic vulnerability facing different sections of the population and the economic constraints on adaptation. We also show how this information can contribute to future climate risk scenarios or climate storylines [see Burgin et al. (2019)], and inform climate sensitive social protection interventions. We draw on the following analyses from more extensive case study working papers (Petty et al., 2016; Ngoleka et al., 2018) to address our key research questions:
• Disposable Income. This shows the cash available to households after food energy needs have been met, providing an indication of the capability of households at different levels of income to adapt to changing conditions and invest in new activities. Data is standardized per adult equivalent to enable a fair comparison between households of different size (Figure 4A).
• Detailed analysis of the main sources of cash income. This is an indicator of household sensitivity to specific changes (positive or negative) e.g., in market prices, fish catches, and lakeshore business revenues etc. (Figure 4B).
• Analysis of the main sources of food income i.e., food produced by the household and retained for its own consumption. This is an indicator of market dependence and exposure to crop failure, market price increases etc. (Figure 4C).
• Detailed breakdown of the main crops grown, used to identify specific sensitivities to different shocks at different times of the year (Figure 6).
• Asset holdings including land, livestock (Figure 4D), and major productive assets such as boats, motor bikes, agricultural equipment.
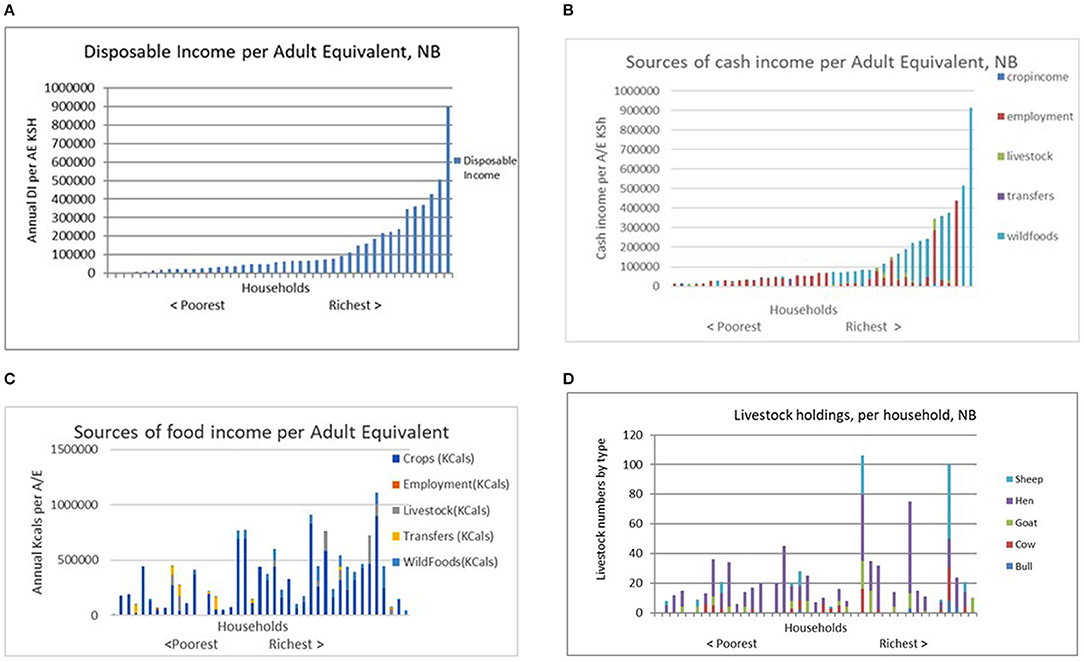
Figure 4. Disposable Income, Cash Income, Food Income and Livestock holdings: Analysis from IHM reports, NB Village, Homa Bay. (A) Indicator: cash available for investment. (B) Indicator: sensitivity to cash income loss in different sectors. (C) Indicator: dependence on market purchase for food security. Annual food energy requirement per adult equivalent is just under 1 million kcals. (D) Indicator: assets, livestock holdings.
Whilst this is only a snapshot, the results for both communities indicate very low levels of disposable income in the bottom half of the distribution at both sites, with households holding few assets: only those households at the top end of the distribution had significant discretionary income available for saving and investment. This finding is broadly in line with national poverty statistics outlined above.
Main Economic Activities, Assets, and Basic Needs: Summary of Results
Analysis showed that both study communities include mixed populations of fishers, farmers and households that combined both activities, along with others specializing in activities such as boat making and lakeshore enterprises, providing services such as cooked food, bars and restaurants. In both communities, higher levels of income from fishing were concentrated at the top end of the income distribution among boat owners. Poorer households derived their income from activities including day labor in agriculture or fishing, selling cooked food, petty trade, or small shops. In our study samples, professionals (teachers, government officials, health workers, etc) did not feature. The overall pattern of income distribution was similar in both sites, with a high level of income inequality.
Land and livestock assets were fairly evenly distributed in both lakeshore communities, and at both sites, plots were generally small (around 1.5 acres). This has limited the scope for investment in agriculture in the immediate lakeshore area, although two of the wealthier households at BS had landholdings outside their village. Population pressure was cited as a problem at both sites, which had resulted in division of land and smaller plots and, due to poor sanitation, was associated with increased lake pollution. In both communities, high levels of youth unemployment were also reported.
All households at both sites could meet food energy needs to WHO recommended standards (World Health Organisation, 1985) but in BS around 11% of households fell below the locally defined “standard of living threshold.” These households did not have sufficient income, after meeting their food energy needs to cover the cost of all items needed to meet locally acceptable norms for “social inclusion.” In NB, all were able to meet their basic food and non-food needs, according to the locally defined minimum standard of living, in the study year. This represents the minimum required for basic “social inclusion” and is not an aspirational level.
None of the study households were entirely “self-sufficient” in food and at both sites, households were dependent on market purchase for most of their food energy needs. In NB, households were able to produce, on average, around 46% of their food energy needs from their own crop production, supplemented in some cases by their fishing and livestock production. Around 20% of households produced vegetables for sale but only one household gained significant income from agriculture. Figures on market dependency were similar in BS. Low-income households at both sites would therefore be exposed to hardship if the price of staples were to rise, without additional cash from social protection programmes or other sources.
Demography
No single demographic characteristic typified poorer or better off households at either site.
Both communities have been badly affected by HIV/AIDS and there was a high number of female-headed households (10% BS and 20% NB), including households headed by grandmothers. Female-headed households were found across the income distribution, but there was a higher proportion of female-headed households in the lowest quartile, underlining the importance of gender disaggregation in policy focussed research. With its relatively high population of migrant fishers, single male households (mainly although not exclusively fishermen) were over-represented in the top quartile in BS. There were no single male households in NB.
At both sites, people under 25 years of age made up most of the population (74% in BS and 65% in NB). These figures reflect the extremely young populations of both countries.
Income Distribution
The shape of the income distribution curve is similar at both sites, with a substantial level of inequality between the disposable income of the poorest 50% and the richest households (see Figure 5).
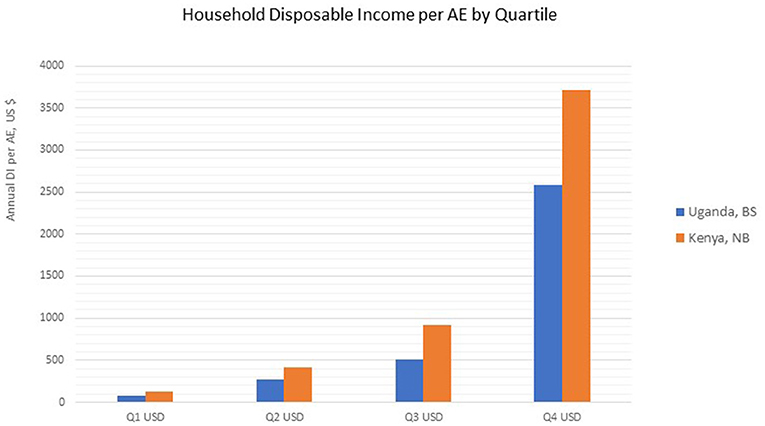
Figure 5. Disposable incomes per Adult Equivalent (AE) by Quartile (Q) at the two study sites, BS and NB (Jan 2016 USD exchange rate).
Whilst average disposable incomes per adult equivalent are almost twice as high in NB compared with BS in all but the richest quartile, the cost of living was also higher in NB and it would therefore be wrong to assume that this community is better able to cope with shocks.
Data from both sites provides strong evidence of the income constraints that limit adaptation options for most households. At low levels of disposable income, the cost of investing in new enterprises, even with the lowest entry levels, was unaffordable. Contextual information indicates that start-up capital for enterprises requiring the lowest level of investment, such as petty trade in fish, was around US$95. The investment costs of enterprises with higher returns, such as bars or kiosks, was between US$500 and US$800. With start-up costs requiring either external support or years of saving, finding new income sources was limited to potentially negative coping strategies such as removing children from school, sand mining (which was an option at both sites), non-licensed brewing, etc.
Risk and Exposure
There is an extensive climatological and social science literature documenting the range of hazards to which communities in the Lake Victoria Basin are exposed: these include climatic and weather extremes resulting in drought, storms, and flooding, as well as crop pests and diseases. Environmental pollution and poor standards of regulation and governance add to these risks (Hammond and Xie, 2020). However, not all households are equally exposed to every hazard. Sensitivity to a specific event depends on its timing in the agricultural or fishing calendar, and the household's capacity to make up losses from other economic activities by selling assets or by calling on social networks to provide cash, food or loans. Government social protection programmes may be triggered in extreme circumstances, but their effectiveness depends on the type of assistance provided, and the accuracy of targeting. This in turn relies on reliable, location-specific livelihoods information.
To understand the nature of vulnerability and potential to adapt and diversify economic activities in the face of these and other threats, we looked at data on all sources of cash income and food income (food produced and retained for household consumption) at the two sites.
Sources of Food and Cash Income
The same pattern of cash and food income shown in the Figures 4A–D for NB (Kenya) was also found in BS (Uganda). In common with many communities across the continent, household livelihoods and food security in BS and NB typically depend on multiple sources of income, including food crops grown for both the household's own consumption and for cash, and a range of on farm and off farm employment. The specific mix of income streams varies across the wealth distribution. For example, in BS, fishing (classified as “wild foods” in the IHM database) was the predominant source of income in the richest quartile. Many households in the middle of the distribution derived their income from a combination of employment (bars, kiosks, and restaurants) and farming, and poorer households were more reliant on day labor in fishing and agriculture, although most also grew some crops. In NB, better off households gained most of their cash income from fishing, whilst poorer households were largely reliant on employment in fishing and associated activities. In relation to resilience and exposure to hazards, specialization among better off households enabled them to accumulate wealth and invest in additional boats, fishing gear and labor. To understand the risks of specialization, additional work would be needed into how this groups invests its surplus cash, current debt levels, etc.
The risks facing households in the poorest quartiles are less ambiguous. The poorest households in NB were almost exclusively dependent on fishery-related employment and linked petty trade for their cash income, with small amounts of additional cash from transfers and sale of livestock products (mainly poultry). The main sources of employment were gender differentiated: for men, it was day labor in fishing, whilst for women, petty trade in fish, selling food and work in other lakeshore businesses. The poor, as a group, were therefore highly dependent, both directly and indirectly, on the success of the fishing industry. Poorer households in BS had more diversified sources of income, including more agricultural and off farm work. In this group, transfers (cash gifts from relatives) were also important for some households. However, at both sites, earnings among the poorest quartile were extremely low, leaving very little cash for investment in alternative livelihood activities.
Disaggregated, household level data on income of this kind can be used to model the immediate impact of defined shocks on current income levels across the population as a whole and indicate the level of social protection interventions that would be needed to mitigate the impact among poorer households lacking access to alternative sources of income. It can also be used for planning purposes, specifically in relation to climate adaptation. For example, cassava and tomatoes are both important cash crops in BS and tomato production has emerged as a local response to volatile global coffee prices and coffee wilt disease. However, tomatoes are drought intolerant and farmers in BS complained that without irrigation, increasingly erratic rainfall meant that the tomato harvest had become unreliable. Similarly, whilst cassava is more drought tolerant than crops such as maize, it is susceptible to waterlogging, so if climate change were to result in hotter, wetter conditions, this would make it a less viable option. This illustrates the dangers of “expert-led” adaptation where decisions require not only planning and investment, but also discussion led by community members who are aware of multiple factors impacting on adaptation pathways. This long-standing issue is discussed at length by Eriksen et al. (2021).
Food Income
Whilst the crops and livestock produced in the study sites are not a major source of cash income, staple foods are widely grown to provide some protection against potentially volatile market prices. A household's resilience and ability to mitigate losses will depend on it's capacity to replant, it's access to and ability to pay for alternative seeds, and it's access to labor, information and experience.
For example, Figure 6 shows that in the study year, maize was the crop most widely grown as a staple food for household consumption in NB. However, this provides only a relatively small proportion (<40%) of the annual household food energy requirements of around 1 million kcals/adult equivalent for most households.

Figure 6. Breakdown of main crops grown and retained for household consumption.
As households in NB are already highly dependent on the market to access their staple food needs, a fall in maize yields and/or any increase in the price of maize, would be felt sharply by households at the lower end of the income distribution.
A similar analysis of food income from the BS study showed that sweet potatoes were the most important staple crop among poorer households, whereas maize was more important among households in the top half of the distribution. Both staples are grown to reduce market dependence and have different climate sensitivities, resulting in different levels of exposure to climate related hazards.
These examples illustrate the need for greater integration of climate information and livelihood data for climate adaptation and resilience planning and for greater awareness of the factors affecting crop choice among different groups within the population. Understanding these factors requires complementary enquiries, using a range of different social science research methods.
Land and Livestock Assets
Access to land is limited in both BS and NB (around 1.5 acres on average) and availability of land for grazing was highlighted in BS as a major constraint in developing the livestock sector. In addition, very poor road transport infrastructure adds to both the time and cost of reaching markets from BS. The number of sheep, goats and cattle held per household are similar in NB and BS. Better off households do not have substantially larger landholdings than poorer households, although they are more likely to have cattle. In NB poultry are widely held and in larger numbers than BS, suggesting potential for commercial exploitation that could provide an important additional income source. However, poor market links and high interest rates are currently holding back local investment. At both sites, there are households in the wealthiest income quartile that do not have any landholdings; they derive their income entirely from fishing or from business enterprises. However, the opportunities for making significant returns on livestock investments for most people are negligible.
The story of changes in land ownership in BS is an interesting one, which illustrates an earlier period of “adaptation.” Faced with falling fish catches, many landowners sold up in the 1990's, left BS and started transport and other business, mainly in Kampala, where new opportunities were opening up (focus group comms.). With a growing population, and migration from other parts of Uganda, the remaining plots have been divided into smaller units, with only small areas available for rental and little opportunity for business expansion.
Drivers of Adaptation and Diversification
Quantitative data of the kind we have described is needed to better understand current constraints on adaptation and income diversification, and to model potential future climate impacts on human populations (Enenkel et al., 2020), as well as the short term implications of natural disasters and other hazards. It also provides evidence of risk exposure among different sections of the population, potentially reducing opportunities for “elite annexation” of adaptation policies by wealthier groups, that may result in an increased gap between poor and rich (Eriksen et al., 2021). These studies have also shown the financial limits constraining poorer households' exercise of choice, in line with the findings of other micro-level studies of adaptation in Africa (e.g., Hisali et al., 2011).
Building on this work, we were able to incorporate approaches from the constructivist social science tradition to gain a deeper understanding of responses to changing economic and environmental conditions, mindful that income is a necessary but not always a sufficient explanation for these responses. We therefore asked older community members in the two study communities to look back and describe the main changes that had occurred during their lifetime, and we listened to younger women and men explain how they dealt with the challenges they faced in improving their economic circumstances. Finally, we heard from youth, many of whom were considering migration as the best route out of poverty.
A series of focus group discussions, differentiated by age and gender was led by local researchers (Achiro and Acidri in BS, Uganda, and Owuor with Ngoleka in NB, Kenya). The same protocol was followed at both sites. The issues raised in these discussions reflected local social, cultural and behavioral norms that had impacted on “adaptive” decisions, along with issues of governance, particularly in relation to the use of natural resources (overfishing and pollution). To put these in perspective, we set responses alongside quantitative data relating to the affordability of potential adaptation and diversification strategies (Petty et al., 2017; Ngoleka et al., 2018).
Key Findings of Focus Group Discussions
The discussions provided insight into the process of locally driven, endogenous change that had led to some shifts in both social and gender norms and inter-generational relations. The most notable change was in the economic activity of women outside the domestic sphere.
Older focus groups were asked to describe changes that had taken place in their communities in recent decades. As yields from traditional income sources had collapsed women described how they had become increasingly involved in petty trade and other enterprises. However, despite greater economic independence, younger female discussants described how legal and social constraints continued to limit their options, particularly in access to financial services. Participants in all focus groups referred to underlying problems including poor returns on investment, weak governance, and absence of infrastructure. In particular, young people felt their education had been neglected, leaving them ill equipped for the modern workforce and with poor chances of employment in their communities where there was no immediate prospect of investment or renewal.
Comments From Participants
In both communities, income from agriculture and fisheries had fallen dramatically due to crop disease, over-fishing, and changes in the global economy. This included the collapse of coffee prices in the late 1990's in BS, and in both study communities, pressures to meet fish export targets.
Older men focused on changes in traditional sources of livelihood security:
“Fishing and farming have become less reliable sources of livelihoods due to lower stock of fish, more regulation of fishing and less land for agricultural activities, with unpredictable weather conditions.” BS
“Unpredictable weather patterns have also affected farmers in the village because of prolonged dry periods and sometime too much rain, hence farmers not knowing what to do.” NB
“Cash income is still derived from the same activities namely coffee and banana production. However there are attempts for diversification into intensive vegetable and other crop farming such as tomatoes, cabbages, beans, ….and cassava…. all this is on small scale due to limited capital for investment.” BS
Women's perspectives were markedly different. They described how they had responded to the loss of income from fisheries and cash crops and how some traditional gender defined roles had changed as a result.
“More women …are involved in various business ventures that facilitate the family welfare not like 20 years ago when women relied only on the man as a bread winner.” BS
“Women start their own enterprises other than waiting for everything from the man.” BS
Women also spoke of the empowerment that came with taking on economic roles outside their traditional spheres:
“The women can now finance family activities including paying school fees. This is because they now are able to operate their own enterprises” BS
“More businesses have come up in the present like hotel, saloon of which women can earn money from. All women can take advantage of this opportunities so as to be able to earn a living and not to depend on men as it was in the past.” NB
However, using the IHM database, when we calculated for each income quartile the average income from the small business enterprises in which women were mainly involved, it was clear that returns from enterprises typically run by women were low, and would not finance business growth or diversification. Tables 1, 2 show start-up capital costs and average household incomes from the Uganda study site (BS).
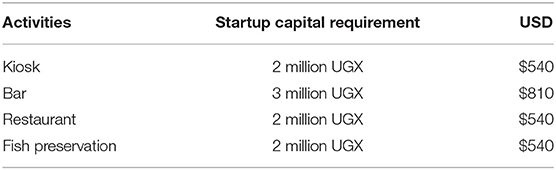
Table 1. Enterprise start-up capital, BS.
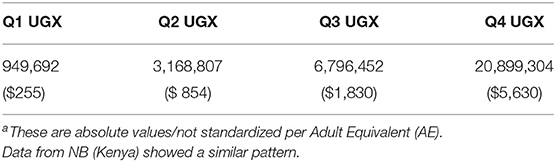
Table 2. Average household disposable income by quartile, BS.a
Intersectional issues also became clear as groups discussed the legal and social norms that held back adaptation and entrepreneurship, restricting women's choices and limiting their options in seeking loans to finance new businesses. Comments from women included:
“Most women fear applying for these (Uwezo) funds due to fear of defaulting and government grabbing of assets like land, livestock, house items on failure to pay in time, strict rules and regulations on borrowing, high interest rates, 12%.” NB
“Women's business doing well can easily be possessed by their husbands.” NB
Pressures within the household also created problems for many women.
“Confiscation of household items sometimes leads to separation in the family particularly if the husband was unaware of the loan. It has led in occasional suicide due to frustrations and depression.” NB
“The new challenges include among others overwhelming home responsibilities since they [women] can operate enterprises, and domestic violence when they fail to reach a consensus.” BS
Women also cited fear of failure and social ridicule if enterprises were unsuccessful, and malicious gossip in relations to the financing of a new business.
Finally, with high levels of local unemployment, migration was seen as the only option by many young people. However young rural migrants were also at a disadvantage. In NB they spoke of lack of skills to exploit emerging opportunities in town, due to high levels of illiteracy and corrupt practices that allowed under-aged children to drop out of school and take up work in fishing. In BS the problem was that “local people from places like [this] lack capital”—and there was “little industrial or agricultural development to provide jobs.” They also suffered from educational disadvantage, as English to at least secondary level is now necessary for jobs “as low as a house help.”
Qualitative insights gained through these discussions highlight the importance of integrated analysis that gives weight to the lived experiences of individuals negotiating change and confronting socially constructed as well as natural hazards. By cross referencing data from the quantitative IHM study and providing space for local voices, we were able show how policy makers might access more precise information on the immediate, local factors that stand in the way of enterprise and adaptation. For wider civil society organizations the approach also provides hard evidence for advocacy and engagement with local political debate (Cornforth et al., 2021a).
Implications for Policy
The focus of this paper has been on operational assessment methodologies that are designed to provide decision makers at local and national level with more granular insight into the structure of local livelihood systems. This information is critical in circumstances where many priorities are competing for limited budgets.
Here, we look at some of the underlying development issues that are impacting on the depleted livelihoods described in the previous sections and how policy relevant information generated in the case studies might inform future policy responses. Some of these involve multiple stakeholders working at different levels, others require decisions at national and international levels. For example, the consequences of government and donor under investment in education and rural infrastructure is illustrated by (i) the testimony of young people, whose life chances have been severely limited by the poor education they have received and (ii) by the low levels of household disposable income due to the absence of investment in sectors such as rural food processing. Investment in both these sectors would raise levels of household income in the short and long term. Green climate funds may offer new possibilities in relation to climate adaptation, particularly in providing sources of renewable energy and with this new employment opportunities and better connectivity. However, improvements in children's education will only follow if there is commensurate investment in teacher skills and IT equipment. The approach must be cross sectoral and interdisciplinary.
Evidence of the continuing undermining of development through gender discrimination in access to financial services is also a feature of both the quantitative and qualitative elements of this research. Removing these inequalities requires further action at national policy level, but also by local institutions implementing programmes and designing new, inclusive services. Failure to address this problem will continue to constrain women's entrepreneurship and their households' resilience.
The research highlighted underlying environmental problems requiring policy action. Specific issues were generally within the remit of local policy oversight but need cross-sectoral support from national and sub-national authorities to mitigate them. Examples included: illegal sand mining resulting in increased flooding of lakeshore communities; lack of sanitation and management of human waste; and overfishing. Quantitative income information is needed in the context of a systemic response to each of these environmental issues. For example, to “build back better,” budget holders need to know the proportion of households that will need support to relocate or to better protect their homes from future flooding. It is needed to assess the economic cost of income lost due to water borne disease, strengthening the case budgetary case for public health improvements. Lastly, where illegal fishing is better regulated, those fishers who cannot afford the correct gear will be without an income. Household economy data can be used assess the cost and design appropriate social protection policies to support households in this situation.
In relation to increasing smallholder resilience at household level, an immediate dilemma facing many central and local policy makers in the global south, concerns the adoption by farmers of new climate-adapted seed varieties (Cacho et al., 2020). There are numerous reasons why farmers may choose not to take on the risk of planting unfamiliar varieties (Acevedo et al., 2020), or adopting an entirely new crop. However, a common problem relates to the cost of both seeds and/or inputs. The information in our case studies includes data, that could be used, on the basis of disposable income levels and distribution, to assess the proportion of households that could afford to purchase a new seed variety if they chose to, and the proportion that could not, even if they wanted to.
This has budget implications—should new seed varieties be subsidized? It also has implications for private sector seed distributors and for public-private partnerships in this area.
Conclusion
Our focus in this paper has been on the immediate question: “What information do local policy makers need now to reduce vulnerability and enhance resilience?” We have shown how quantitative household economy analysis can be combined with qualitative information generated through participatory social science methods, to provide policy relevant information on adaptation and resilience. For the first time, within the same study populations, quantitative IHM analysis highlighting sensitivities to specific shocks at household level has been complemented by qualitative analysis signposting ways in which mitigation measures might be more equitably targeted, gender and generational inequalities reduced, and policies to strengthen resilience more effectively implemented.
Policy makers need a far clearer map of the “vulnerability and resilience landscape” than siloed studies typically provide. We have shown how key findings of quantitative analysis, combined with insight into local norms and legal and institutional barriers, throws a very specific spotlight on areas where action could remove immediate obstacles to adaptation and change. Underlying issues of chronic poverty, however, require long term investment and commitment from local to national, and international public and private sector institutions. Green development funds offer opportunities to address this problem, although implementation continues to be slow and problematic (Caldwell and Larsen, 2021).
The two study communities have faced multiple stresses over the past three decades, with some, but by no means all, attributable to climate change. In BS, conflict, and post conflict migration in the 1990's coincided with the collapse of global coffee prices, market liberalization and widespread plant disease, which removed the main source of income and economic security from many households. Returns from fishing were also falling, leading some households to “adapt” by selling their main asset (land) to migrants and moving to urban areas. Those who remained have faced further decades of decline in both fishing and agriculture. Female-led small enterprise has gone some way to bridging the gap in household income, but returns for most activities are extremely low, and prospects for the rising generation are poor. NB has also experienced challenges, many of which relate to environmental degradation, rapid population growth and a lack of investment in the infrastructure needed to connect rural enterprises in this community with the wider economy. Here too, female entrepreneurship has softened the economic impact of change. However, without external assistance or unforeseen innovation, adaptation to climate and other shocks appears to be reaching its limits. Whilst greater female involvement in small business has contributed to a shift in gender dynamics at household level, overall income and returns on investment across the commercial and agricultural sectors are low and fisheries have been depleted. For the younger generation, options are particularly bleak. Given the extremely high proportion of the population under 25 years, youth unemployment is likely to dominate the political agenda in the coming decade and require targeted youth-focused economic investment.
The framework we have described shows how established research tools rooted in both the positivist and constructivist traditions can combine to provide a deeper, policy relevant understanding of fundamental questions relating to the boundaries and opportunities of adaptation. These studies provide detailed socio-economic data which is contributing to inter-disciplinary storyline work (Young et al., 2020), on-going policy and advocacy work in Uganda (Cornforth et al., 2021a) and finally, to modeling the livelihood impact of climate change in the Lake Victoria Basin and beyond (Cornforth et al., 2021b; Hinkel et al., 2021). Most importantly, they also provide evidence of community readiness to adopt new livelihood strategies where these are practical, affordable, and contribute to the household's social and economic well-being.
Data Availability Statement
The raw data supporting the conclusions of this article will be made available by the authors, without undue reservation.
Ethics Statement
The studies involving human participants were reviewed and approved by SAPD Ethics Committee University of Reading. The Ethics Committee waived the requirement of written informed consent for participation.
Author Contributions
CP led research design, analysis, writing, and directed quantitative field work in Uganda. SN led quantitative field work in Kenya. EA and JA led qualitative work in Uganda and contributed to quantitative field research at all sites. JO contributed to qualitative research at all sites. RC supported research design and implementation and contributed to the text. AA and GW contributed to qualitative research design and structuring of the paper. All authors contributed to the article and approved the submitted version.
Funding
This work was supported by the UK Foreign, Commonwealth and Development Office (FCDO) and the UK Natural Environment Research Council (NERC) [NE/M020371/1, 2014].
Conflict of Interest
The authors declare that the research was conducted in the absence of any commercial or financial relationships that could be construed as a potential conflict of interest.
Publisher's Note
All claims expressed in this article are solely those of the authors and do not necessarily represent those of their affiliated organizations, or those of the publisher, the editors and the reviewers. Any product that may be evaluated in this article, or claim that may be made by its manufacturer, is not guaranteed or endorsed by the publisher.
Acknowledgments
John Seaman's comments on the text and his pioneering work in developing household economy methodology is gratefully acknowledged. Debby Potts' comments on earlier versions of this paper are acknowledged with thanks.
Footnotes
1. ^https://code.google.com/archive/p/open-ihm/downloads
3. ^Our local studies, carried out in 2016 and 2018 corroborate this view. However, a clampdown on illegal fishing by the Ugandan government appears to be having an impact, and increased catches have been reported more recently, in both Uganda and Tanzania [Seafoodsource.com. (2021). https://www.seafoodsource.com/news/supply-trade/uganda-tanzania-report-increased-fish-production retrieved 16.7.2021].
4. ^Worldweather online, Mukono: https://us.worldweatheronline.com/v2/weather-averages.aspx?locid=2534011androot_id=2529715andwc=local_weatherandmap=/mukono-weather-averages/mpigi/ug.aspx.
5. ^World weather online Homa Bay: https://us.worldweatheronline.com/v2/weather-averages.aspx?locid=1312804androot_id=1312150andwc=local_weatherandmap=/homa-bay-weather-averages/nyanza/ke.aspx.
6. ^Whilst they retained property in the village, resources were not available to establish further details of their interactions with the community.
References
Acevedo, M., Pixley, K., Zinyengere, N., Meng, S., Tufan, H., Cichy, K., et al. (2020). A scoping review of adoption of climate-resilient crops by small-scale producers in low- and middle-income countries. Nat. Plants 6, 1231–1241. doi: 10.1038/s41477-020-00783-z
Acidri, J. (2015). Livelihoods around Lake Wamala (Mityana District) and Lake Victoria (Mukono District): A Scoping Study. Evidence for Development Working Paper, 5. doi: 10.5281/zenodo.5113298
Acidri, J., Muchuki, H., and Seaman, J. A. (2018). Livelihood Zones and Household Economy Approach (HEA) Survey Report, Homa Bay County, Kenya (Evidence for Development Working Paper, 10. doi: 10.5281/zenodo.5113445
Baulch, B. (1996). Neglected trade-offs in poverty measurement IDS. Bulletin 27, 36–42. doi: 10.1111/j.1759-5436.1996.mp27001004.x
Birkmann, T., Cutter, S. L., Rothman, D., Roger Pulwarty, S., et al. (2015). Scenarios for vulnerability: opportunities and constraints in the context of climate change and disaster risk. Climat. Change 133, 53–68. doi: 10.1007/s10584-013-0913-2
Burgin, L., Walker, G., Cornforth, R., Rowell, D., Marsham, J., Semazzi, F., et al. (2019). FCFA HyCRISTAL Climate Narrative Rural Infographic and Brief. Zenodo. doi: 10.5281/zenodo.3257288.svg
Cacho, O. J., Moss, J., Thornton, P., Herrero, M., Henderson, B., Bodirsky, B. L., et al. (2020). The value of climate-resilient seeds for smallholder adaptation in sub-Saharan Africa. Climat. Change 162, 1213–1229. doi: 10.1007/s10584-020-02817-z
Caldwell, M., and Larsen, G. (2021). Improving Access to the Green Climate Fund: How the Fund Can Better Support Developing Country Institutions World Resources Institute Working Paper. Washington, DC: World Resources Institute. doi: 10.46830/wriwp.19.00132
Call, M., and Sellers, S. (2019). How does gendered vulnerability shape the adoption and impact of sustainable livelihood interventions in an era of global climate change. Environ. Res. Lett. 14:e.083005. doi: 10.1088/1748-9326/ab2f57
Clay, N. (2017). Integrating livelihoods approaches with research on development and climate change adaptation. Progr. Dev. Stud. 18, 1–17. doi: 10.1177/1464993417735923
Cornforth, R. J., Clegg, D., and Petty, C. (2021b). The Integrated Database and Applications for Policymakers (v2.0). Zenodo. doi: 10.5281/zenodo.3701722
Cornforth, R. J., Petty, C., and Walker, G. (2021a). Supporting climate-resilient planning at national and district levels: a pathway to multi-stakeholder decision-making in Uganda, in Climate Risk in Africa: Adaptation and Resilience, eds Conway, D., and Vincent, K., (London: Palgrave Macmillan), 131–145. doi: 10.1007/978-3-030-61160-6_8
Enenkel, M., Brown, M. E., Vogt, J. V., McCarty, J. L., Reid Bell, A., Guha-Sapir, D., et al. (2020). Why predict climate hazards if we need to understand impacts? Putting humans back into the drought equation. Climat. Change 2020, 1–16. doi: 10.1007/s10584-020-02878-0
Eriksen, S., Schipper, E. L. F., Scoville-Simonds, M., Vincent, K., Adam, H. N., Nick Brooks, N., et al. (2021). Adaptation interventions and their effect on vulnerability in developing countries: help, hindrance or irrelevance? World Dev. 58, 130–142. doi: 10.1016/j.worlddev.2020.105383
Finney, D., Marsham, J., Rowell, D., Way, C., Evans, B., Cornforth, R., et al (2019). Scientific Understanding of East African Climate Change From the HyCRISTAL Project. Technical Report. White Rose Research Online. Available online at: https://www.wri.org/resources/maps/poverty-rate-uganda-percentage-rural-subcounty-population-below-poverty-line-2005 (accessed January 8, 2022).
Ford, J. D., Pearce, T., McDowell, G., Berrang-Ford, L., Sayles, J. S., and Belfer, E. (2018). Vulnerability and its discontents: the past, present, and future of climate change vulnerability research. Climat. Change 151, 189–203. doi: 10.1007/s10584-018-2304-1
Furberg, M., Hondula, D. M., Saha, M. V., and Nilsson, M. (2018). In the light of change: a mixed methods investigation of climate perceptions and the instrumental record in northern Sweden. Popul. Environ. 40, 47–71. doi: 10.1007/s11111-018-0302-x
Haasnoot, M., Kwakkel, J. H., Walker, W. E., and ter Maat, J. (2013). Dynamic adaptive policy pathways: a method for crafting robust decisions for a deeply uncertain world. Glob. Environ. Chang. 23, 485–498. doi: 10.1016/j.gloenvcha.2012.12.006
Hallegatte, S., Fay, M., and Barbier, E. B. (2018). Poverty and climate change: introduction. Environ. Dev. Econ. 23, 217–233. doi: 10.1017/S1355770X18000141
Hammond, M. J., and Xie, J. (2020). Towards Climate Resilient Environmental and Natural Resources Management in the Lake Victoria Basin. Washington, DC: The World Bank. doi: 10.1596/33912
Hinkel, J., Cornforth, R. J., Todman, L., Fairgreave, R., Plumpton, H., Shepherd, T., et al. (2021). Policy, governance and institutions for reducing and managing losses and damages, in Managing Climate Risks, Facing up to Losses and Damages, ed OECD, L., (Paris: OECD Publishing). Available online at: https://doi.org/10.1787/55ea1cc9-en (accessed December 1, 2021).
Hisali, E., Birungi, P., and Buyinza, F. (2011). Adaptation to Climate Change in Uganda: Evidence From Micro Level Data. Available online at: https://www.sciencedirect.com/science/article/abs/pii/S0959378011001105 (accessed January 8, 2022).
Kasprzyk, D. (2005). Measurement Error in Household Surveys: Sources and Measurement In Household Sample Surveys in Developing and Transition Countries: Studies in Methods. 96 United Nations Economic and Social Affairs: Studies in Methods, Series F. Washington, DC: Mathematica Policy Research. https://unstats.un.org/unsd/hhsurveys/sectionc_new.htm
Klein, R. J. T., Midgley, G. F., Preston, B. L., Alam, M., Berkhout, F. G. H., Dow, K., et al. (2014). Adaptation opportunities, constraints, and limits, in Climate Change: Impacts, Adaptation, and Vulnerability. Part A: Global and Sectoral Aspects. Contribution of Working Group II to the Fifth Assessment Report of the Intergovernmental Panel on Climate Change, eds Field, C. B., Barros, V. R., Dokken, D. J., Mach, K. J., Mastrandrea, M. D., Bilir, T. E. et al. (Cambridge: Cambridge University Press), 899–943.
Lake Victoria Fisheries Organisation Secretariat (2016). Lake Victoria Fisheries Management Plan III 2016–2020. Jinja.
Lipton, M., and Ravallion, M. (1995). Poverty and policy, in Handbook of Development Economics, Vol 3B, eds Behrman, J., and Sririivasan, T., (Amsterdam: North Holland), 2551–2657. doi: 10.1016/S1573-4471(95)30018-X
Machuki, M., and Owuor, J. (2017). Report on Selection of Study Sites (Beaches /Landing Sites) for IHM Work at Homa Bay County, Unpublished HyCRISTAL Project Report. Walker Institute, University of Reading.
Martin, E., Petty, E., and Acidri, J. (2009). Livelihoods in Crisis: A Longitudinal Study in Pader, Uganda HPG Working Paper October. Available online at: https://odi.org/en/publications/livelihoods-in-crisis-a-longitudinal-study-in-pader-uganda (accessed January 8, 2022).
Miller, F. H., Osbahr, H., Boyd, E., Thomalla, F., Bharwani, S., Ziervogel, G., et al. (2010). Resilience and vulnerability: complementary or conflicting concepts? Ecol. Soc. 15:11. doi: 10.5751/ES-03378-150311
Moore, J. C., Stinson, L. L., and Welnaik, E. J. (2000). Income measurement error in surveys: a review. J. Off. Statist. 4, 331–361. https://www.census.gov/content/dam/Census/library/working-papers/1997/adrm/sm97-05.pdf
Ngoleka, S., Petty, C., Achiro, E., Machuki, H., Owuor, J., and Alip, L. (2018). Assessment of Rural Livelihoods in a Lakeside Community, Ngegu Beach, Homa Bay, Kenya (Evidence for Development Working Paper), 9. doi: 10.5281/zenodo.5113425
Njiru, J., Knaap, M., Kundu, R., and Nyamweya, C. (2018). Lake Victoria fisheries: outlook and management. Lakes Reserv. 23, 152–162. doi: 10.1111/lre.12220
Nyantakyi-Frimpong, H., and Bezner-Kerr, R. (2015). The relative importance of climate change in the context of multiple stressors in semi-arid Ghana. Glob. Environ. Change 32, 40–56. doi: 10.1016/j.gloenvcha.2015.03.003
Onwuegbuzie, A. J., and Leech, N. (2005). Taking the “Q” out of research. Qual. Quant. 39, 267–296. doi: 10.1007/s11135-004-1670-0
Patel, S. S., Rogers, B. M., Amlôt, R., and Rubin, G. J. (2017). What do we mean by “community resilience”? a systematic literature review of how it is defined in the literature. PLoS Curr. 9:currents.dis.db775aff25efc5ac4f0660ad9c9f7db2. doi: 10.1371/currents.dis.db775aff25efc5ac4f0660ad9c9f7db2
Petty, C., Achiro, E., and Acidri, J. (2017). Change, Response and Adaptation in a Lakeshore Village, Mukono District, Uganda (Evidence for Development Working Paper), 8. doi: 10.5281/zenodo.5113361
Petty, C., and Ellis, W. (2015a). Assessing rural transformations in Oromia, Ethiopia, IHM Evidence, Evidence for Development Working Paper, 1. Available online at: http://www.efd.org/media/uploads/2015/10/IHM-working-paper-1-Oromia-Ethiopia-ART-project1.pdf (accessed January 8, 2022).
Petty, C., and Ellis, W. (2015b). Assessing Rural Transformations in Lilongwe district, Malawi: IHM evidence Evidence for Development Working Paper 2. Available online at: http://www.efd.org/media/uploads/2015/10/IHM-working-paper-2-Lilongwe-district-Malawi-ART-project3.pdf (accessed January 8, 2022).
Petty, C., Ngoleka, S., Acidri, J., Machuki, H., Achiro, E., and Alip, L. (2016). Assessment of Rural Livelihoods in Two Lakeside Communities, Mityana and Mukono Districts, Uganda (Evidence for Development Working Paper), 7. doi: 10.5281/zenodo.5113335
Petty, C., and Savage, K. (2007). Livelihoods in crisis: A longitudinal study in Pader, Uganda (Inception Report) HPG Working Paper April 2007. Available online at: https://odi.org/en/publications/livelihoods-in-crisis-a-longitudinal-study-in-pader-uganda-inception-report/ (accessed January 8, 2022).
Seaman, J. A., Acidri, J., and Machuki, H. (2016). Report on a Pilot Study in Mukono District, Uganda, Using the Household Economy Approach (HEA) (Evidence for Development Working Paper), 6. doi: 10.5281/zenodo.5113323
Seaman, J. A., Sawdon, G. E., Acidri, J., and Petty, C. (2014). The Household Economy Approach. Managing the impact of climate change on poverty and food security in developing countries. Climate Risk Manag. 4–5, 59–68. doi: 10.1016/j.crm.2014.10.001
Sen, A. (1981). Poverty and Famines: An Essay on Entitlement and Deprivation. Oxford: Clarendon Press.
Singh, C., Tebboth, M., Spear, D., Ansah, P., and Mensah, A. (2019). Exploring methodological approaches to assess climate change vulnerability and adaptation: reflections from using life history approaches Regional env change. Region. Environ. Change 19, 2667–2682. doi: 10.1007/s10113-019-01562-z
Tanner, T., Bahadur, A., and Moench, M. (2017). Challenges for Resilience Policy and Practice, ODI Working Paper, London: Overseas Development Institute. 519.
Tanner, T., Lewis, D., Wrathall, D., Bronen, R., Cradock-Henry, N., Thomalla, F., et al. (2014). Livelihood resilience in the face of climate change. Nat. Climate Change 5, 23–26. doi: 10.1038/nclimate2431
UNICEF Child Poverty in Kenya (2017). A Multidimensional Approach. Available online at: https://www.unicef.org/esa/media/1356/file/UNICEF-Kenya-2017-Child-Poverty.pdf (accessed January 8, 2022).
Werners, S. E., Wise, R. M., Butler, J. R., Totin, E., and Vincent, K. (2021). Adaptation pathways: a review of approaches and a learning framework. Environ. Sci. Pol. 116, 266–275. doi: 10.1016/j.envsci.2020.11.003
Wise, R. M., Fazey, I., Stafford Smith, M., Park, S. E., Eakin, H. C., Archer Van Garderen, E. R. M., et al. (2014). Reconceptualising adaptation to climate change as part of pathways of change and response. Glob. Environ. Change 28, 325–336. doi: 10.1016/j.gloenvcha.2013.12.002
World Bank (2016). Uganda Poverty Assessment Report. Available online at: https://openknowledge.worldbank.org/handle,/10986/26075 (accessed January 8, 2022).
World Bank (2018). The World Bank Lake Victoria Environmental Management Project III (P165352). Washington, DC.
World Health Organisation (1985). World Health Organization Technical Report Series 724. ‘Energy and protein requirements', Report of a Joint FAO/WHO/UNU Expert Consultation. Available online at: http://www.fao.org/docrep/003/aa040e/aa040e00.HTM (accessed January 8, 2022).
World Resources Institute. (2005). Poverty Rate in Uganda: Percentage of Rural Subcounty Population Below the Poverty Line, 2005. Available online at: https://www.wri.org/research/world-resources-2005-wealth-poor
Worldometers (2018). Uganda-Population. Available online at: https://www.worldometers.info/world-population/uganda-population/2018population (accessed January 8, 2022).
Keywords: climate, adaptation, resilience, quantitative, qualitative, HEA, IHM
Citation: Petty C, Ngoleka S, Cornforth R, Achiro E, Acidri J, Ainslie A, Owuor J and Walker G (2022) Adaptation Planning: An Integrated Approach to Understanding Vulnerability in the Lake Victoria Basin. Front. Clim. 3:782534. doi: 10.3389/fclim.2021.782534
Received: 24 September 2021; Accepted: 31 December 2021;
Published: 24 January 2022.
Edited by:
Matthew Collins, University of Exeter, United KingdomReviewed by:
Asmerom F. Beraki, Council for Scientific and Industrial Research (CSIR), South AfricaMaría Cleofé Valverde, Federal University of ABC, Brazil
Copyright © 2022 Petty, Ngoleka, Cornforth, Achiro, Acidri, Ainslie, Owuor and Walker. This is an open-access article distributed under the terms of the Creative Commons Attribution License (CC BY). The use, distribution or reproduction in other forums is permitted, provided the original author(s) and the copyright owner(s) are credited and that the original publication in this journal is cited, in accordance with accepted academic practice. No use, distribution or reproduction is permitted which does not comply with these terms.
*Correspondence: Celia Petty, e.c.petty@reading.ac.uk