Envisioning the urban past: GIS reconstruction of a lost Denver district
 Brian Page
 Eric Ross
- Department of Geography and Environmental Sciences, University of Colorado Denver, Denver, CO, USA
Large areas within the old urban core of American cities were destroyed in the post-war era as city leaders sought to counteract metropolitan decentralization by implementing urban renewal programs. For the most part, these places were deemed not worthy of documentation; indeed, areas declared as “blighted” were widely viewed as ugly, cancerous threats to the future health of the city and were enthusiastically demolished. For this reason, they have rarely been the object of study. This paper attempts to address the neglect of such lost landscapes by using GIS to provide a means to envision the urban past. Focusing on the case of the old Auraria district in downtown Denver, the paper pursues three aims. The first aim is to develop and test a new method for reconstructing urban landscapes at the district scale using GIS methods and data derived from historic Sanborn fire insurance maps. The second aim is to conduct preliminary analysis of this historic district-scale GIS, focusing on land use, spatial connectivity, and building massing, in order to evaluate its utility in generating new insight into the form, character, and functioning of the historic city core. The third aim is to assess the degree to which historic urban reconstructions of this kind can become valuable tools in contemporary urban planning efforts.
Introduction
The decades immediately following World War II witnessed a dramatic shift in the spatial form of US cities. Decentralization from the established urban core had been evident since the late nineteenth century, but post-war suburban expansion represented an acceleration of this trend that greatly extended the scale of industrial, commercial, and residential development at the outer margin of the city. Across the country, a massive wave of investment converted land on the urban fringe into modern built environments of sprawling low-density housing tracts, automobile-oriented shopping centers, thoroughfare retail developments, extensive highway-based warehouse complexes, low-rise automated manufacturing plants, and pastoral corporate office campuses. As new suburban landscapes took shape, they provided the essential context for the successful coordination of mass production with mass consumption that ushered in a new era of capitalist growth generally described as the “golden age” of Fordism (Walker, 1981; Jackson, 1985; Vance, 1990; Beauregard, 2006; Teaford, 2006).
Yet, as the American economy marched confidently into the second half of the twentieth century, and as the suburbs flourished, the inner city found itself moving in the opposite direction. Businesses, jobs, and people relocated to the suburbs – or to new regions altogether – leaving behind landscapes of old and deteriorating buildings, aging transport and commercial infrastructure, and a large number of impoverished neighborhoods. Core-city decline represented the devaluation of an outmoded urban form that had become an impediment to both economic growth and continued downtown social and political dominance. Faced with this circumstance, coalitions of downtown political and business elites acted to protect and enhance the core city’s position as the primary location of corporate and government office employment, as a critical hub of retail trade, and as the regional center of arts, entertainment, and cultural facilities. Wielding new policy tools enabled by federal legislation, these downtown “growth machines” reshaped the space of the urban core by demolishing old factories, run-down commercial areas, and slum neighborhoods in order to make way for commercial redevelopment projects as well as freeways, libraries, parks, convention centers, and other public sector improvements. Under this model of urban renewal, entire districts of the existing inner city were razed to create space for private investment opportunities and grand city planning initiatives (Logan and Molotch, 1987; Teaford, 1990; Sugrue, 1996; Fogelson, 2001).
Thus, the post-war urban shift had two faces that were as opposite sides of the same coin: on the one side, a process of suburban growth through which entirely new urban landscapes were generated; and on the other, a process of inner city contraction, decay, and piece-meal renewal through which many older urban landscapes were destroyed.
This dichotomy is reflected in the scholarship on urban spatial history. We know much more about the form that the suburbs ultimately took than we do about the form of the urban core that was lost. Post-war suburbs have been studied intensively, and for this reason we have a very good understanding of the broad evolution of their constituent typologies of land use, street patterns, housing types, commercial centers, employment complexes, and so forth (Kunstler, 1993; Duany et al., 2000; Hayden, 2004; Bruegmann, 2005; Mozingo, 2011). By contrast, districts within the urban core that were removed a half-century or more ago have rarely been the object of study [but see Sauder (1980)]. In many respects, this is a matter of presence versus absence; these are places that simply no longer exist, and knowledge of their physical or social characteristics has receded far into the reaches of distant memory, resurfacing only occasionally as fragments through oral histories, old photographs, or old maps. But it is also a matter of neglect. Like many ordinary landscapes associated with everyday activities, the aging industrial spaces and working class neighborhoods that faced the wrecking ball were treated with a disregard that rendered them nearly invisible (Mitchell, 2000; Page, 2003). For the most part, they were deemed not suitable for preservation and not worthy of documentation. Indeed, areas declared as “blighted” were widely viewed as ugly, cancerous threats to the future health of the city and were quickly and enthusiastically demolished without much of a backward glance.
In this paper, we address this imbalanced treatment of the post-war urban shift by mobilizing research methods drawn from geographic information systems (GIS). Our aim is to recover the morphology of the urban core that was removed during the urban renewal process using geo-referencing, digitization, custom attribution, calculated geometries, evaluation of spatial relationships, and layering temporal data. Using the case of the old Auraria district in downtown Denver, we seek to digitally recreate a lost urban landscape and thereby provide a means to envision the urban past. In doing so, we build upon a growing body of research that seeks to apply GIS methods to historical research questions [for overviews, see Gregory and Healy (2007), O’Sullivan (2005), Knowles and Hillier (2008), Hillier (2010), and Offen (2013)]. Historical GIS provides a framework for capturing, managing, integrating, and displaying a wide variety of geographically referenced historical information. Within an historical GIS, geospatial analysis allows researchers to view, understand, interpret, and visualize these data in ways that provide fresh insight into historical conditions and processes, expose unexpected connections, and generate new research possibilities. Broadly, this paper extends an emerging urban orientation within the historical GIS literature (Logan et al., 2011; Spielman and Harrison, 2014). In particular, our focus on mapping, analyzing, and visualizing urban geographies of the past builds upon a GIS reconstruction of seventeenth century Kyoto, Japan (Isoda et al., 2009).
Looking beyond the Denver case study, we hold that this approach has enormous potential to improve our understanding of the historical geography of American cities prior to the mid-twentieth century. Moreover, the utility of our analysis is not confined to a better understanding of the past; rather, we argue that the ability to envision the lost form of the city can be a valuable tool in contemporary planning efforts that aim to improve the accessibility and quality of urban space. In this sense, our approach aligns with the many contemporary urban planning trends that draw inspiration from historic patterns of urban development.
We divide the paper into four parts. First, we briefly trace the origins and development of Auraria, and describe the urban renewal process that led to the district’s removal in the early 1970s. Second, we present a methodology for recreating the built form of lost urban districts based upon data derived from Sanborn Fire Insurance maps. Third, we conduct an analysis of this recovered urban form, addressing a number of questions that shed light on lost districts, for instance: How was the district organized spatially? What role or function did it have within the larger metropolis? What were the mixes of land uses? Who were the occupants? What kinds of business or daily activities did it house? And, how was it connected to rest of the city? Fourth, we close with a discussion of the relevance of our historical analysis for urban history and for the practice of urban planning in American cities today.
Auraria Background
Auraria and Denver began as rival gold-seeking settlements on opposite banks of Cherry Creek near its confluence with the South Platte River in the fall of 1858. Though Auraria was the first permanent settlement in this part of the Kansas Territory, the fledgling town was soon absorbed into the rapidly growing city of Denver, which had established itself as the commercial center of region. Over the course of the late nineteenth century, the Auraria district – part of the broader Westside – became one of the city’s principal industrial areas, sandwiched between the central business district (CBD) to the east and the main railroad corridor in the Platte Valley to the west (Figure 1). Auraria industries included iron and steel works, railroad repair shops, machine shops, flour mills, bakeries, and breweries. In addition, the compact district also had extensive warehousing capacity, reflecting its role as an important regional distribution center linking Denver to its hinterlands in both the mountains (mining) and the plains (agriculture) (Etter, 1972; Leonard and Noel, 1990).
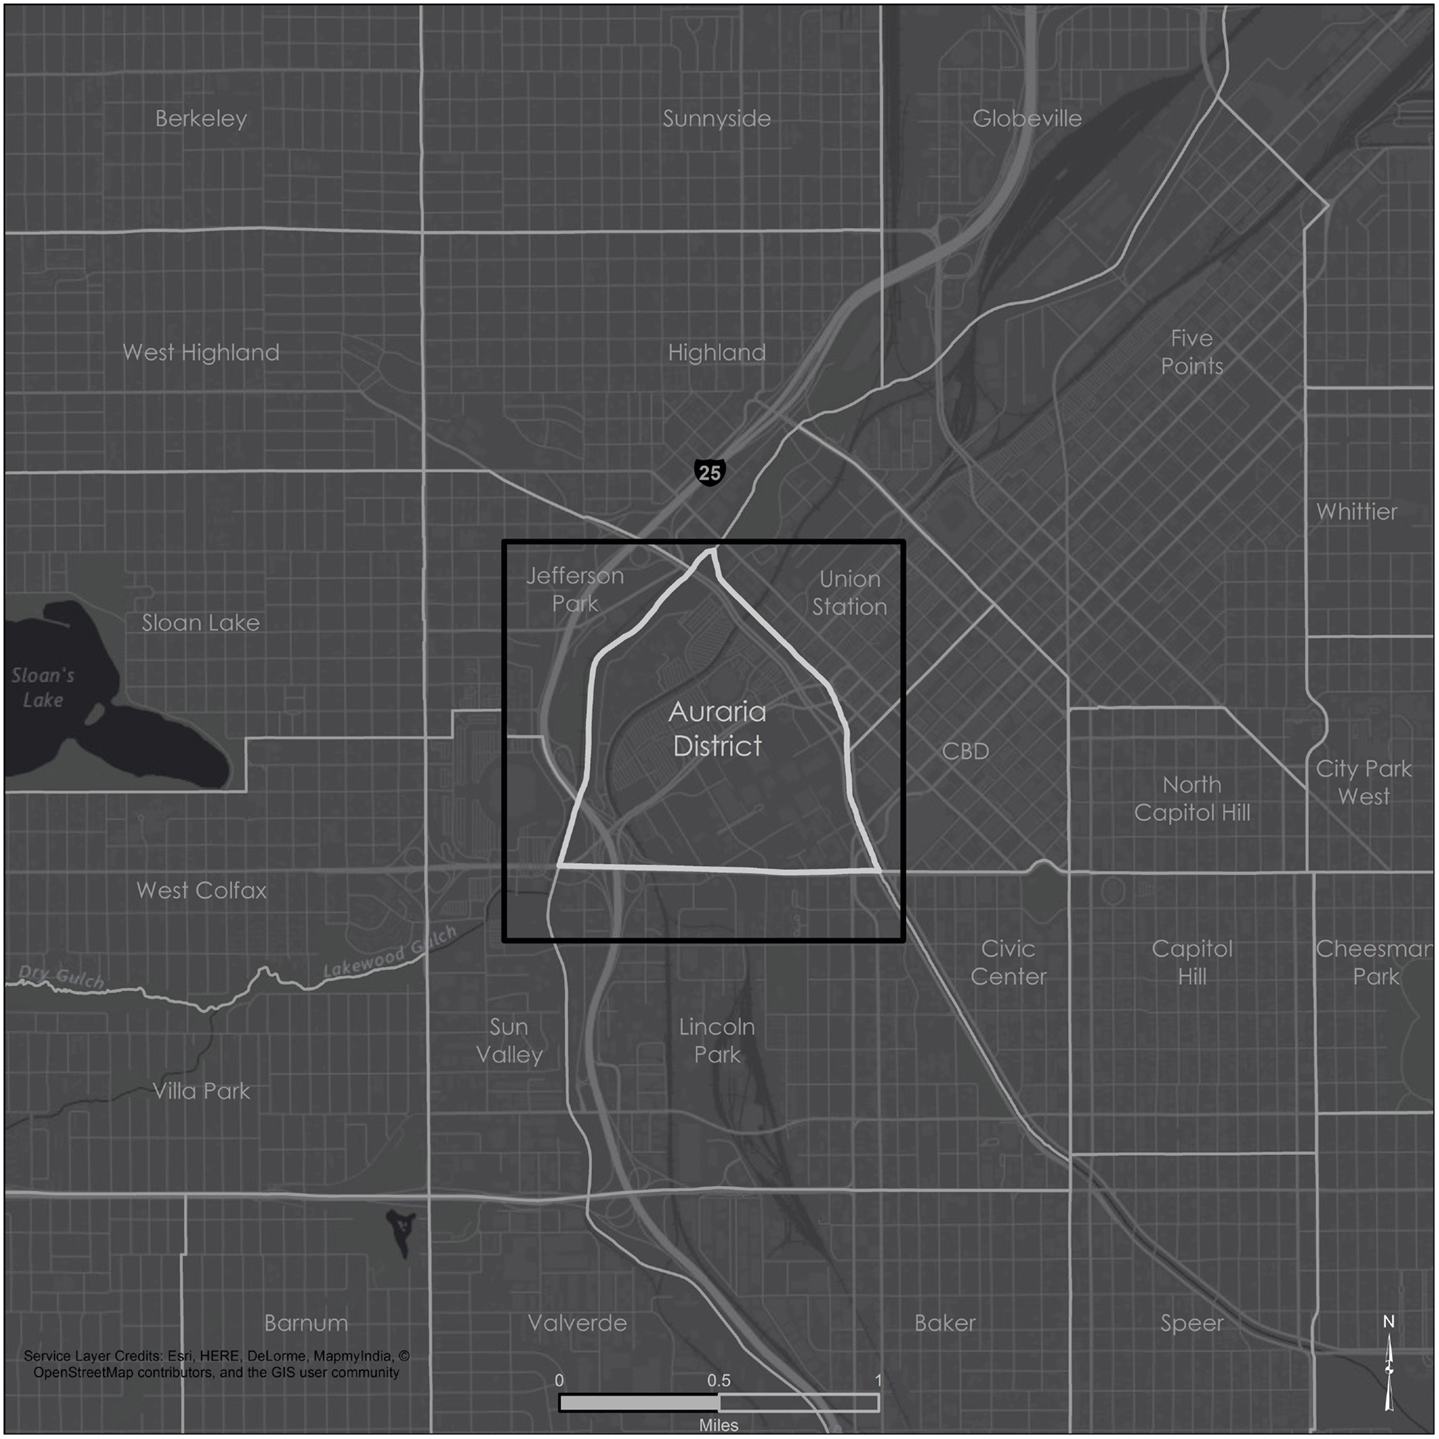
Figure 1. Auraria context.
The district also had residential neighborhoods with homes, churches, and schools. At first, Auraria’s housing reflected the full social gradient within the new city, from the poorest citizens to the most affluent. But with the development of horse car lines in the 1870s and then electric streetcars in the late 1880s, wealthier residents moved to new areas located further from the urban center where they could escape the crowded, noisy, and increasingly polluted streets of the industrial district. As a result, by the early 1900s, Auraria was primarily a working class area, serving as the first point of arrival for a series of impoverished immigrant groups seeking work in the surrounding industries. In the 1920s, Auraria’s neighborhoods became increasingly Hispanic as a result of migration from Texas, New Mexico, and rural Colorado. This Hispanic population grew to become the majority group in Auraria in the 1950s, by which time the district was one of the poorest in the entire city (Gallegos, 1985).
Demographic change was accompanied by dramatic economic changes as the twentieth century progressed. Auraria maintained its role as a hub of manufacturing and distribution activity through the late 1920s, but then entered into a period of extended economic decline characterized by business closings, employment loss, and deteriorating physical infrastructure. Behind these changes were broad shifts in economic geography. By the 1950s, the district’s small-scale jobbers – firms that operated warehouses and served as intermediaries between manufacturers and retailers – were being squeezed out of existence by the emergence of large-scale retailers who could deal directly with manufacturers and operate their own distribution facilities. At the same time, truck transport came to replace rail transport within these distribution networks, leading to the establishment of new sprawling warehouse complexes alongside major highways far away from the old city center. In essence, Auraria’s warehousing companies and the rail-based landscape they occupied were rendered obsolete. The district’s manufacturing base suffered a similar fate; as the location of manufacturing was decoupled from the railroad corridor, firms sought out greenfield sites where new industrial practices could be implemented free of the impediments associated with older factory configurations.
As Auraria declined in the post-war period, the metropolitan area overall experienced rapid growth associated with dramatic employment gains in energy development, federal government activities (particularly the military), and various technology sectors (Judd, 1983; Leonard and Noel, 1990). Downtown civic leaders were instrumental in orchestrating Denver’s rise to “sunbelt city” status, but the boom in employment and population occurred mostly in outlying suburban areas such as the Denver Tech Center to the south of downtown, and the Federal Center to the west. The deteriorating condition of the urban core suggested that this trend would continue:
By 1950, the fate of the downtown was very much on the minds of civic leaders. Little new investment had been committed since the early 1930s. The downtown had a shabby look: old brick buildings faced with bumpy streets, inadequately lit at night. Nearby slums encroached upon downtown, as in many other cities across the country. Many marginal businesses – pawn shops, bars, liquor stores, shoe shops, second-hand stores – sat uncomfortably close to the 17th Avenue financial district (Judd, 1983: 178).
In order to protect downtown Denver from losing out to competing business nodes both within the metropolitan area and more broadly within the inter-mountain west (e.g., Albuquerque, Salt Lake City), political and financial leaders sought to re-position the inner city so that it could successfully attract investment. This effort to reclaim downtown proceeded in much the same way as it did in other major American cities; the focus was on slum clearance and the policy instrument used was the federal urban renewal program enabled by the Housing Acts of 1949 and 1954.
The Denver Urban Renewal Authority (DURA) was created in 1958. By the mid-1960s, it had initiated six renewal projects. Most were relatively modest in scale and focused on the removal of “obsolescent residences” either from mixed use areas where they stood in the way of expanded industrial land use, or from older residential neighborhoods in need of “rejuvenation.” By far the largest renewal effort undertaken by DURA in this period was the Skyline project, which targeted “the most dilapidated portion of downtown Denver” for complete removal. The Skyline urban renewal area consisted of 27 square blocks in the heart of downtown. It bordered the 17th Avenue financial district to the east, and Auraria across Cherry Creek to the south. Skyline also contained some of the city’s oldest and finest examples of nineteenth century commercial architecture. The stated intent of the project was to transform the district into “an attractive area of modern apartments, office buildings and retail stores” while simultaneously eliminating Denver’s notorious “skid row” (Denver Urban Renewal Authority (DURA), (1965)). Voters approved the Skyline Project in 1967. Land acquisition and land clearance commenced immediately, leaving a huge swath of empty land at Denver’s core – a nearly blank canvas upon which an entirely new urban landscape gradually took shape over the next two decades.
With the Skyline project moving forward, DURA soon turned its attention to the neighboring Auraria district. In most respects, Auraria was the type of urban space that city planners across the country wanted to eradicate. Its commercial and industrial buildings were run down and outdated. Its old and deteriorating housing stock was owned mostly by absentee landlords, who put very little money back into their properties. The residents were poor and the neighborhood was widely considered to be a slum. From the outside looking in, no other district in the city so clearly fit the official definition of “blight.”1 But unlike Skyline, the urban renewal process in Auraria was not intended to provide the private sector with the opportunity to create another office tower/apartment district; rather, it was intended to support a public sector initiative focused on higher education.
Since the mid-1950s, the state legislature had been grappling with the problem of insufficient higher education capacity in Colorado, particularly in Denver. Planning to expand higher education facilities ensued, leading to the creation of the Metropolitan State College of Denver in 1963. Metropolitan State officially opened in rented space downtown in 1965. In response to this development, the University of Colorado began the process of converting its downtown Denver Extension Center into an independent campus. Both institutions grew rapidly and it soon became clear that existing facilities were not adequate. At first, these two institutions pursued separate campus expansion strategies, but by 1968 the idea of a shared campus had emerged and gained traction. A site selection process identified a large portion of the Auraria district as the preferred location of a new “mega” campus to house not only the University of Colorado’s Denver Center and Metropolitan State, but also the Community College of Denver. For the site to become available for this purpose, it would need to be designated as an urban renewal area by DURA (McEncroe, 1992; Abbott, 1999).
The selection of Auraria as the site for a new higher education complex represented a convergence of interests of the state’s higher education planning commission and DURA. For state planners, it provided a large enough site to accommodate the three growing institutions at a location that would be accessible to a broad range of students in the metropolitan region. For DURA, it provided the opportunity to undertake another large-scale and high visibility urban renewal effort in the heart of downtown, one that coincidentally would remove the “blight” that stood right next door to the agency’s signature Skyline project. The U.S. Department of Housing and Urban Development approved the 169-acre Auraria urban renewal plan in early 1969, committing $12.6 million to the project. As with most urban renewal projects, matching local funds were needed in order for the project to move forward. Denver planned to raise its share through general obligation bonds, which required voter approval (McEncroe, 1992; Abbott, 1999).
The bond issue passed in November of 1969, despite fierce opposition from the area’s residents and their advocates within the community (Rivera et al., 1998; Summers, 2003; Lee, 2012). The state approved funds for campus development in 1970. Over the next several years, relocation of Auraria businesses and residents moved forward – a process that was not completed until the summer of 1974. Campus planning and construction were plagued by the lack of a firm financial commitment from the state. As a result, the original plan to completely remove the district’s old built environment and construct an entirely new campus layout was abandoned in favor of simply using the existing network of streets and their underlying infrastructure as the basic organizational framework for development. Moreover, successful historic preservation efforts forced campus planners to retain several significant elements of the old neighborhood within the new campus, further emphasizing the pre-existing urban grid. A somewhat makeshift Auraria Higher Education Center thus took shape on the bones of the old district over the course of the 1970s. The campus was officially dedicated in January of 1976, but was not occupied by students, faculty, and staff of the three educational institutions until 1977 (Cameron and McFadyen, 1977).
Methods: Digital Design and GIS Process
Our effort to reconstruct the Auraria landscape that was erased through urban renewal is based on GIS methods and data derived from Sanborn fire insurance maps. From 1866 until late in the twentieth century, the Sanborn Map Company created and maintained detailed, large-scale maps that were used for fire insurance underwriting. Their maps document the growth and development of over 12,000 U.S. cities and towns for this time period. Sanborn maps contain information on building footprint, height, material type, fenestration pattern, land use, transportation access, address, and so forth. Data from Sanborn maps have been used in historical and geographical scholarship for many decades, most commonly at the scale of an individual building (for example, to identify architectural features and guide historic preservation efforts). By contrast, our approach closely follows Applebaum (1952), Sauder (1980), and Kolodziej et al. (2004) in attempting to use the maps to understand broad patterns of land use at the district scale.2
Our process for creating a GIS for the Auraria district involved digitizing original Sanborn maps, and geo-referencing them to a contemporary base map supplied by the City and County of Denver.3 The Denver Public Library’s Western History collection possesses and shares original large-format Sanborn map catalogs for the City of Denver in their original bindings. Individual hand-drawn maps are indexed in several volumes by date, which include map keys and indices of businesses.4 Typically, Sanborn volumes span many years and sometimes decades. They were used to record important changes to the urban built environment over time, so the beginning year within this range reflects the point in time when the map series was initiated while the ending year reflects the last year in which changes were recorded. Updates were made on an ongoing basis by literally pasting new building outlines and new notations onto the existing maps, giving each map a distinctive layered patina. In essence, each map is a palimpsest of accumulated moments of urban transformation within the specified date range, bearing cartographic witness to the dynamism of American cities. For this study, we used the Sanborn map volumes for Denver covering 1903–1928; thus, these maps provide a detailed representation of the character of the city’s built environment for 1928. The year 1928 represents an excellent point in time to study Auraria, because the district was at or near its zenith in terms of economic functionality and building density, before declining through the Great Depression and into the post-war years.
Individual Sanborn map pages covering the Auraria district and surrounding areas were digitized through digital image capture and editing. Over 100 pages from the Sanborn 1903–1928 volumes were photographed, of which 58 were ultimately geo-referenced. Because of the large size of the original map pages and the fact that they remain in their original bindings, the images were skewed, requiring editing (rotation, cropping) using Adobe Photoshop to achieve correct perspective (Figure 2).
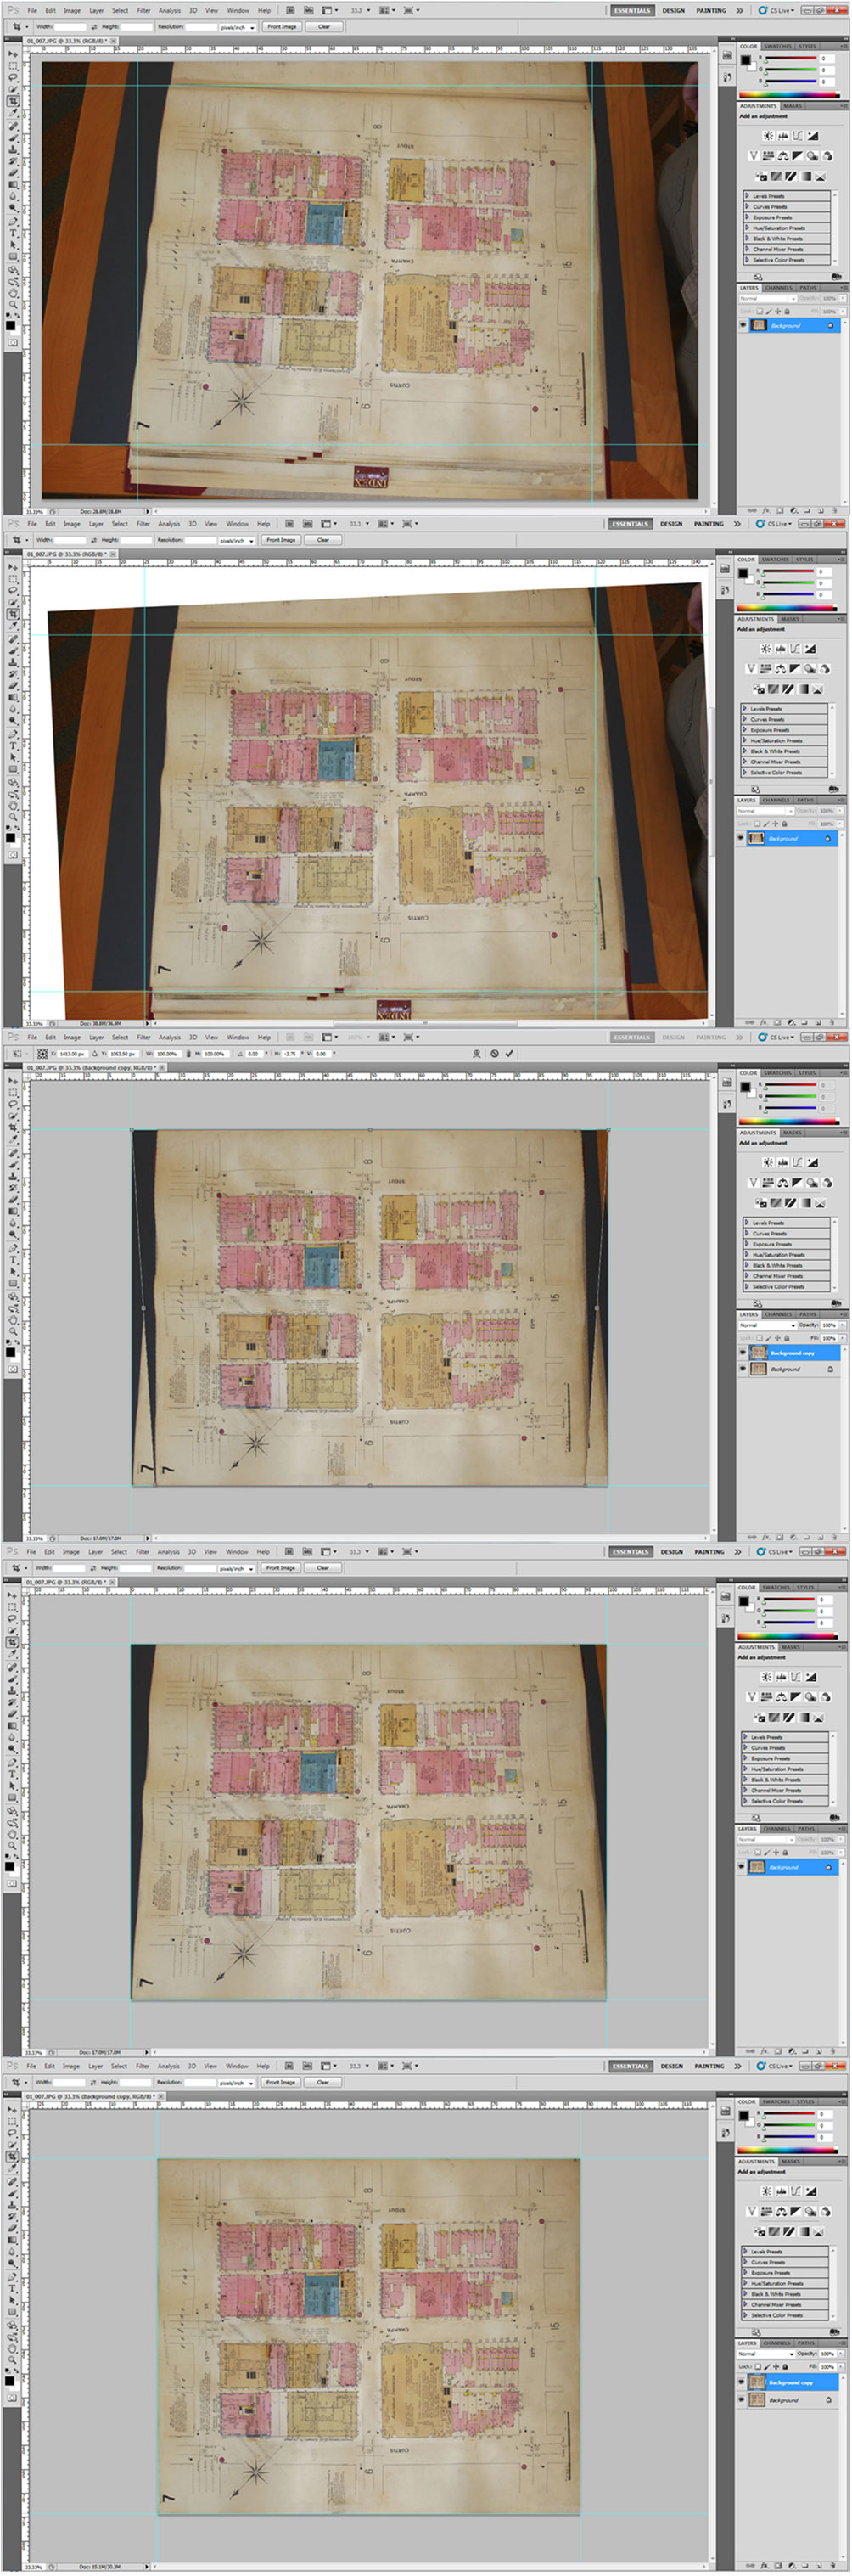
Figure 2. Sanborn digital process.
Following image editing, we used ArcGIS 10 to geo-reference the individual Sanborn map images to a base map of parcels, streets, buildings, and rail acquired from the City & County of Denver’s GIS Data Sales FTP site. The extent of the base map was established using a 2004 aerial imagery index, which provided a grid used to bound all vector-based data and to determine the edge of Sanborn map coverage (Figure 3). The geo-referencing process presented many challenges. Historic Sanborn map pages are stand-alone products not aligned to any modern coordinate system. Adding to the problem is the fact that large areas of the Auraria district either did not have streets in the Sanborn era or the street system has experienced dramatic change; so for these areas, there were few geographic references between the Sanborn maps and current spatial data. Moreover, most of the Sanborn map pages that we digitized were water damaged and warped, causing distortion in image capture that were then propagated during image processing.
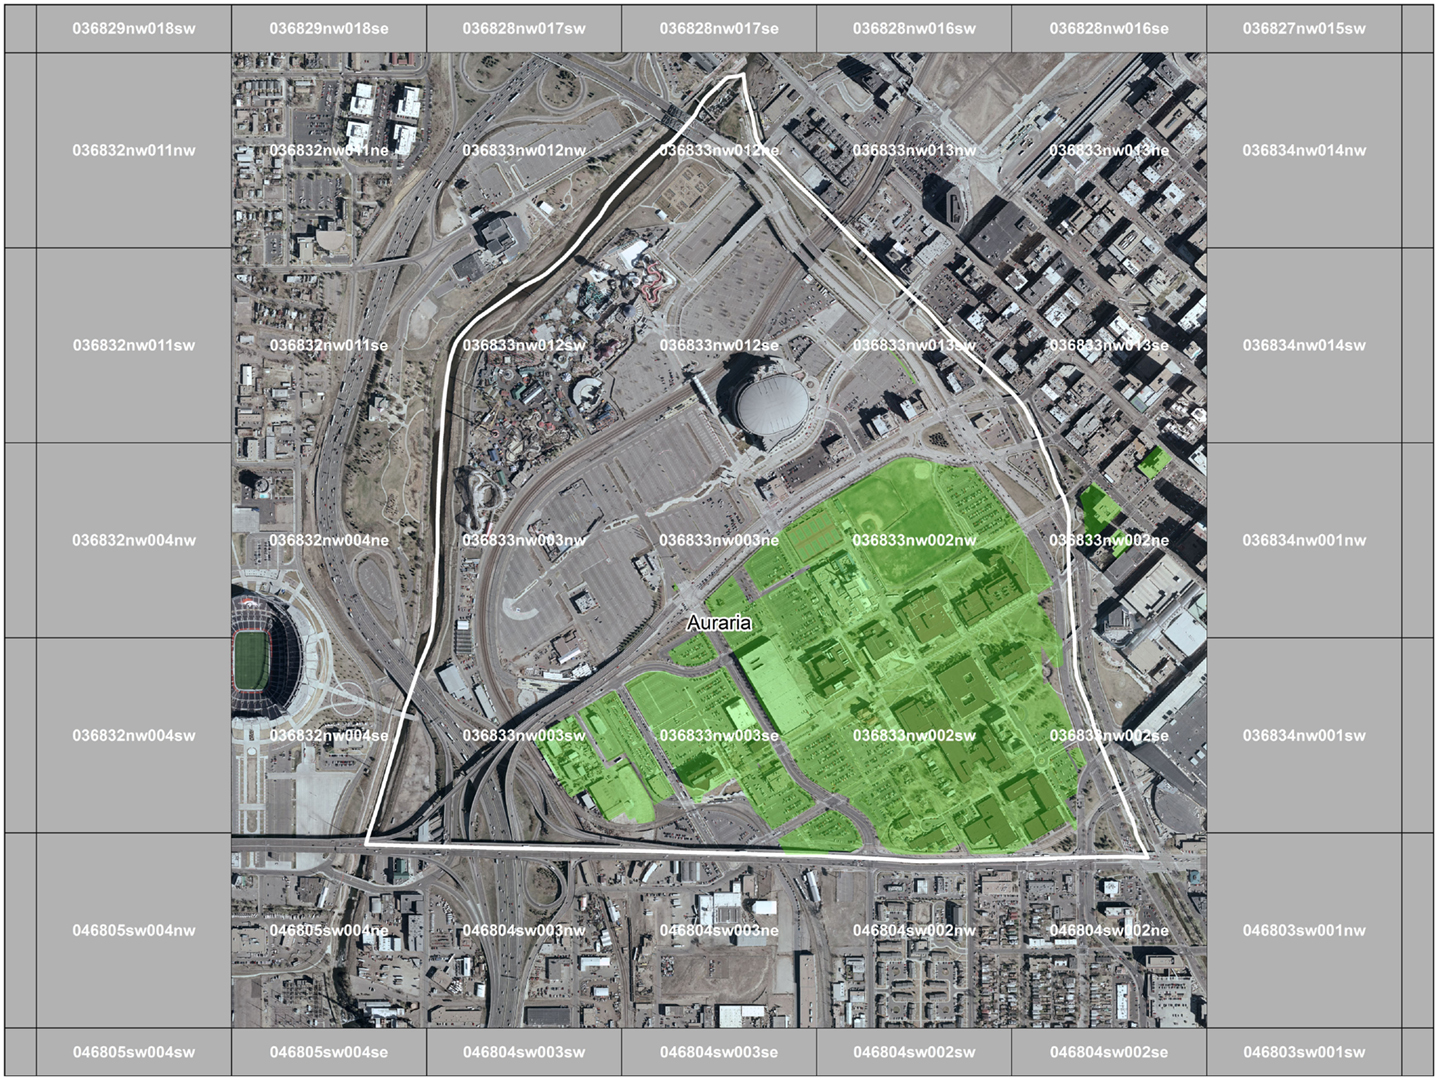
Figure 3. Auraria aerial imagery index.
To overcome these challenges, and to achieve the required spatial accuracy, geo-referencing was conducted on a block-by-block basis, using street centerlines and their related intersections as guides (Figure 4). Though there are visual warp effects in the geo-referenced Sanborn maps, they align very closely with modern GIS data, a tribute to the skill and diligence of the original mapmakers. After all 58 maps were geo-referenced using this method, a Sanborn map mosaic of the Auraria landscape for the year 1928 emerged (Figure 5). Note that blank spots in this map are areas that remained undeveloped in the Sanborn era; the maps were tools for evaluating fire risk, so a lack of structures resulted in no map for that area.
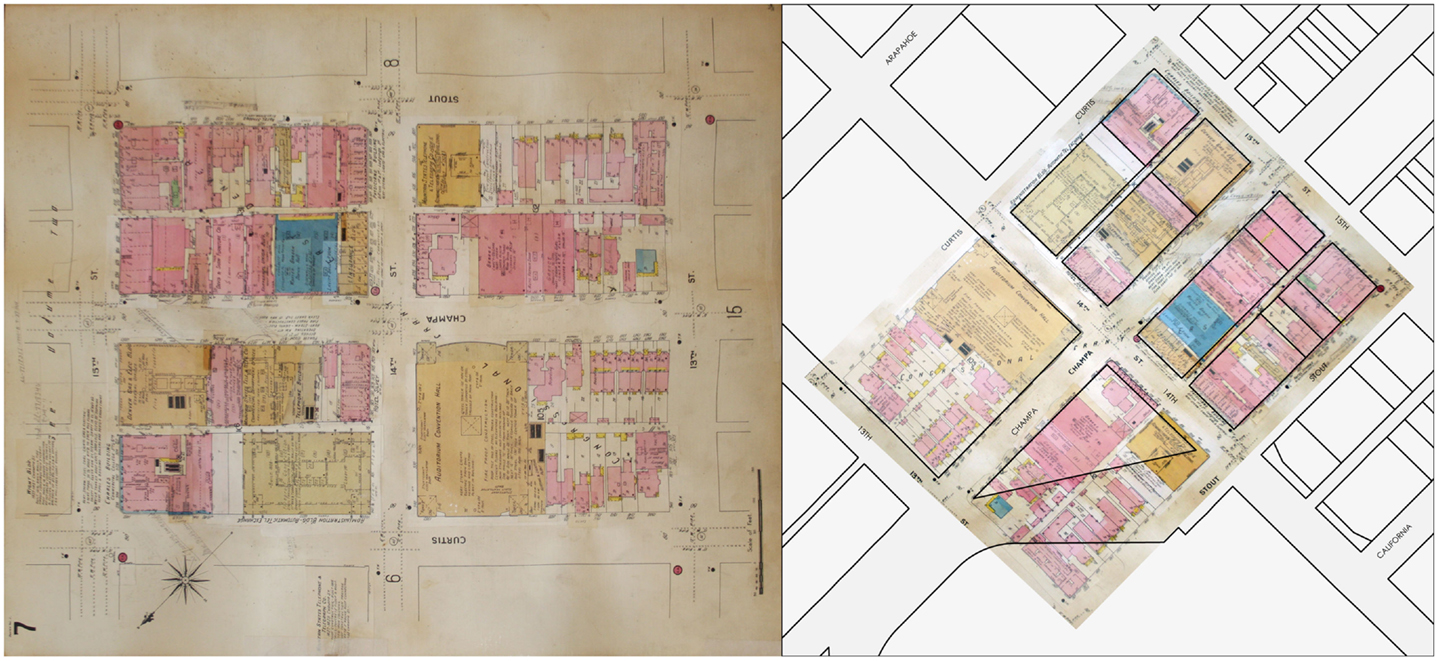
Figure 4. Geo-referenced Sanborn map pages.
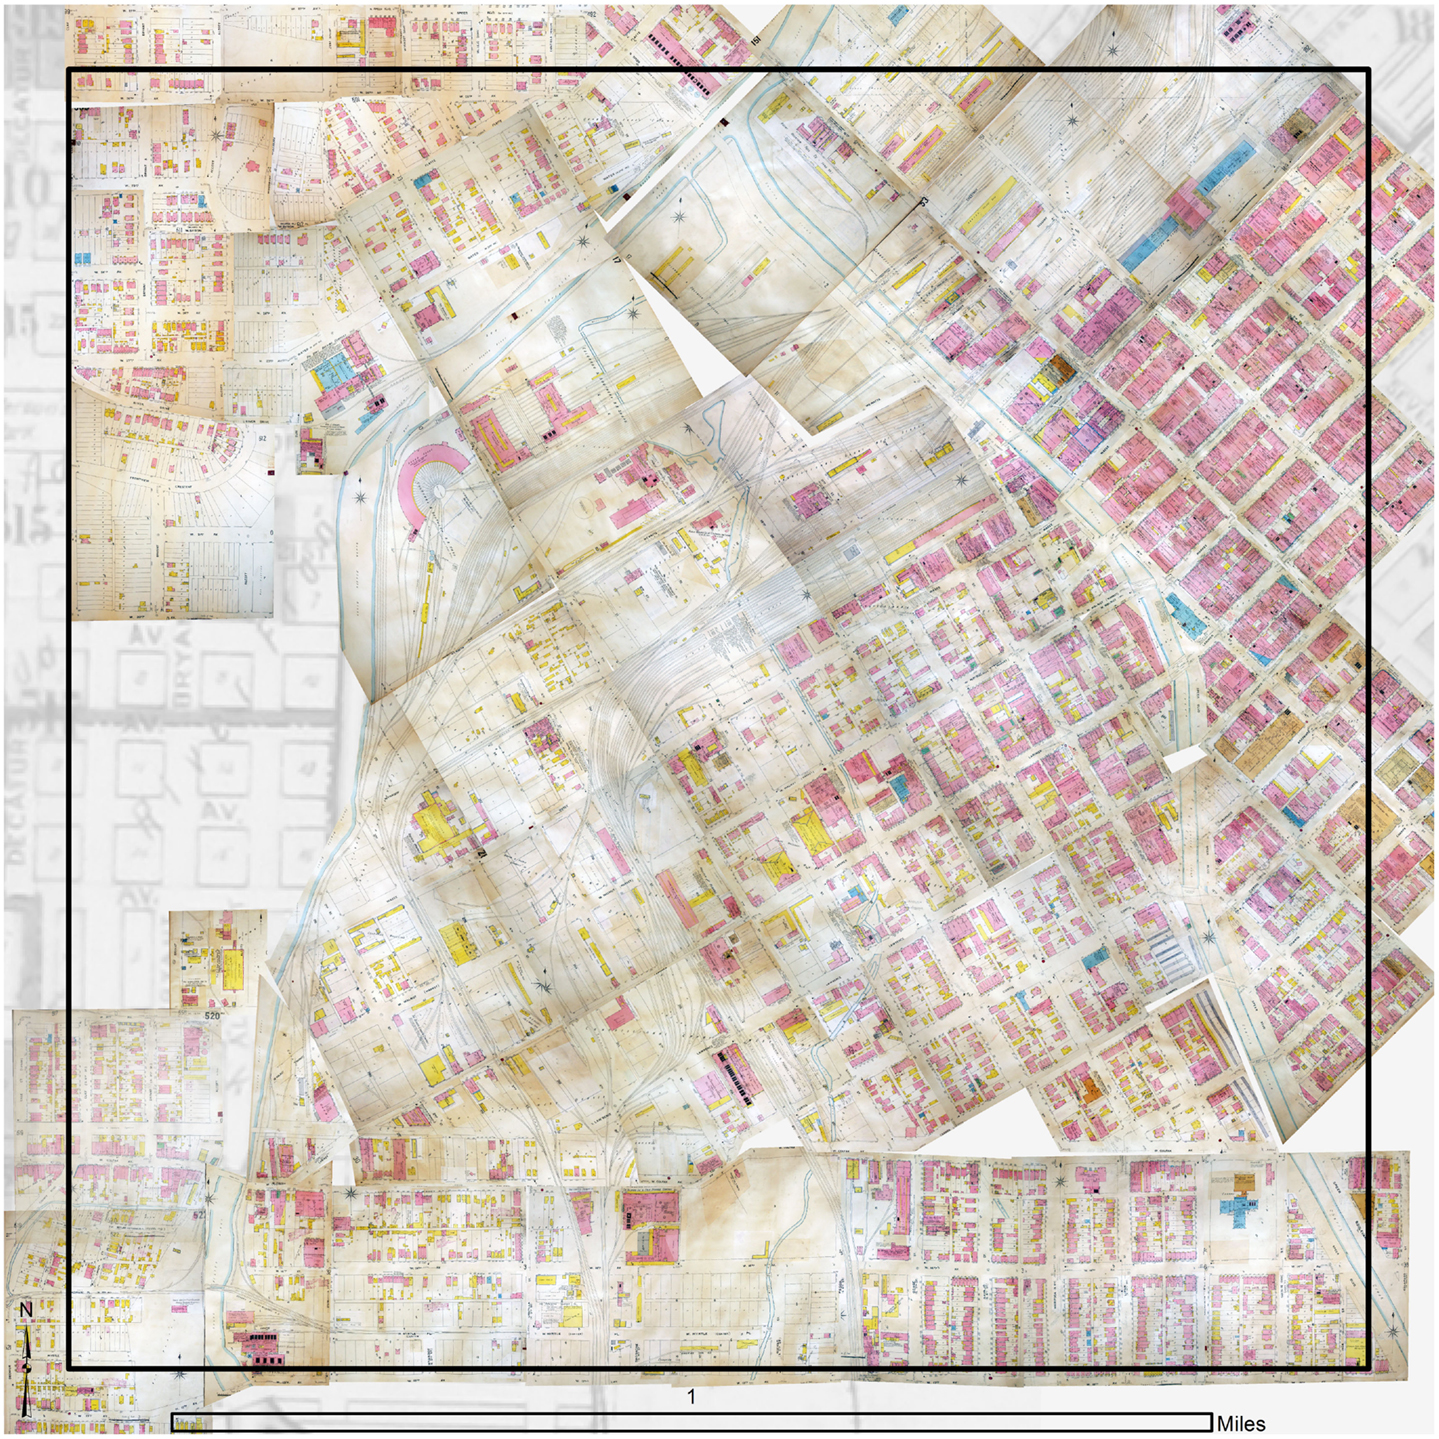
Figure 5. Sanborn mosaic 1928.
Once the Sanborn map images were geo-referenced to the base map, each building footprint in the district was digitized within ArcGIS 10, and associated attributes for each building were entered into the GIS database as coded values and stored as unique records for each footprint polygon (Figure 6). This process was time-intensive, but considerable efficiencies were gained through the repetition of procedures. Overall we coded 4,562 buildings by business name (if available), business type, address, land use description, land use code (based on LBCS function codes), construction material, building height, number of stories above ground, and year built (if available).
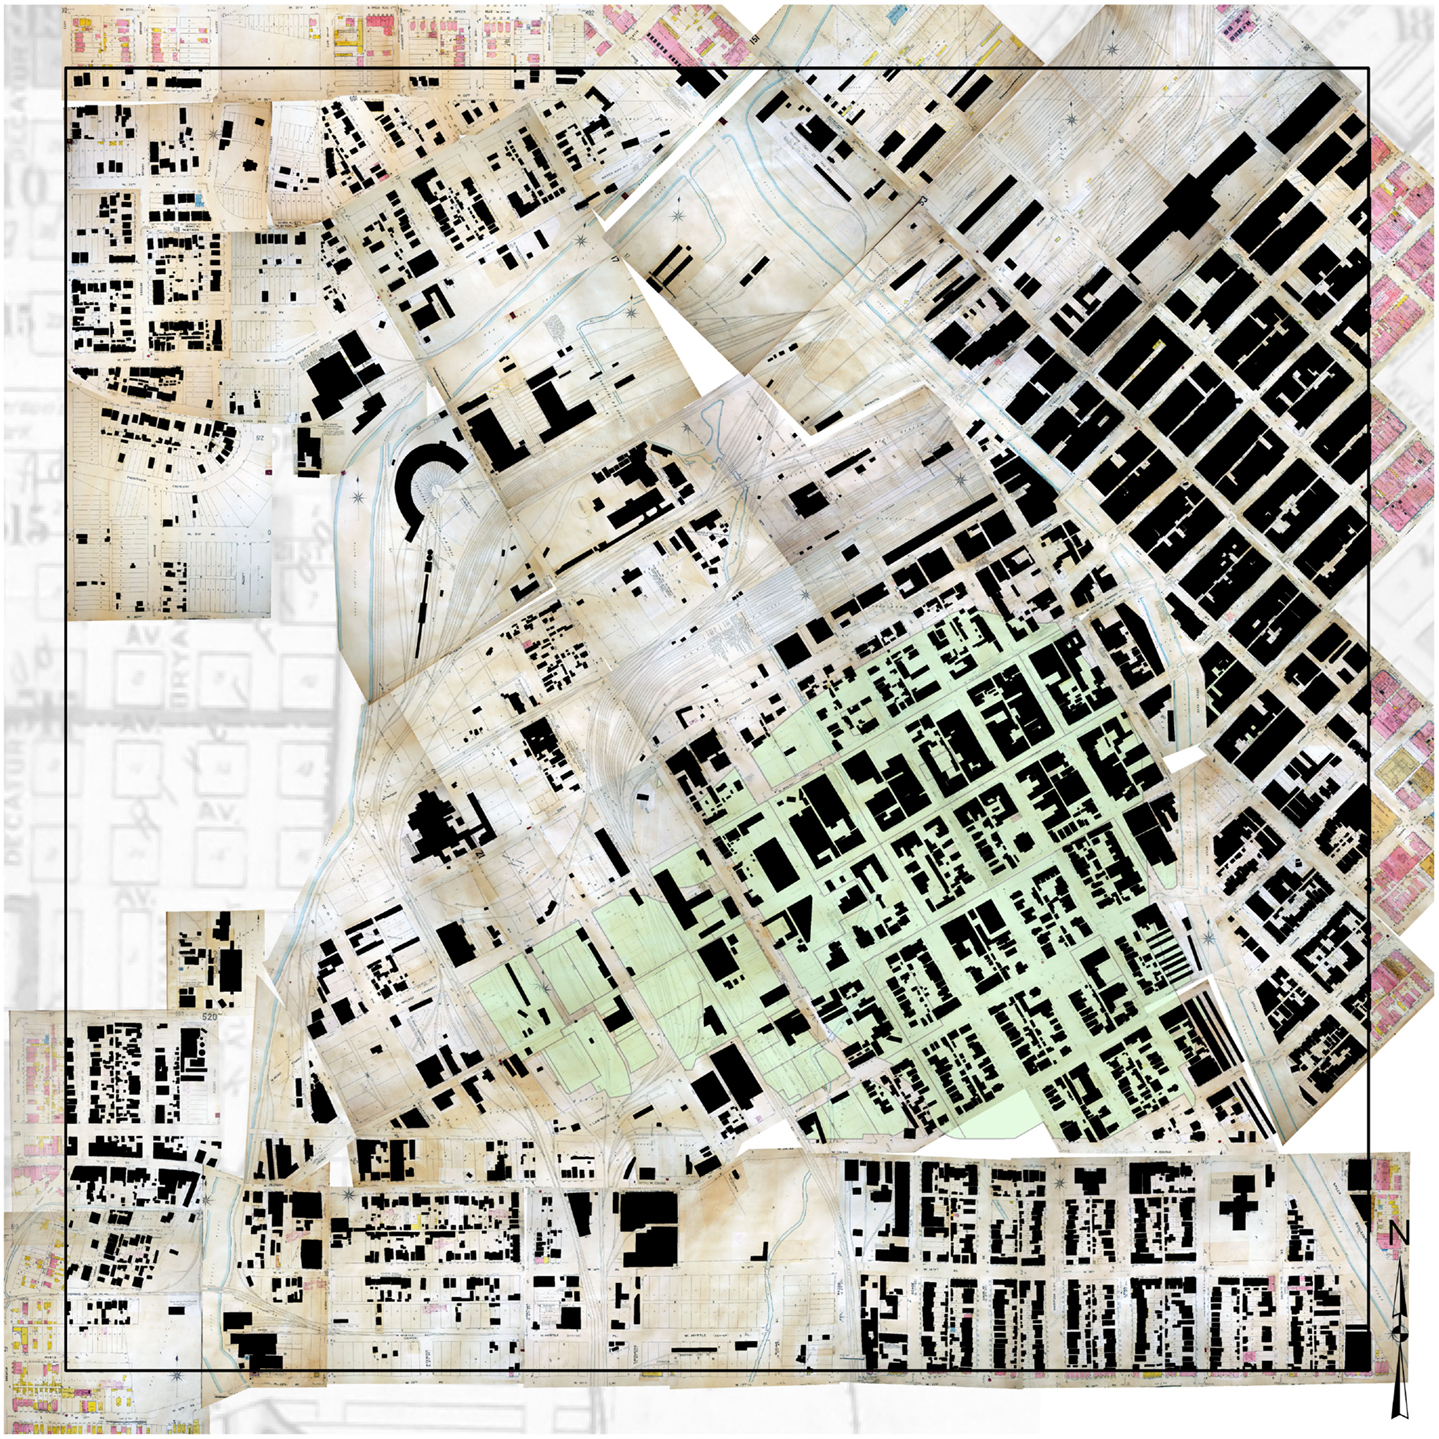
Figure 6. Building digitization.
Results: Envisioning Auraria 1928
With the basic historic GIS framework in place for the Auraria district, we began to explore the possibilities for visualization and analysis. As a first step, we produced an overlay of 2011 aerial imagery on the geo-referenced 1928 Sanborn mosaic in order to view both layers simultaneously (Figure 7). This overlay map illustrates the dramatic landscape contrast between these two points in time and serves as a powerful visual reminder of what lies “beneath” the modern city.
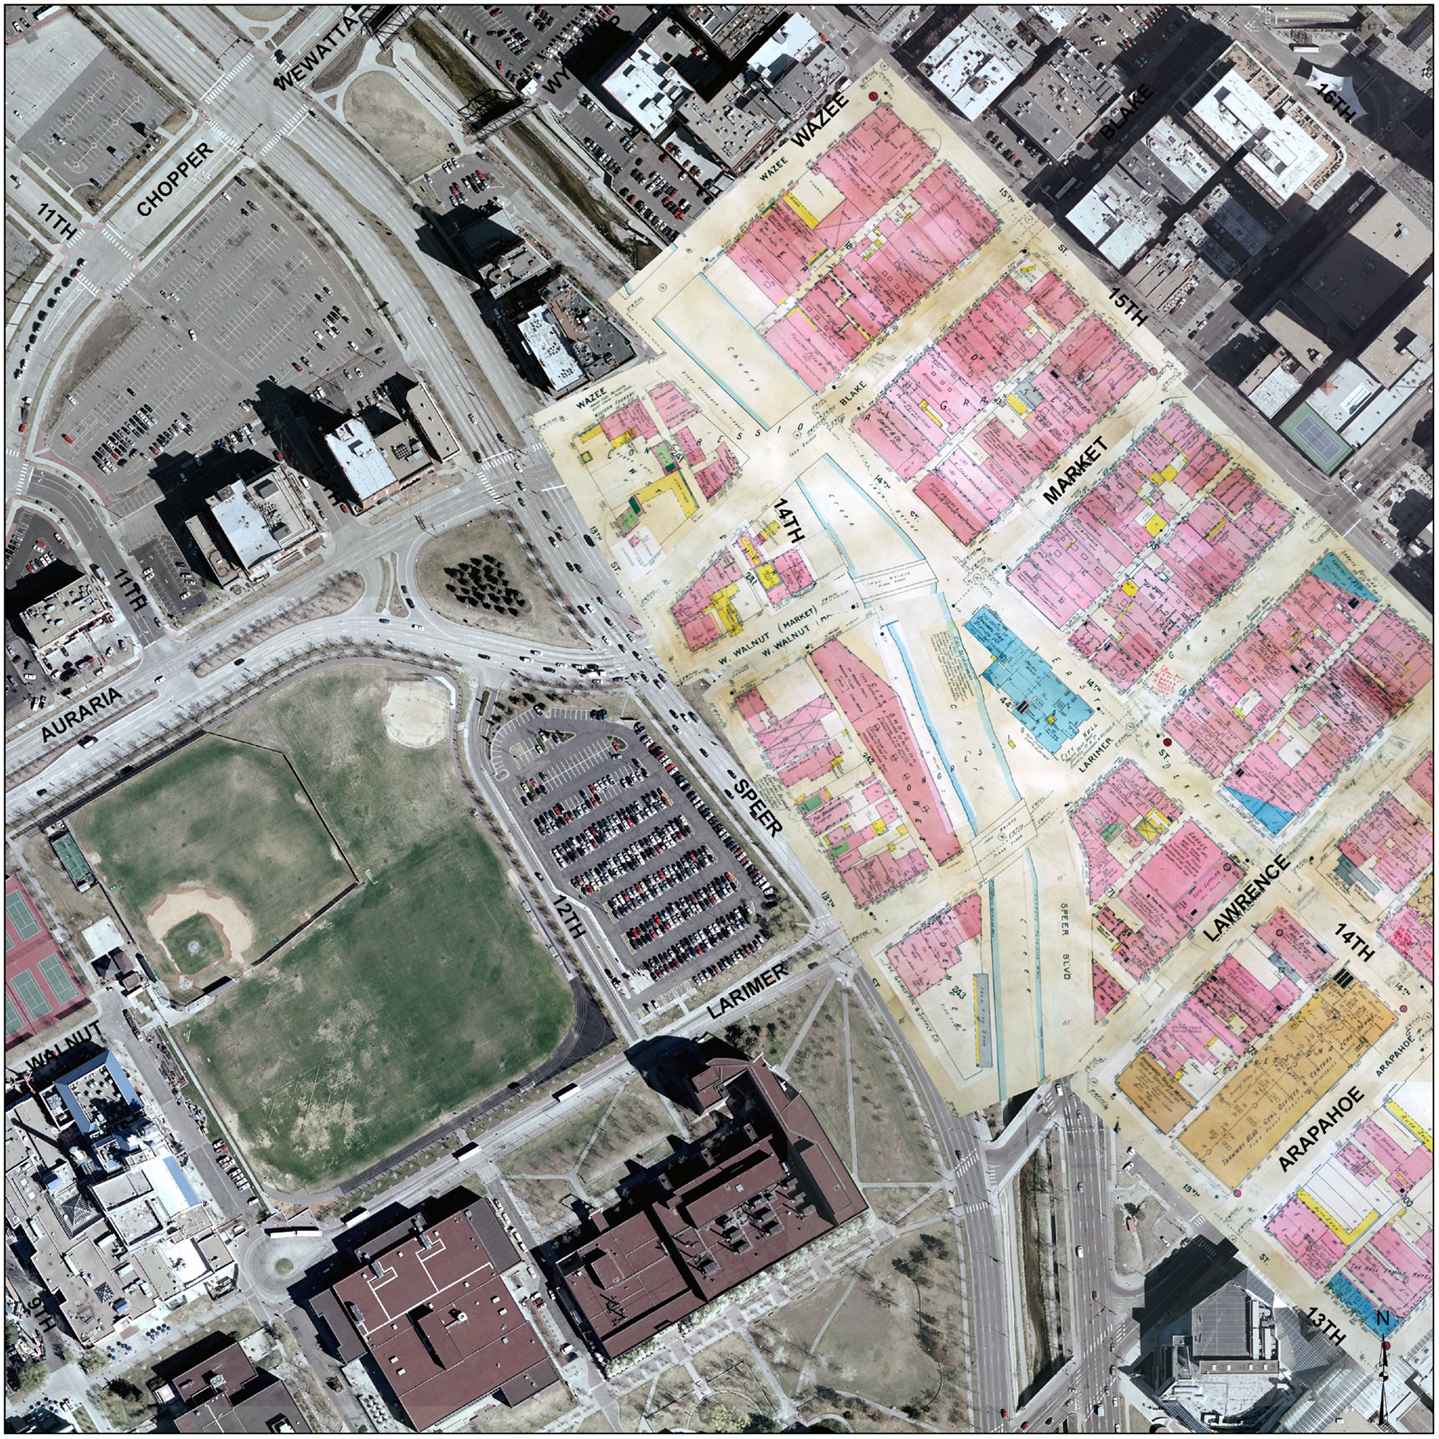
Figure 7. Sanborn overlay 1928 on 2011.
Next, we turned to land use analysis and spatial analysis to explore various aspects of the district in the year 1928, when it was at or near its peak of economic vitality and physical build-out. We defined land use based on an audit of 1903–1928 Sanborn Fire Insurance Maps and their associated use key. Our use definitions fell into the following seven categories: residential, mixed use, commercial, warehousing, manufacturing, industrial, and civic, using the following criteria:
Residential: buildings designated with “D” for dwelling, or “apartment,” “flats,” “hotel,” or “lodging.” Dwellings typically indicate a single-family home, while apartments and flats are single or multi-story multi-family structures. We also included hotels and lodgings as residential uses given their use by temporary workers, recent immigrants, and visitors for dwellings.
Mixed use: any of the above residential designations and some other use, such as “S” for store or any other use described below. Our definition of mixed use is broad given some lack of detail available from the Sanborn maps.
Commercial: buildings designated with “S” for store, or descriptions of commercial, retail, or service uses, such as parking garages, “bakery,” “barber,” or “office.” We acknowledge that multi-story structures may have commercial on the ground floor and residential on the upper floor(s), but if there was no indication of this on the map, we only coded these structure based on the indicated land use, which was typically commercial or residential, not both.
Warehousing: any building with “warehouse” notation in description, or other indicated use in the storage or warehousing of goods. Our definition of warehouses is based largely on the transfer of goods, rather than the manufacture (manufacturing category) or sale of goods (commercial category), while being cognizant of the possibility that warehousing establishments may have also been wholesale sales outlets for goods.
Manufacturing: any building with “manufacturing,” “mfg,” or other indicated use in the production of goods. Distinct from warehousing or industrial land use, manufacturing is in the business of making things rather than storing (warehousing) or selling (commercial), and are distinguished from industrial uses by a smaller scope with lesser impact based on their production.
Industrial: any building described as an industrial use, including coal or fuel production, and heavy industry, such as foundries. Industrial uses include large scope and high-impact production facilities, but more particularly include heavy industries as described above.
Civic: uses such as municipal buildings, churches, schools, public transportation. We used a broad definition of civic uses as a catch-all for uses that fell outside of the definitions above, but also fell within the purview of what may be considered largely public facilities.
Based on these land use categories, Table 1 shows our calculations for the following: (1) the total number of buildings in our study area per category; (2) the total building footprint square footage per category; and (3) the total square footage per category. In our estimation, total square footage is the most useful calculation for providing an accurate comparative assessment of the various land use categories in the district, as it captures the square footage for all building stories, not just the building footprint. When evaluating Auraria in this manner for 1928, we see that warehousing was the most prominent land use, accounting for over a quarter (26.65%) of the total district square footage. Manufacturing (18.57%) and industrial (16.46%) were the next most significant land uses, followed closely by residential (15.93%) and commercial (10.56%) uses. The categories of civic use (7.39%) and mixed use (4.44%) are present, but account for significantly less use in the district. It is also interesting to note the number of structures dedicated to each land use. Of the 1086 structures within our district boundary, there were 445 residential, 162 warehousing, 152 commercial, 134 industrial, 127 manufacturing, 36 civic, and 30 mixed uses.
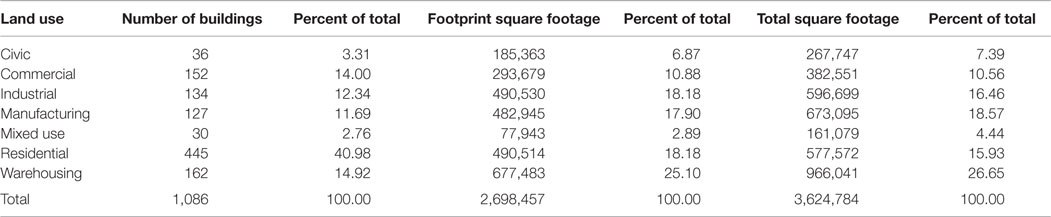
Table 1. Land use calculations for the Auraria district, 1928.
Figure 8 shows the spatial pattern of historic Auraria land use. Overall, the pattern is jumbled, with residential, commercial, warehousing, manufacturing, industrial, and civic uses intermingled within the district. This blending of multiple land uses is most pronounced at the center of the district along the Larimer Street corridor. All seven of the land use categories are present in the 12 blocks lining Larimer Street between 8th Street and Cherry Creek. Upon closer inspection, it can be seen that two of these blocks contain six land use categories, six of the blocks contain five land use categories, two blocks contain four land use categories, and the remaining two blocks contain three land use categories.
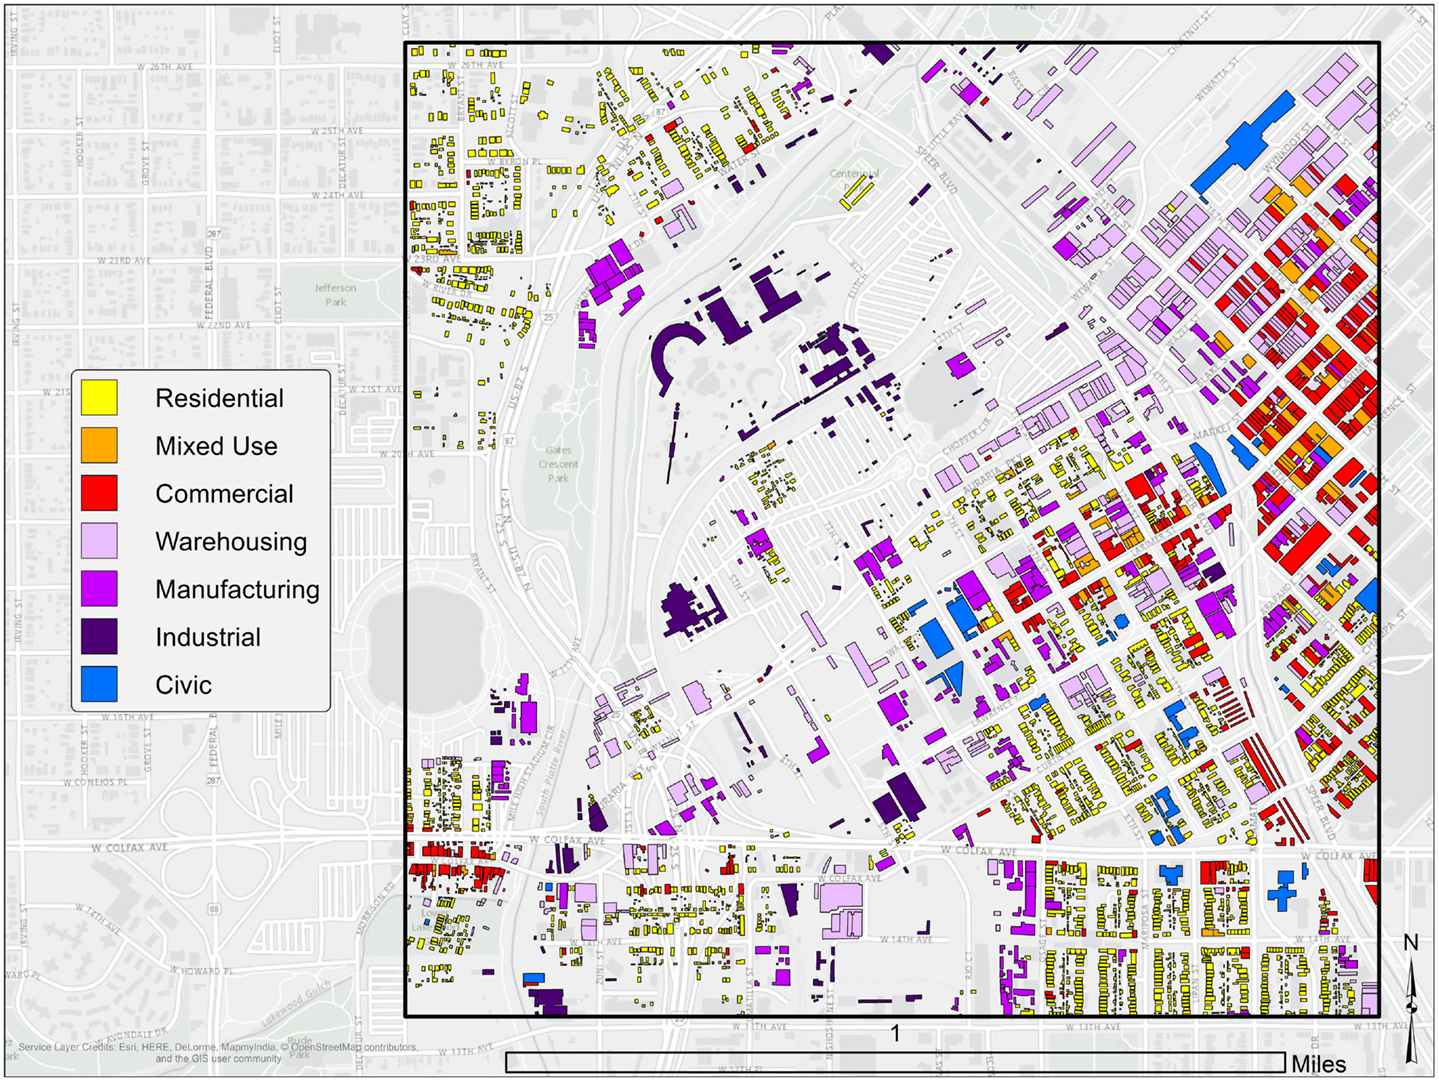
Figure 8. Auraria land use by structure 1928.
Even though the district overall was characterized by a broad mix of land uses, it is still possible to discern a pattern of zones in which particular uses predominated. We used a spatial analysis tool to determine “region groups” based on primary land use. Figure 9 provides a visual survey of such broad land use patterns, showing the predominant land use for each block of the district and for the blocks in adjacent areas. Within the Auraria district, five different land uses predominated in 1928: industrial, warehousing, commercial, residential, and manufacturing. The western half of the district was dominated by industrial uses along the South Platte River. Building density was low in this area because of the space taken up by the city’s main railroad corridor. An area of warehouses sat alongside the railroad tracks in the northern part of the district. These industrial and warehousing areas formed the western and northern borders of the district’s more densely occupied commercial and residential neighborhood. The core of the district is the commercial corridor along Larimer Street, which is flanked by residential areas to the north and south. Homes in these residential areas were mostly small, one-story buildings. The average height of houses in the district was 1.18 stories, and the average square footage was 1,298 square feet. A small area where manufacturing predominated sits just to the south of the commercial corridor adjacent to Cherry Creek.
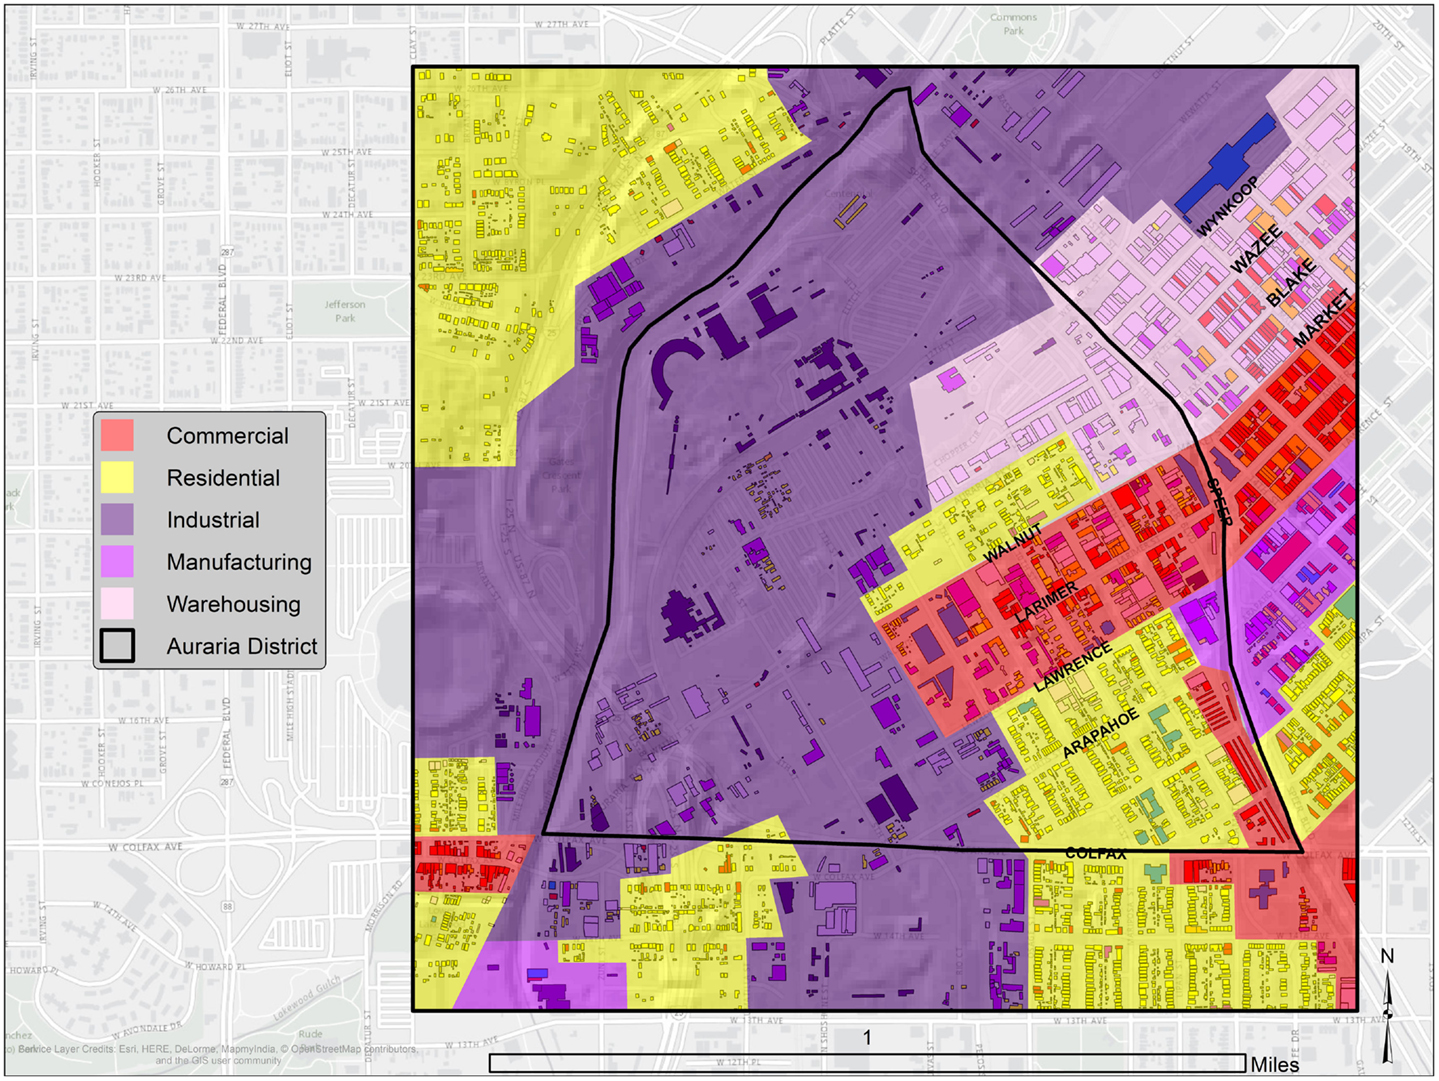
Figure 9. Auraria land use by region group 1928.
While the Auraria GIS allows us to describe the internal characteristics of the district in 1928, it also allows us to assess the district’s relationship to surrounding parts of the city. Referring again to Figure 9, what is important to note is how each of Auraria’s broad land use areas was integrated into the wider urban fabric. Four primary connections are present here: first, the continuation of industrial activities both north and south of Auraria along the South Platte river; second, the extension of the warehousing area along the northern edge of the district across Cherry Creek into Denver’s main jobbers row in the blocks adjacent to Union Station (what is now called Lower Downtown, or LoDo); third, the extension of the district’s Larimer Street commercial corridor across Cherry Creek to the north and east and into the city’s CBD; and fourth, the continuation of the substantial residential area in the southern portion of the district southward across Colfax Boulevard into the Lincoln Park neighborhood.
As an extension to our spatial analysis, we produced initial 3D visualizations of the district for 1928. Each building in the database contains information on building height derived from the original Sanborn maps, allowing us to “pop-up” that building from its digitized footprint and render it in three dimensions (Figure 10). Because of the exploratory nature of creating more detailed 3D visualizations, we chose to test the method on a limited portion or the overall district focused on its boundary with the Denver CBD. Using Sketchup and Revit software, we produced two 3D “birdseye” visualizations of this part of the district: one looking east toward downtown from Auraria (Figure 11) and another looking west away from downtown into Auraria along Larimer street (Figure 12).
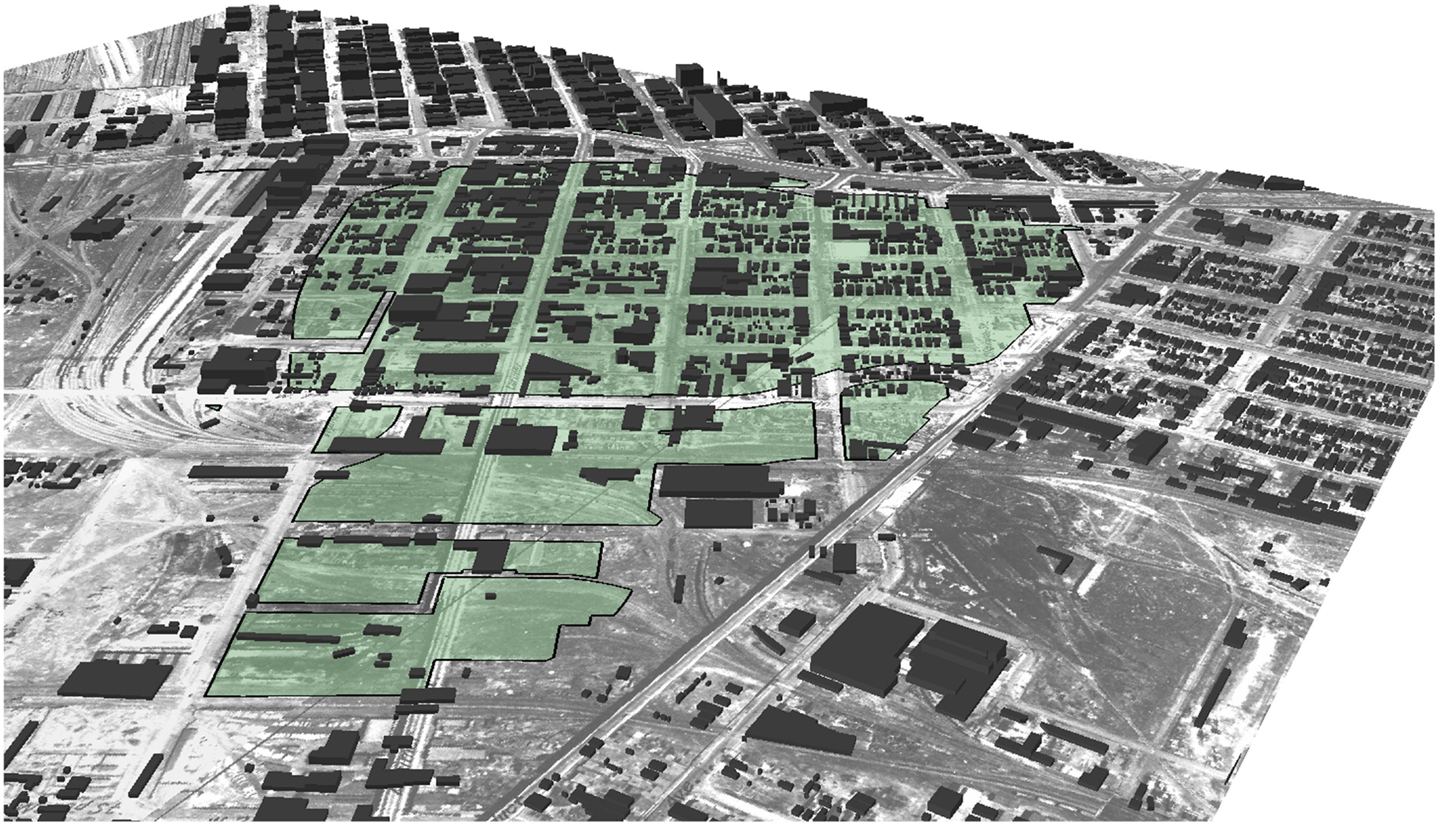
Figure 10. 3D base structure.
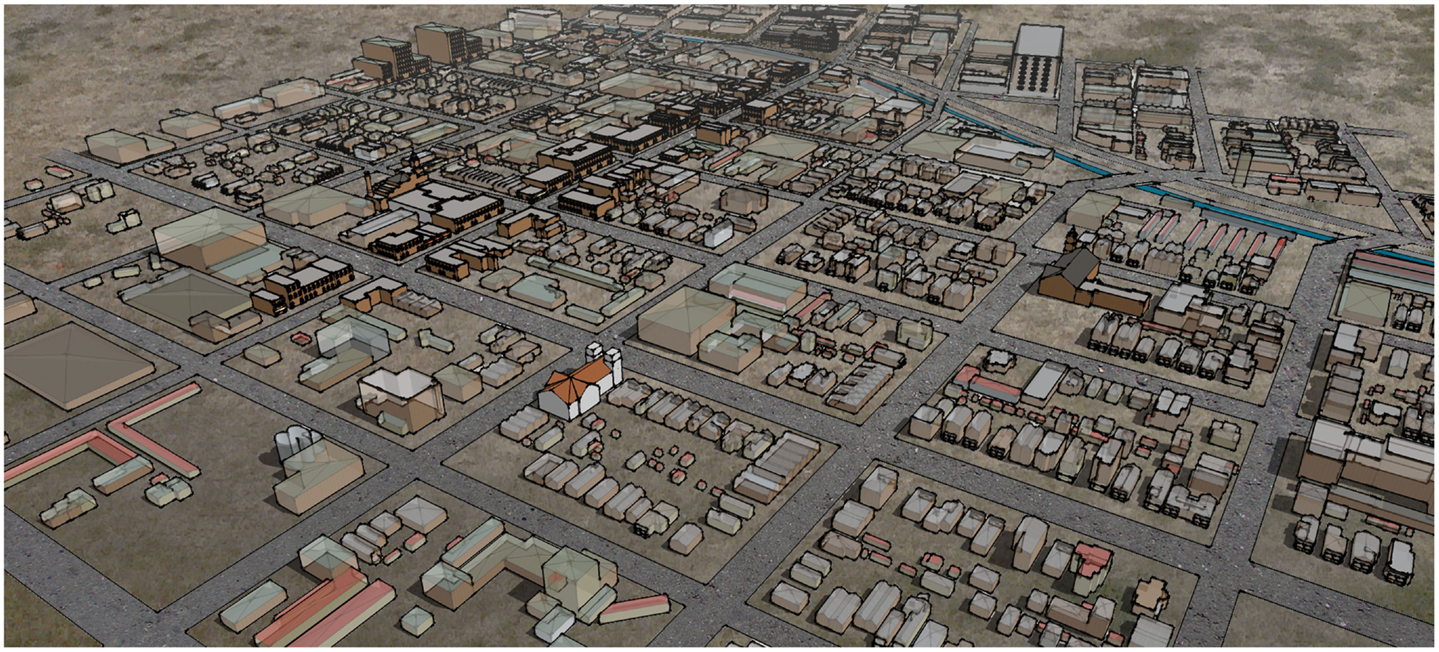
Figure 11. 3D historic rendering looking east.
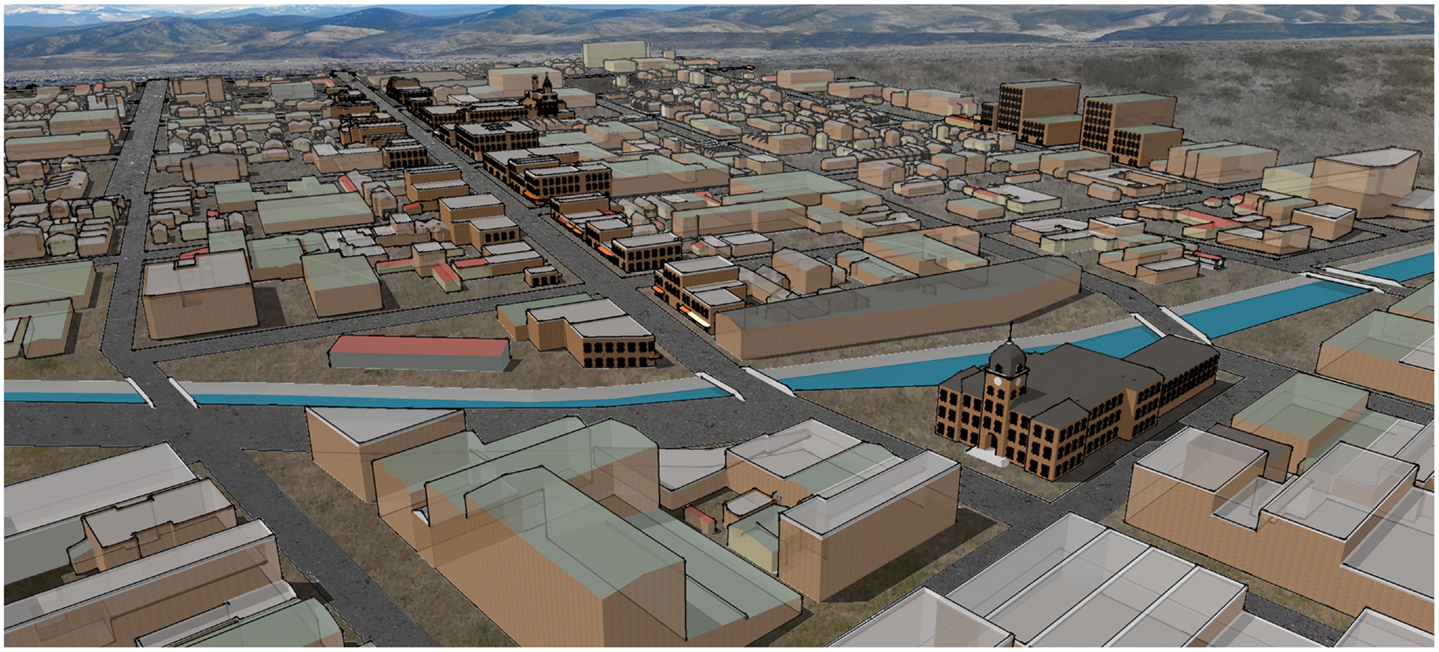
Figure 12. 3D historic rendering looking west.
The maps and visualizations of historic Auraria provide insight into both the internal characteristics of the district and how it fit into the wider space-economy of downtown Denver. Even in the late 1920s, Auraria, Denver’s oldest district, persisted as an excellent example of what Kenneth Jackson calls the pre-streetcar “walking city” of the nineteenth century – a place where factories, warehouses, homes, stores, churches, schools, and shops sat in close quarters, and sometimes altogether on a single block (Jackson, 1985). By the early twentieth century, Denver, like most American cities, had adopted orderly zoning practices based upon the segregation of incompatible uses specifically designed to prevent this jumbled land use pattern. So, as the city expanded outward, land use became more specialized, leaving Auraria at the center as a remnant zone where multiple uses continued to co-exist. In fact, our reconstruction of 1928 Auraria provides a remarkable picture of historic urban morphology produced through the dynamics of industrial urbanization in the middle and late nineteenth century.
It is also clear from our reconstruction that Auraria was not set apart or isolated from other parts of the city. Rather, it was an integral piece of Denver’s urban core, with each of the district’s edges representing a continuation of similar uses in adjacent areas (e.g., housing to the south, warehousing to the north, and commercial areas to the east). More broadly, Auraria in 1928 can be interpreted as the western edge of a contiguously built-out downtown area, and perhaps as a buffer separating the rest of downtown from the rail and heavy industry corridor in the South Platte river valley. In fact, Auraria and adjacent parts of downtown were completely intermingled both functionally and spatially across Cherry Creek. Buildings were constructed right to the edge of the narrow creek, while regularly spaced bridges on the main arterial streets knit both sides into a coherent urban whole. The heart of this interconnection was the Larimer Street corridor, anchored by the old Denver City Hall located on the east bank of Cherry Creek. From this central point, Larimer extended east into downtown and west into Auraria, forming the city’s primary historic commercial spine.
Discussion
The intent of this research was to use digital sources and methods to improve our understanding of urban history, and in so doing contribute to the advancement of scholarship in the digital humanities [see Gregory (2014)]. Specifically, we sought to rectify the neglect of districts removed through urban renewal in the post-war era by developing a way to reconstruct such “lost” landscapes using GIS and data derived from historic Sanborn fire insurance maps. We tested this method using the case of Denver’s Auraria district, which was removed as part of an urban renewal project in the early 1970s. Urban renewal at Auraria closely resembled the experience in other American cities: a powerful coalition of government, business, and real estate interests acted to raze a poor, minority neighborhood at the center of the city in order to achieve broader urban revitalization goals (Teaford, 1990; Fogelson, 2001).
There are several implications of the research to discuss. First, the Auraria case provides proof of concept for our method of historic landscape reconstruction. We successfully digitized and geo-referenced a large number of historic Sanborn maps for our study area, creating a Sanborn compilation, or mosaic, for the entire district. Our approach can readily be applied to other cities in the US for which Sanborn maps exist. Depending on time and resource constraints, this method can be scaled-down to cover just a few contiguous blocks, or scaled-up to create geo-referenced Sanborn mosaics for entire cities.5 Such reconstructions could focus a single point in time as we have done here, or could take a comparative approach by using different Sanborn volumes to focus on multiple points in time.
Second, the Auraria case shows how the use of GIS methods in historical scholarship can lead to an enhanced understanding of the past; there is much that GIS can do that could not be done before. For instance, physical Sanborn maps can only be viewed as individual map pages covering just a few city blocks, whereas through digitization, a mosaic of dozens of individual map pages can be created, enabling a more comprehensive view of the historic city. Geo-referencing of a Sanborn mosaic then makes it compatible with other digital spatial data, allowing for layered temporal comparisons at a broad scale and a new perspective on how urban landscapes change through time. Similarly, attribute data for individual buildings can be gleaned from the paper maps, but digitizing buildings and parcels, linking these to associated attribute tables, and employing GIS analysis reveals broader-scale patterns of, among other things, building massing, land use, and spatial connectivity, leading to an improved understanding of how the historic city looked and how it functioned. Indeed, analysis of our preliminary Auraria GIS provided new information about the lost district, delivering substantial original insight into its spatial organization, its mix of land uses, and its relationship to surrounding parts of the city in 1928.
But there is much more that can be done to deepen and extend the geo-database. Future research plans, therefore, include the following: (1) linking each property address in the district to historic city directory listings in order to add detailed information on businesses and residents and gain a better understanding of who lived and worked in the district; (2) linking digitized, publically accessible historic photographs of Auraria to the base map at the precise location from which the original photograph was taken in order to gain perspective on historic street level experience; and (3) using an extensive block-by-block collection of photographs of the district’s building stock in 1972 held by the Auraria campus library to render more accurate building details for use in improved historic 3D visualizations.
Our long-term goal is to make this expanded and more detailed Auraria historical GIS publically accessible via interactive large-scale digital wall technology. Here, the idea is to create a “living” GIS able not only to educate the public on the district’s history, but also able to incorporate community-generated contributions in the form of written personal narratives, personal photographs, images of memorabilia, videotaped oral histories, building histories, business histories, and so forth. In this approach, each community contribution would be tied to a specific address or location on the base map, allowing the GIS to become an ever-evolving repository of the district’s history – a framework housing stories of urban life in the neighborhood and reflections on human experience and the meaning of place.6
Third, while the primary purpose of our research was to shed light on historical conditions, it can also contribute insight into contemporary urban planning and design problems. When the Auraria campus was built during the 1970s and 1980s, planners were careful to separate the campus from downtown, despite the fact that many University of Colorado Denver programs were housed off campus in downtown buildings. The main strategy for effecting this separation was to create a large buffer along Speer Boulevard and Cherry Creek. The buffer – combined with an overall design philosophy that favored the building form, density arrangements, and access patterns of suburban office park development – reflected a retreat from the urban core that lay next door. In essence, campus planners, perhaps fearing interaction between students and the urban citizenry, successfully severed Auraria from every part of the environment that surrounded it, creating an island ringed on all sides by six lanes of fast-moving traffic (Figure 13).
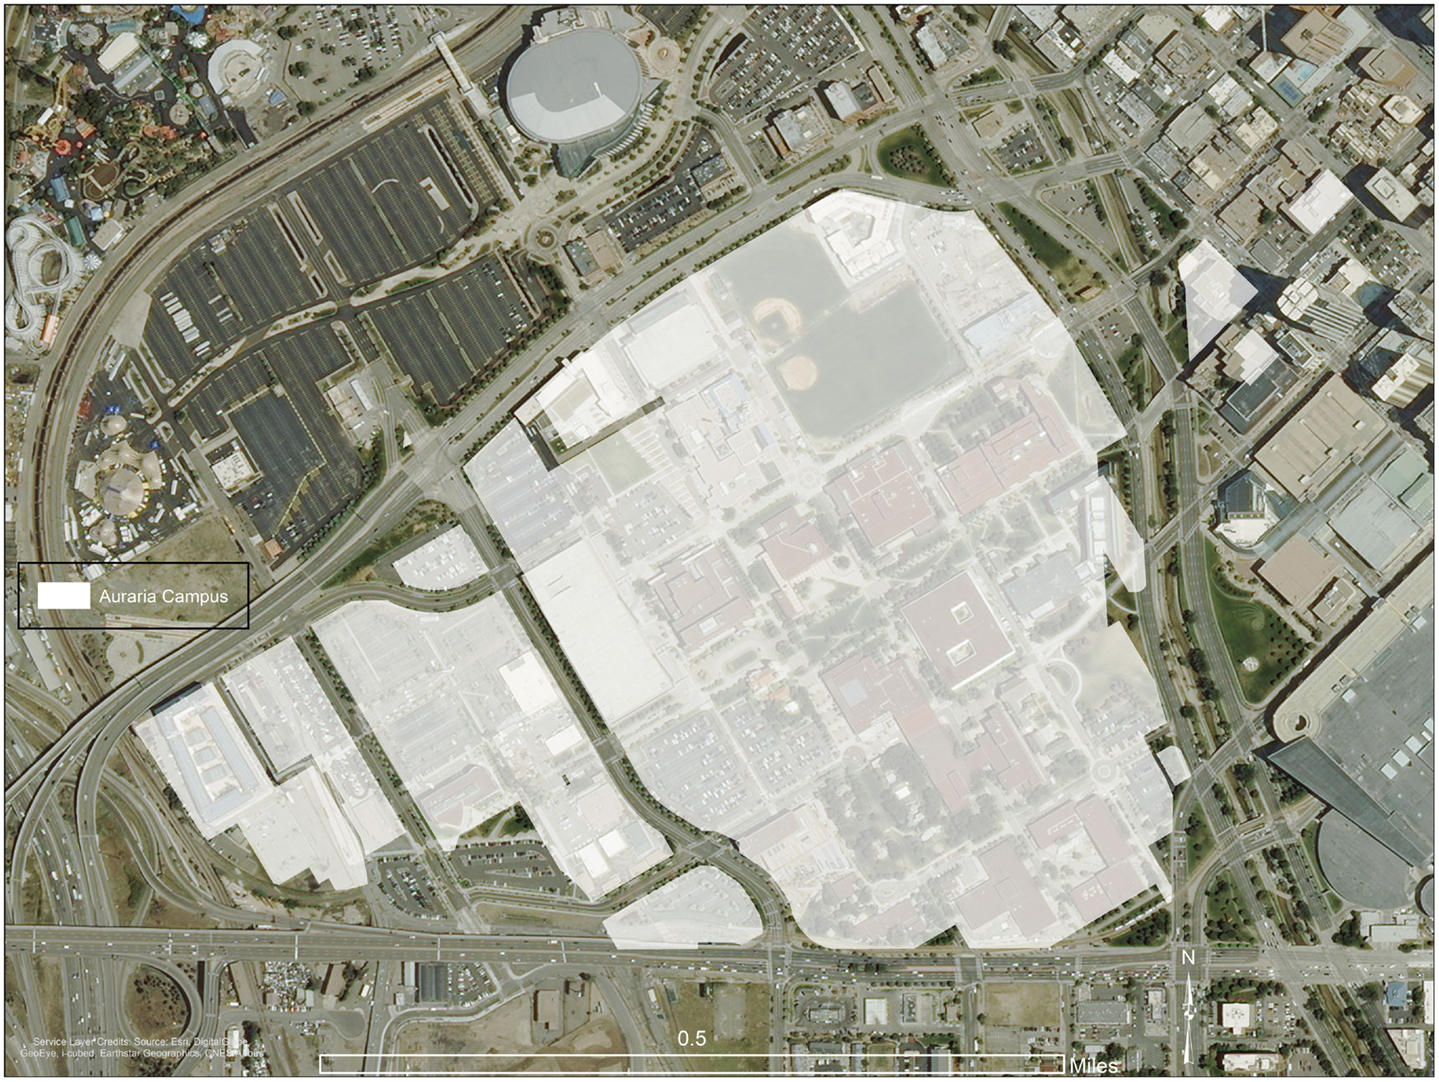
Figure 13. The Auraria “Island”.
This strategy made some sense at the time, when the area was flanked by the remnants of skid row and giant holes in the ground brought about by the juggernaut of urban renewal. But after more than 40 years of successful downtown redevelopment, the urban landscape has been transformed. Now, directly across Speer Boulevard from campus sit the DCPA (the region’s premier performing arts complex), Larimer Square (the hub of the city’s social life), and the LoDo district (the city’s most popular entertainment zone). Thus, after decades of promoting the isolation of Auraria from the parts of downtown Denver that surround it, campus planners have begun to explore how to better connect the campus to the increasingly vibrant urban core. Propelling such efforts forward is the fact that the expanding facilities of the University of Colorado Denver continue to be divided between the Auraria campus proper and the adjacent blocks of downtown across Speer Boulevard. For both campus and Denver city planners, the problem today is how to provide meaningful connection and ease of access across this divide.
To this we say, “let history be your guide.” As we have demonstrated in this research, there was no rigid divide between Auraria and downtown Denver historically. These two parts of the city were adjoined and interconnected. The current problem of separation was produced as part of an urban renewal process that erased this original configuration.
Our research suggests several “back to the future” strategies to guide urban planners and designers in their attempts to reconnect Auraria with downtown. First, abandon the open space and parking lot buffer that separates the two, and place buildings right at the edges of Speer Boulevard and Cherry Creek. Over the past several years, this has begun to happen on the Auraria side of Cherry Creek, marking a dramatic break with past practice, but it needs to occur on the downtown side as well if a visual and functional connection is to be re-established. Second, realign Speer Boulevard north of Larimer Street to reduce the excessive width of the vehicular corridor in order to bring the campus and downtown closer together and provide better pedestrian connectivity. And third, re-animate both Larimer Street and Lawrence Street as vital pedestrian corridors that can bridge the divide between the Auraria campus and downtown and take priority over high volume flows of vehicular traffic. In this way, the vision of the urban past can become central to the functioning of the contemporary city.
Conflict of Interest Statement
The authors declare that the research was conducted in the absence of any commercial or financial relationships that could be construed as a potential conflict of interest.
Acknowledgments
The authors wish to thank Susanna Diller for important contributions to this project, and Elyse Dinnocenzo for creating the 3D visualizations. The staff of the Denver Public Library assisted in locating historic map resources used in the research. Access to the Facility for Advanced Spatial Technologies (FAST) Laboratory was provided by the College of Liberal Arts and Sciences at the University of Colorado Denver.
Footnotes
- ^This label stood in sharp contrast to residents’ self-identity as reflected in oral histories (Gallegos, 1991).
- ^See also the website “Going to the Show (2014)” http://docsouth.unc.edu/gtts/. This innovative project uses Sanborn maps to locate movie theaters in North Carolina cities in the late nineteenth and early twentieth centuries in order to explore the role that theaters played in shaping social relationships and urban experience.
- ^A similar approach was used by the City of New Orleans’ Vieux Carre Commission in its effort to digitize and geo-reference Sanborn maps for the French Quarter for the year 1885 (Berry, 2003).
- ^The Denver Public Library also maintains an online digital archive of black and white versions of Sanborn maps in PDF format. These maps have very low resolution and were therefore not of sufficient quality for use in this research.
- ^See the New York Public Library’s “New York City Historical GIS Project” for an ambitious city-scale version of this approach (http://www.nypl.org/blog/2012/06/13/nyc-historical-gis-project). That project has digitized and geo-referenced thousands of historic New York City maps, including Sanborn fire insurance maps. Their ultimate goal is to digitize building footprints on the Sanborn maps and link building-specific data to associated attribute tables, something that we have accomplished for the Auraria district in this research.
- ^See the “Year of the Bay” for an example of a project that geo-codes urban memories and experiences at the broad metropolitan scale. For the ongoing Auraria research, our intent is to focus less on crowd-sourcing and more on targeted narratives drawn from interviews with former residents, business owners, and workers http://www.historypin.org/project/22yearofthebay/#!map/index/#!/geo:37.782902,-122.37084/zoom:12/.
References
Abbott, F.C. (1999). The Auraria higher education center: how it came to be. Denver, CO: Auraria Higher Education Center.
Applebaum, W. (1952). A technique for constructing a population and urban land use map. Economic Geography 28:240–3. doi: 10.2307/141199
Beauregard, R.A. (2006). When America became suburban. Minneapolis, MN: University of Minnesota Press.
Berry, J.W. (2003). Historic Sanborn maps in the digital age: city of New Orleans. Journal of GIS in Archaeology 1:74–8.
Cameron, R.J., and McFadyen, G.G. (1977). New college facilities, new in-town vitality gained via Denver’s almost complete Auraria project. Journal of Housing 3:124–7.
Denver Urban Renewal Authority (DURA). (1965). Urban renewal goes forward in Denver. Denver, CO: The Denver Urban Renewal Authority.
Duany, A., Plater-Zyberk, E., and Speck, J. (2000). Suburban nation: the rise of sprawl and the decline of the American dream. New York, NY: North Point Press.
Fogelson, R.M. (2001). Downtown: its rise and fall, 1880-1950. New Haven and London: Yale University Press.
Gallegos, M. (1985). History of the Hispanic settlers in Auraria: the forgotten community. Denver, CO: Auraria Library Special Collections.
Going to the Show. (2014). Available at: http://docsouth.unc.edu/gtts/
Gregory, I. (2014). Challenges and opportunities for digital history. Frontiers in Digital Humanities 17:1–2. doi:10.3389/fdigh.2014.00001
Gregory, I.N., and Healy, R.G. (2007). Historical GIS: structuring, mapping and analyzing geographies of the past. Progress in Human Geography 31:638–53. doi:10.1177/0309132507081495
Hayden, D. (2004). Building suburbia: green fields and urban growth 1820-2000. New York, NY: Vintage Books.
Hillier, A. (2010). Invitation to mapping: How GIS can facilitate new discoveries in urban and planning history. Journal of Planning History 9:122–34. doi:10.1177/1538513210366964
Isoda, Y., Tsukamoto, A., Kosaka, Y., Okumura, T., Sawai, M., Yano, K., et al. (2009). Reconstruction of Kyoto of the Edo era based on arts and historical documents: 3D urban model based on historical GIS data. International Journal of Humanities and Arts Computing 3:21–38. doi:10.3366/ijhac.2009.0007
Jackson, K.T. (1985). Crabgrass frontier: the suburbanization of the United States. Oxford: Oxford University Press.
Judd, D.R. (1983). From cowtown to sunbelt city: boosterism and economic growth in Denver. In Restructuring the political economy of urban development, Edited by Fainstein S., Fainstein N., Hill R.L., Judd D., and Smith M.P., 167–201. New York, NY: Longman.
Knowles, A.K., and Hillier, A. (2008). Placing history: how maps, spatial data, and GIS are changing historical scholarship. Redlands, CA: ESRI Press.
Kolodziej, K., Lejano, R.P., Sassa, C., Maharjan, S., Ghaemghami, J., and Plant, T. (2004). Mapping the industrial archeology of Boston. Journal of the Urban and Regional Information System Association 16:5–13.
Kunstler, J.H. (1993). The geography of nowhere: the rise and decline of America’s man-made landscape. New York, NY: Touchstone.
Lee, M.A. (2012). Forgotten alliance: Jews, Chicanos, and the dynamics of class and race in Denver, Colorado, 1967-1971. Shofar 2:1–25. doi:10.1353/sho.2012.0009
Leonard, S.J., and Noel, T.J. (1990). Denver: from mining camp to metropolis. Niwot, CO: University Press of Colorado.
Logan, J.R., Jindrich, J., Shin, H., and Zhang, W. (2011). Mapping America 1880: the urban transition historical GIS. Historical Methods 44:49–60. doi:10.1080/01615440.2010.517509
Logan, J.R., and Molotch, H.L. (1987). Urban fortunes: the political economy of place. Berkeley, CA: University of California Press.
McEncroe, D. (1992). Denver renewed: a history of the denver urban renewal authority. Denver, CO: The Denver Foundation.
Mozingo, L.A. (2011). Pastoral capitalism: a history of suburban corporate landscapes. Cambridge, MA: MIT Press.
Offen, K. (2013). Historical geography II: digital imaginations. Progress in Human Geography 37:562–74. doi:10.1177/0309132512462807
O’Sullivan, D. (2005). Geographical information science: time changes everything. Progress in Human Geography 29:749–56. doi:10.1191/0309132505ph581pr
Page, B. (2003). Labor and the landscape of “American Gothic”. Labor History 44:95–110. doi:10.1080/0023656032000057149
Rivera, G., Lucero, A.F., and Castro, R. (1998). Internal colonialism in Colorado: the westside coalition and barrio control. In La gente: hispano history and life in Colorado, Edited by DeBaca V.C., 208–210. Denver, CO: Colorado Historical Society.
Sauder, R.A. (1980). The use of Sanborn maps in reconstructing geographies of the past: Boston’s waterfront from 1867 to 1972. Journal of Geography 79:204–13. doi:10.1080/00221348008980649
Spielman, S., and Harrison, P. (2014). The co-evolution of residential segregation and the built environment at the turn of the 20th century: a Schelling model. Transactions in GIS 18:25–45. doi:10.1111/tgis.12014
Sugrue, T.J. (1996). The origins of the urban crisis: race and inequality in postwar detroit. Princeton, NJ: Princeton University Press.
Summers, J.M. (2003). “Auraria: from neighborhood to campus” master’s thesis. Denver, CO: University of Colorado Denver.
Teaford, J.C. (1990). The rough road to renaissance: urban revitalization in America, 1940-1985. Baltimore, MD: Johns Hopkins University Press.
Teaford, J.C. (2006). The metropolitan revolution: the rise of post-urban America. New York, NY: Columbia University Press.
Vance, J. (1990). The continuing city: urban morphology in western civilization. Baltimore, MD: The Johns Hopkins University Press.
Keywords: urban history, spatial history, urban renewal, GIS, Sanborn fire insurance maps, United States, Denver
Citation: Page B and Ross E (2015) Envisioning the urban past: GIS reconstruction of a lost Denver district. Front. Digit. Humanit. 2:3. doi: 10.3389/fdigh.2015.00003
Received: 09 June 2015; Accepted: 24 July 2015;
Published: 11 August 2015
Edited by:
Robert C. H. Sweeny, Memorial University of Newfoundland, CanadaReviewed by:
David Beck, University of Warwick, UKKatrina Navickas, University of Hertfordshire, UK
Copyright: © 2015 Page and Ross. This is an open-access article distributed under the terms of the Creative Commons Attribution License (CC BY). The use, distribution or reproduction in other forums is permitted, provided the original author(s) or licensor are credited and that the original publication in this journal is cited, in accordance with accepted academic practice. No use, distribution or reproduction is permitted which does not comply with these terms.
*Correspondence: Brian Page, Department of Geography and Environmental Sciences, University of Colorado Denver, Campus Box 172, Denver, CO 80217-3364, USA, brian.page@ucdenver.edu