Testing the Robustness of Local Network Metrics in Research on Archeological Local Transport Networks
 Mark R. Groenhuijzen
 Philip Verhagen
- Faculty of Humanities, CLUE+ Research Institute for Culture, History and Heritage, Vrije Universiteit Amsterdam, Amsterdam, Netherlands
With the increased application of network analysis in archeology to form hypotheses, particularly concerning the research on mobility, a need has arisen to validate the network analysis results. This paper presents a case study of a local transport network in the Dutch part of the Roman limes between 70 and 270 AD created using a least-cost approach, and tests the robustness of the local network metric of betweenness centrality and the archeological interpretation thereof. It is demonstrated that while the majority of sites have a robust and thus reliable betweenness centrality, there are still a large number of sites for which the network measurements are very dependent on the precise structure of the network present. Testing robustness of network analysis results thus proves a useful tool for both validating the network modeling results and the archeological interpretations of that network.
Introduction
The study of mobility in the Roman period has traditionally focused on the regional to empire-wide scale, and particularly on the military public road networks and Roman shipping in the Mediterranean [e.g., Yeo (1946), Chevallier (1988), and Scheidel (2014)]. In the Netherlands, well-studied examples of this tradition include the Roman limes road (via militaris) running along the frontier [e.g., Modderman (1952) and Luksen-IJtsma (2010)] and shipping on the Rhine and Meuse [e.g., De Weerd (1988) and Jansma and Morel (2007)]. The focus on the regional to empire-wide scales can largely be attributed to the methodologies and sources applied: (sparse) archeological excavations, literary sources, and to some extent using concepts of transport economics. Comparatively little research has been done on transport on the local to intraregional scales, mainly due to the lack of archeologically visible local road systems.
Computational modeling of roads and routes has become increasingly popular to fill this gap in knowledge, with the basic parameters rather well understood (Murrieta-Flores, 2010; Polla and Verhagen, 2014). Most applications involve least-cost path (LCP) modeling, since the premise is that people on the long term will optimize their routes between places on a local scale (Herzog, 2013, p. 180), and LCP modeling allows us to calculate these routes by incorporating many different cost components, most often regarding the ancient topography. Studies incorporating LCP modeling mostly aim to reconstruct ancient routes and networks or to identify the factors involved in establishing routes [e.g., Bell and Lock (2000), Llobera (2000), Zakšek et al. (2008), and Verhagen (2013)]. More recently, the application of formal network analysis techniques on networks reconstructed using LCP techniques was introduced (Verhagen et al., 2013). This combination of methods has so far been explored in only a limited way, even though formal network analysis techniques have shown to offer additional information on the network structure that cannot be deduced qualitatively from LCP network maps (Verhagen et al., 2013, p. 364). We have therefore applied this approach in our previous research on local transport in the Dutch part of the Roman limes, with some promising results and interpretations regarding the functioning of the local transport network and the role of certain archeological sites within that network (Groenhuijzen and Verhagen, 2015a).
In social network analysis (SNA), Peeples and Roberts (2013) did a sensitivity analysis on the construction of binary networks from continuous data, showing that many network measures used for social interpretations are influenced by the assumptions on which the network is constructed. Research on the stability or robustness of centrality measures has shown that these measures become less stable under the introduction of imperfect data (Borgatti et al., 2006) and when sampling the network dataset (Costenbader and Valente, 2003).
However, all previous studies on transport network modeling in archeology have paid little attention to such validation of the network analysis results. Based on the aforementioned research in SNA, we argue that without sufficient validation the results of our analyses are only really valid for the particular networks being analyzed and can potentially be quite susceptible to minor changes in the networks. This may be the case when archeological sites are missing from the dataset, when sites are not correctly dated and/or interpreted, or when there are uncertainties in the LCP reconstructions. In order to gain a critical understanding of our network analysis results and to tackle the overlooked topic of validation in archeological network analysis in general, this paper aims to test the robustness of network metrics in transport networks, in particular that of betweenness centrality, by investigating how they develop when the analyzed network randomly emerges. Since betweenness centrality in archeology is often seen as an indicator of a site’s importance in a network (Brughmans, 2013, pp. 636–638), we expect it to be relatively robust, which we define as the network measure stabilizing before the network is completely formed, because betweenness centrality should be an inherent property of the site’s position in the landscape and in the transport network, even when not all sites or connections in the network are present. In this way, by validating the network analysis results, we also aim to test the robustness of the archeological interpretation thereof.
Materials and Methods
Data
This study uses a site dataset and a modeled dataset of local transport networks from the Dutch part of the Roman limes, which were already developed for previous research (Groenhuijzen and Verhagen, 2015a,b). The case study presented here is an area of 40 km × 21 km situated south of the modern city of Utrecht, the Netherlands (Figure 1) and will focus on the Middle Roman Period (~70–270 AD).
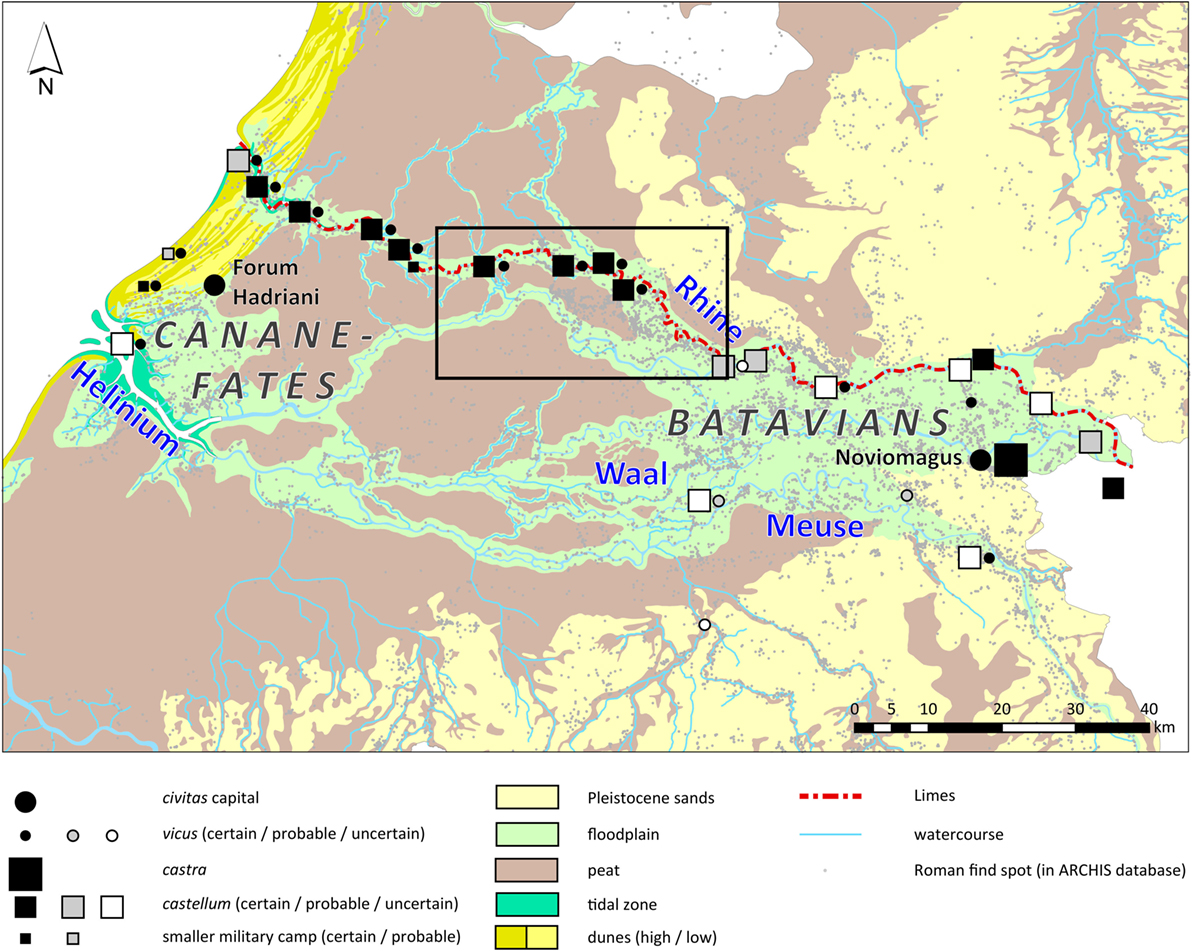
Figure 1. Location of the case study area within the Dutch part of the Roman limes. Natural paleogeography by Vos and de Vries (2013).
Natural Paleogeography
The landscape of the Dutch river area has been subjected to substantial anthropogenic impact and geomorphological changes since the Roman period. It is therefore very difficult to use datasets on the current landscape, such as geomorphological maps or LIDAR elevation data, for further analysis and modeling in archeological research. For this reason, a new dataset needs to be constructed on the natural paleogeography during the Roman period. A number of paleogeographical datasets already exist in the Netherlands on a national (1:500,000) scale [e.g., Vos and de Vries (2013)] and on a local scale [e.g., Cohen et al. (2009)], but they are either too broad or too specific, not only in terms of scale but also concerning the information conveyed. Van Dinter (2013), however, constructed a paleogeographic map for the western part of the Dutch limes that is more suitable for the required level of analysis at the local and regional level. We have extended this dataset to cover the entire Dutch part of the Roman limes using a largely similar approach. The methodology involves the manual combination of various source datasets in a Geographical Information System (GIS) to reconstruct the Roman landscape. The source datasets include
• Nationwide geomorphological maps, 1:50,000 (Alterra, 2008);
• Nationwide soil maps, 1:50,000 (Alterra, 2006);
• Data on channel belt evolution and avulsion (Cohen et al., 2012);
• LIDAR elevation data, 0.5 m horizontal resolution (Rijkswaterstaat-AGI, 2013);
• Local data from archeological research, including coring surveys, test pits, and excavations.
The geomorphological maps, soil maps, and channel belt data form the starting point of the reconstruction and provide a general overview of the various landforms and their age. This image was subsequently refined using information from local research and LIDAR elevation data, to add more spatial detail and to map landforms not yet recognized in the other sources (Berendsen and Volleberg, 2007; Van Dinter, 2013). The end-result is a paleogeographic map of the natural landscape in the Roman period on a 1:50,000 scale (Figure 2). The landscape can be subdivided geomorphologically into relatively high and dry natural levees and stream ridges, low and wet floodplains, and low and wet peatlands. Furthermore, cover sands and an ice-pushed moraine are present in the northeast of the study area, but since this part of the region is beyond the Rhine and thus outside the limes zone, it plays no role in our analyses.
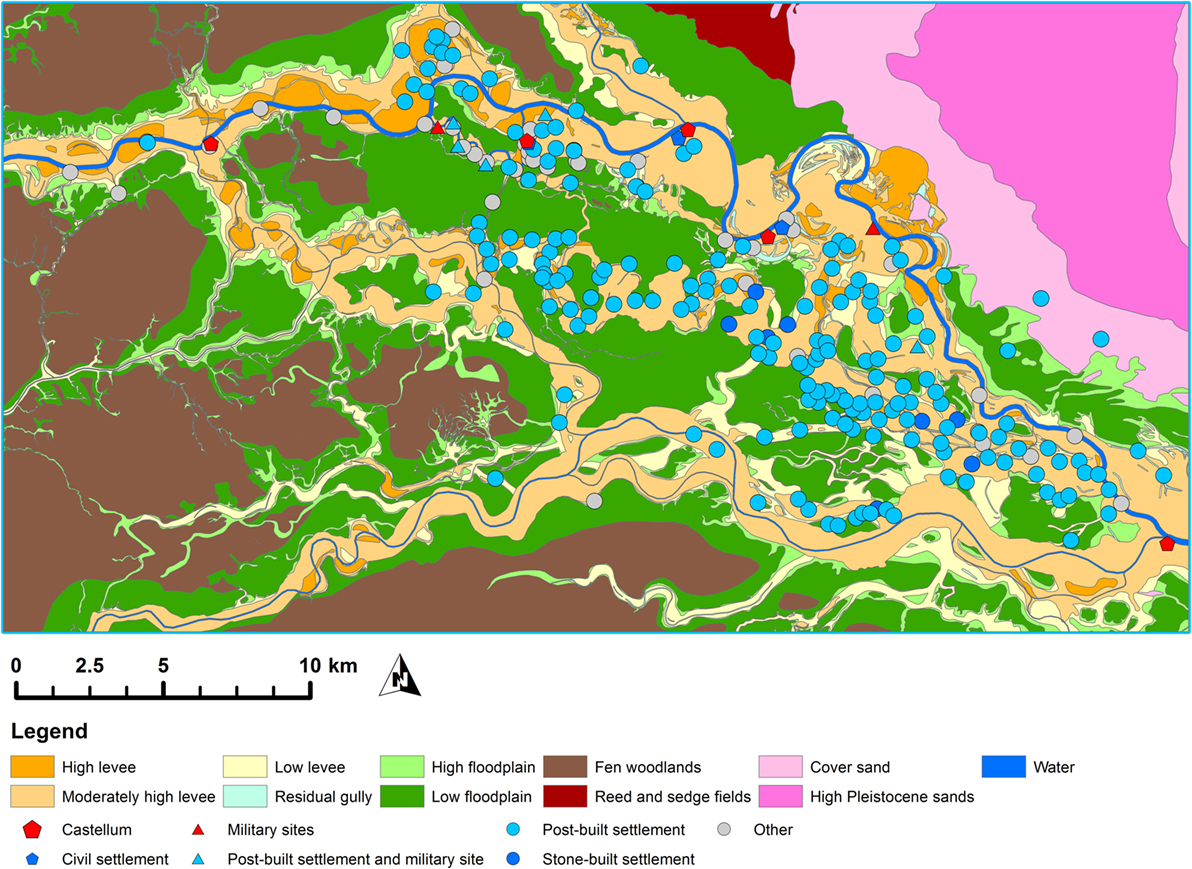
Figure 2. Paleogeographic map of the research area with archeological sites from the reinterpreted archeological dataset.
Archeological Site Dataset
Roman archeology in the Netherlands has a rich tradition, which allows for a detailed reconstruction of settlement and land use patterns. However, the available data, mostly residing in the national archeological database ARCHIS, need to be analyzed and reinterpreted in order to create a standardized and complete inventory of settlements and other archeological sites (Verhagen et al., in press). The reinterpretation process followed a standardized set of rules for defining and interpreting archeological sites. These rules include a specified minimum distance in which finds should occur, a minimum number of finds, as well as the occurrence of diagnostic finds, which allows for the sites to be classified, for instance, as a rural post-built or stone-built settlements, burial sites, or Roman military watchtowers or castella (forts). A similar approach was used in earlier research projects in parts of the Dutch limes (Bloemers, 1978; Willems, 1986; Vos, 2009) and has now been extended to cover the entire Dutch part of the Roman limes. The reinterpreted dataset is stored in a database that also contains information on chronology, site size, uncertainty of interpretation, and references to the source material.
Transport Network Reconstruction
As has been addressed earlier, our knowledge of local scale transport is fairly limited, as most research undertaken in the past relates to transport occurring on the regional and supraregional scales. This is enhanced by the archeological record, where good preservation of waterlogged wood in the Netherlands has presented us with the remains of Roman barges indicating shipping on the Rhine and Meuse and with remains of the limes road. On a local scale, however, it has been argued that most connections between places were mere routes rather than constructed roads that could still be preserved in the archeological record (Willems, 1986, p. 63–64; Vos, 2009, p. 40–44). To bridge this knowledge gap, we have modeled potential local transport routes using a LCP approach (Groenhuijzen and Verhagen, 2015a,b). One of the main advantages of LCP modeling is the ability to incorporate all kinds of factors impeding or facilitating movement. In most case, studies involving LCP modeling in archeology the main cost component is difference in elevation, since moving up- or downslope influences the speed of movement. Elevation, however, is not an obstacle in the Dutch part of the Roman limes, with no discernible slope in most of the area. The varying terrain surface and geomorphology, and the related parameters of vegetation and hydrology, are more likely to have a played a major role. In our study area, transport will generally be most efficient on the high and dry levees and sandy areas, and hampered in the low and wet floodplains and peat areas. This effect becomes more pronounced as the “difficulty” of transportation increases: paths of walking while carrying a heavy load will favor the levees and sandy areas more than walking without a load would, cart-based transport, and so on. The way these costs of transport was modeled and applied to the reconstructed paleogeography will be elaborated upon in the next paragraph.
For the modeling of walking costs, we used a physiological function (Pandolf et al., 1976) that calculates velocity (V in meter per second) at a constant metabolic rate (M in Watts, set at 340 W to represent the average expenditure while walking normally) and incorporates subject weight (W in kilograms, set at 60 kg), carried load (L in kilograms) as well as a terrain coefficient (η):
The terrain coefficients were drawn from a related study (Soule and Goldman, 1972) and adapted to be applied to the terrain units of the paleogeographic map. A similar approach was used for ox- and mule-cart transport, although due to the lack of any detailed physiological research on the movement of animal-drawn vehicles, the method could only be crudely applied using (historic) literature data on the traveling speed of ox- and mule-carts [e.g., Roth (1999)]. Cost surfaces were calculated for four transport methods: walking without load (W0), walking while carrying 40 kg (W40), mule-cart (MC), and ox-cart (OC), using the time it takes to travel 50 m across a terrain type as the cost unit. Furthermore, multimodal connections using water-based transport in addition to one of the land-based transport connections were also included, modeled using direction-dependent (anisotropic) costs based on literature data on the speed of dugout transport [e.g., Gregory (1997)].
For each of the resultant transport models, we then calculated LCPs between all pairs of sites in the archeological site database to create transport networks. Each path is registered with its source, destination, transport mode, length, and travel time. This dataset can then be filtered for further analysis using a maximum travel time in order to create a non-uniform network or for other factors such as chronology or site type (Figure 3). We have subsequently applied formal network analysis techniques and looked at both global and local network measures, such as betweenness centrality and closeness centrality, to compare the various networks and investigate the role of specific sites within the networks (Groenhuijzen and Verhagen, 2015a).
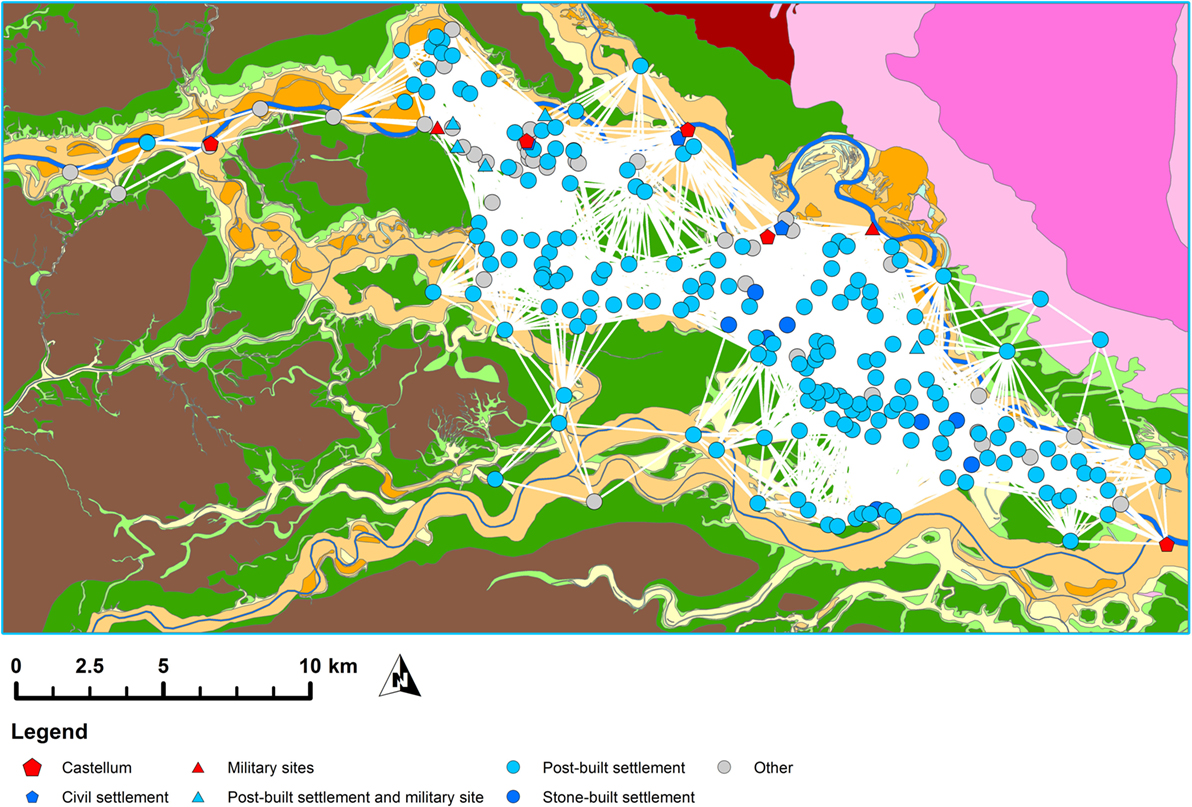
Figure 3. Example of a modeled transport network: walking without carrying a load, filtered to show only paths that can be traveled within 60 min.
Robustness Analysis Methods
Transport networks modeled and analyzed in the previous study (Groenhuijzen and Verhagen, 2015a) showed some potential for use in archeological questions related to the structure and properties of the network, its development through time and the role of individual sites within it. However, the analysis was always applied on a complete network, and the results could thus be dependent on that specific network structure existing. In other words, the network measures could change significantly if there are even minor changes in the network. Of course, in archeological studies of this kind, we can never be completely certain that we have captured the complete network at a specific point in time: our site inventories are never complete and are subjected to uncertainties in dating, interpretation, and in the LCPs calculated. It would therefore be a valuable exercise to test the robustness of the network analysis results and thus the validity of network measures even when applied to an incomplete dataset, by seeing how they evolve in a randomly emerging network. In contrast to the concept of random graphs (Barabási and Albert, 1999), however, all sites and paths in this study are predetermined, only the order in which they appear is random.
In the previous study (Groenhuijzen and Verhagen, 2015a), we have used betweenness centrality to compare the position of the sites in the modeled networks. Betweenness centrality (Freeman, 1977) is a local network measure that calculates how many shortest paths between all pairs of other nodes must pass through the node considered. It (BC) is calculated for a node (k) by dividing the amount of shortest paths (p) between two other nodes (s and t) that pass through node k by all shortest paths between nodes s and t, and repeating this for all pairs of other nodes:
Since the outcome of this function scales with the number of nodes in the network, betweenness centrality is often normalized by dividing it by the number of pairs that do not include the node k, wherein N equals the total number of nodes:
The normalization was also applied in this study. The calculation of betweenness centrality is further illustrated with an example network in Figure 4: node A controls all shortest paths between the other nodes of its own cluster (nodes B–F) with the sole exception of the path between E and F, as well as all shortest paths between its cluster and the opposite cluster of node Z, giving it a high betweenness centrality. By contrast, node E controls only the shortest paths between node F and other nodes, and node F controls no shortest paths. From an archeological perspective, betweenness centrality is thus often interpreted as the amount of control that a site has over movements along certain transport corridors, for example, in a study of the relative importance of key towns within a transport network of Roman Baetica (Isaksen, 2008) or in a study aiming to infer gateway sites in the maritime networks of the Southern Aegean in the Middle Bronze Age (Rivers et al., 2013).
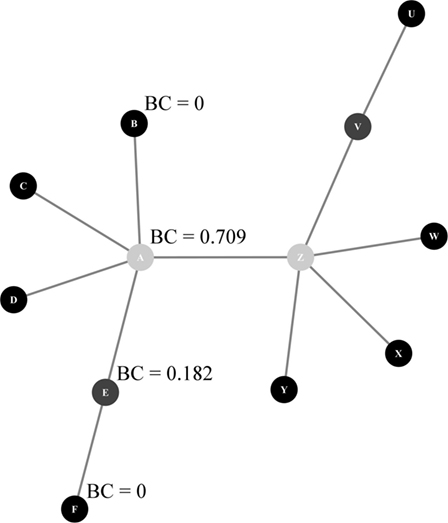
Figure 4. Betweenness centrality in an example network.
In order to test the robustness of betweenness centrality measured in the “complete” network, a model was written using NetLogo 5.2.0 (Wilensky, 1999), a programing language and modeling environment primarily known for its use in agent-based modeling studies. Although this study is not agent based, the versatility of the program with its GIS and network plugins as well as the capability to easily perform parallel runs using the BehaviorSpace module makes it a preferable choice. However, the necessary procedures can be written in other programing languages such as Python or Java as well. The model and a model description according to the ODD protocol (Grimm et al., 2010) are included in the Supplementary Material.
The model (summarized in Figure 5) requires only the existing site dataset and one of the four modeled transport network datasets, both of which can be filtered if so required. A model run starts with only one site being present, which is considered the key site in that run for which the robustness of betweenness centrality is measured. All other sites and links are marked as “absent.” The model then randomly takes five other sites from the dataset, marks them as “present,” and adds all paths between the present sites. The number of five sites added per step as opposed to only one site was chosen to increase the speed of model runs, without losing too much detail. The betweenness centrality of the key site is subsequently recalculated based on the present network using the “betweenness-centrality” procedure from NetLogo’s network extension. The algorithm used in this procedure comes from the JUNG software library (White and Nelson, 2009) and is based on the algorithm proposed by Brandes (2001).
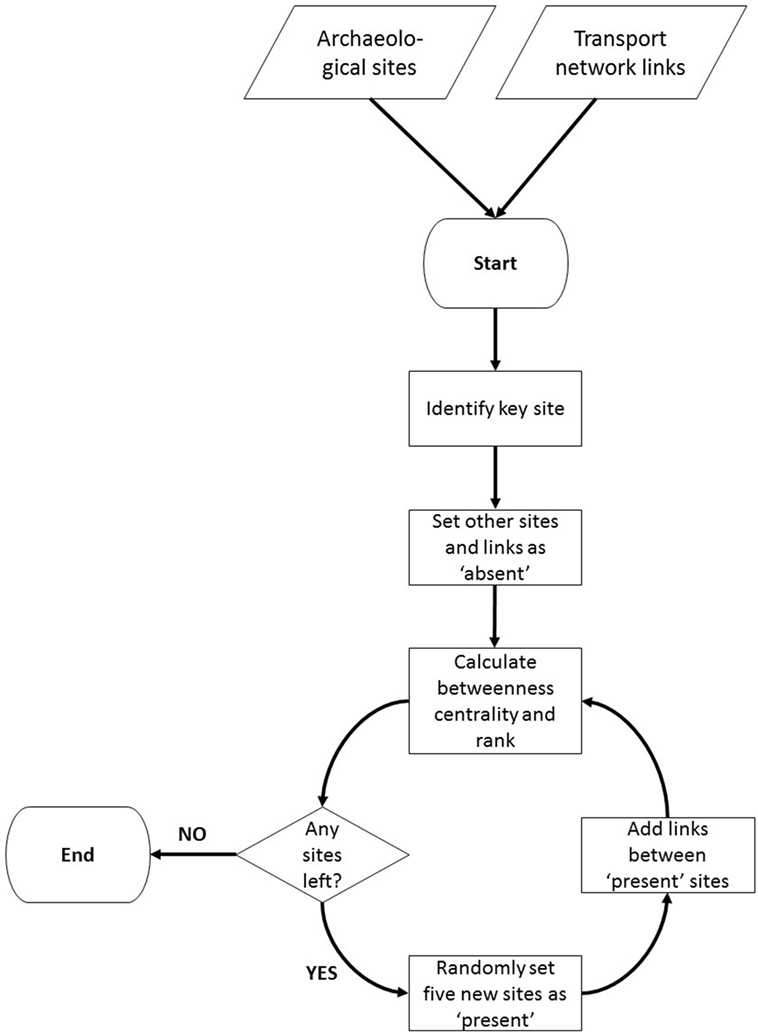
Figure 5. Flowchart representing the model schedule of one run for a single site.
Besides betweenness centrality, the betweenness rank is also measured. Betweenness rank in this study is defined as the measure of a site’s betweenness centrality in relation to all other sites: the site with the highest betweenness centrality is given a value of 1 and the site with the lowest betweenness centrality a value equal to the number of sites present (up to 242 in this study). The ranking of sites in this way can be used to compare the role that an individual site has within the network against other sites. Additionally, a distinction is made between absolute betweenness rank (i.e., the rank in relation to the total number of other sites in the network) and the percentage betweenness rank (i.e., the percentage of measured sites that have an equal or higher betweenness centrality). The latter measure is used specifically to characterize the stability of a site’s role in the network throughout a model run. This distinction is important, as before the end of a model run not all sites are present in the network, and both betweenness centrality and absolute betweenness rank are still subjected to change while the percentage betweenness rank may already have stabilized. For example, a site ranking 10 out of 100 will have a percentage rank of 10%, indicating that 9 sites have a higher betweenness centrality, and 10% of sites have an equal or higher betweenness centrality. When later in the model run the same site ranks 20 out of 200, the percentage rank is still 10%. So while the percentage rank in this example has stabilized at 10%, the absolute rank has, in fact, declined from 10 to 20 due to the presence of more sites. This illustrates that the distinction of a percentage betweenness rank is necessary to establish the robustness of a site’s role in the network.
The process of adding sites and recalculating the local network measures is repeated until all sites and paths from the dataset are added to the network, meaning that each run will converge toward the same end-result. Each site is subjected to 100 such runs to account for the variability between individual runs. In this study, the site dataset is filtered to include only sites dating to the Middle Roman Period (~70–270 AD) and each site is tested in all four transport network datasets, each filtered to include only connections that can be traveled within 1 h.
For each site in each transport network, the betweenness centrality and absolute and percentage betweenness rank are recorded during the model runs. The mean development of these across 100 runs are plotted in graphs, and subsequently assigned to groups according to the following characteristics of the graphs: presence/absence of a convex break in the percentage betweenness rank, presence/absence of stabilization of the percentage betweenness rank, and the timing of this stabilization. These are established using an approximation of the first derivative of the data. Stabilization is defined here as the moment (expressed in number of sites added in the model) that the rate of change in the percentage betweenness rank is <1 percentage point and the measure is continuously within 1 percentage point of the end-result.
Results
The complete model output and analysis results can be found in the Supplementary Material. The graph types distinguished will be further discussed here.
Type A covers graphs that have a quick early rise in percentage betweenness rank and a convex break and subsequent stabilization in the percentage betweenness rank decline. This group is further subdivided into type A1, A2, A3, and A4 (Figure 6), all of which have the aforementioned pattern but represent very early (after <101 sites in the model run), early (101–150 sites), middle (151–200 sites), or late (>200 sites) stabilization of the percentage betweenness rank, respectively.
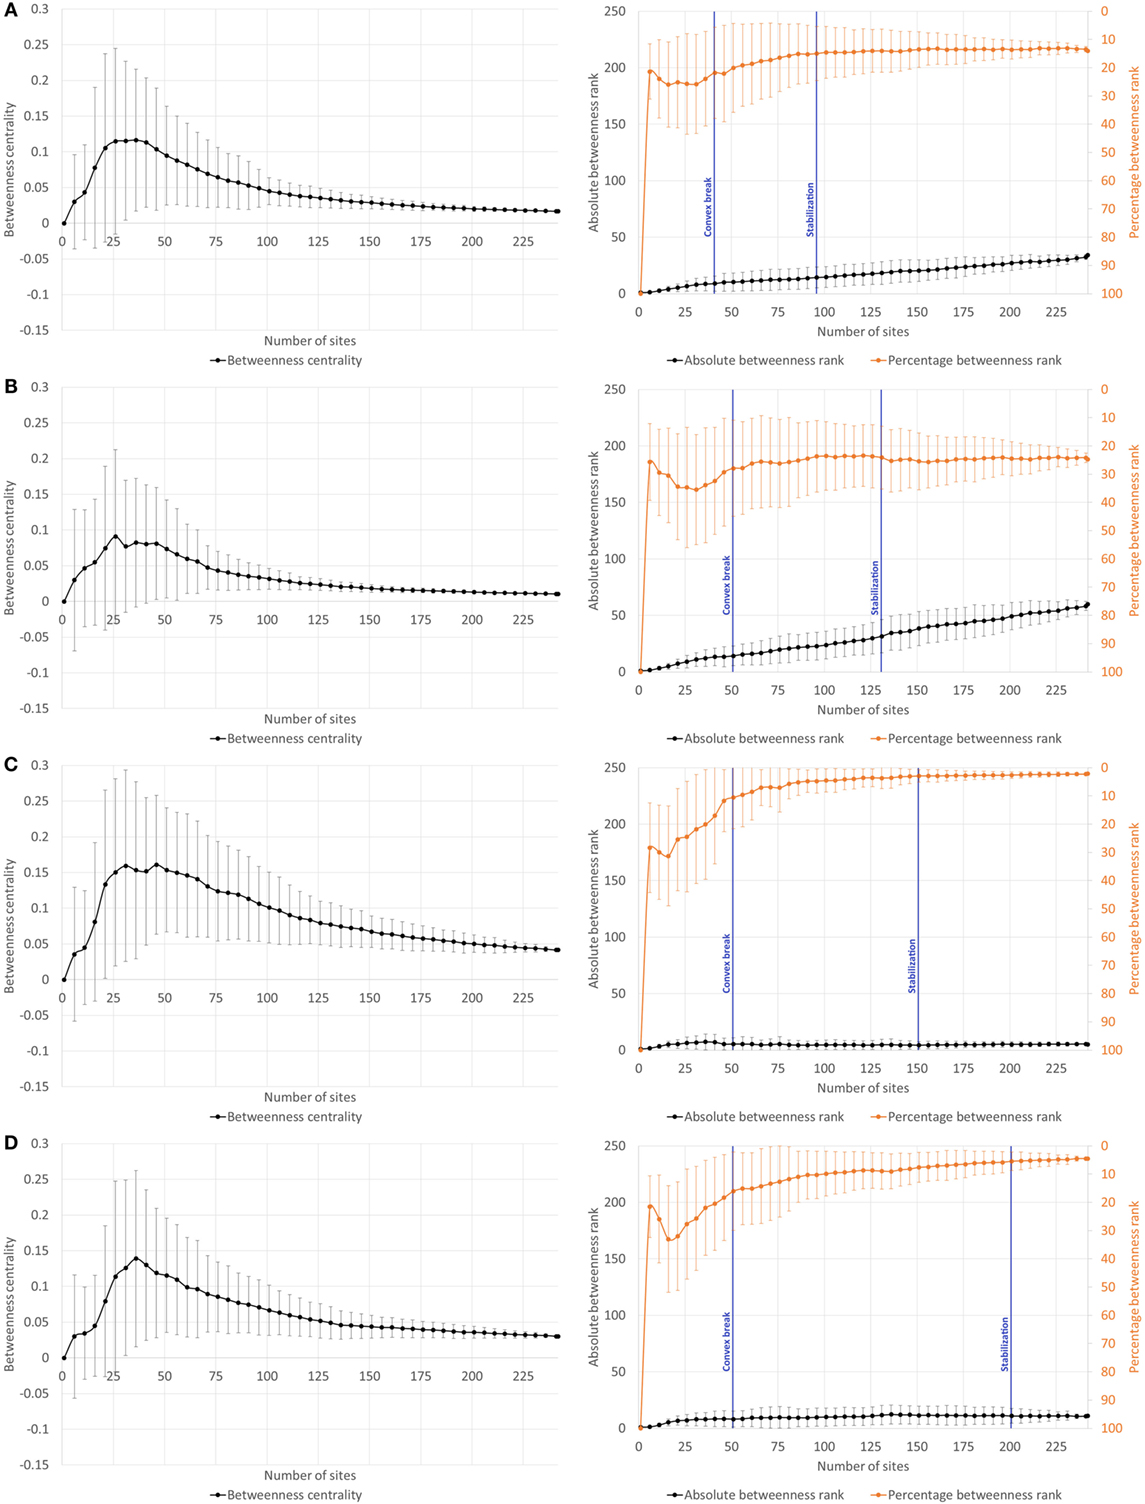
Figure 6. (A) Example of type A1: site 461 (Houten-Odijkerweg) in the W0-network. (B) Example of type A2: site 488 (Houten-De Geer) in the W0-network. (C) Example of type A3: site 3154 (Utrecht-Amerikalaan) in the W0-network. (D) Example of type A4: site 112 (Houten-Tiellandt) in the W0-network.
Type B (Figure 7) is similar to type A in that it has a convex break in percentage betweenness rank, but they differ in that there is no stabilization of the percentage betweenness rank. In many cases, it can be seen as a natural continuation of type A4, as there often is a trend of leveling-off toward stabilization visible in the percentage betweenness rank.
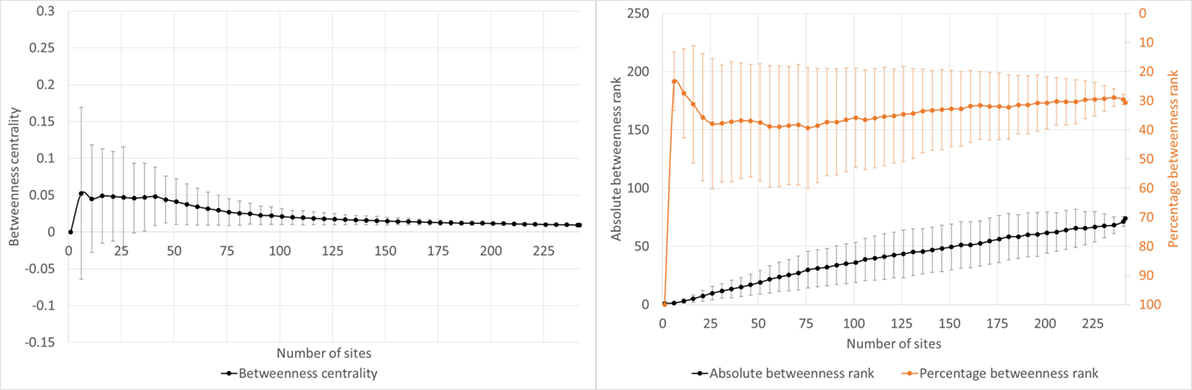
Figure 7. Example of type B: site 470 (Werkhoven-Hollende Wagen II) in the W0-network.
Type C (Figure 8) is characterized by a concave declining percentage betweenness rank and an ultimately increasing absolute betweenness rank, and no stabilization of the percentage betweenness rank. Type D (Figure 9) shows a convex increasing percentage betweenness rank, a declining absolute betweenness rank, and similarly no stabilization of the percentage betweenness rank.
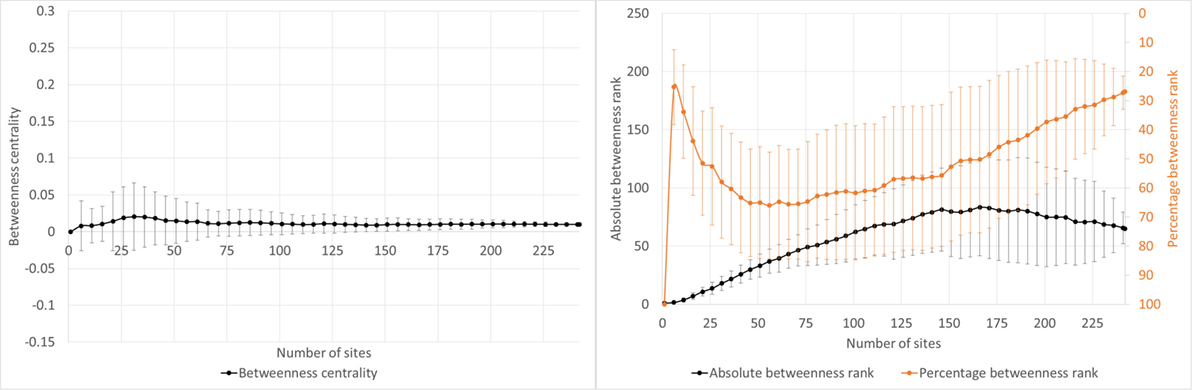
Figure 8. Example of type C: site 4016 (De Meern-Zandweg) in the W0-network.
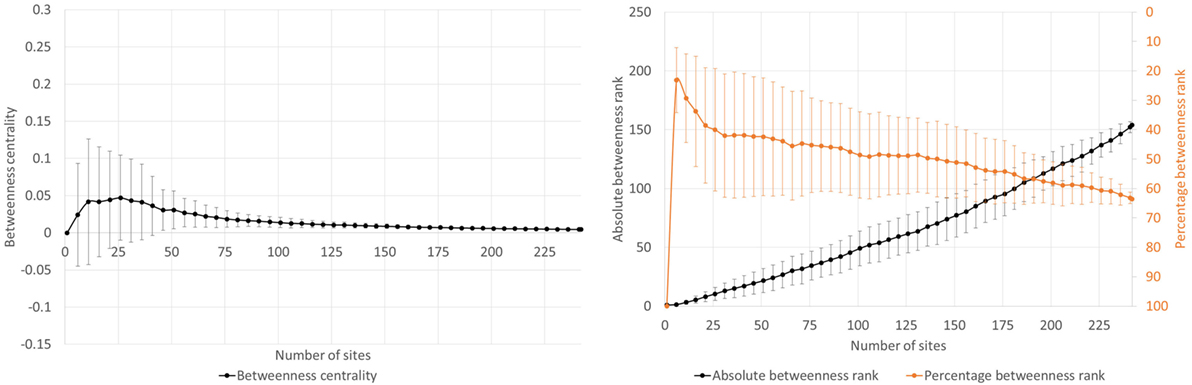
Figure 9. Example of type D: site 434 (‘t Goy-Nachtdijk I) in the W0-network.
Type E (Figure 10) is a final anomaly, which covers sites that have no (or very few but insignificant) paths connected to it, so that its betweenness centrality is rendered 0 throughout the model run.
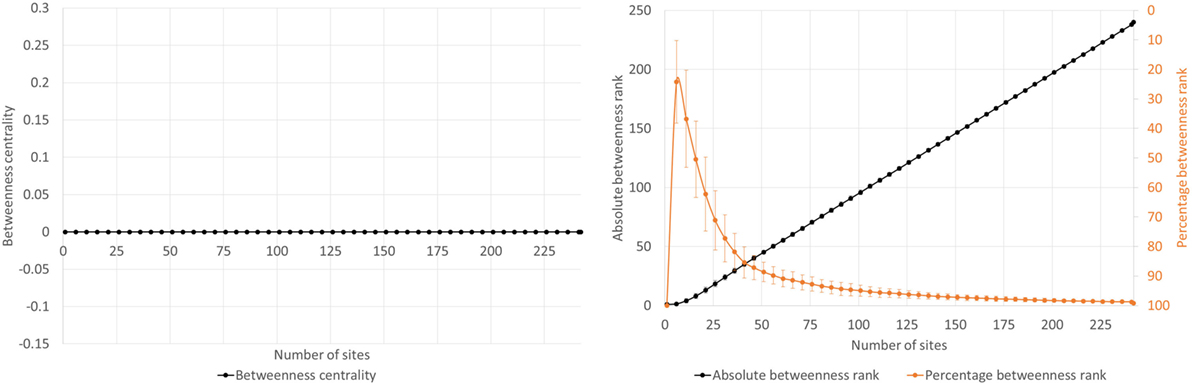
Figure 10. Example of type E: site 547 (Rijswijk-Roodvoet) in the W0-network.
Table 1 shows the distribution of the experiment results across the distinguished groups. The majority of measurements fall into one of the type A groups, with type A4 being the most prevalent. It is not very common for sites to belong to a single group in all four transport networks, occurring only 30 times out of 242 sites, as shown in Table 2. A total of 57 sites belong to any type A group in all four transport networks.
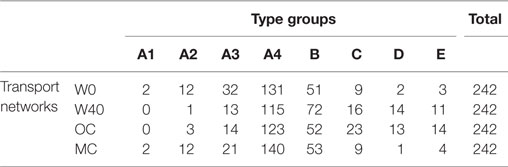
Table 1. Type group membership of all site measurements across the four transport networks.

Table 2. The frequency of a site belonging to a single type group across all four transport networks.
An interesting subset of sites constitutes the top 10% of sites in terms of betweenness centrality or absolute betweenness rank, as a high betweenness centrality is often associated with archeological implications about the role of that site in the network. As shown in Table 3, the majority of sites belonging to the top 10% in each respective network can be categorized into type A groups.
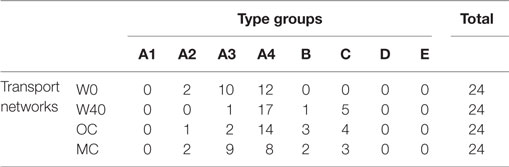
Table 3. Type group membership of sites within top 10% of betweenness centrality/absolute betweenness rank for each individual transport network.
Some more patterns can be observed when looking at the other deciles of the distribution of absolute betweenness rank, as shown in Table 4. Type groups A2 and A3 are significantly (>1 SD from the mean) more abundant in the first decile, which constitutes sites with an absolute betweenness rank between 1 and 24. Type group A2 is also more abundant in the third decile (49–72). In general, type groups A2 and A3 are more abundant in the top 50% (1–120) and less abundant in the bottom half (120–242). Type group C is significantly more abundant in the second decile (25–48). Moreover, it is generally more abundant in the top half and virtually absent in the bottom half. On the contrary, type group B is significantly less abundant in the first decile and significantly more abundant in deciles of the bottom 50% (121–144 and 145–168). Type group D is significantly more abundant in the same subsets and virtually absent from the top half (1–120). As can be expected, type group E is limited to the last decile (217–242), as this type is characterized by a betweenness centrality of 0.
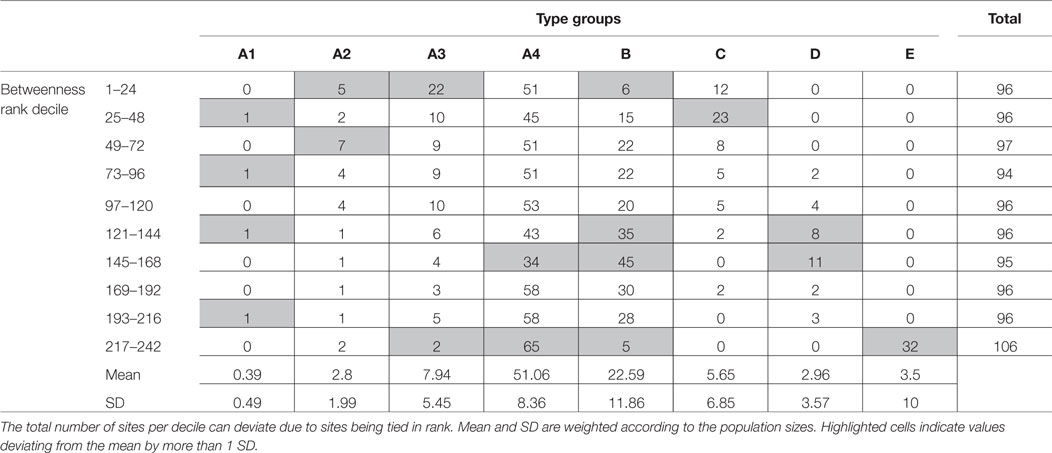
Table 4. Distribution of site measurements over decile subsets based on absolute betweenness rank, in all four transport networks.
Discussion
The categorization of the modeling results into clearly characterized graph types allows for the comparison between the resulting groups and their significance for the archeological interpretation of network analysis results. When discussing transport networks, it may be argued that the position of a site in its networks of trade, exchange, and/or social movement is the result of gradual natural evolution over time. This is particularly so for a site that plays an important role in that network, and perhaps was even established on that location because of its favorable position in existing transport networks. As has been stated in the Section “Introduction,” we should thus expect the betweenness centrality, especially for important sites, to be relatively robust even when the network is not fully complete, as it is an inherent property of the site’s position in the landscape and in the network. Robustness in this instance would mean that the position and role in the network, as represented by betweenness centrality rank, stabilizes before the network is completely formed rather than it being the end-product of the entire network.
Robustness in this sense is true for the sites belonging to type group A. Among the 242 sites in the four different transport networks, these types occur a total of 621 times, or roughly 64%. Types A2 and A3 are generally more prevalent among sites with a higher betweenness centrality and betweenness rank (as shown in Table 4), whereas types A1 and A4 are less distinctly distributed. This indicates that to some extent robustness is higher among sites that occupy more important positions in the network based on betweenness centrality, although the more uniform distribution of type group A4 shows that this is not a rule. For the occurrences of types A among the sites, it can be argued that the measured betweenness centrality is an inherent property of the site’s location and not dependent on the presence of the complete network nor susceptible to small variations in the network. When a site with a high betweenness centrality belongs to type group A, it also adds robustness to the archeological interpretation that it has a certain amount of control over movement in the transport network. The site attracts transport because it occupies a strategic location in the landscape, but it also occupies a position in the network that attracts transport because it is between other sites. Although difficult to substantiate without strong archeological evidence, some site locations may have been chosen because of their favorable location in transport networks.
When looking at the top 10% of sites based on betweenness rank (Table 3), the amount of sites ascribed to type group A even rises to 78 out of 96 sites, or roughly 81%. This indicates that sites that were recognized as “important” gateway sites in the LCP networks are more likely to have a betweenness centrality that is inherent to the site’s location and independent of the presence of the entire network. The relative high share of robust sites among the top 10% at least adds some degree of security regarding the archeological interpretation of network analysis results, considering that it often focuses on the most important sites rather than the least important ones, and that a site’s profitable position between other sites in the landscape is often used as an explaining factor for its importance [e.g., Groenhuijzen and Verhagen (2015a)].
The sites belonging to other type groups require a different explanation. Among these, type B is most prevalent. As has been mentioned earlier, this type shows similarities with and can be seen as a natural successor to type A4, with a trend of leveling-off toward stabilization in the final stages of the percentage betweenness rank development, without stabilizing entirely. Based on this tendency, it can be argued that similar to type A4 the betweenness centrality of the site’s location is partly an inherent property, but is still susceptible to variations in the network. It might also be an indication that the site’s position is not entirely a result of a naturally favorable location in the landscape and the network, but that other factors also played a role. This could be the case for instance for some Roman watchtowers (468, Werkhoven-Klaproos; 785, De Meern-De Balije; 835, De Meern-Veldhuizen), which are located on corridors on a stream ridge or between two stream ridges. Apparently, these sites occupy a strategic position in the landscape attracting some transport, but as opposed to sites of type A, they are not attracting much transport in the network due to their relative peripheral location from other sites. This position in the landscape and the network gives sites a tendency toward a stable betweenness centrality, but not a convincing stability as sites of type A, as there are likely other (non-natural) factors that played a role in establishing its location. However, since this type is shown to be susceptible to minor changes in the network (albeit not as much as the following types C and D), archeological interpretations cannot be thoroughly substantiated without first determining the validity of the precise network layout itself.
Types C and D are a different matter, as they show no stabilization or signs of a trend toward it. It suggests that their betweenness centrality as measured in the complete network is not the result of their natural position but is very reliant on all other sites being present in the network. This can indicate that the site’s location is not governed by a strategic position in the landscape or a favorable location in the network. Instead, its location is more likely to be influenced by other factors, such as landscape suitability for certain activities (e.g., agriculture, animal husbandry) or even external causes such as Roman military policies. The latter is found, for example, in some watchtowers (4016, De Meern-Zandweg) and a castellum (4067; Woerden-Hoochwoert I). There seems to be a distinction between type groups C and D in that the former mostly includes sites with a higher betweenness centrality and rank, and the latter includes mostly sites with lower betweenness centrality and rank. Type C is characterized by an increasing absolute betweenness rank, indicating that this represents a site that becomes more and more important in terms of control over movements in the network, simply because the number of sites and thus the number of movements increases. This is contrasted to type D, in which sites become less and less important as the network grows. This can be explained by the sites’ positions along the margins of the research area, and as a result also along the margins of the network. Type D thus can be useful to identify sites affected by edge effects.
Type E is an anomaly which can only be found among sites that are either disconnected or have very few connections that are not traveled as shortest paths between other sites. This results in a betweenness centrality of 0 and thus the lowest betweenness rank in all model runs. It occurs primarily in transport networks representing slower and less versatile modes of transportation such as ox-cart movement and walking while carrying a heavy load, which limits the number of paths in the network.
When comparing the results between transport networks, it becomes clear that networks with more connections, which are the ones that represent faster and easier travel (W0 and MC), also have a larger number of sites belonging to the stabilizing type group A. The robustness of betweenness centrality measurements in the other networks (W40 and OC) is reduced by the lower number of total connections, allowing for more variability as the network is not yet complete. It clearly shows that robustness of betweenness centrality measurements is determined by the interconnectedness of the network, which seems valid as by extension a completely connected network will also have a perfect robustness of network analysis measurements.
It is difficult to observe differences on a more detailed level such as by site type, since only a few sites have been excavated in detail and the majority (185 out of 242) of sites in the dataset are described as (rural) post-built settlements. Since the sample sizes of other site type groups are so small in comparison, detailed statistical comparisons are likely invalid. Some general patterns can be observed, such as the Roman castella (forts, n = 6) occurring mostly in type groups B, C, and D, or horrea (storage facilities, n = 3) occurring in type groups A2 and A4. When considering the trade or taxation system that was installed by the Roman authorities to supply the military population, this could suggest that the horrea where constructed to replace or complement the marginally located castella as more centrally located gathering sites in robust and important places in the transport network, in order to improve efficiency of gathering resources. Such a hierarchical system of the flow of goods from and to the primary center(s) matches the socioeconomic system proposed earlier for the region, involving also the vici (towns) near the Roman castella and the stone-built and large post-built settlements (Willems, 1986, p. 421; Vos, 2009, p. 228). Stone-built settlements (n = 8) do not appear to behave differently from all other sites, having a robust betweenness centrality as part of one of the type groups A in 20 out of 32 measurements (~63%). However, it must be noted that stone-built settlements are more likely to belong to the top 10% of sites in terms of betweenness rank, occurring in 8 out of 32 measurements (25%). In our previous research, we already acknowledged this phenomenon and explained it by the stone-built settlements being on important bottleneck sites or junctions of river levees, locations that naturally attract transport, allowing the sites to grow in status and/or wealth (Groenhuijzen and Verhagen, 2015a, p. 39). This matches archeological expectations as the hypothesis was already proposed in an earlier study of the settlement landscape of the area (Vos, 2009, p. 233) and supports the idea referenced earlier that at least some of the stone-built settlements play an important role in the hierarchic socio-economic structure of the region.
The results of testing the robustness of betweenness centrality in this case study have implications for applying network analysis on archeological transport networks, and by extension for network analysis applications in general. As was demonstrated, a majority of sites (~64%) belong to one of the type groups A representing a stabilization of network measurements in the model. These are not very susceptible to changes in the network, for example, due to sites missing, sites being incorrectly interpreted, or uncertainty in the path reconstructions. This number rises to ~81% when only considering the 10% of most important sites in terms of betweenness centrality. However, a significant number of sites are categorized in one of the non-stabilizing types. This is not only restricted to sites with low betweenness centrality but also still occurs among sites with high betweenness centrality, as is shown in Table 4. This has serious implications for the archeological interpretation of network analysis results, as the results are apparently dependent on that precise network structure being present. While the results for sites of type A can be considered robust and thus trustworthy enough to warrant an archeological interpretation of their role in the network, this is not the case for the considerable amount of other sites (~36%).
Conclusion
In this paper, the robustness of betweenness centrality measurements in archeological local transport networks was tested. By using a model that randomly adds sites from the dataset to the network, the development of betweenness centrality was measured. The results could be categorized into graph types expressing different development patterns. Across all networks analyzed ~64% of sites belong to type group A, which represents a stabilization of the network measurements prior to the entire network being present. Betweenness centrality for these sites can thus be interpreted as being robust and not dependent on the full network structure being present, which also makes the archeological interpretations concerning the role of such sites in the network more reliable. Other sites cannot be characterized by stabilization of the betweenness centrality measurements, meaning that they are susceptible to minor changes or errors in the network. Archeological interpretations of the position of these sites in the network cannot be substantiated without first determining the (archeological) validity of the network layout being measured, including the sites and paths being taken into account. To some extent, the other distinguished types can be used for other purposes, such as determining sites that are affected by edge effects (type D). Testing robustness of network analysis results, such as betweenness centrality as demonstrated in this study, thus proves a useful tool for both validating the network modeling results themselves and the archeological interpretations of the modeled network.
Author Contributions
MG and PV designed the research. MG and PV provided the source data. MG designed the experiment, performed the analyses, and interpreted the results. MG and PV drafted the paper.
Conflict of Interest Statement
The authors declare that the research was conducted in the absence of any commercial or financial relationships that could be construed as a potential conflict of interest.
Acknowledgments
The authors would like to thank Laure Nuninger for hosting a research stay of the first author at the CNRS, Laboratoire Chrono-Environnement UMR6249 in Besançon, France, and helping develop the ideas regarding network analysis validation in this paper.
Funding
This work was performed within the framework of the “Finding the limits of the limes” project, supported by the Netherlands Organization for Scientific Research under grant 276-71-005 through the VIDI Innovational Research Incentives Scheme.
Supplementary Material
The Supplementary Material for this article can be found online at https://www.frontiersin.org/article/10.3389/fdigh.2016.00006
Data Sheet 1. Model output data.
Data Sheet 2. Analysis results.
Data Sheet 3. Model and model input data.
Data Sheet 4. Model ODD.
References
Barabási, A.L., and Albert, R. (1999). Emergence of scaling in random networks. Science 286: 509–12. doi:10.1126/science.286.5439.509
Bell, T., and Lock, G. (2000). Topographic and cultural influences on walking the Ridgeway in later prehistoric times. In Beyond the Map. Archaeology and Spatial Technologies, Edited by G. Lock, 85–100. Amsterdam: IOS Press.
Berendsen, H.J.A., and Volleberg, K.P. (2007). New prospects in geomorphological and geological mapping of the Rhine-Meuse Delta – application of detailed digital elevation maps based on laser altimetry. Netherlands Journal of Geosciences 86: 15–22. doi:10.1017/S0016774600021296
Bloemers, J.H.F. (1978). Rijswijk (Z.H.), ‘De Bult’. Eine Siedlung der Cananefaten. Amersfoort: Nederlandse Oudheden. 8.
Borgatti, S.P., Carley, K.M., and Krackhardt, D. (2006). On the robustness of centrality measures under conditions of imperfect data. Social Networks 28: 124–36. doi:10.1016/j.socnet.2005.05.001
Brandes, U. (2001). A faster algorithm for betweenness centrality. Journal of Mathematical Sociology 25: 163–77. doi:10.1080/0022250X.2001.9990249
Brughmans, T. (2013). Thinking through networks: a review of formal network methods in archaeology. Journal of Archaeological Method and Theory 20: 623–62. doi:10.1007/s10816-012-9133-8
Cohen, K.M., Stouthamer, E., Hoek, W.Z., Berendsen, H.J.A., and Kempen, H.F.J. (2009). Zand in banen. Zanddieptekaarten van het Rivierengebied en het IJsseldal in de provincies Gelderland en Overijssel. 3rd ed. Arnhem: Provincie Gelderland.
Cohen, K.M., Stouthamer, E., Pierik, H.J., and Geurts, A.H. (2012). Rhine-Meuse Delta Studies’ Digital Basemap for Delta Evolution and Palaeogeography. Utrecht: Department of Physical Geography, Utrecht University.
Costenbader, E., and Valente, T.W. (2003). The stability of centrality measures when networks are sampled. Social Networks 25: 283–307. doi:10.1016/S0378-8733(03)00012-1
De Weerd, M.D. (1988). Schepen voor Zwammerdam. Bouwwijze en herkomst van enkele vaartuigtypen in West- en Middeneuropa uit de Romeinse tijd en de Middeleeuwen in archeologisch perspectief. PhD dissertation. Amsterdam: Universiteit van Amsterdam.
Freeman, L.C. (1977). A set of measures of centrality based on betweenness. Sociometry 40: 35–41. doi:10.2307/3033543
Gregory, N.T.N. (1997). A Comparative Study of Irish and Scottish Logboats. PhD dissertation. Edinburgh: University of Edinburgh.
Grimm, V., Berger, U., DeAngelis, D.L., Polhill, J.G., Giske, J., and Railsback, S.F. (2010). The ODD protocol: a review and first update. Ecological Modelling 221: 2760–8. doi:10.1016/j.ecolmodel.2010.08.019
Groenhuijzen, M.R., and Verhagen, P. (2015a). Exploring the dynamics of transport in the Dutch limes. eTopoi Journal for Ancient Studies 4: 25–47.
Groenhuijzen, M.R., and Verhagen, P. (2015b). Through hell and high water: a multimodal transport network in the Dutch Roman limes. In Paper Presented at the Computer Applications and Quantitative Methods in Archaeology (CAA) Conference 2015, Siena, Italy.
Herzog, I. (2013). The potential and limits of optimal path analysis. In Computational Approaches to Archaeological Spaces, Edited by A. Bevan and M. Lake, 179–211. Walnut Creek: Left Coast Press.
Isaksen, L. (2008). The Application of Network Analysis to Ancient Transport Geography: A Case Study of Roman Baetica. Digital Medievalist. 4.
Jansma, E., and Morel, J.M.A.W. (2007). Een Romeinse Rijnaak, gevonden in Utrecht-De Meern. Resultaten van het onderzoek naar de platbodem ‘De Meern 1’. Amersfoort: Rapportage Archeologische Monumentenzorg. 144.
Llobera, M. (2000). Understanding movement: a pilot model towards the sociology of movement. In Beyond the Map. Archaeology and Spatial Technologies, Edited by G. Lock, 64–84. Amsterdam: IOS Press.
Luksen-IJtsma, A. (2010). De limesweg in West-Nederland. Inventarisatie, analyse en synthese van archeologisch onderzoek naar de Romeinse weg tussen Vechten en Katwijk. Utrecht: Basisrapportage Archeologie Gemeente Utrecht. 40.
Modderman, P.J.R. (1952). Het probleem van de Romeinse wegen in het rivierkleigebied. Bijdragen en Mededeelingen van de Vereeniging Gelre 52: 21–8.
Murrieta-Flores, P.A. (2010). Traveling in a prehistoric landscape: exploring the influences that shaped human movement. In Making History Interactive. Computer Applications and Quantitative Methods in Archaeology (CAA). Proceedings of the 37th International Conference, Williamsburg, Virginia, USA, March 22-26, 2009, Edited by B. Frischer, J. Webb Crawford, and D. Koller, 249–267. Oxford: Archaeopress.
Pandolf, K.B., Givoni, B., and Goldman, R.F. (1976). Predicting energy expenditure with loads while standing or walking very slowly. Journal of Applied Physiology 43: 577–81.
Peeples, M.A., and Roberts, J.M. (2013). To binarize or not to binarize: relational data and the construction of archaeological networks. Journal of Archaeological Science 40: 3001–10. doi:10.1016/j.jas.2013.03.014
Polla, S., and Verhagen, P. (2014). Computational Approaches to the Study of Movement in Archaeology. Berlin: De Gruyter.
Rivers, R., Knappett, C., and Evans, T. (2013). What makes a site important? Centrality, gateways and gravity. In Network Analysis in Archaeology: New Approaches to Regional Interaction, Edited by C. Knappett, 125–150. Oxford: Oxford University Press.
Scheidel, W. (2014). The shape of the Roman world: modelling imperial connectivity. Journal of Roman Archaeology 27: 7–32. doi:10.1017/S1047759414001147
Soule, R.G., and Goldman, R.F. (1972). Terrain coefficients for energy cost prediction. Journal of Applied Physiology 32: 706–8.
Van Dinter, M. (2013). The Roman limes in the Netherlands: how a delta landscape determined the location of the military structures. Netherlands Journal of Geosciences 92: 11–32. doi:10.1017/S0016774600000251
Verhagen, P. (2013). On the road to nowhere? Least cost paths, accessibility and the predictive modelling perspective. In Fusion of Cultures. Proceedings of the 38th Annual Conference on Computer Applications and Quantitative Methods in Archaeology, Granada, Spain, April 2010, Edited by F. Contreras, M. Farjas, and F.J. Melero, 383–389. Oxford: Archaeopress.
Verhagen, P., Brughmans, T., Nuninger, L., Bertoncello, F., Romanowska, I., and Wheatley, D. (2013). The long and winding road: combining least cost paths and network analysis techniques for settlement location analysis and predictive modelling. In CAA2012. Proceedings of the 40th Conference in Computer Applications and Quantitative Methods in Archaeology, Southampton, United Kingdom, 26-30 March 2012, Edited by G. Earl, T. Sly, A. Chrysanthi, P. Murrieta-Flores, and C. Papadopoulos, 357–366. Amsterdam: Pallas Publications.
Verhagen, P., Vossen, I., Groenhuijzen, M.R., and Joyce, J.A. (in press). Now You See Them, Now You Don’t. Defining and Using a Flexible Chronology of Sites for Spatial Analysis of Roman Settlements in the Dutch River Area.
Vos, P.C., and de Vries, S. (2013). 2e generatie paleogeografische kaarten van Nederland (versie 2.0). Utrecht: Deltares.
Vos, W.K. (2009). Bataafs platteland. Het Romeinse nederzettingslandschap in het Nederlandse Kromme-Rijn gebied. Amersfoort: Nederlandse Archeologische Rapporten. 35.
White, S., and Nelson, T. (2009). Class BetweennessCentrality<V,E>. Available at: http://jung.sourceforge.net/doc/api/edu/uci/ics/jung/algorithms/importance/BetweennessCentrality.html
Wilensky, U. (1999). NetLogo. Evanston, IL: Center for Connected Learning and Computer-Based Modeling. Available at: http://ccl.northwestern.edu/netlogo/
Willems, W.J.H. (1986). Romans and Batavians. A Regional Study in the Dutch Eastern River Area. Amsterdam: Universiteit van Amsterdam.
Yeo, C.A. (1946). Land and sea transportation in imperial Italy. Transactions and Proceedings of the American Philological Association 77: 221–44. doi:10.2307/283459
Zakšek, K., Fovet, É, Nuninger, L., and Podobnikar, T. (2008). Path modelling and settlement pattern. In Layers of Perception: Proceedings of the 35th International Conference on Computer Applications and Quantitative Methods in Archaeology (CAA). Berlin, Germany, April 2–6, 2007, Edited by A. Posluschny, K. Lambers, and I. Herzog, 309–315. Bonn: Dr. Rudolf Habelt GmbH.
Keywords: least-cost analysis, network analysis, robustness, Roman limes, transport networks
Citation: Groenhuijzen MR and Verhagen P (2016) Testing the Robustness of Local Network Metrics in Research on Archeological Local Transport Networks. Front. Digit. Humanit. 3:6. doi: 10.3389/fdigh.2016.00006
Received: 03 May 2016; Accepted: 01 July 2016;
Published: 20 July 2016
Edited by:
Tom Brughmans, University of Konstanz, GermanyReviewed by:
Alex Elias Morrison, University of Auckland, New ZealandHeather Richards-Rissetto, University of Nebraska-Lincoln, USA
Philip Riris, University College London, UK
Copyright: © 2016 Groenhuijzen and Verhagen. This is an open-access article distributed under the terms of the Creative Commons Attribution License (CC BY). The use, distribution or reproduction in other forums is permitted, provided the original author(s) or licensor are credited and that the original publication in this journal is cited, in accordance with accepted academic practice. No use, distribution or reproduction is permitted which does not comply with these terms.
*Correspondence: Mark R. Groenhuijzen, m.r.groenhuijzen@vu.nl