Influence of different factors on relative air humidity in Zaragoza, Spain
 José M. Cuadrat
 Sergio Vicente-Serrano
 Miguel A. Saz1
- 1Department of Geography, University of Zaragoza, Zaragoza, Spain
- 2Instituto Pirenaico de Ecología, Consejo Superior de Investigaciones Científicas, Zaragoza, Spain
In this study, the spatial patterns of relative air humidity and its relation to urban, geographical and meteorological factors in the city of Zaragoza (Spain) is discussed. We created a relative humidity database by means of 32 urban transects. Data were taken on different days and with different weather types. This data set was used to map the mean spatial distribution of urban dry island (UDI). Using stepwise multiple regression analysis and Landsat ETM+ images the relationships between mean UDI and the main geographic-urban factors: topography, land cover, and surface reflectivity, have been analyzed. Different spatial patterns of UDI were determined using Principal Component Analysis (PCA) (Varimax rotation). The three components extracted accounted for 91% of the total variance. PC1 accounted for the most general patterns (similar to mean UDI); PC2 showed a shift of dry areas to the SE and PC3 a shift to NW. Using data on wind direction in Zaragoza, we have found that the displacement of dry areas to the SE (PC 2) was greater during NW winds while the shift to the NW (PC 3) was produced mainly by SE winds.
Introduction
Urban areas are spaces where anthropic transformations of the environment are greatest. Human activity has changed land uses and vegetation cover, and has introduced new components and materials that are capable of locally changing energy balances and most weather elements. One of the best-known and most-studied consequences is the formation of what are called urban heat islands, and another of the observed effects is the modification of relative air humidity, meaning that the atmosphere of cities is normally drier than the rural atmosphere. Hilberg (1978) referred to this feature as an urban dry island (UDI), which suggests a graphic representation including low levels of humidity in urban centers and a progressive increase as we move toward the periphery.
The phenomenon is well-known and has been researched in many cities, paying special attention to its spatial and temporal pattern: e.g., Chicago (Ackerman, 1987), London (Lee, 1991), Mexico (Jauregui and Tejeda, 1997), Belgrade (Unkasevic et al., 2001), Lodz (Charciarek, 2003), Beijing (Liu et al., 2008), and Cairo (Robaa, 2013). However, although the urban substrate is an important factor governing urban-rural humidity differences, there is a relative lack of studies which quantitatively relate humidity to specific characteristics of the substrate. A few qualitative associations with land-use data have been reported: Henry et al. (1985) analyzed the statistical relationships of the urban-rural distribution of humidity with the various types of materials and land uses of the city of Lawrence, in Kansas. Sümeghy (2009) researched the temporal dynamic of relative air humidity in Szeged (Hungary) and its connection with urban, geographical and meteorological parameters. And Robaa (2013) carried out a similar study on the Greater Cairo region, searching for a link between variations in relative air humidity and urban, suburban and rural areas. However, no quantitative relationships have been established between humidity patterns and urban and geographical factors based on an extensive data set.
The aim of this study is to examine the spatial patterns of the UDI of the city of Zaragoza and explain their relationship with geographical/urban factors and changes caused by surface winds. For this purpose, we used urban transects, surface interpolation techniques and multivariate statistics from a Geographical Information System (GIS).
Study Area
Zaragoza is a major industrial and commercial city with a population of 670,000 people (2013). It is located in northeastern Spain, in the central Ebro Valley (0° 52′ W, 41° 38′ N), at the confluence of the Ebro, Gállego, and Huerva rivers, which determine the material on which the city is built—mainly gravels and sands (Figure 1). The topography of the city does not feature great contrasts, with the highest point to the south of the city, 280 m above sea level and 100 m above the axis of the Ebro River. The urban texture is varied, although there are no high-rise buildings, with just a few exceeding 30 m in height. Over 30,000 vehicles travel through its streets every day, especially in the most central streets, which, added to the lack of green spaces, helps to give the city its compact image.
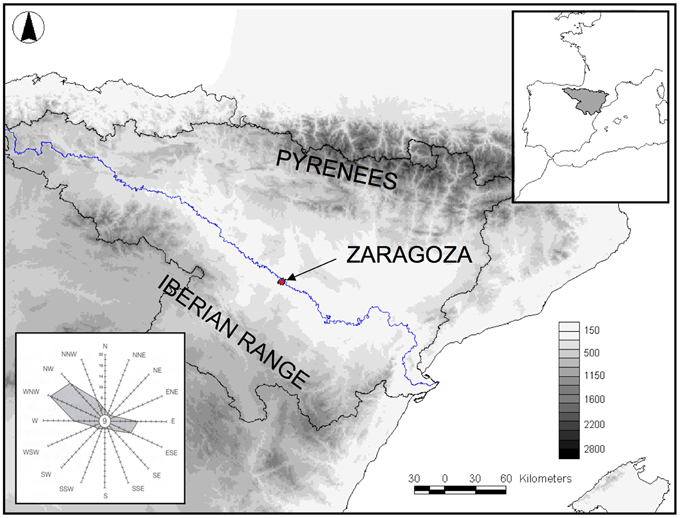
Figure 1. Location map of Zaragoza, Spain, altitudes (in meters) and the city's wind rose.
The city's climate is Mediterranean, with a strong continental influence, characterized by the scarce rainfall (320 mm per year) and the contrast between the long, cold winter (6.2°C is the average January temperature) and a long, hot summer (24.3°C is the average temperature in July). Wind is a significant factor due both to its regularity and its intensity, at times reaching 100 km/h, the consequence of a clear orographic effect (Cuadrat, 1999). The different airflows from all directions are channeled through the open corridor between the Pyrenees, to the north, and the Iberian System, to the south, with two distinct components, northwest and southeast.
Sources and Methodology
Data Base Creation
The UDI can be analyzed comparing the moisture levels between one rural and one urban station (e.g., Hage, 1975; Ackerman, 1987; Lee, 1991; Jauregui and Tejeda, 1997; Liu et al., 2008). Clearly, the usage of different atmospheric moisture measurements, which are often made at different time intervals, makes it extremely difficult to compare the results of various studies (Kuttler et al., 2007). In this study to determine the shape of the UDI, we measured relative humidity using digital thermo-hygrometers mounted on 3 cars, at a height of 2 m above the ground. The vehicles maintained a constant speed of 30–40 km/h. The data were taken along three transects, which required about 1 h to absolve, and their total length was 105 km. To represent the diversity of land use and building densities, data were compiled from 238 observation points distributed homogeneously within the city (Figure 2).
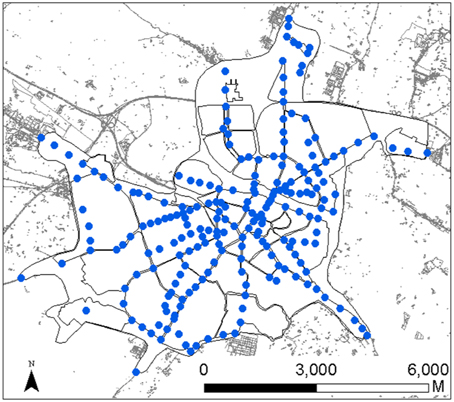
Figure 2. Location of relative humidity measurements in Zaragoza.
Data collection began 3 h after sunset, because UDI intensity is greatest at this time, coinciding with the greater intensity of the UHI. The measurement days were chosen at random from July 2011 to September 2013, with different types of weather, but more often during clear and calm nights. The final database contains the relative humidity data of 32 days at the 238 observation points. The first analysis of the data showed a positive trend that must be eliminated to avoid a false spatial distribution of relative humidity. Thus, daily data series were detrended using linear adjustment and residual analysis and calculated for the same hour.
Mapping Standardized Relative Humidity Conditions and Average Map of UDI
From this new database we create a set of 32 maps. To guarantee temporal comparison among days we standardized the daily data according to mean and SD. In cases of non normality, natural logarithms were applied before standardization (Saz et al., 2003). The standardized values were integrated in a GIS (ArcGIS 10.2.1.) and maps of individual days were created by means of ordinary kriging (Figure 3). This method was applied by Montávez et al. (2000) and Saz et al. (2003) to map the UHIs of Granada and Zaragoza (Spain). The maps were created using a grid cell of 30 m and subsequent analysis were based on this spatial data base and allow us to create the average map of UDI. In this average map the value of every pixel was obtained from the average of the same pixel in the 32 daily grid standardized maps.
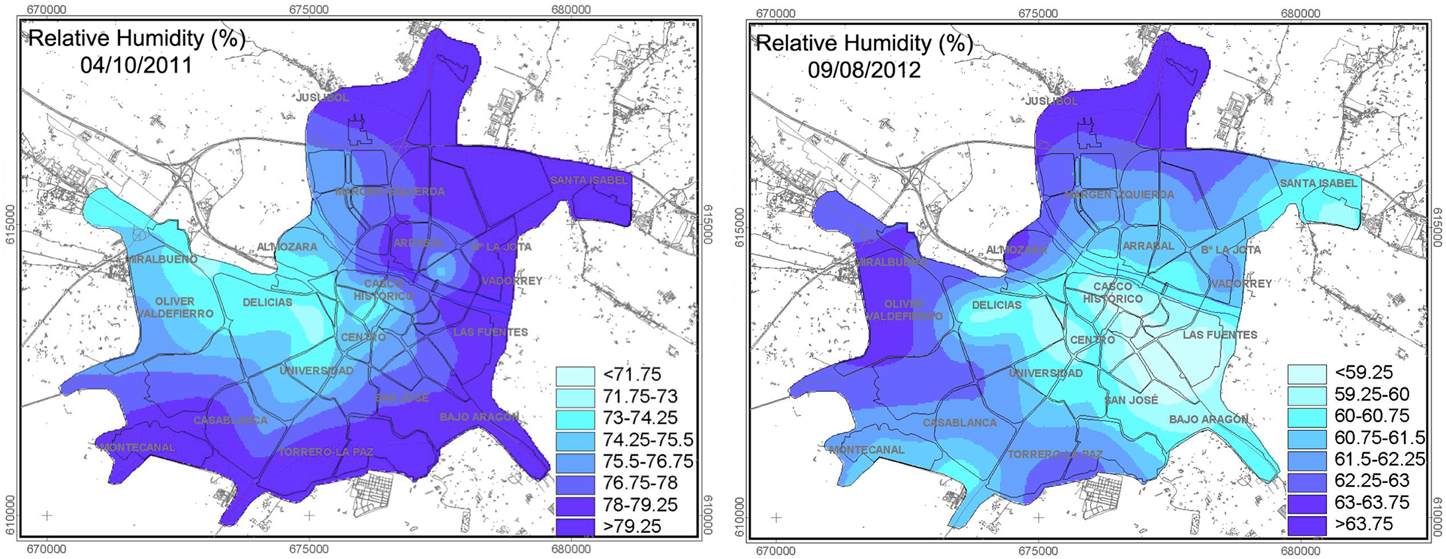
Figure 3. Examples of standardized UHI maps in Zaragoza: October 4th 2011 and August 9th 2012.
Relationships Among Mean UDI and Urban Structure (Surface Reflectivity), Topography and Vegetation Cover (NDVI)
Information on geographical-urban factors proceeds from various sources. The urban structure was obtained from a Landsat-ETM+ image from March 2011 and was corrected geometrically, radiometrically, and through the use of textural filters. The same image allowed us to determine the differential reflectivity of the materials and the cartography of Zaragoza's vegetation cover through the calculation of the Normalized Difference Vegetation Index (NDVI) as the most suitable method, due to the relationship with the leaf area index, vegetative biomass, and photosynthetic activity. Given the high definition of the image, the final reflectivity and NDVI images were filtered through a low pass filter (21 × 21 pixels) in order to solely retain general vegetation distribution patterns.
In order to include the variable altitude, a General Elevation Model was generated using the MiraMon GIS ISOMODE module. It was based on digital information at 1:25,000 scale, from the National Geographical Institute of the municipality of Zaragoza. The result was a 30 m grid, which coincides with the climate maps developed and the spatial resolution of the satellite image. Figure 4 shows the spatial distribution of some of the structural and geographical factors obtained in Zaragoza with a cell size of 30 m.
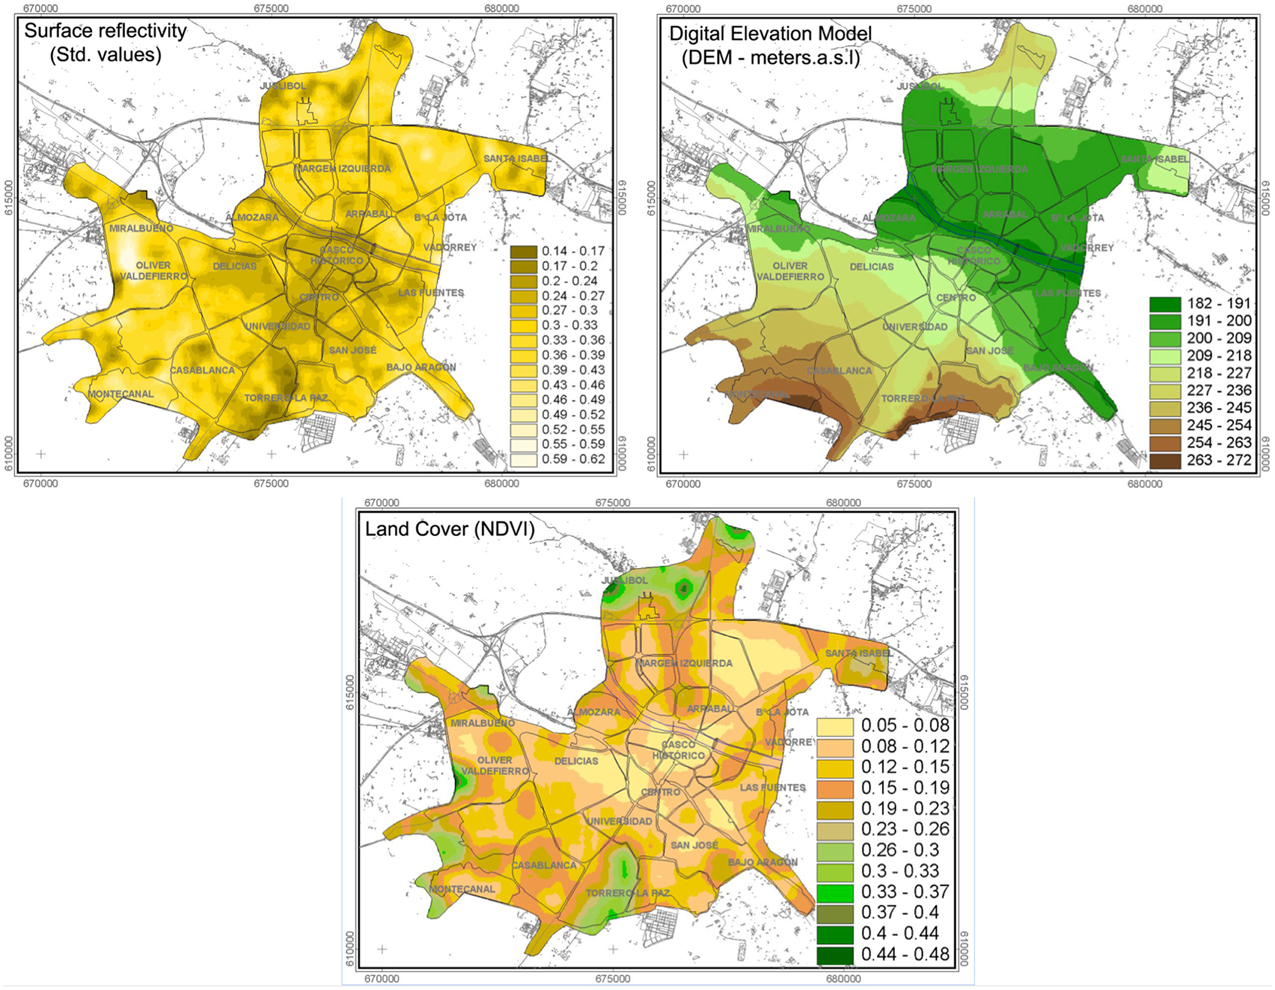
Figure 4. Spatial distribution of surface reflectivity, elevation, and NDVI (low pass filter 21 × 21 pixels).
In order to underline the importance of these factors a stepwise multiple regression analysis was carried out (Hair et al., 1998). The factors under consideration were incorporated into the mathematical model in line with their correlation with the spatial distribution of relative humidity. Other urban variables, such as population density, construction materials, or traffic density, about which there is less information available, were not used in the model.
Estimation of UDI Spatial Patterns
Using standardized and spatially continuous information from the 32 measurement days (grids 30 m), the spatial patterns of Zaragoza's UDI were analyzed. With this objective in mind, we used a Principal Component Analysis (PCA) in T Mode was carried out. Using this criterion, the measurement days are the variable to be summarized and the different locations are the cases. The selection of a number of components was made using the eigenvalue criterion >1 (Hair et al., 1998). Once obtained, their rotation was deemed necessary, as this redistributes variance and eliminates spatial ambiguities. In this research, Varimax rotation (Kaiser, 1958) was chosen, as this method is the most commonly used to ensure more stable and physically explicable patterns (Richman, 1986). PCA also allows to obtain a factor-loaded matrix by correlating each individual map to each extracted component, in order to determine the weight that each day has on each component. This matrix was used to understand the importance of wind direction on spatial distribution of the UDI.
Evaluation of the Influence of Wind Direction on UDI Spatial Patterns
With the purpose of determine the influence of wind surface direction over spatial patterns of UDI, we have used daily data of wind surface direction in Zaragoza's weather station. The data is hourly, and we used the information that corresponds to transect center time each day. The surface direction is reported in degrees and we classified the 32 days in two dominant directions according to valley geography and dominant wind flow directions. The flow direction values from 45° to 225° were reclassified to flows of SE direction whereas flows between 225° and 45° were classified as NW.
On the one hand, using categorical data of surface wind direction in Zaragoza (SE or NW direction) and on the other hand the results of PCA, we have carried out an analysis of variance, in which the variable has been the EOF values and the factor the surface wind direction classes. This analysis allows determining if there are significant differences in the shape of UDI related to wind flow directions. The signification threshold is fixed in p < 0.05, and individual contrast between classes was carried out not assuming equal variance and using Tarhule test.
The EOF values indicate the similarity between general UDI patterns and the spatial configuration of UDI the different days. For this reason, high EOF values corresponding to a wind surface direction will indicate an important influence of these atmospheric characteristics on UHI shape because in the days, in which these conditions are recorded, the spatial patterns of UHI will similar at certain component.
Results
General Spatial Patterns of the UDI and Relationships among UDI and Surface Reflectivity, Elevation, and Vegetation Cover
The standardized cartography of each of the measurement days allows comparison between the different maps by converting absolute values into standard deviations with respect to the average, and permits a mean map to be drawn up showing the UDI configuration in Zaragoza and the city's outlying areas (Figure 5). The most significant characteristics are the notable contrasts in relative humidity within the city. In terms of its configuration, Zaragoza's UDI often has a concentric form, with nuclear closed isolines and tending toward a circular form. Minimum levels predominate toward the center of the city, where the large housing estates are located, and gradually the relative air humidity increases toward the outside of the city, particularly toward the suburban and urban areas in the south west, south, and north. In the peri-urban areas, there is also a significant dissymmetry between the drier east and the generally more humid west, which is consistent with the principal location of green spaces and the size of irrigation land around Zaragoza.
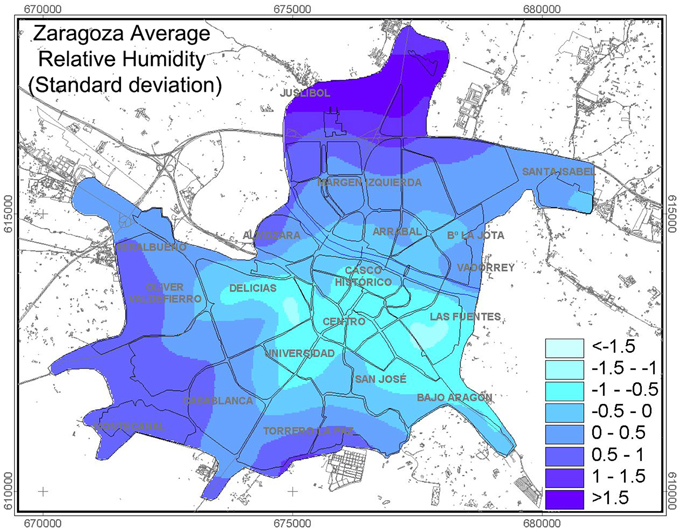
Figure 5. Zaragoza average relative humidity map.
This spatial pattern of the UDI presents a high degree of correlation that is statistically significant (p < 0.01), with the elevation, the urban density and vegetation. The results from the multiple regression analysis (Table 1) show that the topography is responsible for 30% of the spatial variance of relative air humidity. When urban density is added, this rises to 44%, while in the final model, which also includes NDVI and material reflectivity, it accounts for 52%. Topography is the most influential factor in the distribution of humidity, having a positive effect on it. The upper terraces of the river Ebro, which are 80–100 m above the center of the city, are always the most humid areas. The vegetation cover of park and garden areas has positive consequences, due to its contribution of humidity from evapotranspiration. In contrast, the effect of the urban structure is negative, particularly in areas with greater building density. These results show that the environmental variables considered in this study have a major influence on the form and intensity of the UDI, although sometimes the prediction of humidity levels is poor due to over or underestimating and must be explained by other urban variables.
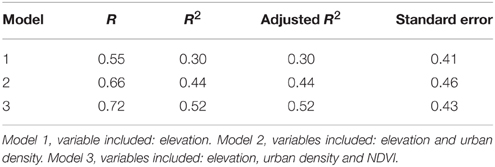
Table 1. Results of the stepwise multiple regression analysis.
Influence of Wind Direction on UDI Variability
The frequency and intensity of the wind significantly might affect the spatial configuration of the UDI. Two multivariate analysis techniques were combined for this research: a PCA and a variance analysis. The information from the PCA applied to all 32 standardized maps shows that 91% of the total variance percentage can be explained by three spatial components in the configuration of the UDI, as follows: Component 1 (C1) represents 40.5%; Component 2 (C2) represents 37.2%; and Component 3 (C3) represents 15.1%. Other components obtained from the analysis have not been considered, since their significance is too low.
The cartography of the standardized components indicates that the spatial UDI model is unstable, while presenting three different forms (Figure 6). In the case of C1, the configuration of the UDI is very similar to the city's average humidity map: a minimum of humidity located in central areas of Zaragoza with a gradual increase in levels toward the outskirts. C2, however, shows a marked displacement of the dryness toward the East. The contrast with the west neighborhoods is clear, especially in the more peri-urban areas, where there is a significant increase in humidity. The situation is very different in the case of C3: here, the UDI is displaced toward the west.
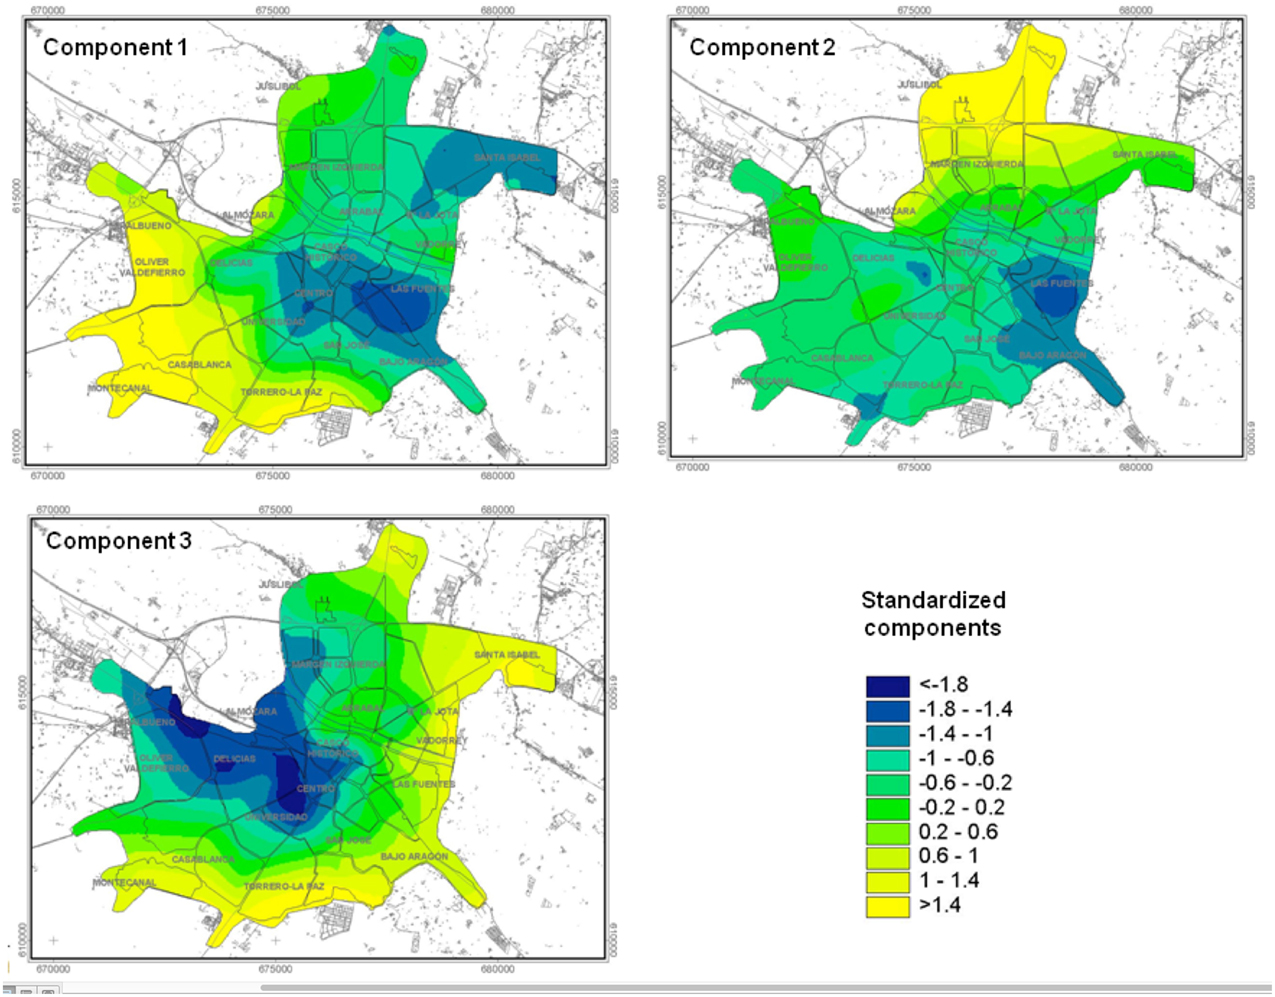
Figure 6. Spatial distribution of rotated PCAs from standardized relative air humidity.
The results obtained in the analysis of variance regarding each of the main components of air humidity indicate that there are only significant differences in the case of PC3, which shows the movement of areas with less air humidity toward the western sector of the city (Table 2). PC2 indicates a relationship with the frequent wind flow from the NW in Zaragoza. However, the ANOVA test does not indicate that this relationship is statistically significant.
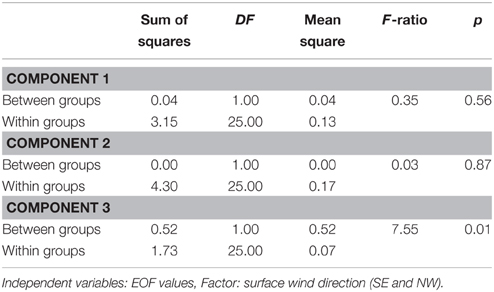
Table 2. Results of analysis of variance.
Discussion and Conclusions
This study analyses the general characteristics of relative air humidity in a medium-sized city in the Mediterranean region, using a database created by means of urban transects and digital cartography, spatial regression techniques and GIS. The analysis of the information allows us to clearly see the differences in relative air humidity between the urban and rural area, especially the existence of a significant dry island inside the city, which is strongly influenced by a range of factors.
Using the information obtained from urban transects, we have confirmed the existence of relative air humidity levels that are always lower inside the city than on the periphery; sometimes up to 20% lower. The minimum humidity can be found in the center/east of the city in areas with high building density and few green spaces. In contrast, the most humid areas are consistent with areas that include parks and natural green spaces around Zaragoza. Although the results show a strong relationship between urban parameters and humidity levels, we should recommend caution regarding the relationship and the temporal behavior of the UDI. In this research, all of the measurements were made at night, between 3 and 4 h after sunset, but humidity conditions change throughout the day (Oke, 1995; Jauregui and Tejeda, 1997; Mayer et al., 2003) and, consequently, both the form and intensity of the UDI could present large daily variations.
This pattern is also consistent with the influence that air temperature has on relative air humidity, and with the strong existing connection between the dry island and the heat island, as indicated in studies into urban climate (e.g., Lee, 1991; Holmer and Eliasson, 1999; Charciarek, 2003; Sümeghy, 2009; Moriwaki et al., 2013). This fact is clear in the city of Zaragoza, where there is a significant heat island, which is very well-defined in the urban interior (see Saz et al., 2003), whose highest figures match the minimum figures of relative air humidity, and vice versa. The inverse UDI/UHI relationship was found throughout the entire measuring process, although logically it is clearest in anticyclonic atmospheric conditions, under clear skies and calm winds; in other situations the spatial pattern is more complex.
The relationship of relative air humidity with other components of the urban environment is more difficult to identify because of the range of factors that affect its distribution and the difficulty in its quantification. This question has been studied in some detail in the case of temperatures, including analysis of the influence of parks (Oke, 1995; Dimoudi and Nikolopoulou, 2003), of urban geometry (Eliasson, 1994) and of topography (Beral-Guyonnet, 1997; Vicente et al., 2003). However, air humidity has hardly been included in these studies and there are still few reference works (Henry et al., 1985; Ernst, 1995; Sümeghy, 2009; Robaa, 2013). In Zaragoza, the topography, the urban structure and vegetation have been analyzed, and the results confirm the influence of these variables on the explanation of the form and intensity of the UDI. The correlation discovered was high and statistically significant and explains a high percentage of the spatial variability of the distribution of relative air humidity. However, final conclusions should be taken with some caution, because in some areas the estimate of the humidity figures is very poor, especially in areas of high building density in the center of the city or in new urban areas on the left side of the river Ebro. That is why we should consider other urban variables in a more detailed analysis, such as the types of land use, the population density, surface materials, or traffic density, in order to create more accurate explanatory models.
In the study we show that the spatial pattern of the UDI is not stable over time and is changed by the wind, particularly by NW and SE winds, the dominant winds in the region. Using the Analysis of Principal Components we have identified three main patterns that relate to three different spatial configurations of the UDI: Principal component 1, PC1, shows the most frequent position, which is similar to the configuration obtained from the average of all the measurements. In the case of PC2 and PC3, we found a relationship between the days with winds from the NW and the movement of the UDI toward the east, and between winds from the SE and the movement of the UDI toward the west, in this case with a statistical relationship. However, we should state that the high variability of the figures during the days with winds from the SE makes it difficult to identify this pattern and causes greater uncertainty regarding the form of the dry island (Figure 7).
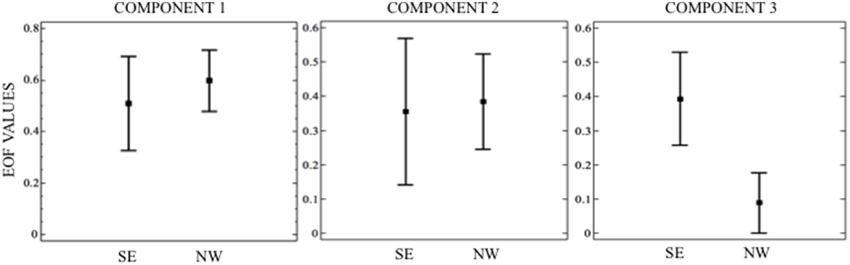
Figure 7. Box-plot of EOF values for PCs in function of surface wind direction, SE, and NW.
The results obtained also show the usefulness of the spatial regression techniques used in order to discover the distribution of the climatic variables and the effects of geographical/urban factors, because it allows us to obtain information from any place in the city, regardless of whether there is an observation point or not. In the case of relative air humidity, its study is important because its behavior affects bioclimatic comfort and people's quality of life. The methodology employed could be used to determine the distribution of air humidity that might result from future urban growth and to guide the development of more environmentally-sound cities.
Conflict of Interest Statement
The authors declare that the research was conducted in the absence of any commercial or financial relationships that could be construed as a potential conflict of interest.
Acknowledgments
This research has been possible thanks to the assistance from the following projects: Clima y calidad ambiental en la ciudad de Zaragoza (“Climate and Environmental Quality in Zaragoza”), financed by the Zaragoza City Council Environmental Department and the Programa de grupos de investigación consolidado (“Consolidated Research Group Programme”), financed by the Aragón Regional Government and European Fund for Regional Development (FEDER). The authors would like to thank the Editor and anonymous reviewers for their valuable comments and suggestions.
References
Ackerman, B. (1987). Climatology of Chicago area urban-rural differences in humidity. J. Appl. Meteorol. 26, 427–430.
Beral-Guyonnet, I. (1997). Analyse spatiale des températures mensuelles dans l'agglomération lyonnaise. Rev. Geogr. Lyon 72, 263–266 doi: 10.3406/geoca.1997.4705
Charciarek, T. (2003). “Daily course of vapour pressure and relative humidity differences between urban and rural site in Lodz,” in 5th International Conference on Urban Climate (Lodz: IAUC, CD).
Dimoudi, A., and Nikolopoulou, M. (2003). Vegetation in the urban environment: microclimatic analysis and benefits. Energy Build 35, 69–76. doi: 10.1016/S0378-7788(02)00081-6
Eliasson, I. (1994). Urban-suburban-rural air temperature differences related to street geometry. Phys. Geogr. 15, 1–22.
Ernst, S. (1995). “Influence of urban structures on local wind systems in Freiburg i. Br. (Germany),” in Climatology and Air Pollution, ed International Geographical Union (Mendoza: Universidad Nacional de Cuyo), 73–82.
Hair, J. F., Anderson, R., Tatham, R. L., and Black, W. (1998). Multivariate Data Analysis. New York, NY: Prentice Hall.
Henry, J., Dicks, S., and Marotz, G. (1985). Urban and rural humidity distributions: relationships to surface materials and land use. Int. J. Climatol. 5, 53–62. doi: 10.1002/joc.3370050105
Hilberg, S. (1978). “Diurnal temperature and moisture cycles,” in Summary of METROMEX, Vol. 2: Causes of Precipitation Anomalies, Illinois State Water Survey Bulletin 63, ed Ackerman (Urbana, IL: State of Illinois), 25.
Holmer, B., and Eliasson, I. (1999). Urban-rural vapor pression differences and their role in the development of urban heat island. Int. J. Climatol. 19, 989–1009.
Jauregui, E., and Tejeda, A. (1997). Urban-rural humidity contrast in Mexico City. Int. J. Climatol. 17, 187–196.
Kaiser, H. E. (1958). The varimax criterion for analytic rotation in factor analysis. Psikometrica 23, 187–200. doi: 10.1007/BF02289233
Kuttler, W., Weber, S., Schonnefeld, J., and Hesselschwerdt, A. (2007). Urban/Rural atmospheric water vapor pressure differences and urban moisture excess in Krefeld, Germany. Int. J. Climatol. 27, 2005–2015. doi: 10.1002/joc.1558
Lee, D. (1991). Urban–rural humidity differences in London. Int. J. Climatol. 11, 577–582. doi: 10.1002/joc.3370110509
Liu, W., You, H., and Dou, J. (2008). Urban-rural humidity and temperature differences in the Beijing area. Theor. Appl. Climatol. 96, 201–207. doi: 10.1007/s00704-008-0024-6
PubMed Abstract | Full Text | CrossRef Full Text | Google Scholar
Mayer, H., Matzarakis, A., and Iziomon, M. (2003). Spatio-temporal variability of moisture conditions within the urban canopy layer. Theor. Appl. Climatol. 76, 165–179. doi: 10.1007/s00704-003-0010-y
Montávez, J. P., Rodríguez, A., and Jiménez, J. I. (2000). A study of the urban heat island of Granada. Int. J. Climatol. 20, 899–911. doi: 10.1002/1097-0088(20000630)20:8<899::AID-JOC433>3.0.CO;2-I
Moriwaki, R., Watanabe, K., and Morimoto, K. (2013). Urban dry island phenomenon and its impact on cloud base level. Jpn. Soc. Civil Eng. 1, 521–529. doi: 10.2208/journalofjsce.1.1_521
Oke, T. R. (1995). “The heat island of the urban boundary layer: characteristics, causes and effects,” in Wind Climate in Cities, eds J. E. Cermak, A. G. Davenport, E. J. Plate, and D. X. Viegas (Dordrecht: Kluwer-Academic Publications), 81–107. doi: 10.1007/978-94-017-3686-2_5
Richman, M. B. (1986). Rotation of principal components. J. Climatol. 6, 29–35. doi: 10.1002/joc.3370060305
Robaa, S. M. (2013). Some aspects of the urban climates of Greater Cairo Region, Egypt. Int. J. Climatol. 33, 3206–3216. doi: 10.1002/joc.3661
Saz, M. A., Vicente, S., and Cuadrat, J. M. (2003). “Spatial patterns estimation of urban heat island of Zaragoza (Spain) using GIS,” in 5th International Conference on Urban Climate (Lodz: IAUC, CD).
Sümeghy, Z. (2009). Influence of different factors on relative air humidity in Szeged, Hungary. Acta Climatol. Univ. Szeged. 42–43, 131–141.
Keywords: urban climate, relative humidity, urban dry island, spatial patterns, surface wind direction, Zaragoza, Spain
Citation: Cuadrat JM, Vicente-Serrano S and Saz MA (2015) Influence of different factors on relative air humidity in Zaragoza, Spain. Front. Earth Sci. 3:10. doi: 10.3389/feart.2015.00010
Received: 03 November 2014; Accepted: 23 February 2015;
Published: 19 March 2015.
Edited by:
Hayley Jane Fowler, Newcastle University, UKReviewed by:
Peter Spathelf, Eberswalde University for Sustainable Development, GermanyGovidan Krishnan, Indian Council of Agricultural Research, India
Copyright © 2015 Cuadrat, Vicente-Serrano and Saz. This is an open-access article distributed under the terms of the Creative Commons Attribution License (CC BY). The use, distribution or reproduction in other forums is permitted, provided the original author(s) or licensor are credited and that the original publication in this journal is cited, in accordance with accepted academic practice. No use, distribution or reproduction is permitted which does not comply with these terms.
*Correspondence: José M. Cuadrat, Department of Geography, University of Zaragoza, C/Pedro Cerbuna 12, 50009 Zaragoza, Spain cuadrat@unizar.es