A comparison between two algorithms for the retrieval of soil moisture using AMSR-E data
 Simonetta Paloscia1*
  Emanuele Santi1 Simone Pettinato1 Iliana Mladenova2
  Thomas Jackson2 Rajat Bindlish2
  Michael Cosh2
- 1National Research Council-Institute of Applied Physics (IFAC-CNR), Florence, Italy
- 2United States Department of Agriculture-Agricultural Research Service Hydrology and Remote Sensing Laboratory, Beltsville, MD, USA
A comparison between two algorithms for estimating soil moisture with microwave satellite data was carried out by using the datasets collected on the four Agricultural Research Service (ARS) watershed sites in the US from 2002 to 2009. These sites collectively represent a wide range of ground conditions and precipitation regimes (from natural to agricultural surfaces and from desert to humid regions) and provide long-term in-situ data. One of the algorithms is the artificial neural network-based algorithm developed by the Institute of Applied Physics of the National Research Council (IFAC-CNR) (HydroAlgo) and the second one is the Single Channel Algorithm (SCA) developed by USDA-ARS (US Department of Agriculture-Agricultural Research Service). Both algorithms are based on the same radiative transfer equations but are implemented very differently. Both made use of datasets provided by the Japanese Aerospace Exploration Agency (JAXA), within the framework of Advanced Microwave Scanning Radiometer—Earth Observing System (AMSR-E) and Global Change Observation Mission—Water GCOM/AMSR-2 programs. Results demonstrated that both algorithms perform better than the mission specified accuracy, with Root Mean Square Error (RMSE) ≤0.06 m3/m3 and Bias <0.02 m3/m3. These results expand on previous investigations using different algorithms and sites. The novelty of the paper consists of the fact that it is the first intercomparison of the HydroAlgo algorithm with a more traditional retrieval algorithm, which offers an approach to higher spatial resolution products.
Introduction
The systematic and timely monitoring of land surface parameters that affect the hydrological cycle at a variety of spatial scales is of great importance in gaining a better understanding of geophysical processes and for the management of environmental resources and natural disasters. Since soil moisture content (SMC) plays a major role in both research and applications, its estimation and mapping, even at coarse spatial scales, is vital to supporting global monitoring activities and climate change analyses and predictions.
Over the past decades, as a result of the availability of several satellite-based sensor systems with suitable frequencies for estimating SMC, global mapping of soil moisture has become a reality. This began with the AMSR-E (Kawanishi et al., 2003) and WindSat (Gaiser, 2004) sensors, and it will continue for many years with the new generation AMSR radiometer onboard the Japanese Aerospace Exploration Agency (JAXA)/G-COM satellite (Shimoda, 2009). In addition, we now have a dedicated soil moisture satellite, the European Space Agency (ESA) Soil Moisture and Salinity Mission (SMOS), (Kerr et al., 2010), with another planned for 2014, the National Aeronautics and Space Administration (NASA)'s Soil Moisture Active Passive (SMAP) mission (Entekhabi et al., 2010). With these missions, the routine production of global SMC maps in near real time is now supported by space agencies (e.g., ESA, NASA, JAXA, CONAE—the Argentinian “Comision Nacional de Actividades Espaciales”).
Mission and algorithm design are driven by user needs to meet the requirements on accuracy, computational time and spatial resolution. Validation of soil moisture products is also necessary to ensure the quality of information and to provide the user with an assessment of its accuracy and reliability.
Several approaches are available in the literature for generating SMC maps from AMSR-E data, (e.g., Jackson, 1993; Owe et al., 2001; Shibata et al., 2003; Paloscia et al., 2006; Jackson et al., 2010; Santi et al., 2012; Mladenova et al., 2014). Each retrieval algorithm utilizes different combinations of frequencies and polarizations, and different ancillary data. Efforts have been carried out to assess individual algorithms or to compare subsets of the existing algorithms, in order to highlight their strengths and weaknesses. One example of this is the paper by Jackson et al. (Jackson et al., 2010). Four alternative passive-based products, including the Single-Channel Algorithm (SCA), developed by the US Department of Agriculture (USDA), were compared with SMC ground values in (Jackson, 1993). Results showed that long time series of ground observations for a number of well characterized sites is very valuable in comparing algorithms. Unfortunately, only a few such sites are available. A more recent effort of comparison between different algorithms was described in (Mladenova et al., 2014), where a detailed theoretical inter-comparative study was carried out, although this paper does not offer any actual quantitative error-based accuracy assessment analysis.
In this paper we conduct the first comparison of an algorithm that uses a retrieval approach based on artificial neural networks (ANN) and was developed by the Institute of Applied Physics of the National Research Council (IFAC-CNR) (HydroAlgo) (Santi et al., 2012) with, the Single-Channel Algorithm (SCA) developed by the USDA (Jackson, 1993), which follows a more traditional retrieval approach. In this case, for a more in-depth comparison between two of the algorithms was performed, by analyzing a wide dataset collected on different test areas in various seasons and by giving statistical figures of the comparison between the two methods. The linkage of these algorithms is that both have been applied as research algorithms within the framework of the NASA and JAXA ADEOS-II/AMSR-E and GCOM/AMSR-2 programs.
The paper is structured as follows: after the introduction, the two algorithms are described in Section II, and in Section III the Agricultural Research Service (ARS) watersheds are briefly described. In Section IV the results obtained from the algorithm comparison are shown, and, finally, in Section V some conclusions are drawn. Results demonstrate that both algorithms perform within the JAXA mission specified accuracy with a RMSE ≤0.06 m3/m3 and Bias <0.02 m3/m3.
Description of the Algorithms
HydroAlgo
The HydroAlgo utilizes the basic radiative transfer equation, in the simplified tau-omega formulation (Mo et al., 1982), which is inverted through an artificial neural networks (ANN) approach. HydroAlgo uses the low-frequency AMSR-E observations at 6.8 GHz (C-band), 10.65 GHz (X-band) and 18.7 GHz (Ku-bands), for estimating SMC and correcting for vegetation effects. A unique aspect of this algorithm is that it also incorporates a procedure for enhancing the spatial resolution of the lower frequencies as one of the first steps. The core of the algorithm is an ANN, having as inputs the brightness temperature at C band in V polarization, the polarization indices at 10.65 and 18.7 GHz (X and Ku bands) (PI = 2*(TbV − TbH)/(TbV + TbH)) and the brightness temperature at 36.5 GHz (Ka-band), V polarization. C band, i.e., the lowest AMSR-E frequency, was chosen for its sensitivity to the SMC, slightly influenced by the low vegetation. Soil moisture retrieval is, in fact, expected to perform well in areas with vegetation water content less than 4–5 kg/m2, provided the necessary corrections for vegetation effects have been made (Santi et al., 2010, 2012). The polarization indices at X and Ku bands are used to account for the effect of vegetation on soil emission (Paloscia and Pampaloni, 1988), and to detect the densely vegetated targets, where the SMC cannot be retrieved. The brightness temperature at Ka band, V polarization, was assumed to account for the effect of diurnal and seasonal variations of the surface temperature on microwave brightness (Njoku and Li, 1999).
This algorithm was developed and tested using the large set of microwave data and in situ observations collected over Mongolia and the Murrumbidgee watershed, in Australia, that were provided by JAXA (Yang et al., 2009; Smith et al., 2012). Data have been separated for ascending and descending orbits. Since the dataset was not large enough for training the ANN, it was enhanced by using data simulated using the simplified tau-omega form of the radiative transfer model (Mo et al., 1982). The inputs of the model were randomly varied in a range derived from experimental data and are the following: SMC (0.05–0.45 m3/m3), surface temperature (275–320 K), vegetation optical depth (τ) at all frequencies, and vegetation single scattering albedo (ω). The range of optical depth and single scattering albedo used at C-band are: τ = 0.16–1.1 and ω = 0.03–0.08. At the higher frequencies, τ and ω values were derived from C-band values using the relationship established in (Santi et al., 2010, 2012). Model simulations were iterated for each input vector of surface parameters, obtaining a training set of 10,000 brightness temperatures at all the AMSR-E bands and polarizations. Two ANNs have been trained separately for ascending and descending orbits. The training was carried out considering the microwave data as inputs, and the SMC as output. The implemented ANN was a feedforward multilayer perceptron (MLP), with a certain number of hidden layers of neurons between the input and the output. In MLPs, successive layers of neurons are fully interconnected, with trainable connection weights that control the strength of the connections. The algorithm chosen for the training phase was the back-propagation learning rule, which is an iterative gradient descent algorithm that is designed to minimize the mean square error between the desired target vectors and the actual output vectors (Hornik, 1989; Linden and Kinderman, 1989; Santi et al., 2012). After the optimization process, a configuration with two hidden layers of 10 perceptrons each was defined. The test of the ANN was carried out on half of the experimental dataset not considered for training. The final validation of the algorithm was carried out using data collected on a watershed in Northern Italy, characterized by a Mediterranean environment (Santi et al., 2012, 2010). The steps of the algorithm (see the flowchart in Figure 1) are as follows:
• Extraction of Tb from the Hierarchical Data Format (HDF) files provided by the National Ice and Snow Data Center (NSIDC) or JAXA that contain the calibrated and geocoded acquisitions of AMSR-E from the NASA Aqua satellite at C, X, Ku, and Ka-band for both polarizations (H, V).
• Check for anomalous data and for the presence of Radio-Frequency Interference (RFI) at C and X-bands. The check for RFI was carried out by using a simple threshold method, and all data with amplitudes exceeding this threshold were eliminated from the dataset (Njoku et al., 2005).
• Application of the multi-sensor image fusion procedure, based on the SFIM (Smoothing Filter-base Intensity Modulation) technique, to enhance the spatial resolution of the low frequency channels up to values close to the pixel size (10 × 10 km) and to reduce the effect of mixed pixels (Liu, 2000; Santi, 2010).
• Computation of the Polarization Indices (PI) at X and Ku-band (PIXand PIKu) for estimating vegetation biomass and of the Frequency Index (FI=[(TbKuV − TbKaV) + (TbKuH − TbKaH)]/2) for detecting the snow cover (Macelloni et al., 2003). The use of PIXand PIKu allows separating deserts and poorly-vegetated areas, where SMC can be estimated, from forests and dense vegetation regions, where retrieval is unrealistic due to the high attenuation induced by vegetation. This effect is particularly evident at X band, which is consequently the most suitable frequency for quantifying vegetation biomass and was also used in this paper to correct the effect of low vegetation on the SMC estimate (Paloscia and Pampaloni, 1988; Paloscia et al., 2006; Santi et al., 2012).
• “Per pixel” estimation of SMC from input data using the trained ANN. The algorithm selects the proper ANN depending on the orbit direction, ascending or descending.
• Masking of deserts, dense vegetation, snow cover and open water, where SMC cannot be reliably estimated. This process is basically performed by using PIX for dense vegetation (PIX < 0.05, corresponding roughly to a vegetation water content of about 3–4 Kg/m2) and for deserts (PIX > 0.1), FI > 4 for snow cover (Paloscia and Pampaloni, 1988; Macelloni et al., 2003; Santi et al., 2010, 2012).
• Generation of output SMC maps and report files containing the output SMC estimates for the desired test areas.
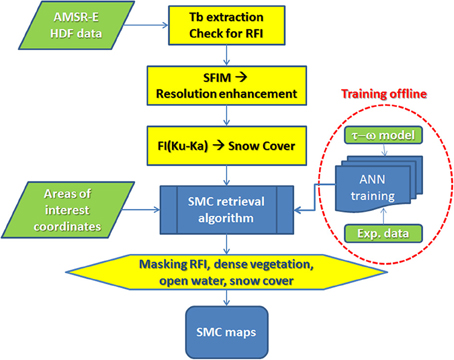
Figure 1. Schematic representation of the HydroAlgo retrieval algorithm. HydroAlgo is based on an Artificial Neural Network (ANN) approach, where the training step is done using both in situ observed and simulated data. Soil moisture retrieval is carried out using C-band AMSR-E TB observations.
Two approaches were used for testing the HydroAlgo algorithm with the ARS dataset,
a. Unsupervised approach: the ANN algorithm described above (ANN1) was directly applied to the ARS data,
b. Supervised approach: in an effort to improve the retrieval accuracy, a part of the ARS dataset (10% of available dataset) has been randomly selected and included into the training set described above. The procedure has been replicated, in order to check if a different data selection would lead to different results, and the ANN training has been repeated. The new ANN (ANN2) trained with this updated dataset was tested on the remaining 90% of the ARS dataset.
SCA
The SCA (Jackson, 1993; Jackson et al., 2010) is based on the radiative transfer equations and uses the available channel that is most sensitive to soil moisture, which, for AMSR-E is the 10.65-GHz (X-band) in Horizontal polarization. The presence of radio-frequency interference at 6.9 GHz has very often limited the use of these observations in many soil moisture algorithms, especially over the U.S. (e.g., Njoku et al., 2005). SCA has been extensively described in the literature, validated with in situ data, and compared with alternative microwave soil moisture products under a wide range of ground conditions and climate regimes (Jackson, 1993; Jackson et al., 2002, 2010; Crosson et al., 2005; Bindlish et al., 2008); therefore, we will only briefly introduce the main algorithm components here.
The model is based on an inverse solution of the radiative transfer model, with the following basic assumptions that are made in most algorithms:
a. Soil effective temperature is considered equal to the canopy effective temperature, and
b. The ground is assumed to be homogeneous within the satellite footprint.
The effective surface temperature is required in order to compute the effective emissivity of the ground surface and is approximated using a function based on the 37 GHz vertical polarization AMSR-E observations (De Jeu and Owe, 2003). The resulting emissivity estimate is then corrected for the effects of vegetation by expressing the optical depth (τ) in terms of the Vegetation Water Content (VWC) using the following expression: τf,p = bf,pVWC, where bf,p is a vegetation attenuation parameter, and f and p stand for frequency and polarization, respectively. VWC is based on NDVI following (Jackson and Schmugge, 1991; Wen et al., 2005). Roughness effects are accounted for by applying a well-known roughness correction model (Choudhury et al., 1979). Although the roughness parameter is expected to vary temporally and spatially, it is very difficult to provide reliable information for characterizing this variability. Therefore, we have assumed a constant value of 0.1.
The corrected emissivity is then related to the dielectric properties of the soil after assuming that the conditions of the Fresnel equations apply. Finally the SMC is estimated by using a dielectric mixing model (Wang and Schmugge, 1980) along with ancillary soil texture data. For this investigation, the revised AMSR-E level-2 (orbital footprint observations) brightness temperature data (version V10) available from NASA were used as input to the SCA to estimate soil moisture.
The algorithm requires ancillary inputs that include NDVI (vegetation parameterization) and soil texture (estimation of the soil dielectric constant). Figure 2 shows a flowchart of the model.
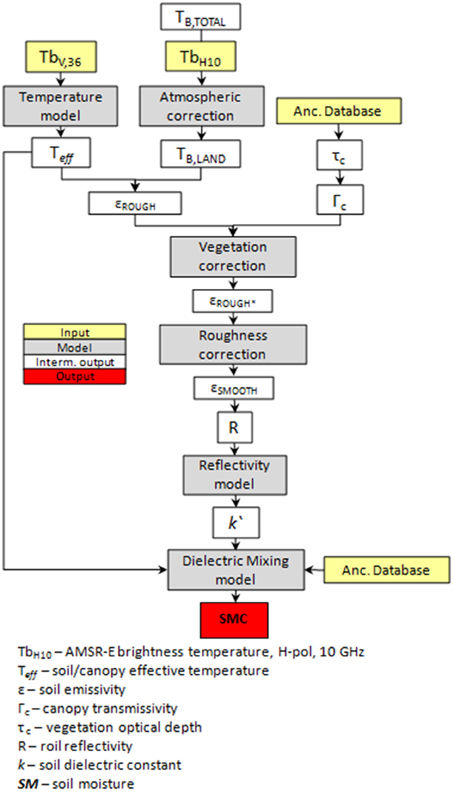
Figure 2. Schematic representation of the Single Channel Algorithm (SCA). SCA is based on an inverse solution of the radiative transfer model. It requires limited amount of ancillary data. The algorithm is run using X-band AMSR-E data.
Test Areas
In order to conduct the algorithm comparisons, data from the four ARS experimental watersheds were used (Figure 3). These watersheds have dimensions compatible with the AMSR-E footprint at the frequencies used in the two algorithms: X-band (namely 46 × 27 km2), and C-band (namely, close to 10 × 10 km2, with the application of the SFIM procedure). These sites are well-instrumented and characterized and have been the focus of several AMSR-E validation campaigns (Jackson et al., 2005; Bindlish et al., 2006, 2008, see also http://nsidc.org/data/amsr_validation/). The vegetation characteristics in the selected watersheds represent typical conditions in specific climate regions, which cover a range of semi-arid to humid. All watersheds have multiple surface soil moisture and temperature sensors (5 cm depth). Since 2002, a number of investigations have been conducted to verify and calibrate the network sensors and to characterize the scaling behavior and how well the network represents the spatial average. A key component of both calibration and scaling of the watershed soil moisture networks for satellite validation has been a series of short-term and large-scale intensive field campaigns that have provided a bridge between the point and the footprint scales (e.g., Cosh et al., 2004, 2005; Jacobs et al., 2004; Jackson et al., 2005; Bindlish et al., 2006, 2008). As a result of these studies, we have a high degree of confidence that the watershed average soil moisture data being produced by the networks represent the average near-surface condition. Characteristics of the individual watersheds are:
• Little Washita (OK): 20 soil moisture stations in a region dominated by the presence of rangeland and pasture plus some agricultural crops. The climate is sub-humid with about 750 mm annual precipitation. The size of the area is 610 km2.
• Little River (GA): 29 soil moisture stations and heavily vegetated (predominantly forests, croplands, and pasture). The climate is characterized by hot humid summers and short mild winters (with about 1200 mm annual precipitation). The size of the area is 334 km2.
• Walnut Gulch (AZ): 19 soil moisture stations, with brush and grass cover and characterized by a semiarid climate (with about 324 mm annual precipitation). The size of the area is 148 km2.
• Reynolds Creek (ID): 19 soil moisture stations in a rangeland dominated area, with snow dominated precipitation. The size of the area is 238 km2.
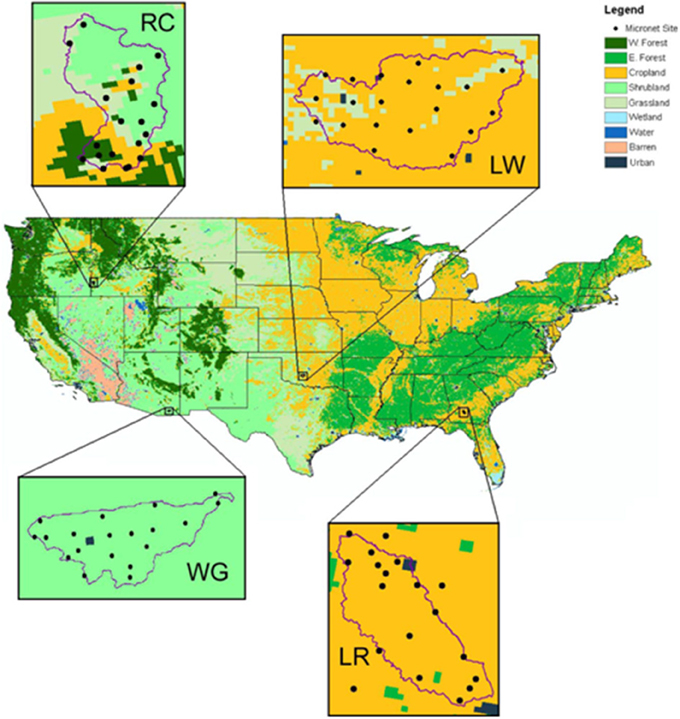
Figure 3. Geographyc location of the ARS watersheds. As illustrated by the image, the four watersheds provide a large variety of vegetation conditions and climate regimes.
Results of the Algorithm Intercomparison
AMSR-E data collected on the ARS watersheds from 2002 to 2009 were used for this intercomparison, together with the corresponding ground truth data. Due to the diurnal variations in surface soil moisture that occur during the day and the sensitivity of retrievals to assumptions about the near surface temperature and moisture profiles, data from the ascending and descending orbits were analyzed separately.
In Figure 4, the SMC estimated for each test area using HydroAlgo is plotted against the SMC measured on the ground: (a) ANN1 (unsupervised approach) and (b) ANN2 (supervised approach). The second approach, which added a part of the ARS dataset (10% of available dataset) to the original training set of the ANN, gave generally better results than ANN1 did. Data have been separated into ascending (top) and descending (bottom) orbits. The comparison between the performance of the two ANN is shown in Table 1, where the correlation coefficient (R), RMSE and Bias obtained for different sites are reported. R-values obtained from ANN2 are seldom higher than 0.6–0.7, and more frequently around 0.5.
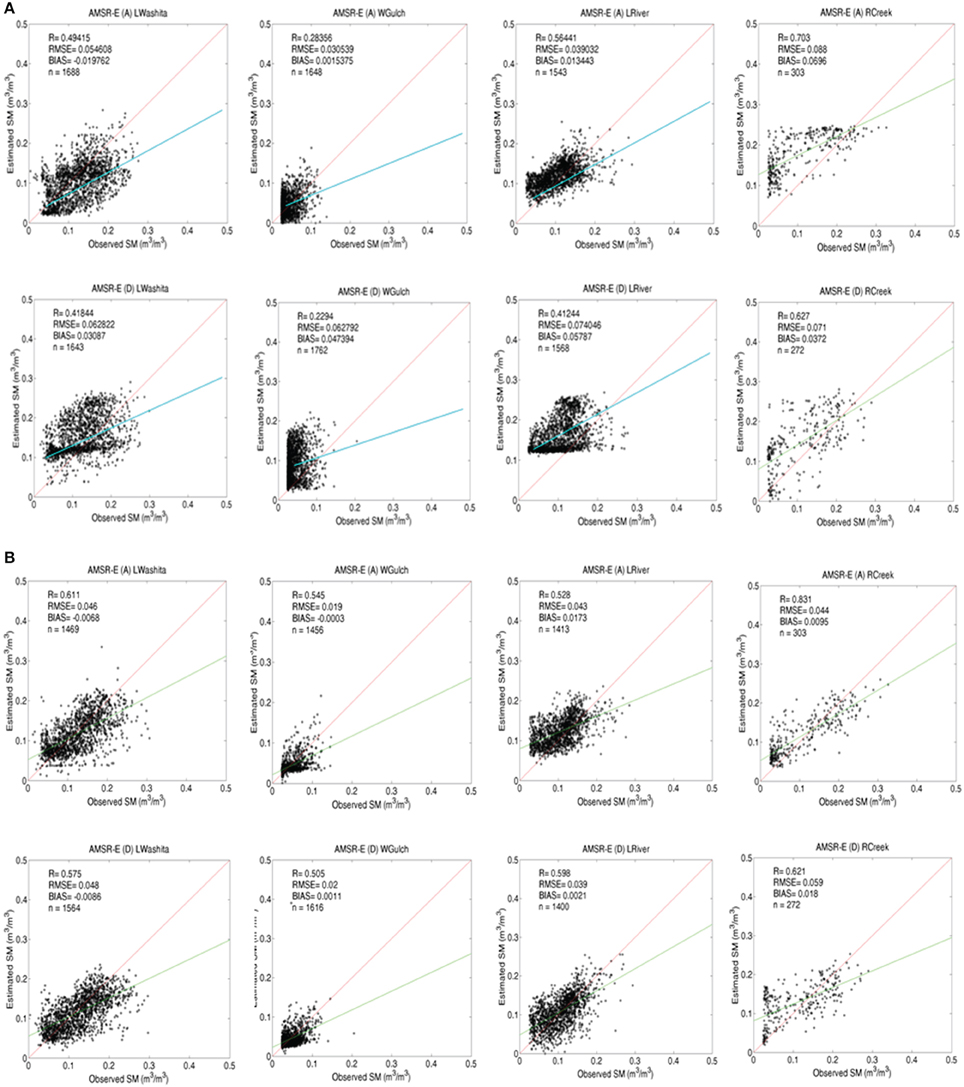
Figure 4. Temporal agreement between the HydroAlgo-derived SMC and the ARS in situ data, where the upper (A) and the lower (B) half of the image summarize the results obtained using the ANN1 and the ANN2 scenarios, respectively. In this case, results from the Ascending (A) and Descending (D) overpasses were analyzed separately and are presented in the top and the bottom row, respectively. Continuous lines represent the regression equations and 1:1 lines (red).
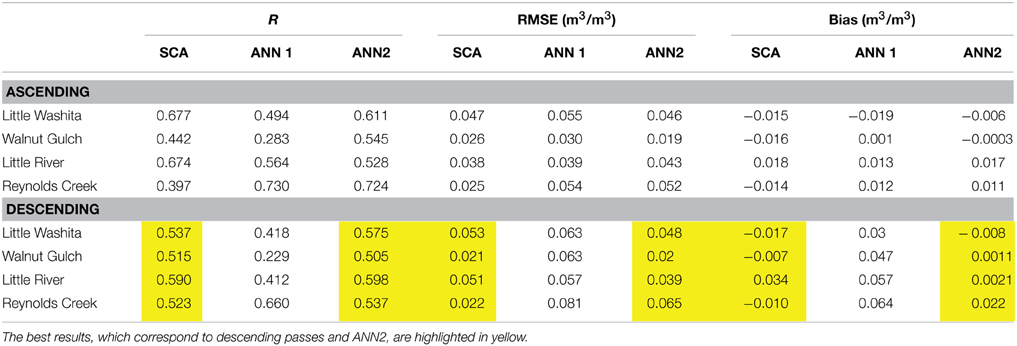
Table 1. Comparison of the performances of the SCA and the two ANN of the HydroAlgo soil moisture algorithms in terms of R, RMSE, and bias for both ascending and descending orbits.
In Figure 5 the results obtained using the SCA are shown. The results are similar to those obtained with the supervised approach (ANN2) of HydroAlgo, at least from a qualitative point of view.
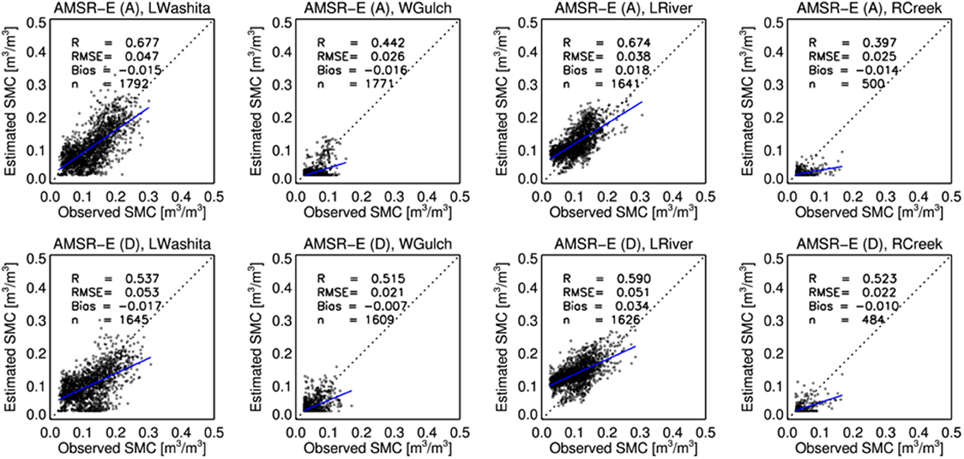
Figure 5. Temporal agreement between the SCA-derived AMSR-E soil moisture estimates and the ARS in situ data. To avoid the potential impact of the physical temperature, ascending and descending overpasses were analyzed separately. Results from the Ascending (A) and Descending (D) overpasses are presented in the top and the bottom row, respectively. Continuous lines represent the regression equations.
The comparison of the performance between SCA and the two ANN of the HydroAlgo soil moisture algorithms is summarized in Table 1 in terms of correlation coefficients (R), RMSE and Bias. The comparison was carried out for the four areas and separately for ascending and descending orbits.
SCA and HydroAlgo (ANN2) have performance results with R higher than 0.5 for descending orbits. Both algorithms had a RMSE ≤0.06 m3/m3 and Bias <0.02 m3/m3, which can be considered good performance, since it is less than the AMSR-E mission SMC accuracy requirement. The spread of data can be attributed to the spatial variability within the test areas and the rather large time interval covered by the dataset (8 years).
For both algorithms, Walnut Gulch, which is a site characterized by a narrow range of low SMC, had the poorest results. This is attributed to the fact that, at SMC lower than 0.10–0.15 m3/m3, the sensitivity of microwave emission to dielectric constant variations is low, and consequently to soil moisture. Better results were obtained on Little Washita and Little River, both of which are covered by herbaceous vegetation. The areas covered by higher levels of vegetation (forests and croplands) in Little River were masked. Reynolds Creek, due to the long winter season and frequent snowfall, gave ambiguous results due to the procedures used for masking snow cover. Both algorithms tend to underestimate the higher SMC values, as can be observed from the values of the trend line slopes, which are lower than 1.
Furthermore, AMSR-E data derived from ascending orbits (early morning) seem to perform slightly better than data from descending orbits (early afternoon). This could be due to the influence of the soil and vegetation temperatures, which are assumed to be in equilibrium when solving the τ—ω model, which is a common assumption for both algorithms. This assumption is less likely to be valid in the middle of the day (descending overpasses), when large temperature gradients between soil and vegetation can hamper soil moisture inversion. The soil microwave emission, in fact, originates from the top surface layer and the contributing depth depends on the dielectric characteristics of the near-surface moisture profile, being shallower for higher frequencies and for wetter soils. At night, the soil moisture and temperature profiles are more uniform as compared to early afternoon, and the soil–vegetation temperature differences are smaller. Thus, the early morning AMSR-E SMC retrievals are expected to have less modeling error than the early-afternoon observations (Njoku et al., 2003; Gruhier et al., 2010).
Following these tests, the two algorithms were applied on a global basis. As an example, SMC maps of the entire globe were produced for two different seasons for a single year (i.e., January and July, 2003). The SMC maps are shown in Figure 6 (a: HydroAlgo and b: SCA). In the maps, the masked areas (snow cover, very dense vegetation, etc.) are represented as gray areas, whereas water bodies are blue. The masking of these areas was performed independently by the two algorithms using different methods. This is the reason for the different gray zones in the two maps, especially for snow cover areas visible in China and North America, and some equatorial forests. Although no ground data are available for validation of the global products, we can note that the SMC regional and temporal variations are in reasonable agreement with the climatic conditions of the different areas and with the seasons. Very low SMC values can be observed in desert or semi-arid areas, whereas a marked spatial variability of SMC can be observed in areas characterized by temperate climate and consequently moister conditions (e.g., Europe, US, and Sahel region in Africa). Southern hemisphere shows SMC variations that are reversed from those of the Northern hemisphere (e.g., in Australia, where on the coasts there is a higher humidity in summer than in winter). It should also be noted that SCA bases its retrieval of SMC using X-band data, which are more influenced by vegetation cover. This can explain some of the differences between the two maps.
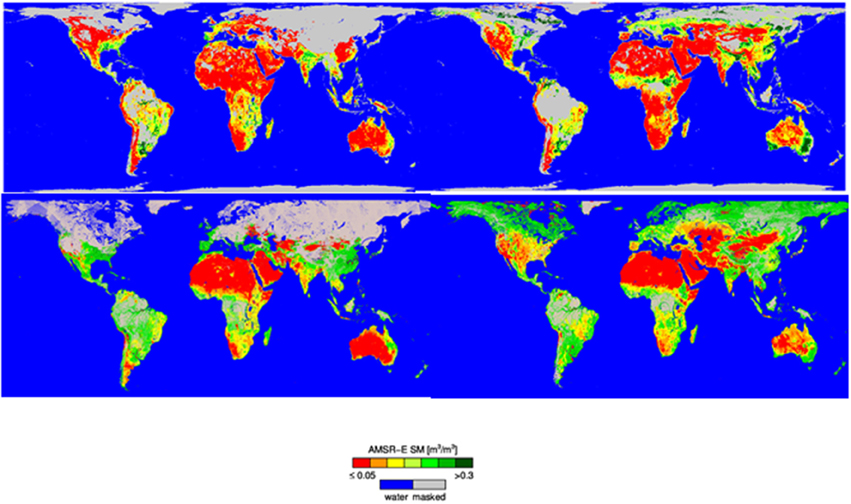
Figure 6. An example of spatial variability and resemblance between the SCA-derived (upper half) and the HydroAlgo-derived (lower half) soil moisture estimates. On the left, global SMC maps are shown during Northern Hemisphere winter (January 2003), and on the right they are shown during Northern Hemisphere summer (July 2003).
Summary
Two algorithms capable of estimating SMC from AMSR-E data have been described and compared to each other. One is the artificial neural network-based algorithm developed by the IFAC-CNR (HydroAlgo), which uses the lowest frequency channel of the AMSR-E radiometer (C-band), combined with the higher frequencies (X- and Ku-bands) in order to correct for the vegetation effects. The other is the Single Channel Algorithm (SCA) developed by USDA-ARS, which is based instead on the X-band channel observations, due to RFI concerns over regions such as the U.S. Both algorithms employ the radiative transfer model in the simplified form of the tau-omega model.
In this investigation, the algorithms were validated and compared by using a large (temporal) dataset collected between 2002 and 2009 over four ARS experimental watersheds, which approximate the size of AMSR-E footprints. Watersheds are well-instrumented and characterized and have been used in several AMSR-E validation studies.
The two algorithms gave approximately the same results in terms of the statistical metrics examined (R, RMSE, and bias). Results were even closer when the second ANN (ANN2) HydroAlgo product, which includes a specific training for the US sites, was used. These results demonstrated that both algorithms can meet or exceed the AMSR-E mission soil moisture accuracy requirement (i.e., RMSE ≤0.06 m3/m3 and bias <0.02 m3/m3), for the conditions examined. In general, SCA had R-values that were between ANN1 and ANN2, whereas the RMSE values were very close to those of ANN2. In all cases, the biases of ANN1 and ANN2 were the lowest. Other key aspects of the results were:
• Both algorithms tend to underestimate high SMC values for all the test areas.
• Early morning AMSR-E overpasses are better suited to soil moisture retrieval than afternoon overpasses.
• A comparison on a global scale was also performed and the resulting SMC maps were in general agreement with the climatic and meteorological conditions of the different areas.
Based upon the analyses conducted, the main advantages and disadvantages of the two algorithms are as follows:
• HydroAlgo has the advantage of not being dependent on dynamic ancillary data. C-band channel provides basic information for the retrieval of SMC. Additional information on surface temperature and vegetation cover, which was useful for improving the retrieval accuracy of the algorithm, was obtained from the Tb at Ka-band (V polarization) and from the polarization index at X and Ku-bands, respectively. HydroAlgo was able to simulate SMC at a nominal ground resolution of 10 × 10 km, by using a specific algorithm for improving the spatial resolution of C-band data. A particular strength of ANN is the computation speed, with respect to other statistical inversion algorithms (e.g., Bayes method), which require time consuming processing. This makes this algorithm interesting in view of its applicability to global retrieval. However, long and consistent datasets, obtained from both experimental activities and model simulations, are required for training a reliable ANN.
• For this particular application, SCA was applied using X-band AMSR-E brightness temperature data. SCA can be applied using either frequency (C or X); however, the X-band channel was preferred here in order to minimize the impact of RFI, which is present in the C-band observations. This higher frequency is expected to be more susceptible to variations in vegetation biomass as compared to C-band. However, the combined use of H-pol observations (as opposed to V-pol) and ancillary data ensures a great sensitivity to soil moisture. SCA is an algorithm that does not require any training and therefore can be immediately applied to data.
As they become available, further comparison with more extended datasets (both spatial and temporal) should also be carried out, in order to check the performance of the algorithms under various environmental conditions (soil moisture conditions, vegetation growth).
It should be noted that it is extremely difficult to put together simultaneous datasets for comparing different algorithms on various surface types, mainly considering the coarse ground resolution of AMSR-E sensor. At this time, we consider the dataset of the ARS US test areas as one of the best available for such a comparison, due to the large variety of surfaces, climatic conditions and SMC ranges.
It should also be noted that one of the novelties of the paper consists of comparing for the first time two rather different algorithms: one (HydroAlgo) based on statistical inversion approach and the other one (SCA) that is based on the inversion of a simplified formulation of the radiative transfer theory. Moreover, in this paper the performance of the two algorithms were evaluated on the basis of a quantitative analysis, also in terms of the statistical metrics.
Conflict of Interest Statement
The authors declare that the research was conducted in the absence of any commercial or financial relationships that could be construed as a potential conflict of interest.
Acknowledgments
This work was partially supported by the Italian Space Agency (ASI) Projects PROSA and HydroCosmo and by the NASA and JAXA ADEOS-II/AMSR-E and GCOM/AMSR-2 programs. USDA is an equal opportunity provider and employer.
References
Bindlish, R., Cosh, T. J., Gasiewski, A. J., Klein, M., and Njoku, E. G. (2006). Soil moisture mapping and AMSR-E validation using the PSR in SPEX02. Remote Sens. Environ. 102, 127–139. doi: 10.1016/j.rse.2005.02.003
Bindlish, R., Jackson, T. J., Gasiewski, A., Stankov, B., Klein, M., Cosh, M. H., et al. (2008). Aircraft based soil moisture retrievals under mixed vegetation and topographic conditions. Remote Sens. Environ. 112, 375–390. doi: 10.1016/j.rse.2007.01.024
Choudhury, B. J., Schmugge, T. J., Chang, A., and Newton, R. W. (1979). Effect of surface roughness on the microwave emission from soils. J. Geophys. Res. 84, 5699–5706. doi: 10.1029/JC084iC09p05699
Cosh, M. H., Jackson, T. J., Bindlish, R., Famiglietti, J. S., and Ryu, D. (2005). Calibration of an impedance probe for estimation of surface soil water content over large regions. J. Hydrol. 311, 49–58. doi: 10.1016/j.jhydrol.2005.01.003
Cosh, M. H., Jackson, T. J., Bindlish, R., and Pruger, J. H. (2004). Watershed scale temporal and spatial stability of soil moisture and its role in validating satellite estimates. Remote Sens. Environ. 92, 427–435. doi: 10.1016/j.rse.2004.02.016
Crosson, W. L., Limaye, A. S., and Laymon, C. A. (2005). Parameter sensitivity of soil moisture retrievals from airborne C- and X-band radiometer measurements in SMEX02. IEEE Trans. Geosci. Remote Sens. 43, 2842–2853. doi: 10.1109/TGRS.2005.857916
De Jeu, R. A. M., and Owe, M. (2003). Further validation of a new methodology for surface moisture and vegetation optical depth retrieval. Int. J. Remote Sens. 24, 4559–4578. doi: 10.1080/0143116031000095934
Entekhabi, D., Njoku, E. G., O'Neill, P. E., Kellogg, K. H., Crow, W. T., Edelstein, W. N., et al. (2010). The soil moisture active and passive, (SMAP) mission. IEEE Proc. 98, 704–716. doi: 10.1109/JPROC.2010.2043918
Gaiser, P. W. (2004). The WindSat space borne polarimetric microwave radiometer: sensor description and early orbit performance. IEEE Trans. Geosci. Remote Sens. 42, 2347–2361. doi: 10.1109/TGRS.2004.836867
Gruhier, C., de Rosnay, P., Hasenauer, S., Holmes, T., de Jeu, R., Kerr, Y., et al. (2010). Soil moisture active and passive microwave products - intercomparison and evaluation over a Sahelian site. Hydrol. Earth Syst. Sci. 14, 141–156. doi: 10.5194/hess-14-141-2010
Hornik, K. (1989). Multilayer feed forward networks are universal approximators. Neural Netw. 2, 359–366. doi: 10.1016/0893-6080(89)90020-8
Jackson, T. J. (1993). Measuring surface soil moisture using passive microwave remote sensing. Hydrol. Process. 7, 139–152. doi: 10.1002/hyp.3360070205
Jackson, T. J., Bindlish, R., Gasiewski, A. J., Stankov, B., Klein, M., Njoku, E. G., et al. (2005). Polarimetric scanning radiometer C and X Band microwave observations during SMEX03. IEEE Trans. Geosci. Remote Sens. 43, 2418–2430. doi: 10.1109/TGRS.2005.857625
Jackson, T. J., Cosh, M. H., Bindlish, R., Starks, P. J., Bosch, D. D., Seyfried, M. S., et al. (2010). Validation of advanced microwave scanning radiometer soil moisture products. IEEE Trans. Geosci. Remote Sens. 48, 4256–4272. doi: 10.1109/TGRS.2010.2051035
Jackson, T. J., Hsu, A. Y., and O'Neill, P. E. (2002). Surface soil moisture retrieval and mapping using high-frequency microwave satellite observations in the Southern Great Plains. J. Hydrometeorol. 3, 688–699. doi: 10.1175/1525-7541(2002)003<0688:SSMRAM>2.0.CO;2
Jackson, T. J., and Schmugge, T. J. (1991). Vegetation effects on the microwave emission of soils. Remote Sens. Environ. 36, 203–212. doi: 10.1016/0034-4257(91)90057-D
PubMed Abstract | Full Text | CrossRef Full Text | Google Scholar
Jacobs, J. M., Mohanty, B. P., Hsu, E., and Miller, D. (2004). SMEX02: Field scale variability, time stability and similarity of soil moisture. Remote Sens. Environ. 92, 436–446. doi: 10.1016/j.rse.2004.02.017
Kawanishi, T., Sezai, T., Ito, Y., Imaoka, K., Takeshima, T., Ishido, Y., et al. (2003). The Advanced Microwave Scanning Radiometer for the Earth Observing System, (AMSR-E), NASDA's contribution to the EOS for global energy and water cycle studies. IEEE Trans. Geosci. Remote Sens. 41, 184–194. doi: 10.1109/TGRS.2002.808331
Kerr, Y. H., Waldteufel, P., Wigneron, J.-P., Delwart, S., Cabot, F., Boutin, J., et al. (2010). The SMOS mission: new tool for monitoring key elements of the global water cycle. IEEE Proc. 98, 666–687. doi: 10.1109/JPROC.2010.2043032
Linden, A., and Kinderman, J. (1989). “Inversion of multilayer nets,” in Proceedings International Joint Conference on Neural Networks, Vol. 2, (Tampa, FL), 425–430.
Liu, J. G. (2000). Smoothing filter based intensity modulation: a spectral preserve image fusion technique for improving spatial details. Int. J. Remote Sens. 21, 3461–3472. doi: 10.1080/014311600750037499
Macelloni, G., Paloscia, S., Pampaloni, P., and Santi, E. (2003). Global scale monitoring of soil and vegetation using active and passive sensors. Int. J. Remote Sens. 24, 2409–2425. doi: 10.1080/01431160210154830
Mladenova, I. E., Jackson, T. J., Njoku, E., Bindlish, R., Chan, S., Cosh, M. H., et al. (2014). Remote monitoring of soil moisture using passive microwave-based techniques—Theoretical basis and overview of selected algorithms for AMSR-E. Remote Sens. Environ. 144, 197–213. doi: 10.1016/j.rse.2014.01.013
Mo, T., Choudhury, B. J., Schmugge, T. J., Wang, J. R., and Jackson, T. J. (1982). A model for microwave emission from vegetation covered fields. J. Geophys. Res. 87, 11229–11237. doi: 10.1029/JC087iC13p11229
Njoku, E. G., Aschroft, P., Chan, T. K., and Li, L. (2005). Global survey and statistics of radio-frequency interference in AMSR-E land observations. IEEE Trans. Geosci. Remote Sens. 43, 938–947. doi: 10.1109/TGRS.2004.837507
Njoku, E. G., Jackson, T. J., Lakshmi, V., Chan, T. K., and Nghiem, S. V. (2003). Soil moisture retrieval from AMSR-E. IEEE Trans. Geosci. Remote Sens. 41, 215–229. doi: 10.1109/TGRS.2002.808243
Njoku, E. G., and Li, L. (1999). Retrieval of land surface parameters using passive microwave measurements at 6–18 GHz. IEEE Trans. Geosci. Remote Sens. 37, 79–93. doi: 10.1109/36.739125
Owe, M., de Jeu, R., and Walker, J. (2001). A methodology for surface soil moisture and vegetation optical depth retrieval using the microwave polarization difference index. IEEE Trans. Geosci. Remote Sens. 39, 1643–1654. doi: 10.1109/36.942542
Paloscia, S., Macelloni, G., and Santi, E. (2006). Soil moisture estimates from AMSR-E brightness temperatures by using a dual-frequency algorithm. IEEE Trans. Geosci. Remote Sens. 44, 3135–3144. doi: 10.1109/TGRS.2006.881714
Paloscia, S., and Pampaloni, P. (1988). Microwave polarization index for monitoring vegetation growth. IEEE Trans. Geosci. Remote Sens. 26, 617-621. doi: 10.1109/36.7687
Santi, E. (2010). An application of SFIM technique to enhance the spatial resolution of microwave radiometers. Int. J. Remote Sens. 31, 2419–2428. doi: 10.1080/01431160903005725
Santi, E., Pettinato, S., Brogioni, M., Macelloni, G., Montomoli, F., Paloscia, S., et al. (2010). A pre-operational algorithm for the retrieval of snow depth and soil moisture from AMSR-E data. IEEE Int. Geosci. Remote Sens. Symp. 3777–3780. doi: 10.1109/IGARSS.2010.5652009
Santi, E., Pettinato, S., Paloscia, S., Pampaloni, P., Macelloni, G., and Brogioni, M. (2012). An algorithm for generating soil moisture and snow depth maps from microwave spaceborne radiometers: HydroAlgo. Hydrol. Earth Syst. Sci. 16, 3659–3676. doi: 10.5194/hess-16-3659-2012
Shibata, A., Imaoka, K., and Koike, T. (2003). AMSR/AMSR-E level 2 and 3 algorithm developments and data validation plans of NASDA. IEEE Trans. Geosci. Remote Sens. 41, 195–203. doi: 10.1109/TGRS.2002.808320
Shimoda, H. (2009). “Global change observation mission,” in IEEE International Geoscience and Remote Sensing Symposium. Vol. 5, (Cape Town), 228–231.
Smith, A. B., Walker, J. P., Western, A. W., Young, R. I., Ellett, K. M., Pipunic, R. C., et al. (2012). The Murrumbidgee soil moisture monitoring network data set. Water Resour. Res. 48:W07701. doi: 10.1029/2012WR011976
Wang, J. R., and Schmugge, T. J. (1980). An empirical model for the complex dielectric permittivity of soils as a function of water content. IEEE Trans. Geosci. Remote Sens. 18, 288–295. doi: 10.1109/TGRS.1980.350304
Wen, J., Jackson, T. J., Bindlish, R., Hsu, A. Y., and Su, Z. B. (2005). Retrieval of soil moisture and vegetation water content using SSM/I data over a corn and soybean region. J. Hydrometeorol. 6, 854–863. doi: 10.1175/JHM462.1
Keywords: AMSR-E, microwave emission, soil moisture, validation, inversion algorithms
Citation: Paloscia S, Santi E, Pettinato S, Mladenova I, Jackson T, Bindlish R and Cosh M (2015) A comparison between two algorithms for the retrieval of soil moisture using AMSR-E data. Front. Earth Sci. 3:16. doi: 10.3389/feart.2015.00016
Received: 28 October 2014; Accepted: 02 April 2015;
Published: 21 April 2015.
Edited by:
Venkat Lakshmi, University of South Carolina, USAReviewed by:
Tugrul Yilmaz, Middle East Technical University, TurkeyBin Fang, University of South Carolina, USA
Copyright © 2015 Paloscia, Santi, Pettinato, Mladenova, Jackson, Bindlish and Cosh. This is an open-access article distributed under the terms of the Creative Commons Attribution License (CC BY). The use, distribution or reproduction in other forums is permitted, provided the original author(s) or licensor are credited and that the original publication in this journal is cited, in accordance with accepted academic practice. No use, distribution or reproduction is permitted which does not comply with these terms.
*Correspondence: Simonetta Paloscia, Depth of Earth Observation, IFAC-CNR, Via Madonna del Piano, 10, 50019 Sesto Fiorentino, Firenze, Italy s.paloscia@ifac.cnr.it