Low temperature magnetic properties of the Late Archean Boolgeeda iron formation (Hamersley Group, Western Australia): environmental implications
 Julie Carlut1*
  Aude Isambert1
  Hélène Bouquerel1
  Ernesto Pecoits1 Pascal Philippot1 Emmanuelle Vennin2 Magali Ader1
  Christophe Thomazo2 Jean-François Buoncristiani2 Frank Baton1 Elodie Muller1 Damien Deldicque3
- 1Institut de Physique du Globe de Paris, Universite Paris Diderot, Sorbonne Paris Cite, UMR 7154 Centre National de la Recherche Scientifique, Paris, France
- 2UMR, Centre National de la Recherche Scientifique 6282 Biogéosciences, Université de Bourgogne, Dijon, France
- 3Ecole Normale Supérieure - Géologie, UMR8538, Paris, France
The origin of the iron oxides in Archean and Paleoproterozoic Banded Iron Formations (BIFs) is still a debated question. We report low and high temperature magnetic properties, susceptibility and saturation magnetization results joined with scanning microscope observations within a 35 m section of the Late Archean Boolgeeda Iron Formation of the Hamersley Group, Western Australia. With the exception of two volcanoclastic intervals characterized by low susceptibility and magnetization, nearly pure magnetite is identified as the main magnetic carrier in all iron-rich layers including hematite-rich jasper beds. Two populations of magnetically distinct magnetites are reported from a 2 m-thick interval within the section. Each population shows a specific Verwey transition temperature: one around 120–124 K and the other in the range of 105–110 K. This temperature difference is interpreted to reflect two distinct stoichiometry and likely two episodes of crystallization. The 120–124K transition is attributed to nearly pure stoichiometric magnetite, SEM and microprobe observations suggest that the lower temperature transition is related to chemically impure silician magnetite. Microbial-induced partial substitution of iron by silicon is suggested here. This is supported by an increase in Total Organic Carbon (TOC) in the same interval.
Introduction
Banded Iron Formations (BIFs) are massive to layered chemical sedimentary rocks composed of silica, at least 15% iron oxides (hematite, Fe2O3 and magnetite, Fe3O4) and minor Fe-bearing carbonate and chlorite. These rocks are emblematic of the Archean and Paleoproterozoic eons (Trendall and Blockey, 1970; Ewers and Morris, 1981; Bekker et al., 2010). The association between BIFs and free oxygen derived from oxygenic photosynthesis has long been recognized (Cloud, 1973). More recent models have considered oxidation under anoxic conditions via anoxygenic Fe(II)-oxidizing photosynthesis (Konhauser et al., 2002; Kappler et al., 2005), UV photo-oxidation (Braterman et al., 1983; Konhauser et al., 2007) and atmospherically produced hydrogen peroxide (Pecoits et al., 2015). The former is regarded as the most likely mechanism responsible for Archean BIFs, before the Great Oxidation Event (GOE), i.e., at a time when the Earth's atmosphere and oceans remained essentially anoxic.
The crystallization process of iron oxides in these sedimentary rocks is still debated. It is generally accepted that iron oxides in BIFs derived from the oxidation of solubilized Fe(II) into iron hydroxide precursors (Fe(OH)3) (e.g., Ewers and Morris, 1981). Ahn and Buseck (1990) provided evidences that some of the nano hematites present in a 2.5 Ga BIF section of the Marra Mamba Iron Formation were most likely the result of direct dehydration of colloidal iron hydroxide particles. This suggests that colloidal transport and deposition may be involved in BIFs formation. However, such observations have not been duplicated. The crystallization of magnetite is even less clear, so that magnetite is generally regarded as non-primary and driven by post-depositional, likely biologically generated, ferric iron reduction (Li et al., 2011, 2013).
Few paleomagnetic studies have been dedicated to BIFs (but see Chamalaun and Dempsey, 1978; Schmidt and Clark, 1994; Sumita et al., 2001; Tompkins and Cowan, 2001). Most of these studies are focused on remanence analysis and measurements of the anisotropy of magnetic susceptibility. Rock magnetic property variations linked to changes in concentration and composition of iron oxides in BIFs remained largely unexplored. The Hamersley Basin in Western Australia contains large deposits of BIFs that encompasse the Archean-Proterozoic transition. This basin, therefore, is an ideal location to unravel the paleoenvironmental conditions attending one of the most critical periods in Earth history, namely the rise of atmospheric oxygen. In this study, we present rock-magnetic measurements performed on a 35 m thick section of the Boolgeeda Iron Formation of the Hamersley Group, Western Australia. The content in magnetite was constrained using susceptibility and saturation magnetization. In addition, low temperature magnetic properties allowed detecting small changes in the stoichiometry and composition of magnetite. This in turn was used to constrain the environmental conditions associated with deposition of the Boolgeeda Iron Formation. Specifically, magnetite undergoes a low-temperature transformation, called the Verwey transition, at a given temperature (Tv) and transforms from cubic (T > Tv) to monoclinic (T < Tv) symmetry. This transformation, related to changes in crystal symmetry and cation ordering, is accompanied by changes in magnetic properties. When magnetite is heated through Tv its magnetic remanence decreases while its susceptibility increases, both sharply (e.g., Verwey et al., 1947; Özdemir et al, 1993; Muxworthy and McClelland, 2000; Novák et al., 2000). The Tv temperature depends on variables of interest including stoichiometry, cation substitution or grain size. Increasing amounts of cation vacancy or substitution decrease the Verwey temperature from ~122 K until a threshold around 80 K (Moskowitz, 1993; Jackson et al., 2011). Low temperature properties are thus an interesting way to derive bulk properties from a population of magnetite and Tv is widely used for identification of magnetite in natural samples. Low temperature analyses performed here allowed to report the coexistence of two distinct Verwey transitions within a 2 m thick sedimentary section of the Boolgeeda Iron Formation. The possible causes and environmental significance of this specific occurrence are discussed.
Geological Setting and Sampling Strategy
The Boolgeeda Iron Formation consists of deep to shallow iron-rich marine sedimentary successions deposited at the top of the Hamersley Group in the southern Pilbara Craton, Western Australia (Figure 1; Trendall, 1979; Hickman and Van Kranendonk, 2012). The formation overlies the Woongarra Rhyolite (Barley et al., 1997) and is conformably overlain by the Kungarra Formation, which constitues the base of the Turee Creek Group. The age of deposition is not well constrained and lies between 2450 ± 3 Ma, obtained for the Woongarra Rhyolite, and 2209 ± 15 Ma obtained on the unconformably overlying Cheela Spring's basalts (Barley et al., 1997; Martin et al., 1998; Trendall et al., 2004; Müller et al., 2005). The samples investigated in this study come from TCDP-1, one of the three drill cores of the Turee Creek Drilling Project collected in May 2013. TCDP-1 intersects the transition between the Boolgeeda Iron Formation and the overlying Kungarra Formation. Our study focuses on the upper part of the Boolgeeda Iron Formation, near the transition with the Kungarra Formation. The samples were collected at regular intervals between 163.25 and 130.4 m depth. This sedimentary section is composed mainly of dark, iron-rich strata (typical BIFs), interlayered with red, silica-rich, jasper layers (Figure 1). It is cut by volcanoclastic layers around 153 and 146 m depth. The jasper layers occur mostly in the intervals 165–156, 152–149, and 132–130 m depth (Figure 1).
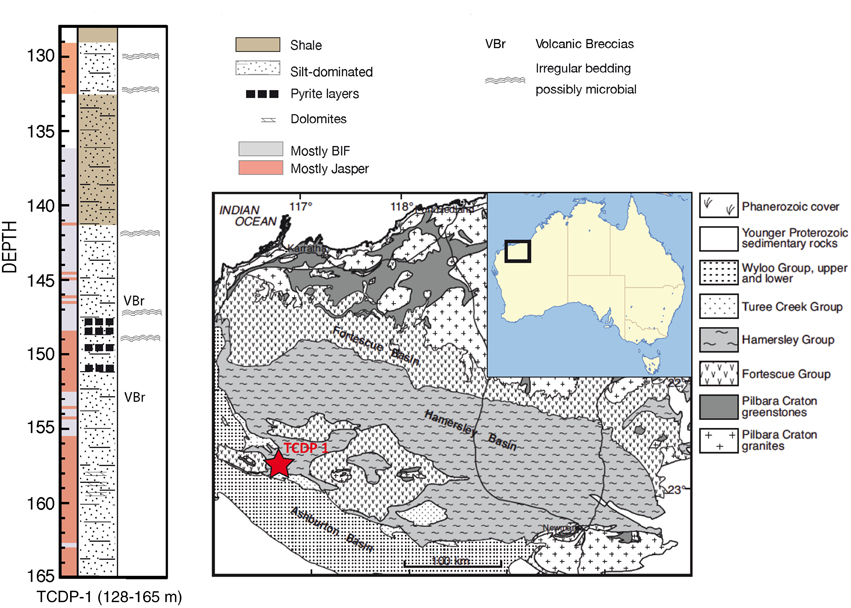
Figure 1. Regional geological map of the Pilbara area in Northwest Australia (after van Kranendonk et al., 2015) and simplified lithology of the TCDP-1 core between 128 and 165 m depth. The red star localizes the drilling.
Methods
Susceptibility and saturation magnetization were measured on small sub samples using an AGICO™ KLY-3 and a Princeton Measurements™ micromag Vibrating Sample Magnetometer (VSM) at IPGP. Thermomagnetic measurements of low-field magnetic susceptibility (κ) at low and high temperature were performed on powdered bulk samples at the IPGP using the AGICO™ KLY-3 coupled to a CS-3 apparatus. In the low-temperature experiments, samples were cooled until ~ 77 K using liquid nitrogen, then κ was monitored during warming up to room temperature. In the high-temperature experiments κ was measured during a heating-cooling cycle from room temperature up to 620°C in air.
Field Cooled (FC) and Zero Field Cooled (ZFC) remanence measurements were carried out on ~3 × 3 × 3 mm3 bulk rock fragments using a Quantum Designs™ superconducting device Magnetic Properties Measurement System (SQUID MPMS) at IPGP. In both cases, the moment was measured as the sample was progressively warmed from 10 to 300 K in a 0 T field. ZFC data were obtained after the samples were previously cooled from 300 to 10 K in a 0 T field, at 10K a 2.5 T field is rapidly applied then quenched. FC data were obtained after the samples were cooled in a 2.5 T field. Warming to 300 K was proceeded in 5 K steps. In a few cases a 1 K step was used in the 80–140 K range for the ZFC in order to have a detailed curve around Tv. Then during Room-Temperature Saturation Isothermal Remanent Magnetization (RT-SIRM) cycle, a 2.5 T SIRM was given at room temperature, the samples was then cooled in a zero field down to 10 K, and warmed back to room temperature.
The first derivative of the susceptibility data (for KLY-3 measurements) and the ZFC curves (for MPMS measurements) were calculated. Tv was defined as the maximum of the derivative curve of susceptibility (κ) or moment (M) with respect to temperature (T). For each sample measured using the MPMS apparatus, we calculated the normalized decrease in magnetization (δzfc) at the Verwey transition defined as δzfc = (M80K - M150K)/M80K, with M the magnetic moment during ZFC cycle at 80 or 150 K (following Moskowitz, 1993 and Carporzen et al., 2006). In the case of two Verwey transitions the relative percentage of each fraction is defined by fv1 = (M80K – M(Tv1+Tv2)/2)/(M80K - M150K) and fv2 = (M(Tv1+Tv2)/2 - M150K)/(M80K - M150K).
Microscopic observations and semi-quantitative chemical data were collected on 9 thin sections using 2 field emission scanning electronic microscope (Fe-SEM, Zeiss Sigma and Zeiss Auriga) equipped with EDS detectors (Oxford instrument) at École Normale Supérieure de Paris (ENS, Paris) and IPGP, respectively. Observations were made in Back Scattered mode (BSE).
More than 50 analyses were performed on selected magnetite crystals from one of the thin section using a CAMECA SX100 electron microprobe at CAMPARIS, CNRS, Paris, France. Mineral standards used for calibration were diopside (for Mg, Si, and Ca), manganese titanate (for Mn and Ti), hematite (for Fe) and chromium oxide (for Cr). A 15 keV energy, 20 nA current, and 2 μm spot size was used. Acquisition time was 10 s per element.
A total of 31 samples were powdered to a size smaller than 60 μm using a ring and puck mill at the Biogéosciences Laboratory of the Université de Bourgogne in Dijon, France. They were decarbonated using HCl, rinsed until neutral and dried at 60°C. Aliquots of dried decarbonated samples (27–333 mg) were weighed in tin capsules. TOC content and δ13Corg measurements were performed on the capsules using a flash elemental analyser (Thermo Scientific™) coupled in continuous flow mode to a Finnigan DELTA plus XP stable isotope ratio mass spectrometer at the stable isotope geochemistry lab of the Institut de Physique du Globe de Paris, France. The TOC content is expressed as a dry weight percentage of the total fraction; external reproducibility based on triplicate analyses of dried decarbonated samples is better than ± 0.0043 wt.% (1σ). The carbon isotopic composition is expressed in delta notation and reported in parts per thousand (‰) relative to the Vienna Pee Dee Belemnite (VPDB) standard; external reproducibility is better than ± 0.25‰ (1s).
Results
SEM Observations and Oxides Characterization
Two polished thin sections of jasper located at 130.45 and 159.30 m depth were investigated in detail. The jasper is characterized by alternating red and gray microscopic layers, darker blackish layers are sometimes noticeable (Figure 2A). SEM observations show that the matrix is mostly composed of quartz. Carbonate (ankerite) is locally present (Figures 2B,D). Within the red layers, aggregates of euhedral to rounded hematite grains around 1 μm in size occur as randomly dispersed patches of a few tens of microns (Figures 2B,D,E,F). These hematite patches occur in association with cubic magnetite grains around 5–10 μm, and thin needles of Fe-carbonate identified as siderite (see Figure 2E). The organization of the hematite patches is compatible with phenocryst ghosts of a few μ m and could be the result of the replacement of a primary phase by microcrystalline quartz and iron oxides. The darker blackish layers (Figures 2A,C) are characterized by a quartz matrix with a dense population of large cubic iron oxides grains a few tens to several hundreds microns in size. The gray sub layers are mostly composed of quartz with occasional iron oxides and ankerite (Figures 2A,B).
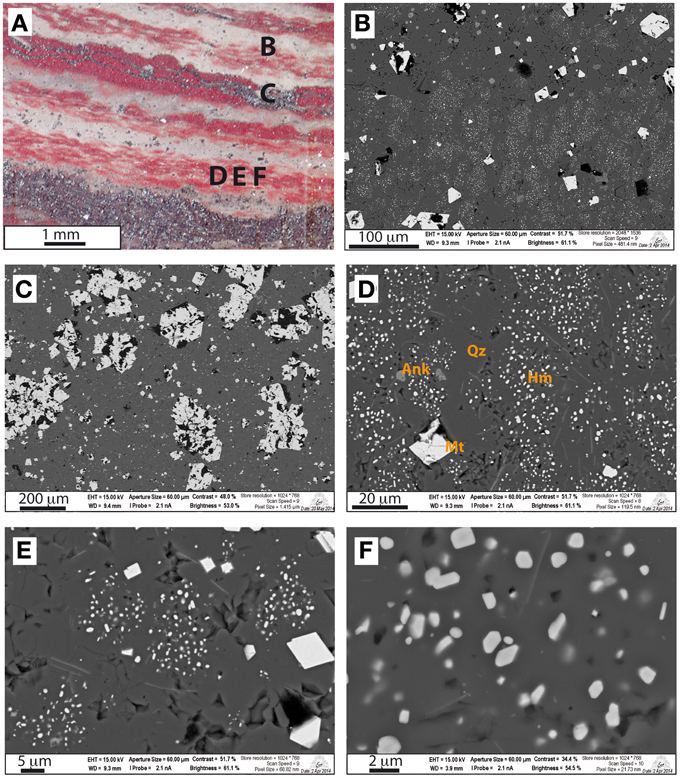
Figure 2. Optical and SEM representative images of iron oxides for sample 130.45. (A) optical microscope image with indications of the area observed with the SEM; (B) SEM image at the transition between gray and red areas; (C) bulky iron oxides within the white gray area interpreted as being magnetite; (D) patches of small euhedral to rounded iron oxide grains interpreted as hematite in the red layers, Qz, quartz; Ank, ankerite; Mt, magnetite; Hm, hematite; (E) small iron oxide grains, interpreted as hematite with bigger grains population interpreted as magnetite and (F) high magnification image of small hematite grains.
Three thin sections of a more cherty material collected at 146.70, 150.17, and 152.86 m depth were investigated using SEM technique (Figure 3). The chert layers are mainly composed of quartz, phyllosilicate and ankerite. Occasional rutile associated with ilmenite and zircon of possible volcanic origin were observed in samples 146.70 and 152.86 (Figures 3A,B). Ilmenite locally displays visible stages of growth probably linked to their volcanic origin (Figure 3A arrows). Sample 150.17 (Figures 3C,D) shows a marked layered structure characterized by iron oxide- and/or pyrite-rich layers alternating with quartz-rich layers. Ankerite is observed often in close association with pyrite and iron oxide.
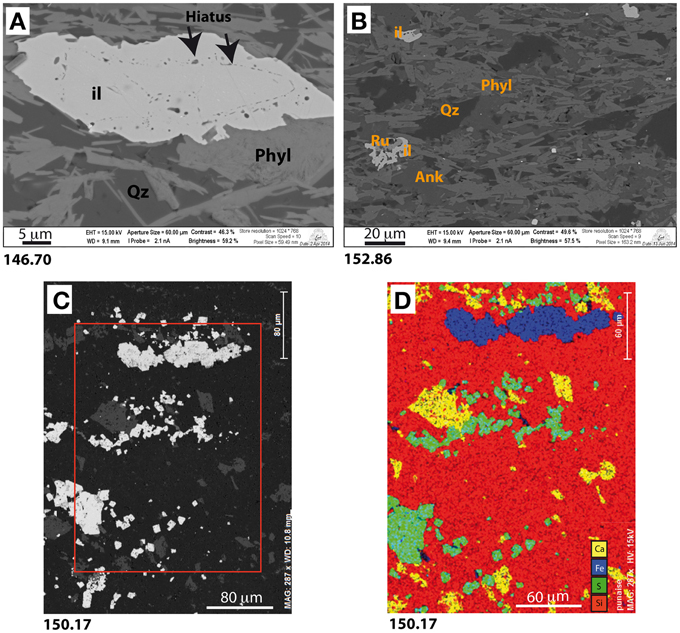
Figure 3. SEM images and Si, S, Fe, Ca elements mapping of textures observed in sample (A) 146.70, (B) 152.86, and (C) 150.17; (D) mapping of the area delimited by the red rectangle in (C). Iron oxides and/or pyrites-rich alternating with quartz-rich layers are observed.
BIF layers were observed at 148.02, 148.08, 148.15 (Figure 4) and 159.29 m depth. In all thin sections we observed a millimeter-scale layering structure composed of alternating quartz and ankerite rich layer and iron oxides rich layers (Figure 4A). The iron-rich layers show densely packed euhedral magnetites, often larger than 100 μm in size (Figures 4B,C). Cherty carbonate and silicate rich zones are observed surrounding the BIF layers. These zones contain also titanium-rich oxides, apatite, zircon, pyrite and occasional metallic alloys. Titanium rich oxides sometimes present a core with exsolved ilmenite and magnetite lamellae (Figure 4D). These observations are typical of subaerial volcanism and probably attest for the transport of volcanic particles at the deposition site. Different tuning in the BSE mode with brightness and contrast distributed on magnetite revealed that samples 148.02 and 148.15 contained magnetite displaying density contrasts (Figures 4E). These were not observed in sample 159.29. Semi-quantitative compositional analysis revealed that the brighter magnetite domains of samples 148.02 and 148.15 correspond to low Si content (Si less than 0.5% in atom%), whereas the darker domains are associated with high Si content (with Si around 2% in atom%). Compositional maps made in different parts of the samples confirm the role of Si in the density contrasts (Figure 4F).
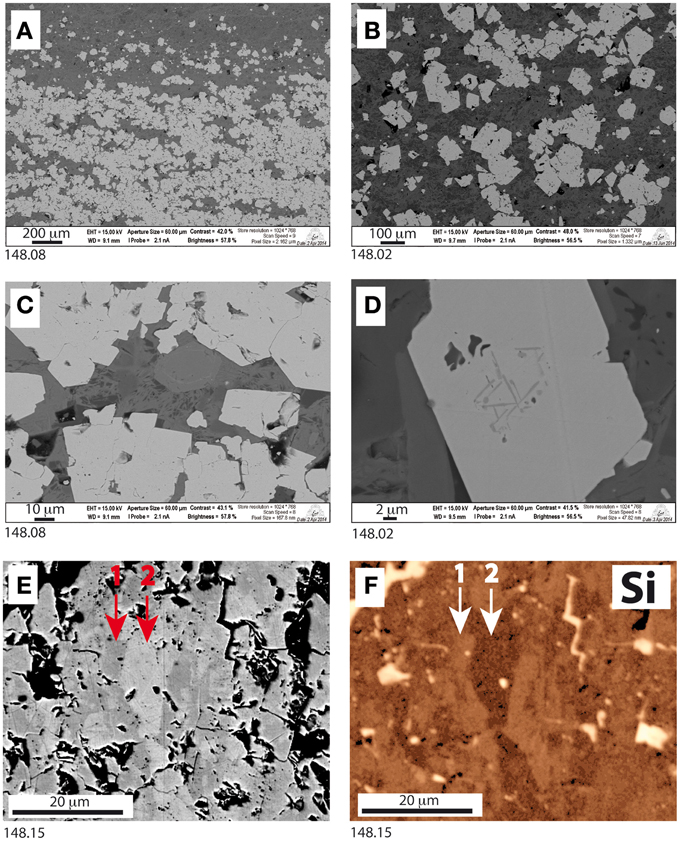
Figure 4. SEM images and elements mapping in samples 148.08 (A,C), 148.02 (B,D) and 148.15 (E,F). (A,B): low magnification images of BIF layers in 148.08 and 148.02. (C) BIF layers in 148.08 at high magnification showing close packed magnetite crystals. (D): high magnification image of an iron oxide crystal in the cherty part of 148.02 showing lamellar exsolutions in an iron-titanium oxide. (E) Back-scattered electron image of a magnetite crystal in 148.15 with tuned brightness and contrast and (F) corresponding EDX Si elemental mapping. The arrows indicate 2 areas of different compositions (1: Si-rich magnetite and 2: Si-low magnetite).
Electron Microprobe Analysis
Chemical analyses performed on more than 50 oxides within the BIF layers of sample 148.02 yielded a stoichiometry compatible with magnetite with the addition of minor silicon (Figure 5). The FeO content varies between 91 and 94 wt% (Fe3O4 between 98 and 100.5 wt%) and the SiO2 content between 0.5 and 2 wt%. Owing to the relatively large interaction volume of the electron beam, we failed to distinguish the two magnetite populations identified with the SEM. However, the systematic detection of Si in magnetite suggests that silicon is intrinsic of the mineral structure and not due to a contamination by microquartz inclusions. This is inferred following two lines of evidence, first, none of the other phases that were analyzed (pyrite, ilmenite, carbonate) show Si, and ultra high magnification investigations using the SEM confirmed that the magnetites are devoid of SiO2 inclusions. Although nano-inclusions cannot be completely ruled out we believe that silicon is a part of the crystalline structure of magnetite as a substitute for iron. This observation is in agreement with previous studies reporting the occurrecne of silician magnetite in BIFs from the Hamersley group (Huberty et al., 2012).
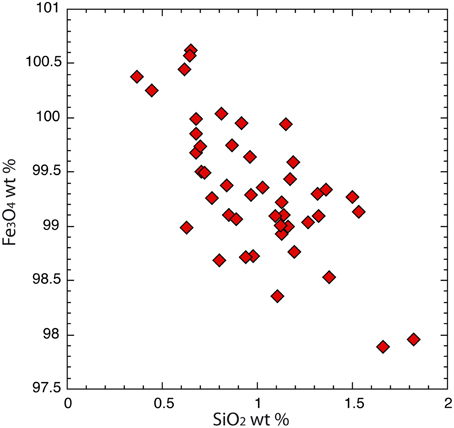
Figure 5. Fe3O4 and SiO2 concentrations (in wt%) from microprobe analyses performed on more than 50 magnetite crystals in the BIF layers of sample 148.02.
Organic Carbon Content and Isotopic Composition
With the exception of one sample displaying 720 ppm of Total Organic Carbon (TOC) all samples show TOC values between 30 and 346 ppm (Table 1). Such low contents fall within the low range of Precambrian sedimentary rocks, but are typical, although on the high end, of BIFs (Yamaguchi, 2002). The δ13Corg values range from −22.4 to −30‰, which is typical for organic matter derived from photosynthetic organisms (Thomazo et al., 2009) (Table 1). The sample with a TOC level of 720 ppm presents one of the most negative δ13Corg value (−29.6‰). Neither TOC nor δ13Corg values show increasing or decreasing trends along the section, indicating an overall stable depositional environment over the time scale covered by the section. However, both TOC and δ13Corg present apparently noisy small-scale variations and show a rough trend of decreasing δ13Corg with increasing TOC. This trend is typical of Precambrian sedimentary rocks and commonly explained as indicating a higher proportion of organic matter with more negative δ13Corg values issued from secondary productivity [chemosynthesis or methanotrophy e.g., Thomazo et al., 2009 and ref therein; Figures 2–20 in Yamaguchi (2002)].
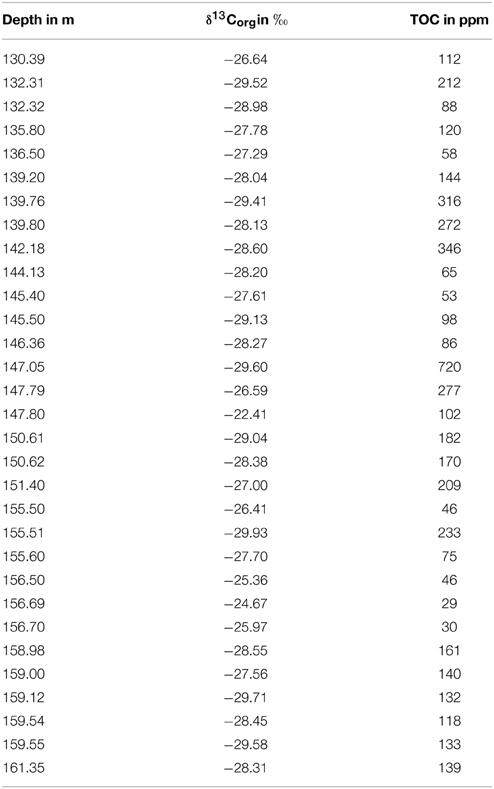
Table 1. δ13Corg and Total Organic Carbon (TOC) data for TCDP-1 from 130.39 to 161.35 m depth.
Susceptibility and Saturation Magnetization
Mass normalized susceptibility (χ) ranges from 1 × 10⁻⁸ to 5.7 × 10⁻⁴ m3/kg. Saturation magnetization (Ms) ranges from 4 × 10⁻³ to 74 Am2/kg (Table 2). Variations in χ and Ms are closely inter-correlated and show a strong dependence with lithology. Specifically, jasper layers have a mean Ms around 5.5 Am2/kg and BIFs around 40 Am2/kg (Table 2). The lower values are found for samples at 146.7 and 152.86 m depth, corresponding to volcanic breccias rich in ilmenite.
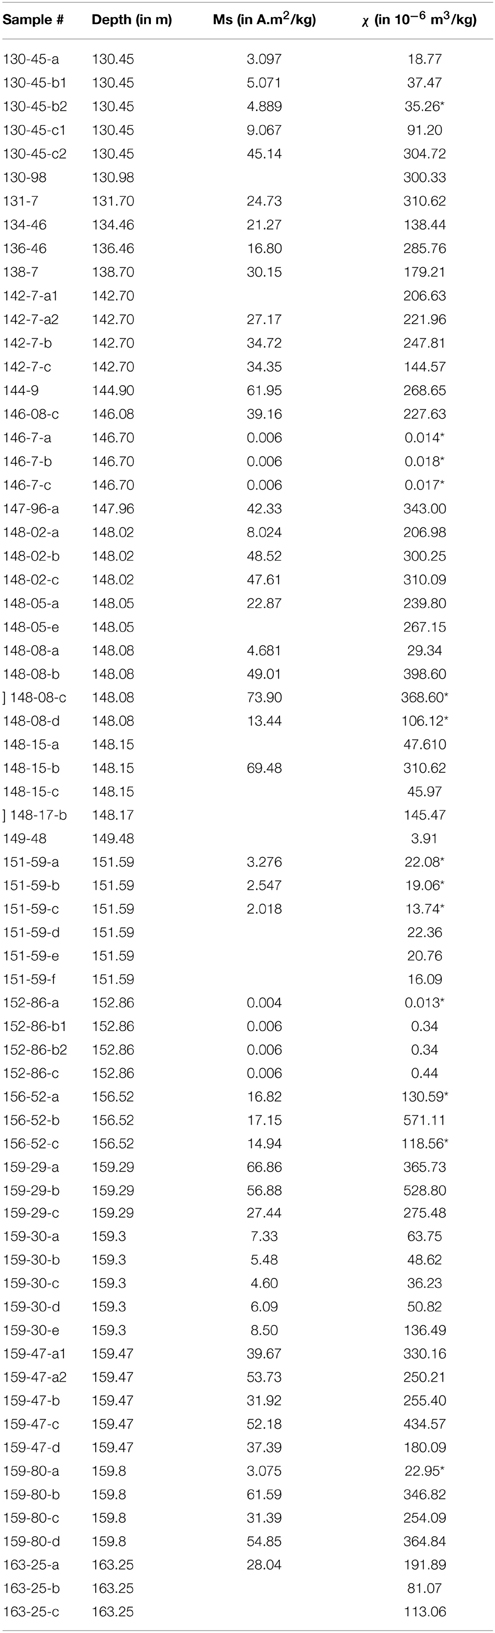
Table 2. Saturation magnetization Ms and susceptibility χ data for TCDP-1 from 130.45 to 163.25 m depth, susceptibility results are obtained using the KLY-3 except data with * obtained using the VSM.
Low Temperature Remanence
Low temperature remanence analyses were performed on 20 powdered sub-samples of a few tens of mg for 10 bulk samples (130.45, 146.70, 148.02, 148.08, 151.59, 152.86, 156.52, 159.29, 159.30, and 159.80) using the SQUID MPMS. In all cases, except for samples 146.70 and 152.86, which both have a low and noisy signal without clear transition, data show a strong Verwey transition around 110–120 K indicative of magnetite (Figure 6). In all samples the ZFC magnetization is always larger than the FC magnetization, the RLT value define as Mfc(20 K)/Mzfc(20 K) (Smirnov, 2009) is between 0.62 and 0.73. These are characteristics of large multi domain magnetite (Brachfeld et al., 2002; Smirnov, 2009). The Morin transition, around 262 K (Morrish, 1994), is characteristic of hematite and is only faintly detected in the RT-SIRM cycle in sample 130.45 and 159.30 (Figure 6A). This is likely due to the weak remanence signal of hematite compared to magnetite. Experiments were often noisy due to electrical instability, but in most cases, the first derivative of ZFC curves could be calculated and the Tv temperature derived (defined as the temperature corresponding to the peak in the derivative; Figures 6B,D). One peak of variable thickness is determined around 120 K in all samples with sufficient signal except for samples 148.02 and 148.08, where two distinct peaks are observable. This feature leads to the determination of two distinct Tv: a low Tv around 105–110 K and a high Tv around 122–124 K (Figure 6D). These two temperatures reflect two different magnetite populations coexisting in these samples. The δzfc parameter allows an estimation of the loss of remanence between 80 K and 150 K: all samples display high values, between 0.93 and 0.99. The δfc/δzfc ratio clusters around 1 for all samples (between 0.99 and 1.03) and again indicates large grain sizes. For the samples showing two Verwey transitions, the relative contribution of each population to the loss of remanence can be roughly established by calculating fv1 and fv2 as described in the method section. Samples 148.02 and 148.08 show a loss of signal of about 70% and 55 to 75% respectively, carried by the low temperature fraction (Figure 6C).
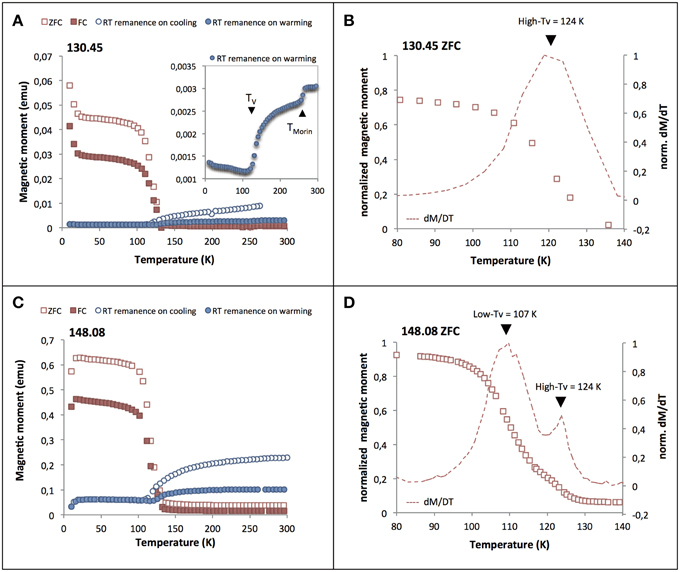
Figure 6. Low-temperature remanence cycles of 130.45 (A) and 148.08 (C) samples. The inset in (A) shows the RT remanence measurement with the Morin transition of hematite around 260 K. (B,D): ZFC curves and corresponding first derivative normalized to maximum value. ZFC measurement has been performed with a 1 K step for 148.08. Arrows show peaks in derivative curve corresponding to Tv(130.45: 1 peak corresponding to 1 Tv (High-Tv), 148.08: 2 peaks corresponding to 2 Tv (Low-Tv and High-Tv)).
Low Temperature Susceptibility Curves
To extend the range of samples characterization at low temperature we performed series of low temperature, low field susceptibility measurements on more than 25 samples. A comparison between Verwey temperature derived from the MPMS ZFC curves and κ(t) measurements is shown in Figure 7. Results are quite similar and no systematic offset is observed giving confidence in Tv determined using susceptibility. Typical selected results of low temperature susceptibilities are shown in Figure 8. As for the remanence measurements, most samples show a strong Verwey transition characterized by a sharp increase in susceptibility starting around 115–120 K. However, samples belonging to the interval 146.08–148.17 m depth have two distinct Verwey temperatures. For all the samples outside this range only one peak with varying width can be clearly identified (see Figure 8).
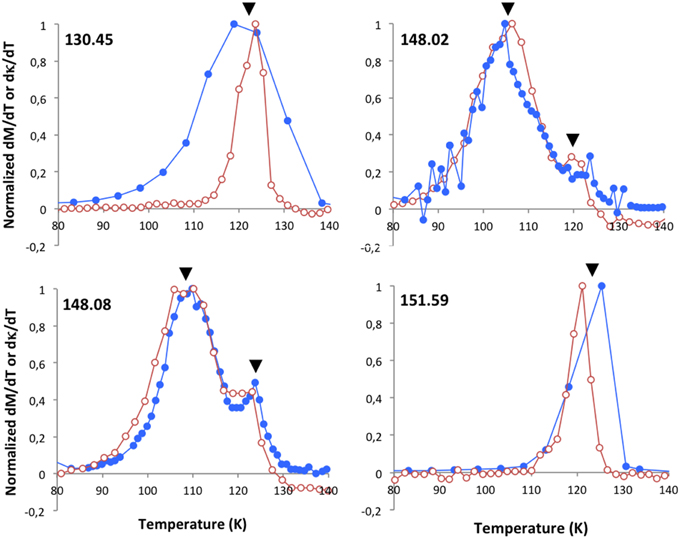
Figure 7. Comparison of normalized derivative curves of low-temperature thermomagnetic measurements for samples 130.45, 148.02, 148.08, and 151.59 (plain circles: ZFC-derivative, empty circles: susceptibility-derivative). Arrows correspond to temperature of Verwey transition: 1 Tv for samples 130.45 and 151.59, 2 Tv for samples 148.02 and 148.08. The noise in 148.02 data is due to electrical problems during MPMS measurements.
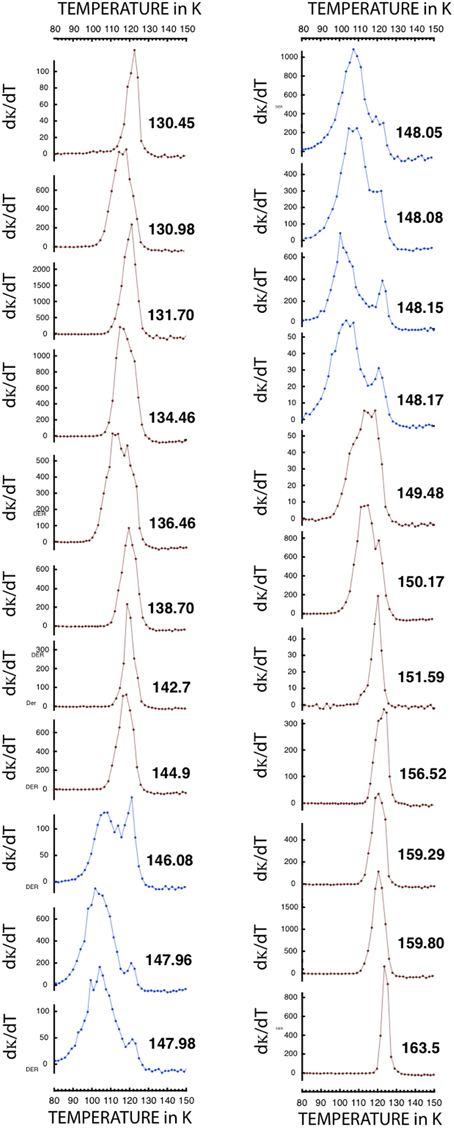
Figure 8. Comparison of derivative curves of representative low-temperature susceptibility curves between 130.45 and 163.5 m depth. Red curves: 1 Tv, blue curves: ‘2 Tv interval’ between 146.08 and 148.17 where 2 peaks are clearly observed.
In order to check the stability of the two Verwey transitions toward heating, the magnetic susceptibility of three samples (148.02, 148.08, and 148.15) was monitored during a four steps cycle including: low temperature measurements, heating and cooling from 20 until 630°C in air (samples 148.02 and 148.08) or argon atmosphere (sample 148.15), followed by a new low temperature measurement step (Figures 9A–C). No significant difference was found between the low temperature measurements before and after heating, the two Tv show the same characteristics (Figures 9D–F). This indicates that the double transition is resistant to heating at least at the time scale of our experiment.
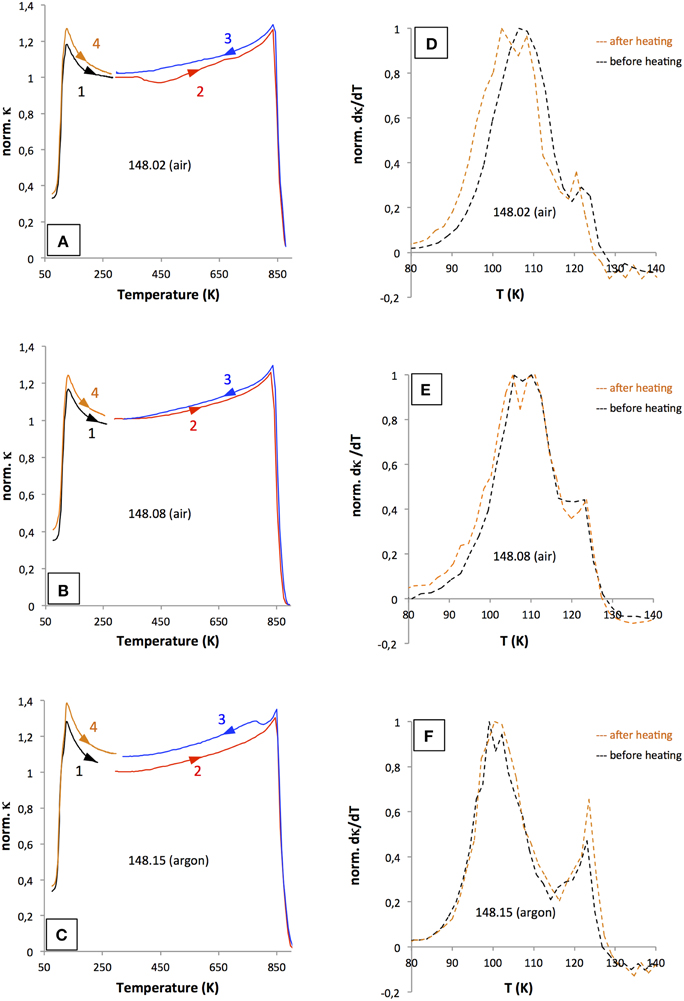
Figure 9. Temperature dependent susceptibility for 148.02 (A), 148.08 (B), and (C) 148.15 experiments performed in air or in argon (data normalized to the room temperature value before heating). Step 1: low temperature measurement from 77 K to RT, step 2: heating from RT to 900 K, step 3: cooling from 900 K to RT and step 4: repeated low temperature measurement, (D–F) are the corresponding derivative curves for steps 1 and 4.
Discussion
Iron Oxides Composition
Except for samples 146.70 and 152.86, the strong Verwey transition found in all samples attests to the ubiquitous presence of magnetite throughout the studied stratigraphic section. To investigate this further, the relation between Ms and the concentration and type of iron oxides (magnetite vs hematite) is used. Pure magnetite has Ms = 92 A.m2/kg whereas pure hematite has Ms = 0.4 Am2/kg (e.g., O'Reilly, 1984). Thus, all values above 0.4 Am2/kg clearly indicate that magnetite is present (in addition to possible hematite). The Ms results (Table 2 and Figure 10A) show that magnetite is widespread in all samples, including jasper layers, as attested by values in the 3–10 Am2/kg range. Unsurprisingly, the highest Ms values were recorded in BIF layers (Ms between 9 and 74 Am2/kg, Table 2). Such high values indicate that in some ssamples magnetite can represent up to 80% of the sample mass.
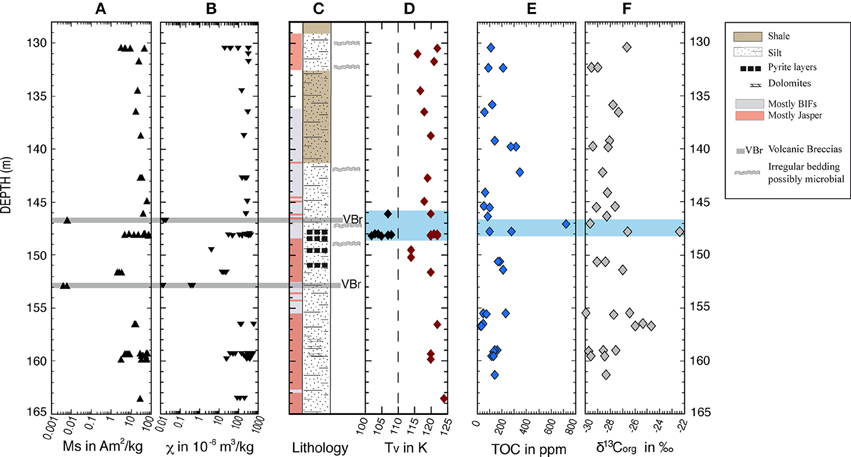
Figure 10. Magnetic parameters, simplified lithology, TOC and δ13Corg results and as a function of depth: (A) saturation magnetization Ms; (B) Mass normalized susceptibility; (C) lithology; (D) Verwey Temperature; (E) Total Organic Carbon (TOC) and (F) δ13Corg. Gray area in (A–C) indicates volcanic breccias; blue area in (D) underlines the two Tv interval and anomalous TOC and δ13Corg in (E,F).
The two samples 146.70 and 152.86 displaying the lowest Ms and χ values are associated with the absence of Verwey transition and correspond to volcanoclastic layers (Figures 10B,C). SEM observations indicate that iron oxides within these layers have a high titanium content. No magnetite is reported in these layers.
The Two Verwey Transitions
The high temperature (~120K) Verwey transition is characteristic of a pure, nearly stoichiometric population of magnetite, while the low temperature (~105K) Verwey transition is attributed to non-stoichiometric magnetite (Moskowitz, 1993). Non-stoichiometry can be due to partial oxidation and/or partial substitution within crystals. The 146.08–148.17 m depth interval is characterized by two populations of both stoichiometric and -non-stoichiometric magnetite (Figures 8, 10D). This unique and specific interval will be referred as the “2 Tv interval” in the following. Such observation is seldom reported in the literature (Liu et al., 2004; Carporzen et al., 2006; Mang and Kontny, 2013) and was interpreted so far as the magnetic signature of two populations with rather different distributions of grain sizes. The favored mechanism proposed for producing the two Tv was a differential oxidation state, the smaller magnetite populations being more prone to oxidation than the larger one (e.g., Mang and Kontny, 2013). Under oxidative conditions magnetite transforms gradually to its oxidized form maghemite. The presence of non-stoichiometric maghemite induces a decrease in Verwey temperature. However, this scenario is unlikely in our samples. Indeed, upon heating in air, maghemite reverses to magnetite (Dunlop and Özdemir, 1997). Thus if a part of the magnetite population in our samples is maghemitized, heating the sample in air or in argon will result in changes in the oxidation state and hence changes in the low-Tv transition. As shown in Figure 9, the high temperature susceptibility curves do not reveal significant maghemitization phenomenon (usually characterized by non-reversibility) and more importantly, the two Verwey transitions remained unchanged after heating. The partial oxidation of a part of the magnetite population is thus not our favored hypothesis for the low Tv.
Both low temperature remanence and low temperature susceptibility measurements were performed on two samples showing the double transition. The two selected samples 148.02 and 148.08 show a loss of remanence signal of about 70% and 55 to 75%, respectively (Figure 6C), while the increase in susceptibility is on the order of 90% for both samples. Both remanence and susceptibility show an important transition around the 105–110 K. This indicates that the non-stoichiometric magnetite represents a significant amount of the total population in these samples, as shown by the amplitude of the corresponding peak (Figures 6–9). The magnetite grain population responsible for the low-Tv is therefore likely to be rather common. Even at the highest magnification (e.g., as in Figure 2E or Figure 4D) the SEM images did not reveal systematic population of fine grain oxides except in the jasper layers where it is attributed to hematite. Hence, even if sometimes spotted, the smaller oxide grains (typically around 1 μm and less) represent a marginal volume compared to the ubiquitous bulky sub-millimeter magnetite grain and can hardly be responsible for the low-Tv.
Verwey Transitions and Lithology
Different lithologies are represented in the 2 Tv interval (Figures 10C,D), suggesting that the double Verwey transition does not depend on lithology. This interval includes indeed laminated cherts (in 146.08, 147.98, 148.08, 148.15, and 148.17), jasper layers (in 148.05 and 148.15) and typical BIF layers, (in 147.96, 147.98, 148.02, and 148.08). Assuming that a specific lithology represents a period during which conditions of precipitation were reasonably stable (Ewers and Morris, 1981) our results indicate that the occurrence of the two magnetite populations is largely independent of precipitation conditions. This phenomenon must then be related to a post-deposition process, pervasive through 2 m of sedimentary stratigraphic interval and having a strong influence on the crystallization of magnetite.
The Effect of Substitution
As we discarded oxidation as the main cause for the lower Tv we must turn to partial subsitution. The effect of cation substitution occurring in octahedral sites in magnetite (Fe3−xXxO4where X = Ti, Al, Zn,..) has already been studied by several authors (Miyahara, 1972; Kozłowski et al., 1996a,b). A decrease in the Verwey temperature is reported, by about 1° per tenth of a percent metal cation. During SEM observations volcanic particles were reported in some thin, centimeter scale, layers. Titanomagnetite (Fe3−xTixO4) is detected in these layers but always with a broad range of titanium content, clustering around x = 0.6. Such high titanium concentration is quite enough to totally suppress the Verwey transition (Kakol et al., 1992; Kozłowski et al., 1996a). The high titanium content and very localized layers where these iron oxides are observed make this phase a poor candidate for the low Tv. Silicon was faintly detected within most magnetite analyzed by EDX during our SEM observations. With brightness and contrast distributed specifically on magnetite, zonation patterns were highlighted in some bulky magnetites. An associated contrast in silicon content is evidenced using EDX elemental mapping. This feature was observed only in samples within the 2 Tv interval (Figures 4E,F). Microprobe measurements performed on a thin section at 148.02 m depth confirmed this finding (Figure 5) and up to 2% of SiO2 was measured at some site, silicon was the only cation detected in magnetite in addition to iron. This result is consistent with previous studies showing the presence of silician magnetite in BIFs, in particular from the Dales Gorge Member of the Hamersley Group (Huberty et al., 2012). Using very detailed microprobe analysis but also TEM observations Huberty et al. (2012) reported silician magnetite overgrowths containing up to 3% wt SiO2 over low-Si magnetite (less than 1 wt% SiO2). Our microprobe data did not allow the observation of such a marked compositional difference but SEM element map (Figure 4F) show textures compatible with Huberty et al. (2012) observations. Silicon represents thus a serious candidate for substitution and could explain the low Verwey transition. An underlying question appears now: why is silician magnetite restricted to a 2 m interval at the top of the Boolgeeda Iron formation?
Environmental Implications
Samples with two Verwey temperatures were reported in the Vredefort impact crater (South Africa) by Carporzen et al. (2006 and 2012) and within the Chesapeake Bay impact structure, (USA) by Mang and Kontny (2013). The authors attributed the low temperature Tv to a post impact population of magnetite with different stoechiometry that crystallized from melt pocket within planar deformation features and alteration halos during the impact event at 2.02 Ga. Vredefort is the oldest documented impact craters on Earth. The impact record for older times is largely incomplete. However, seven spherule layers, attesting for very large impacts on Earth, were found in distinct locations around the Archean-Proterozoic boundary (Simonson et al., 2009). No evidence of impact related features was found in our samples such as planar deformation features or amorphization phenomenon (Stöffler and Langenhorst, 1994; Koeberl, 2006), microfractures or increasing concentrations of siderophile platinum-group elements (Ru, Rh, Pd, Os, Ir, and Pt). Thus, TCDP-1 samples do not support the interpretation of a shock related origin of the two magnetite populations. Alternatively, lightning-induced partial melting and recrystallization of magnetite has been advocated as a potential mechanism for the unusual rock magnetic properties recorded in the Vredefort rocks (Carporzen et al., 2012). As the Boolgeeda section was formed below the storm-wave base and shows no sign of subaerial exposure, it is difficult to envision a 2.4 Ga lightning strike as a possible cause of our peculiar rock magnetite property. More recent lightning strikes are not considered plausible either as the section was buried and samples are taken from cored material.
In modern environments the occurrence of high organic matter intervals (as the sapropels in the Mediterranean area) induces dramatic changes in iron oxides bearing sediments during post depositional processes. Intense bacterial activity fueled by organic matter causes downward migration of reducing fronts, which change the redox state of previously deposited layers. Dissolution of iron oxides is a common phenomenon but in some cases population of small magnetites can also be formed at depth at paleo-oxidation fronts after re-oxygenation of the overlying layers (e.g., Larrasoaña et al., 2003; Drab et al., 2015). In these layers the occurrence of magnetite is thus in relation with microbiological cycles.
A biological origin of magnetite in BIFs is strongly suggested based on modeling of the iron cycle (Konhauser et al., 2005; Koehler et al., 2010), iron isotope composition (Johnson et al., 2003) and experimental data (Li et al., 2013). Following Huberty et al. (2012) the occurrence of silician magnetite is linked to excess in organic carbon. Silician magnetite may thus be an interesting potential biomarker. Within the 2 Tv layer, and immediately below, irregular peloids organized in dome-shaped structures and locally recrystallized are observed (Figure 10C). These sedimentary structures are interpreted as hallmark of microbial activities. In addition we observed some small scale variability in TOC and δ13Corg along the section (Figures 10E,F), these variations are probably related to depositional conditions. However, within the 2 m interval where the two populations of magnetite are found, a higher bulk TOC value, which clearly stands out from the range of other data, is measured as well as rather low δ13Corg values (Figures 10E,F). These observations can be interpreted as indicating both a more productive and hence reducing depositional environments. Despite the absence of a large scale trend the small-scale extreme variations observed in TOC and δ13Corg in the 2 Tv interval as well as the observation of dome-shaped peloids are interpreted as indicators of an enhancement in microbial activity in the depositional environment around 148 m depth. Our results suggest that crystallization of silician magnetite, whether it occurs immediately post deposition or at a latter stage, is controlled by organic carbon.
Conclusions
The magnetic mineralogy of a 35 m section composed mainly of BIF and jasper layers at the top of the Boolgeeda Iron Formation and onset of the GOE was studied. Magnetite is ubiquitous in the section, even in the hematite-rich jasper layers. The occurrence of two Verwey temperatures, within a 2 m high interval, indicates that two distinct magnetite populations with different stoichiometry coexist. Silician magnetite is clearly observed by SEM and confirmed by microprobe analyses. Peculiar sedimentary structures and higher TOC values suggest more important organic matter deposition and intense microbial activity at the same location. On the basis of these observations we propose that the occurrence of a secondary silicon-rich magnetite population is responsible for the low Verwey transition temperature and that the crystallization of this phase could be linked to biological activity. Although additional experimental studies under controlled conditions are required to test this hypothesis, at this stage, however, low temperature magnetic measurements appear to be a valuable tool to unravel the occurrence of microbial activity in banded iron formations.
Conflict of Interest Statement
The authors declare that the research was conducted in the absence of any commercial or financial relationships that could be construed as a potential conflict of interest.
Acknowledgments
We are grateful for the detailed and constructive comments provided by the two reviewers and fast handling of the paper by the editors. We thank Mike Jackson and France Lagroix for interesting discussions about the “double Verwey transition,” Stephan Borensztajn for help with the SEM analyses, Marc Quintin for making the thin sections and the Institut de Physique du Globe de Paris (IPGP), the Geological Survey of Western Australia (GSWA), for supporting the Turee Creek Drilling Project. This work was supported by the Labex UnivEarths program of Sorbonne Paris Cité (ANR-10-LABX-0023 and ANR-11-IDEX-0005-02). This is IPGP contribution 3624.
References
Ahn, J. H., and Buseck, P. R. (1990). Hematite nanospheres of possible colloidal origin from a Precambrian banded iron formation. Science 250, 111–113. doi: 10.1126/science.250.4977.111
Barley, M. E., Pickard, A. L., and Sylvester, P. J. (1997). Emplacement of a large igneous province as a possible cause of banded iron formation 2.45 billion years ago. Nature 385, 55–58. doi: 10.1038/385055a0
Bekker, A., Slack, J. F., Planavsky, N., KrapeŽ, B., Hofmann, A., Konhauser, K. O., et al. (2010). Iron formation: the sedimentary product of a complex interplay among mantle, tectonic, oceanic, and biospheric processes. Econ. Geol. 105, 467–508. doi: 10.2113/gsecongeo.105.3.467
Brachfeld, S. A., Banerjee, S. K., Guyodo, Y., and Acton, G. D. (2002). A 13 200 year history of century to millennial-scale paleoenvironmental change magnetically recorded in the Palmer Deep, western Antarctic Peninsula. Earth Planet. Sci. Lett. 194, 311–326. doi: 10.1016/S0012-821X(01)00567-2
Braterman, P. S., Cairns-Smith, A. G., and Sloper, R. W. (1983). Photo-oxidation of hydrated Fe2+; significance for banded iron formations. Nature 303, 163–164. doi: 10.1038/303163a0
Carporzen, L., Gilder, S. A., and Hart, R. J. (2006). Origin and implications of two Verwey transitions in the basement rocks of the Vredefort meteorite crater, South Africa. Earth Planet. Sci. Lett. 251, 305–317. doi: 10.1016/j.epsl.2006.09.013
Carporzen, L., Weiss, B. P., Gilder, S. A., Pommier, A., and Hart, R. J. (2012). Lightning remagnetization of the Vredefort impact crater: no evidence for impact-generated magnetic fields. J. Geophys. Res. Planets 117:E01007. doi: 10.1029/2011JE003919
Chamalaun, F. H., and Dempsey, C. E. (1978). Palaeomagnetism of the Gawler Range Volcanics and implications for the genesis of the middleback hematite orebodies. J. Geol. Soc. Aust. 25, 255–265. doi: 10.1080/00167617808729034
Cloud, P. (1973). Paleoecological Significance of the Banded Iron-Formation. Econ. Geol. 68, 1135–1143. doi: 10.2113/gsecongeo.68.7.1135
Drab, L., Carlut, J., Hubert-Ferrari, A., Martinez, P., LePoint, G., and El Ouahabi, M. (2015). Paleomagnetic and geochemical record from cores from the Sea of Marmara, Turkey: age constraints and implications of sapropelic deposition on early diagenesis. Mar. Geol. 360, 40–54. doi: 10.1016/j.margeo.2014.12.002
Dunlop, D., and Özdemir, Ö. (1997). Rock Magnetism Fundamentals and Frontiers (New York, London, Cambridge: Cambridge University Press), 573p.
Ewers, W. E., and Morris, R. C. (1981). Studies of the Dales Gorge Member of the Brockman Iron Formation, Western Australia. Econ. Geol. 76, 1929–1953. doi: 10.2113/gsecongeo.76.7.1929
Hickman, A. H., and Van Kranendonk, M. J. (2012). Early Earth evolution: evidence from the 3.5-1.8 Ga geological history of the Pilbara region of Western Australia. Episodes 35, 283.
Huberty, J. M., Konishi, H., Heck, P. R., Fournelle, J. H., Valley, J. W., and Xu, H. (2012). Silician magnetite from the Dales Gorge Member of the Brockman Iron Formation, Hamersley Group, Western Australia. Am. Mineral. 97, 26–37. doi: 10.2138/am.2012.3864
Jackson, M., Moskowitz, B., and Bowles, J. (2011). The magnetite Verwey transition. IRM Q. 20, 1–11.
Johnson, C. M., Beard, B. L., Beukes, N. J., Klein, C., and O'Leary, J. M. (2003). Ancient geochemical cycling in the Earth as inferred from Fe isotope studies of banded iron formations from the Transvaal Craton. Contrib. Mineral. Petrol. 144, 523–547. doi: 10.1007/s00410-002-0418-x
Ka,kol, Z., Sabol, J., Stickler, J., and Honig, J. M. (1992). Effect of low-level titanium(IV) doping on the resistivity of magnetite near the Verwey transition. Phys. Rev. B 46, 1975–1978. doi: 10.1103/PhysRevB.46.1975
Kappler, A., Pasquero, C., Konhauser, K. O., and Newman, D. K. (2005). Deposition of banded iron formations by anoxygenic phototrophic Fe(II)-oxidizing bacteria. Geology 33, 865–868. doi: 10.1130/G21658.1
Koeberl, C. (2006). The record of impact processes on the early Earth: a review of the first 2.5 billion years. Geol. Soc. Am. Spec. Pap. 405, 1–22. doi: 10.1130/2006.2405(01)
Koehler, I., Konhauser, K., and Kappler, A. (2010). “Role of microorganisms in banded iron formations,” in Geomicrobiology: Molecular and Environmental Perspective, eds L. L. Barton, M. Mandl, and A. Loy (Springer), 309–324. Available online at: http://dx.doi.org/10.1007/978-90-481-9204-5_14
Konhauser, K., Newman, D., and Kappler, A. (2005). The potential significance of microbial Fe (III) reduction during deposition of Precambrian banded iron formations. Geobiology 3, 167–177. doi: 10.1111/j.1472-4669.2005.00055.x
Konhauser, K. O., Amskold, L., Lalonde, S. V., Posth, N. R., Kappler, A., and Anbar, A. (2007). Decoupling photochemical Fe(II) oxidation from shallow-water BIF deposition. Earth Planet. Sci. Lett. 258, 87–100. doi: 10.1016/j.epsl.2007.03.026
Konhauser, K. O., Hamade, T., Raiswell, R., Morris, R. C., Ferris, F. G., Southam, G., et al. (2002). Could bacteria have formed the Precambrian banded iron formations? Geology 30, 1079–1082. doi: 10.1130/0091-7613(2002)030<1079:CBHFTP>2.0.CO;2
Kozłowski, A., Metcalf, P., Kąkol, Z., and Honig, J. M. (1996a). Electrical and magnetic properties of Fe3-zAlzO4(z <0.06). Phys. Rev. B 53, 15113–15118. doi: 10.1103/PhysRevB.53.15113
Kozłowski, A., Metcalf, P., Kakol, Z., and Honig, J. M. (1996b). Electrical transport and magnetization measurements of Fe3-zAlzO4, z < 0.06. J. Magn. Magn. Mater. 157–158, 415–416. doi: 10.1016/0304-8853(95)01217-6
Larrasoaña, J. C., Roberts, A. P., Stoner, J. S., Richter, C., and Wehausen, R. (2003). A new proxy for bottom-water ventilation in the eastern Mediterranean based on diagenetically controlled magnetic properties of sapropel-bearing sediments. Palaeogeogr. Palaeoclimatol. Palaeoecol. 190, 221–242. doi: 10.1016/S0031-0182(02)00607-7
Li, Y.-L., Konhauser, K. O., Cole, D. R., and Phelps, T. J. (2011). Mineral ecophysiological data provide growing evidence for microbial activity in banded-iron formations. Geology 39, 707–710. doi: 10.1130/G32003.1
Li, Y.-L., Konhauser, K. O., Kappler, A., and Hao, X.-L. (2013). Experimental low-grade alteration of biogenic magnetite indicates microbial involvement in generation of banded iron formations. Earth Planet. Sci. Lett. 361, 229–237. doi: 10.1016/j.epsl.2012.10.025
Liu, Q., Banerjee, S. K., Jackson, M. J., Chen, F., Pan, Y., and Zhu, R. (2004). Determining the climatic boundary between the Chinese loess and palaeosol: evidence from aeolian coarse-grained magnetite. Geophys. J. Int. 156, 267–274. doi: 10.1111/j.1365-246X.2003.02148.x
Mang, C., and Kontny, A. (2013). Origin of two Verwey transitions in different generations of magnetite from the Chesapeake Bay impact structure, USA. J. Geophys. Res. Solid Earth 118, 2012JB009973. doi: 10.1002/jgrb.50291
Martin, D. M., Li, Z. X., Nemchin, A. A., and Powell, C. M. (1998). A pre-2.2 Ga age for giant hematite ores of the Hamersley Province, Australia? Econ. Geol. 93, 1084–1090. doi: 10.2113/gsecongeo.93.7.1084
Miyahara, Y. (1972). Impurity effects on the transition temperature of magnetite. J. Phys. Soc. Jpn. 32, 629–634. doi: 10.1143/JPSJ.32.629
Morrish, A. H. (1994). Canted Antiferromagnetism: Hematite. Singapore: World Scientific. Available online at: http://www.worldscientific.com/doi/pdf/10.1142/9789812831569_fmatter (Accessed March 3, 2015).
Moskowitz, B. M. (1993). Micromagnetic study of the influence of crystal defects on coercivity in magnetite. J. Geophys. Res. Solid Earth 98, 18011–18026. doi: 10.1029/93JB01719
Müller, S. G., KrapeŽ, B., Barley, M. E., and Fletcher, I. R. (2005). Giant iron-ore deposits of the Hamersley province related to the breakup of Paleoproterozoic Australia: New insights from in situ SHRIMP dating of baddeleyite from mafic intrusions. Geology 33, 577–580. doi: 10.1130/G21482.1
Muxworthy, A. R., and McClelland, E. (2000). Review of the low-temperature magnetic properties of magnetite from a rock magnetic perspective. Geophys. J. Int. 140, 101–114. doi: 10.1046/j.1365-246x.2000.00999.x
Novák, P., Štìpánková, H., Englich, J., Kohout, J., and Brabers, V. A. M. (2000). NMR in magnetite below and around the Verwey transition. Phys. Rev. B 61, 1256–1260. doi: 10.1103/PhysRevB.61.1256
Özdemir, Ö., Dunlop, D. J., and Moskowitz, B. M. (1993). The effect of oxidation on the Verwey transition in magnetite. Geophys. Res. Lett. 20, 1671–1674. doi: 10.1029/93GL01483
Pecoits, E., Smith, M. L., Catling, D. C., Philippot, P., Kappler, A., and Konhauser, K. O. (2015). Atmospheric hydrogen peroxide and Eoarchean iron formations. Geobiology 13, 1–14. doi: 10.1111/gbi.12116
Schmidt, P. W., and Clark, D. A. (1994). Palaeomagnetism and magnetic anisotropy of Proterozoic banded-iron formations and iron ores of the Hamersley Basin, Western Australia. Precambrian Res. 69, 133–155. doi: 10.1016/0301-9268(94)90083-3
Simonson, B. M., McDonald, I., Shukolyukov, A., Koeberl, C., Reimold, W. U., and Lugmair, G. W. (2009). Geochemistry of 2.63–2.49 Ga impact spherule layers and implications for stratigraphic correlations and impact processes. Precambrian Res. 175, 51–76. doi: 10.1016/j.precamres.2009.08.004
Smirnov, A. V. (2009). Grain size dependence of low-temperature remanent magnetization in natural and synthetic magnetite: experimental study. Earth Planets Space 61, 119–124. doi: 10.1186/BF03352891
Stöffler, D., and Langenhorst, F. (1994). Shock metamorphism of quartz in nature and experiment: I. Basic observation and theory. Meteoritics 29, 155–181. doi: 10.1111/j.1945-5100.1994.tb00670.x
Sumita, I., Hatakeyama, T., Yoshihara, A., and Hamano, Y. (2001). Paleomagnetism of late Archean rocks of Hamersley basin, Western Australia and the paleointensity at early Proterozoic. Phys. Earth Planet. Inter. 128, 223–241. doi: 10.1016/S0031-9201(01)00288-6
Thomazo, C., Pinti, D. L., Busigny, V., Ader, M., Hashizume, K., and Philippot, P. (2009). Biological activity and the Earth's surface evolution: insights from carbon, sulfur, nitrogen and iron stable isotopes in the rock record. C. R. Palevol 8, 665–678. doi: 10.1016/j.crpv.2009.02.003
Tompkins, L. A., and Cowan, D. R. (2001). Opaque mineralogy and magnetic properties of selected banded iron-formations, Hamersley Basin, Western Australia. Aust. J. Earth Sci. 48, 427–437. doi: 10.1046/j.1440-0952.2001.00869.x
Trendall, A. (1979). A revision of the Mount Bruce Supergroup. Geol. Surv. West. Aust. Annu. Rep. 1978, 63–71.
Trendall, A. F., and Blockey, J. (1970). The Iron Formations of the Precambrian Hamersley Group, Western Australia with Special Reference to the Associated Crocidolite. Perth, WA: Geological Survey of Western Australia.
Trendall, A. F., Compston, W., Nelson, D. R., De Laeter, J. R., and Bennett, V. C. (2004). SHRIMP zircon ages constraining the depositional chronology of the Hamersley Group, Western Australia. Aust. J. Earth Sci. 51, 621–644. doi: 10.1111/j.1400-0952.2004.01082.x
van Kranendonk, M. J., Mazumder, R., Yamaguchi, K. E., Yamada, K., and Ikehara, M. (2015). Sedimentology of the Paleoproterozoic Kungarra Formation, Turee Creek Group, Western Australia: a conformable record of the transition from early to modern Earth. Precambrian Res. 256, 314–343. doi: 10.1016/j.precamres.2014.09.015
Verwey, E. J., Haayman, P. W., and Romeijn, F. C. (1947). Physical properties and cation arrangement of oxides with spinel Structures II. Electron. Conductivity. J. Chem. Phys. 15, 181–187. doi: 10.1063/1.1746466
Yamaguchi, K. (2002). Geochemistry of Archean–Paleoproterozoic Black Shales: The Early Evolution of the Atmosphere, Oceans, and Biosphere. Available online at: https://etda.libraries.psu.edu/paper/5920/1187 (Accessed April 11, 2015).
Keywords: rock magnetism, Verwey transition, banded iron formation, Archean, great oxidation event, Hamersley group, magnetite
Citation: Carlut J, Isambert A, Bouquerel H, Pecoits E, Philippot P, Vennin E, Ader M, Thomazo C, Buoncristiani J-F, Baton F, Muller E and Deldicque D (2015) Low temperature magnetic properties of the Late Archean Boolgeeda iron formation (Hamersley Group, Western Australia): environmental implications. Front. Earth Sci. 3:18. doi: 10.3389/feart.2015.00018
Received: 25 February 2015; Accepted: 23 April 2015;
Published: 18 May 2015.
Edited by:
Eric Font, University of Lisbon, PortugalReviewed by:
Juan Cruz Larrasoaña, Instituto Geológico y Minero de España, SpainPedro Silva, Instituto Superior de Engenharia de Lisboa, Portugal
Copyright © 2015 Carlut, Isambert, Bouquerel, Pecoits, Philippot, Vennin, Ader, Thomazo, Buoncristiani, Baton, Muller and Deldicque. This is an open-access article distributed under the terms of the Creative Commons Attribution License (CC BY). The use, distribution or reproduction in other forums is permitted, provided the original author(s) or licensor are credited and that the original publication in this journal is cited, in accordance with accepted academic practice. No use, distribution or reproduction is permitted which does not comply with these terms.
*Correspondence: Julie Carlut, Institut de Physique du Globe de Paris, Universite Paris Diderot, Sorbonne Paris Cite, UMR 7154 Centre National de la Recherche Scientifique, 1 rue Jussieu, F-75238 Paris Cedex 05, France, jcarlut@yahoo.fr