Mantle superplumes induce geomagnetic superchrons
 Peter Olson
 Hagay Amit
- 1Department of Earth and Planetary Sciences, Johns Hopkins University, Baltimore, MD, USA
- 2Laboratoire de Planétologie et de Géodynamique, Centre National de la Recherche Scientifique UMR 6112, Université de Nantes, Nantes, France
We use polarity reversal systematics from numerical dynamos to quantify the hypothesis that the modulation of geomagnetic reversal frequency, including geomagnetic superchrons, results from changes in core heat flux related to growth and partial collapse of the two seismically-imaged lower mantle superplumes. We parameterize the reversal frequency sensitivity from numerical dynamos in terms of average core heat flux normalized by the difference between the present-day core heat flux and the core heat flux at geomagnetic superchron onset. A low-order polynomial fit to the 0–300 Ma Geomagnetic Polarity Time Scale (GPTS) reveals that a decrease in core heat flux relative to present-day of ~30% can account for the Cretaceous Normal Polarity and Kiaman Reverse Polarity Superchrons, whereas the hyper-reversing periods in the Jurassic require a core heat flux equal to or higher than present-day. Possible links between GPTS transitions, large igneous provinces (LIPs), and the two lower mantle superplumes are explored. Lower mantle superplume growth and collapse induce GPTS transitions by increasing and decreasing core heat flux, respectively. Age clusters of major LIPs postdate transitions from hyper-reversing to superchron geodynamo states by 30–60 Myr, suggesting that superchron onset may be contemporaneous with LIP-forming instabilities produced during collapses of lower mantle superplumes.
1. Introduction
The geomagnetic field has reversed polarity ~1 thousand times within the Phanerozoic (Gradstein et al., 2012) and there is evidence for polarity reversals throughout the Proterozoic (Pavlov and Gallet, 2010) as well as in the late Archean (Layer et al., 1996). Individual polarity reversals tend to be irregularly spaced in time, so that short sequences of reversals often conform to Poisson statistics (Lhuillier et al., 2013). However, longer sequences of geomagnetic reversals typically show large departures from random behavior (Olson et al., 2014). Departures from randomness are best illustrated by the stable polarity superchrons (typically lasting 25–40 Myr, compared to the Phanerozoic average chron length of around 0.5 Myr), the time interval between superchrons (150–200 Myr in the Phanerozoic) and the progressive increase in reversal frequency since the end of the Cretaceous Normal Polarity Superchron (Gallet and Hulot, 1997). It is precisely this combination of short-term randomness and long-term order that makes the Geomagnetic Polarity Time Scale (GPTS) a powerful tool for absolute dating.
The geomagnetic reversal record is also a history of the activity of the geodynamo, and the same properties that make it an absolute time scale challenge our understanding of how the geodynamo works. Unlike the regular reversals of the solar dynamo, there is no well-defined characteristic time interval between geomagnetic reversals. Furthermore, there is no known relationship between the length of a polarity chron (defined here as the time between successive geomagnetic reversals) and the time scales intrinsic to the dynamics of the core. In particular, the convective overturn time in the outer core defined as τu = D∕U, where D is the outer core thickness and U is the rms core fluid velocity, is about 150 years (Amit and Olson, 2004) and the dipole free decay time τd is of order 40 kyr, so that during an average polarity chron there are roughly 10 dipole free decay times and several thousand convective overturns of the outer core. During the 83–125 Ma Cretaceous Normal Polarity Superchron (CNS) there were about thousand dipole decay times and several hundred thousand convective overturns of the outer core. Clearly, all vestiges of the last geomagnetic reversal were lost from the core long before that superchron came to an end.
The difference between time scales of GPTS variability and the time scales that characterize core dynamics has led to the hypothesis that mantle circulation controls the long-term reversal history of the geodynamo (Glatzmaier et al., 1999; Kutzner and Christensen, 2004; Courtillot and Olson, 2007; Driscoll and Olson, 2011; Pétrélis et al., 2011). This hypothesis is attractive from a physical perspective, since the very existence of a strong, long-lived geomagnetic field presupposes a high rate of heat extraction from the core by the mantle, which almost certainly has varied with time.
Current estimates place the present-day total core-mantle boundary (CMB) heat flux in the range 10–16 TW (Lay et al., 2008; Wu et al., 2011), equivalent to 25–35% of the total mantle heat flux (Jaupart et al., 2007). Mantle heat transport is mostly advective, carried by the global-scale circulation associated with surface plate motions and by smaller scale motions such as thermal plumes (Schubert et al., 2001). Both of these elements of the mantle circulation affect the geodynamo by regulating the heat flux on the CMB, and are variable on time scales commensurate with the geomagnetic superchrons and their spacing. Phanerozoic examples of this variability include the change in mantle flow associated with the aggregation and breakup of supercontinent Pangaea (Zhang et al., 2010) and the Cretaceous pulse in Large Igneous Province (LIP) activity (Larson, 1991). It seems logical, therefore, that a record of the variable mantle heat transport is encoded in the GPTS.
However, cracking this code has proven difficult, in part because of nagging discrepancies between observations and theory. It has been demonstrated using numerical dynamos that increased CMB heat flux makes polarity reversals more likely, and conversely, decreased CMB heat flux reduces their frequency (Olson and Amit, 2014), particularly if CMB heat flux is reduced at low latitudes (Heimpel and Evans, 2013). Mantle global circulation models (Zhang and Zhong, 2011) predict reduced CMB heat flux during the Kiaman Reverse Polarity Superchron (KRS), otherwise known as the Permo-Carboniferous Reverse Polarity Superchron (PCRS). Dynamo models yield non-reversing behavior during this time (Olson et al., 2013), consistent with the above picture, but the opposite situation evidently prevailed during the CNS, when plate tectonic reconstructions show increased sea floor production rates (Muller et al., 2008) and mantle global circulation models indicate an increase in average CMB heat flux relative to the present-day (Zhang and Zhong, 2011).
In this paper we attempt to reconcile this discrepancy. First we derive a simplified linear relationship between the frequency of polarity reversals and core heat flux, based on the systematics of reversing numerical dynamos in which the outer boundary heat flux includes a rotated spherical harmonic degree 2 and order 0 pattern that models the present-day long wavelength heterogeneity in the lowermost mantle. We then link changes in CMB heat flux to growth and partial collapse of the two superplume structures. We use idealized models to show that, during superplume collapses, CMB heat flux and reversal frequency both diminish, and we propose that LIP-forming thermal instabilities are generated along the margins of each superplume at these times. Finally, we argue that the observed time lag between the decreases in reversal frequency that preceded the CNS and the ages of major Cretaceous and Cenozoic LIPs are broadly consistent with our hypothesized sequence of events, as is the uplift history of the African continent.
2. Lower Mantle Superplumes and CMB Heat Flux
Seismic tomographic images of the lower mantle (Dziewonski et al., 2010) reveal two large, low shear wave velocity provinces (called LLSVPs) in the D"-region above the CMB, one presently located below Africa and surrounding oceans, the other below the South Pacific. In this paper, these two LLSVPs are referred to as “superplumes” or “piles” for simplicity, although the term “superplume roots” is actually more appropriate, because these structures are located at the base of larger mantle anomalies and are thought to be stabilized by negative buoyancy due to compositional differences with respect to the rest of the lower mantle (Lekic et al., 2012). Hotspot reconstructions indicate that the two LLSVPs have existed in the lower mantle since the breakup of supercontinent Pangaea and possibly earlier (Burke et al., 2008; Torsvik et al., 2008).
Laboratory experiments and numerical simulations on the mechanics of a dense compositional layer at the base of a thermally convecting, temperature-dependent viscous fluid show a range of dynamical structures that are analogous to superplumes and the LLSVPs in the lower mantle (McNamara and Zhong, 2005; Davaille, 2007). The morphology and time variability of these structures depend on their buoyancy number, defined as = ΔρC∕ΔρT, where ΔρC is the stabilizing compositional density excess of the basal layer and ΔρT is the destabilizing thermal density anomaly associated with the convection. Laboratory experiments (Le Bars and Davaille, 2004) reveal that, near the critical buoyancy ratio crit ≃ 0.4, these superplume structures exhibit a pulsating behavior, including growth, stagnation, and collapse phases. Calculations by Zhang et al. (2010) reveal that long-term survival of mantle LLSVPs requires a compositional density excess of ΔρC = 83 kg m−3 or more. Assuming that a thermal density anomaly of ΔρT = 210 kg m−3 is needed to build the LLSVPs (Olson et al., 2015) implies that ≥ 0.4 for mantle survival, the same as the critical value.
Other laboratory experiments (Olson and Kincaid, 1991) show that the compositionally dense basal layer (analogous to the D"-layer in the mantle) is swept into piles during superplume growth, reducing the thickness of the basal thermal boundary layer in regions away from the piles, thereby producing an increase in the average basal heat flux. Conversely, during superplume collapse events in these experiments the dense layer thickness increases on average, yielding a decrease in the average basal heat flux.
There is an asymmetry between the rates of superplume growth and collapse revealed by laboratory and numerical experiments that may be significant for core-mantle thermal interaction. Because the material in the basal layer is negatively buoyant, the rate at which superplumes grow is mostly controlled by the upwelling rate of the large-scale convection, which is generally slow (McNamara and Zhong, 2004). In contrast, the collapse events are instabilities that draw energy from the negative buoyancy of the superplume material; typically these events occur on shorter time scales (Kumagai et al., 2007). In addition, because they are somewhat localized events, superplume collapses can occur without major changes in their own locations or in the overall pattern of the large-scale thermal convection.
Although LLSVP locations may have changed little since Pangaea breakup, significant time variations in CMB heat flux result from variations in the height of the lower mantle superplumes associated with them. Figure 1 depicts schematically the growth and partial collapse of two lower mantle superplumes with fixed locations. Figure 1A shows the superplume growth phase and Figures 1B,C show a two-stage partial collapse event. Assuming steady state heat conduction across the dense mantle material that forms the superplume base in the D"-layer, both the average CMB heat flux q and its lateral variation δq are greater in the growth stage (Figure 1A) compared to the collapsing stages (Figures 1B,C), a consequence of the large thermal gradient and elevated CMB heat flux where the basal layer is thin, which more than compensates for the small thermal gradient and reduced CMB heat flux where the basal layer is thick beneath the superplumes (Amit and Olson, 2015). Convective heat transport within these structures would attenuate this difference, but not eliminate it.
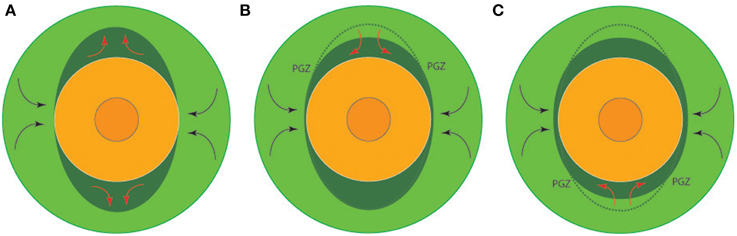
Figure 1. Equatorial cross-sections of the core (orange) and lower mantle (light green) illustrating compositional superplume growth and collapse in the D"-region (dark green) above the core-mantle boundary (CMB). Arrows indicate the implied lower mantle circulation patterns. (A) Superplume growth phase thins the D"-region below lower mantle downwellings, increasing the global mean CMB heat flux and its lateral heterogeneity. The geodynamo responds with higher polarity reversal frequency. (B) One superplume partially collapses, reducing CMB heat flux and reducing geodynamo polarity reversal frequency. Thermal instabilities are generated in the D"-region along the outer edge of the superplume (labeled PGZ—plume generation zone), leading to a concentration of large igneous provinces in that hemisphere. (C) The second superplume partially collapses, further reduces CMB heat flux and yields superchron conditions in the core. This collapse produces its own PGZ, leading to large igneous provinces concentrated in the opposite hemisphere.
The CMB heat flux and its lateral heterogeneity implied by Figure 1 are expected to be amplified by the transformation from perovskite to post-perovskite in the lowermost mantle. High-pressure experiments (Ohta et al., 2012) and molecular dynamics calculations (Ammann et al., 2014) indicate that the thermal conductivity of magnesium post-perovskite exceeds that of magnesium perovskite by 40–60% at lower mantle conditions. The post-perovskite phase is expected to be present in the coldest portions of the D"-region, i.e., below mantle downwellings, where the basal layer in Figure 1 is thinnest. Elevated thermal conductivity boosts the local CMB heat flux in these regions relative to that beneath the superplumes, further increasing both the global mean CMB heat flux and its lateral heterogeneity.
As illustrated in Figure 1B, when one superplume partially collapses, CMB heat flux is reduced. In Section 3 we propose that the geodynamo responds to this event with a reduction in the frequency of polarity reversals. Meanwhile, the superplume collapse produces a gravity current in the D"-layer, generating thermal boundary layer instabilities along the outer edge of the collapse, in the so-called Plume Generation Zone, labeled PGZ in Figure 1B, at locations which approximately correspond to the temperature-controlled transition from post-perovskite to perovskite. The development of these thermal boundary layer instabilities and their ascent as starting thermal plumes eventually leads to a concentration of LIPs surrounding the LLSVP in that hemisphere. Later, the second superplume partially collapses (Figure 1C), further reducing CMB heat flux to the point where superchron conditions prevail in the core. This second collapse produces its own gravity current and PGZ, leading to a second set of LIPs concentrated in the opposite hemisphere. PGZs surrounding both the African and Pacific LLSVPs have been identified using plate tectonic reconstructions of the locations of LIPs at their time of formation (Torsvik et al., 2006). In Section 5 we identify differences between African and Pacific LIP formation ages that are suggestive of a two-step PGZ generation process such as illustrated in Figure 1.
3. Dynamo Reversal Sensitivity to CMB Heat Flux
Figure 2 shows the relationship between the global average conductive CMB heat flux q and the superplume height H for the dual plume (rotated spherical harmonic degree 2 and order 0) configuration shown in Figures 1A,C, normalized to present-day conditions, as derived analytically by Amit and Olson (2015). It is important to note that both the average CMB heat flux q and the amplitude of its lateral heterogeneity δq increase with increasing superplume height H according to Figure 1, although only the correlation with average heat flux q is shown in Figure 2.
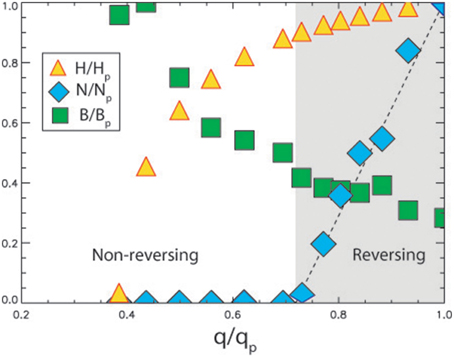
Figure 2. Results of dynamos driven by the dual superplume outer boundary heat flux pattern shown in Figure 1 as functions of average boundary heat flux q. H is superplume height, N is polarity reversal frequency, B is dipole field intensity. All variables are normalized by their present-day values, denoted by subscripts p. Polarity reversing dynamo regime is denoted by shading. Dashed line shows linear fit between N∕Np and q∕qp in the reversing dynamo regime.
Systematic investigations of polarity reversals using convection-driven numerical dynamos generally indicate that the likelihood of a reversal to occur increases with increasing average heat flux on the outer boundary. The sensitivity of reversals to CMB heat flux obtained by Amit and Olson (2015) using numerical dynamos with an imposed outer boundary heat flux pattern corresponding to the dual superplume configuration in Figure 1 is shown in Figure 2. The average reversal frequency N, defined here as the average number of reversals per dipole decay time, increases approximately linearly with the global average heat flux on the outer boundary q, such that
where a and b are constants. Assuming that superchron onset and end correspond to N = 0, Equation (1) can be rewritten as
where the subscripts p and s denote present-day and superchron onset conditions, respectively. According to Equation (2), the reversal frequency at any time t relative to present-day is proportional to the boundary heat flux relative to superchron conditions q(t)−qs normalized by qp−qs. Although Equation (2) does not contain δq explicitly, the boundary heat flux heterogeneity nevertheless contributes to N. However, for the type of boundary heterogeneity shown in Figure 2, δq is proportional to q, both increasing with superplume height H (Amit and Olson, 2015), so it is not necessary to specify both q and δq in Equations (1) and (2). The inverse of Equation (2) is just
Figure 2 shows that the changes in superplume height needed to alter the reversal frequency from superchron to present-day reversing conditions are not very large, amounting to variations of ±10%. The corresponding variability in CMB heat flux is proportionally larger, but nevertheless comparable to the time variability obtained from numerical models of mantle convection (Nakagawa and Tackley, 2010). Specifically, the implied reduction in CMB heat flux that would take the geodynamo from its present-day frequent reversing state N∕Np = 1 to superchron onset N∕Np = 0 amounts to qs∕qp ≃ 0.725. In the reversing regime, the relationship between CMB heat flux and reversal frequency is approximately linear as Equation (1) predicts, with a ≃ 3.64Np∕qp and b ≃ −2.64Np.
Disentangling the effects of mean CMB heat flux and its heterogeneity on reversal frequency is not possible in the context of our model, because these are coupled by the mantle heterogeneity (Amit and Olson, 2015). However, results from previous studies of reversing numerical dynamos shed some light on their individual effects. With homogeneous heat flux, it is well-established that increasing mean CMB heat flux increases reversal frequency (Christensen and Aubert, 2006; Olson and Christensen, 2006; Aubert et al., 2009). The CMB heat flux pattern may also play an important role. The rotated Y02 pattern is dominated by a Y22 component that does not strongly affect reversal frequency (e.g., Olson et al., 2010). However, this pattern also contains some polar cooling, which most studies find efficiently reduces reversal frequency (Glatzmaier et al., 1999; Kutzner and Christensen, 2004; Olson et al., 2010; Heimpel and Evans, 2013). Overall, it seems that the heterogeneity of the rotated Y02 pattern plays a lesser role than the change in mean CMB heat flux in modulating reversal frequency.
Figure 2 also shows the relative change in dipole field intensity as a function of the global average outer boundary heat flux. The dipole field intensity decreases with increasing boundary heat flux and in the reversing regime also with increasing reversal rate, such that relatively low dipole intensity is associated with frequent reversals and relatively high dipole intensity is associated with superchrons. According to Figure 2 the dipole at superchron onset is ~40% more intense than at the present-day. In Section 6 we point to evidence from the paleomagnetic intensity record that offers support for this association.
4. CMB Heat Flux from Geomagnetic Reversal Rates
We apply the scaling relation (Equation revfreq2) to infer the time variations in relative CMB heat flux q(t)∕qp from the time variations in relative geomagnetic reversal frequency N(t)∕Np. The barcode at the top of Figure 3 is the 0–300 Ma polarity record according to the 2012 GPTS by Gradstein et al. (2012). We divide this record into four time intervals based on average reversal frequency. Starting from the present-day and moving back in time, Interval 1 spans 0–83 Ma, from the present-day to the end of the CNS. Interval 2 spans the CNS. Interval 3 starts at 121 Ma, near CNS onset. Starting from the past and working forward in time, we take the oldest point of Interval 4 at 271 Ma, toward the end of the KRS. We then join Intervals 4 and 3 at 220 Ma. We arbitrarily chose 220 Ma as it coincides with a time with reduced reversal frequency, although the overall results are insensitive to this choice.
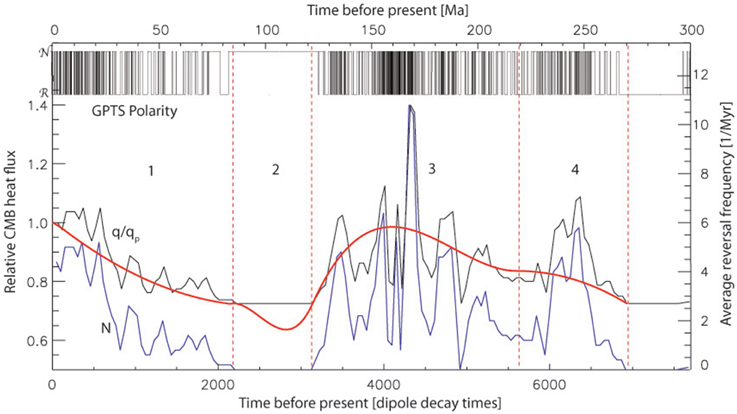
Figure 3. CMB heat flux variations vs. time before present in Ma (top scale) and dipole decay times (bottom scale) derived from geomagnetic polarity reversal variations. Bar code shows 0–300 Ma geomagnetic polarity record from the 2012 GPTS (Gradstein et al., 2012). is Normal geomagnetic polarity and is Reverse geomagnetic polarity. The blue curve labeled N is the average GPTS reversal frequency (number of reversals per Myr in a 5 Myr running average); the black curve labeled q∕qp is the raw CMB heat flux variations relative to present-day CMB heat flux according to Equation (revfreq2); the red curve is the smooth q∕qp modeled as described in the text using the time intervals labeled 1–4 (red vertical dashed lines).
Next we calculate average reversal frequency N(t) as a function of time before present using a 5 Myr running average window, starting from the present-day and progressing back in time, ending in the KRS. Curves of q∕qp are then calculated based on N∕Np using Equation (revfreq2) and qs∕qp = 0.725 (corresponding to Np = 4 in Figure 2). To extrapolate the CMB heat flux to the CNS we produce a smooth result, by representing q∕qp in each of the four intervals using 3rd order polynomial splines subject to continuity conditions. For all intervals we impose continuity conditions, including q∕qp = qs∕qp at the beginning and end of the superchrons. At the join between Intervals 3 and 4 we enforce continuity of q∕qp and its time derivative. For Interval 2 at the beginning and end of the CNS we constrain both q∕qp = qs∕qp as well as enforce continuity of the time derivative from Intervals 1 to 3. All told, there are four continuity conditions for Interval 2, sufficient to uniquely determine analytically a 3rd order polynomial for this interval in which reversal frequency constraints are essentially non-existent.
Results of this analysis are shown in Figure 3. The blue curve labeled N is the 5 million year running average polarity reversal frequency calculated for 0–270 Ma, and the black curve labeled q∕qp is its raw conversion to relative CMB heat flux using Equation (revfreq2). The smooth red curve in Figure 3 is q∕qp fitted to N according to the procedure described above. The raw CMB heat flux curve mirrors the GPTS variability, including a conspicuous but short-lived spike during the Jurassic hyper-reversals with a peak value 40% above that of the present-day. In contrast, the smooth fit shows a broad maximum in CMB heat flux during the Mesozoic with a peak value that is comparable to the present-day, and generally lower CMB heat flux (relative to present-day) at other times. Our extrapolated CMB heat flux during the CNS may reflect the observed geomagnetic field variability during this period (Granot et al., 2012). The CMB heat flux minimum in the middle of the CNS with q∕qp ≃ 0.64 is a product of our fitting method and is not directly constrained by the observed geomagnetic reversal frequency. But even ignoring this minimum, the 0–270 Ma time average relative CMB heat flux corresponds to q∕qp ≃ 0.84, implying that the present-day rate of CMB heat flux may be above its long-term average. This in turn implies that the rate of growth of the inner core and the power applied to drive the geodynamo may also be higher at present than their long-term averages. It may also imply that present-day dipole intensity is lower than average. However, the present-day dipole strength is far above its average for the past 2 Myr (Olson and Amit, 2006). This discrepancy stems from our underestimation of the peak CMB heat flux during the Jurassic hyper-reversals as a consequence of our smoothing technique.
Lastly, we note that our smooth fit suggests asymmetric behavior of the CMB heat flux, consisting of long intervals during which the CMB heat flux slowly increases, as opposed to shorter intervals during which the CMB heat flux decreases in a faster rate. The asymmetry is particularly evident in comparison to the behavior prior to the CNS, when reversal frequency fell rapidly (Hulot and Gallet, 2003) vs. the behavior following the CNS, when reversal frequency, and by implication, CMB heat flux, increased at a slower rate.
5. Connection with Large Igneous Provinces
Figure 4 illustrates the sequence of events we propose to connect the variations in geomagnetic reversal frequency, CMB heat flux variations, and variations in the structure of the D"-region. The red curve with yellow fill is the 5 Myr running average reversal frequency from the GPTS, and the aqua bands mark the two superchrons, the CNS and KRS, respectively. The blue curve shows the relative variation in CMB heat flux from Figure 3 that would, according to our hypothesis, produce a smoothed variation of the reversal frequency record. The dotted horizontal lines denote relative CMB heat flux, q∕qp = 1 for present-day and qs∕qp = 0.725 for superchron onset and termination. Intervals for which CMB heat flux increases with time are labeled as periods of superplume growth, and conversely, intervals in which CMB heat flux decreases with time are labeled as periods of superplume collapse.
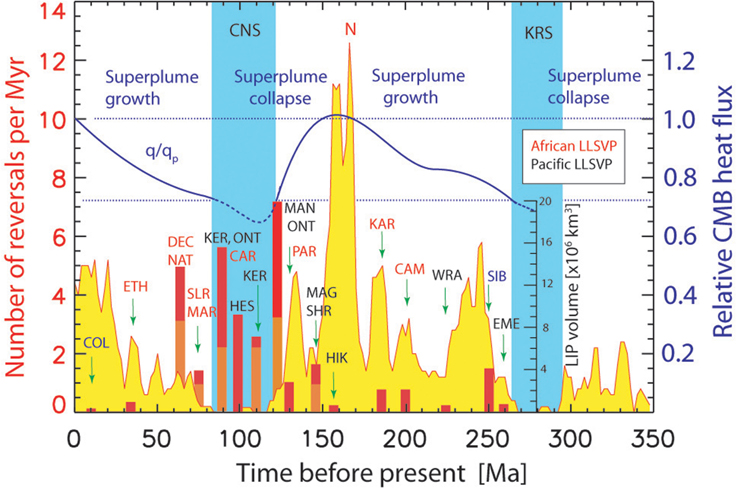
Figure 4. Composite showing the relationships between time variations in geomagnetic polarity reversal frequency, formation of major large igneous provinces (LIPs), inferred CMB heat flux variations, and inferred variations in lower mantle superplumes. Polarity reversal frequency N with 5 Myr running average is from the 2012 GPTS (Gradstein et al., 2012), CMB heat flux q is relative to present-day qp, both from Figure 3. LIPs associated with the African/Pacific large low shear velocity provinces (LLSVPs) are labeled in red/black, respectively; blue denotes other associations. LIP volumes and ages are from Eldholm and Coffin (2000) and Courtillot and Renne (2003). Red/orange composite bars denote multiple LIPs. EME, Emeishan; SIB, Siberia; WAR, Wrangalia; CAM, Central Atlantic Magmatic Province; KAR, Karoo; HIK, Hikurangi Plateau; MAN, Manihiki Plateau; HES, Hess Rise; CAR, Caribbean; KER, Kerguelen Plateau; ONT, Ontong-Java Plateau; MAR, Maud Rise; SLR, Sierra Leone Rise; NAT, North Atlantic Magmatic Province; DEC, Deccan Traps; ETH, Ethiopian Plateau; COL, Columbia River Plateau.
Superimposed on the geomagnetic reversal frequency record are formation ages and estimated volumes of LIPs, representing both continental flood basalts and ocean plateaus. The LIP age and volume estimates were obtained from compilations by Eldholm and Coffin (2000) and Courtillot and Renne (2003). LIPs formed in the Atlantic hemisphere that can nominally be associated with the African LLSVP as their source are labeled in red, and LIPs formed in the Pacific hemisphere that can nominally be associated with the Pacific LLSVP as their source are labeled in black.
Overall there is an inverse correlation between reversal frequency and LIP activity since the Jurassic hyper-reversing event around 160 Ma. Prior to that time the LIP record is sparse, and inferences about possible connections with the reversal frequency pattern carry substantial uncertainties. But starting in the late Jurassic the situation improves moving forward. LIP activity ramped up as reversal frequency plummeted, culminating in the CNS, during which time LIP activity peaked, reaching its Phanerozoic high with the formation of several major ocean plateaus plus numerous smaller ones. Larson (1991) termed this cluster of Cretaceous LIPs the “latest pulse of the Earth,” and showed that these ocean plateaus made substantial contribution to the rate at which new ocean crust was formed.
One interpretation of the inverse correlation between LIP activity and reversal frequency since the Mesozoic is that geomagnetic polarity is more stable when the convective activity of the mantle is high. However, this is not consistent with conditions during the KRS. Alternatively, the apparent inverse correlation might simply represent the time lag between a pulse of thermal plumes initiated near the CMB, which would affect the geodynamo almost immediately, and their arrival at the base of the lithosphere. Numerical and laboratory simulations of thermal plume formation and ascent (van Keken, 1997) indicate that the time required for a large thermal plume head to form in the thermal boundary layer in the D"-region and then rise through the mantle is of order 30–60 Myr, longer if the plume head is smaller. Therefore, if thermal plume initiation is the process that links decreases in geomagnetic reversal frequency with LIP activity, we should expect that these events in the GPTS should lead LIP formation by some tens of millions of years.
Referring to Figure 4, we see evidence of such time differences. The 260 Ma Emeishan and 252 Ma Siberian Traps postdate the onset of the KRS by 35 and 45 Myr, respectively. The 200 Ma Central Atlantic Magmatic Province and the 186 Ma Karoo Flood Basalts postdate by 30 and 45 Myr, respectively, a major reduction in reversal frequency around 230 Ma. These two LIP events are spatially and temporally associated with the African LLSVP (Torsvik et al., 2006), suggesting a partial collapse of the African superplume structure, according to our hypothesis.
Similar time lags are associated with more recent LIP events. Starting around 145 Ma with the formation of the Magellan and SHR Rises, and ramping up to around 123 Ma with the formation of the Manihiki Rise and initial formation of the Ontong Java Plateau, several large Pacific LIPs made their appearance, including the Kerguelen Plateau around 110 Ma, the 100 Ma Hess Rises, and resumed activity at Kerguelen and Ontong Java around 90 Ma. These LIPs postdate the major fall in reversal frequency that began around 155 Ma at the end of the Jurassic hyper-reversals and continued into the CNS. The associated time lags between GPTS and LIP activities are within the same 30–60 Myr range seen at earlier times in these records. The predominance of Pacific LIPs during this time frame implies instability of the Pacific LLSVP, connected, according to our hypothesis, with a partial collapse of that superplume.
Later Cretaceous LIPs tend to cluster in the Atlantic hemisphere, starting with the 88 Ma Caribbean Volcanic Province, the Sierra Leone and Maud Rises around 75 Ma, and culminating with the Deccan Traps and North Atlantic volcanic province around 65 and 60 Ma, respectively. These have all been associated with instability on the margin of the African LLSVP (Torsvik et al., 2006). In terms of their relationship to the GPTS, the transition from frequent reversals to the CNS occurred around 130 Ma, and we can speculate that this process continued to about the middle of the CNS, around 110 Ma. Accordingly, the time lag between the GPTS response and LIP ages for these events ranges across the same 30–60 Myr time span inferred for the LIPs in the Pacific hemisphere.
Figure 4 also shows that LIP activity has waned over the Cenozoic, with only a couple of relatively small events (in terms of their erupted volumes) formed during this time, including Ethiopia around 34 Ma and the Columbia River basalts around 10 Ma. It is significant to our hypothesis that, during this same period, reversal frequency has substantially increased, although non-uniformly, consistent with our interpretation that both superplumes re-built over this time period. Also note that there is some suggestion of an end to the recent rise in reversal activity, and hence to this phase of superplume growth. The 5 Myr average reversal frequency has fluctuated about ~5 events per million years since about 25 Ma. If so, the present-day lower mantle superplumes might be near their saturation height, poised for the next collapse. According to our hypothesis, this will set off another round of thermal instability, leading in the next 30–60 Myr to a new round of LIP activity.
Finally, we note the marked asymmetry implied by Figure 4, in which CMB heat flux increases relatively slowly over ~100 Myr time intervals, then falls relatively rapidly in time intervals of ~30 Myr. The asymmetry in reversal frequency that underlies this trend has led to the concept that superchrons appear to “occur without warning” (Hulot and Gallet, 2003) whereas their termination is followed by a progressive increase in reversal frequency, as seen in Figure 3 during the Cenozoic following the CNS (Lowrie and Kent, 1983).
According to our model, this asymmetry is a consequence of the difference in rates between slow superplume growth and rapid collapse. The free collapse time scale of a negatively buoyant viscous superplume with height H is given by
where L, ν, and g′ are the horizontal dimension, kinematic viscosity, and buoyancy of the superplume, respectively. Assuming L = 3000 km, ν = 2×10¹⁷ m2s−1, g′ = 0.2 m s2 (Zhang et al., 2010) and H = 500 km yields τ ≃ 2 Myr. This represents a lower limit on the time scale for superplume collapse, since it ignores coupling with the rest of the lower mantle. Nevertheless, it is considerably shorter than the superplume growth timescale, because growth of negatively buoyant superplumes is dependent on, and limited by, flow in the lower mantle above the superplume. Assuming strong coupling, superplume growth rate is proportional to W, the characteristic upwelling rate of the mantle global circulation. Based on mantle global circulation models, W−1 ≃ 50 Myr (Nakagawa and Tackley, 2010; Zhang et al., 2010), so that the rate of superplume collapse has the potential to be significantly faster than the characteristic rate of growth.
6. Supporting Evidence
We interpret the slow modulation of geomagnetic reversals and its relationship to Mesozoic and Cenozoic LIP activity in terms of time variability in the height of the two major superplumes defined by lower mantle LLSVPs. LIP ages suggest that the Pacific superplume may have collapsed first, followed by the African superplume, which produced the CNS.
Variability of the Pacific superplume is difficult to detect in the geologic record because little continental crust has been located above this structure during the time period in question. The situation is different for the African superplume, where extensive portions of the African continent have been located above the African LLSVP since the Mesozoic. Much effort has gone into documenting the uplift history of Africa, particularly in the second half of the Cenozoic, because of its implications for paleoclimate change and primate evolution (Jung et al., 2014), but also earlier in the Mesozoic because of its implications for the behavior of continental crust in response to supercontinent breakup. There is evidence from thermochronometry and geodynamical considerations for two main uplift phases. The first, the Mesozoic phase, which may have peaked in the early Cretaceous or late Jurassic, is based on thermochronometric evidence from uranium isotope systematics (Flowers and Schoene, 2010) and from backward integration of mantle flow that reconstructs the size and shape of the African superplume (Conrad and Gurnis, 2003). These geodynamical simulations predict that the African superplume collapsed some time between 120 and 90 Ma, contemporaneous with the CNS and the major fall in CMB heat flux shown in Figure 4, although somewhat earlier than what thermochronometry indicates. In contrast, Moore et al. (2009) inferred that plate tectonic controls explain the South African topographic history. Nyblade and Sleep (2003) examined various uplift mechanisms for the older southern African Plateau and concluded that a long-lasting plume structure would be needed to maintain its anomalous elevation, assuming it formed in the Mesozoic. Their inferred timing for onset of that event would coincide with the 183 Ma Karoo Flood Basalt and for longevity would need additional support from a later event, which they ascribe to a 90 Ma pulse of magmatic activity.
The Cenozoic phase of uplift African history is equally controversial in terms of timing and source, although there is a clear consensus that major uplift event did occur then (Wichura et al., 2010). Analysis of changes to drainage patterns (Roberts and White, 2010) points to widespread uplift throughout East and North Africa during the Miocene. The cause of this uplift is the main source of controversy. One proposal is that Africa drifted over the developing African superplume, producing uplift in East Africa over the superplume center and subsidence in West Africa above the margin of the superplume (Moucha and Forte, 2011). This mechanism is broadly consistent with our hypothesis. The competing proposal assigns uplift to the cumulative effects of African hotspot activity (Roberts and White, 2010). This mechanism suffers from the fact that the strengths of hotspots beneath the African plate are rather low.
In spite of the divergence of opinions with respect to specific causes and their exact timings, there is strong evidence in favor of two episodes of uplift affecting major portions of the African continent, one in the mid-Mesozoic, the other in the mid-Cenozoic or later. With reference to Figure 4, these times coincide with generally accelerating reversal frequency, and according to our hypothesis, African superplume growth.
Additional supporting evidence for our model comes from paleomagnetic intensity trends before and during the CNS, and in particular, the evidence for a Mesozoic Dipole Low (or MDL; Prevot et al., 1990), roughly contemporaneous with the hyper-reversing period in the Jurassic during 160–180 Ma. Controversy surrounds the overall significance of the MDL, with some studies finding a general inverse correlation between paleointensity and reversal frequency (Channell et al., 1982; Tarduno and Cottrell, 2005), while other studies questioning whether such a correlation exists (Ingham et al., 2014). Nevertheless, the best available paleointensity data indicate a Jurassic median dipole moment of 29 ZAm2, compared to 78 ZAm2 at present-day, ~72 ZAm2 at CNS onset, and ~42 ZAm2 for the long-term (0–140 Ma) time average (Tauxe et al., 2013).
We can compare these changes with predictions from our reversing numerical dynamos with reference to the relative dipole intensities shown in Figure 2. The time average dynamo dipole intensity at peak reversal frequency Np, corresponding to Bp in our model, is about 70% of Bs, the dipole intensity at the edge of the non-reversing regime. In contrast, the paleointensity during the MDL is only about 40% of that at CNS onset. We can rationalize this difference by noting that the Jurassic hyper-reversals period in the MDL was short-lived, and as a consequence, our smoothing procedure tends to underestimate N during that time. Without such heavy smoothing, our model representation of the Jurassic hyper-reversals period would have a larger N∕Np and a correspondingly smaller B∕Bp.
We note that power-based dynamo scaling laws fail to explain the MDL field intensity. For example, scaling laws from dynamo models in the dipole-dominated non-reversing regime predict that the magnetic field intensity varies with the buoyancy flux F like B∝F1∕3 (Christensen and Aubert, 2006). Assuming that the buoyancy flux is proportional to the total core heat flux, this implies Q/Qref = (B/Bref)3. According to Tauxe et al. (2013), BMDL∕BCNS = 29∕72, for which dynamo power scaling would predict QMDL∕QCNS = 0.065, a totally unrealistic change in core heat flux. A better explanation for the MDL intensity reduction, implicit in the trend for B in Figure 2 is that the geodynamo moved close to the non-dipole transition during the MDL, into a regime which is outside the limits of validity of these power-based scaling laws.
7. Unresolved Issues
Our model predicts a CMB heat flux history that differs somewhat from that inferred from plate reconstructions, hotspot activity, and other tectonic interpretations of the history of mantle dynamics. In particular, the behavior of our model during the CNS is in conflict with the behavior predicted by mantle global circulation models (GCMs) constrained by reconstructed plates (Zhang and Zhong, 2011). Because plate speeds were relatively high during the CNS, the mantle GCMs yield large average CMB heat flux, and when imposed on numerical dynamos large reversal frequency during this period (Olson et al., 2013). In contrast, our model derived from the GPTS predicts a minimum in CMB heat flux during the CNS. Obvious differences between our model and mantle GCM predictions center on the behavior of the two lower mantle compositional superplumes. In most mantle GCMs the behavior of lower mantle superplumes are closely linked to the mantle global circulation and the surface plate motions. In contrast, in order for our model to be applicable, it is necessary that the lower mantle superplumes rise and partially collapse independently of the mantle global circulation. By “independently” we mean that the superplumes respond to major changes in the global circulation, for example, by collapsing after Pangaea assembly to produce the KRS and by growing after Pangaea breakup to produce hyper-reversing dynamo behavior in the Jurassic, but they also fluctuate at other times, collapsing to produce the CNS and the post-CNS pulse of LIP activity and re-building since that time. This additional freedom in superplume behavior is generally not seen in mantle GCMs in which the global circulation is strongly controlled by surface plate motions (Zhang and Zhong, 2011). However, it is also worth noting that neither do these mantle GCMs capture the post-CNS pulse of LIP activity.
The numerical dynamos from which our CMB heat flux-reversal frequency scaling (Equation revfreq2) is derived all have large Ekman (E) and magnetic Prandtl (Pm) numbers, meaning that the ratios of viscous to Coriolis forces and viscous to magnetic diffusivity in these dynamos are unrealistic for the Earth's liquid outer core. This combination of parameters was chosen because the behavior of numerical dynamos in this regime mimics paleomagnetic field behavior in several respects, most importantly, in terms of their reversal frequency statistics. Although there is general agreement that increasing CMB heat flux destabilizes magnetic polarity, thereby making reversals more likely, it is probable that the heat flux-reversal sensitivity changes with dynamo model parameters (U. Christensen, personal communication). Accordingly, further exploration of dynamo reversals using more realistic parameters is needed.
Concerning the linear dependence of reversal frequency on average CMB heat flux, Olson and Amit (2014) argued that the correct relation is a power law of the form N∝q1∕2, which stems from the relation between the level of core turbulence and CMB heat flux found in numerical dynamos (Christensen and Aubert, 2006; Aubert et al., 2009). Even in this case, a linear dependence (constant sensitivity) remains an adequate approximation, since the temporal variations of the relative CMB heat flux q∕qp produced by mantle convection are not excessively large (Nakagawa and Tackley, 2010). Furthermore, by casting reversal sensitivity in terms of relative variations in CMB heat flux, we lump most of the model uncertainties into a single parameter qs∕qp, the ratio of average CMB heat flux at the onset of a superchron to its present-day value. Although our estimate of qs∕qp = 0.725 likely depends on our choice of dynamo model parameters, our qualitative inferences are more robust, in particular, our prediction of low CMB heat flux during the CNS and other superchrons.
The longevity of the dual superplume structure in the lower mantle remains another controversial issue. Volcanic hotspot reconstructions (Torsvik et al., 2006) point to the existence of two superplumes far back into the Paleozoic, whereas mantle GCMs predict a single superplume during Pangaea assembly prior to 330 Ma (Zhang et al., 2010) and superchron conditions in the core during the transition to Pangaea breakup (Olson et al., 2013). It has been argued (Courtillot and Olson, 2007) that the KRS and CNS superchrons were terminated during the formation of plume heads that created, following 10–20 Myr of mantle ascent, the Siberian and Deccan Traps. This interpretation is qualitatively in accord with the model presented here, which predicts superplume growth after the termination of the CNS with a total lag time of 30–60 Myr.
Paleomagnetic data from ancient rocks indicate that the geodynamo has shifted between frequently reversing and superchron states on multiple occasions, back to at least 1.1 Ga (Pavlov and Gallet, 2010; Biggin et al., 2012) and possibly longer. Both the mantle and core have evolved since then, including secular cooling, supercontinent aggregation and dispersal, probable nucleation of the solid inner core (Labrosse, 2003), and major reductions in the rate of Earth's rotation due to tidal friction (Williams, 2000). In spite of these evolutionary changes to the core-mantle system, the overall pattern of modulation of geomagnetic reversals persists without any clear indication of a trend. According to our model, the lack of a demonstrable long-term secular trend in reversal frequency implies that the core energetics have fluctuated about a mean state over geologic time, while the various factors that control its energetics have waxed and waned. How this fortuitous balance was maintained over billions of years, through unknown feedback processes or simply by coincidence, is another open question.
Author Contributions
Data was acquired by PO and analyzed by HA. PO prepared the figures and PO and HA shared in the interpretations and writing.
Conflict of Interest Statement
The authors declare that the research was conducted in the absence of any commercial or financial relationships that could be construed as a potential conflict of interest.
Acknowledgments
Support for PO was provided by the National Science Foundation through Frontiers in Earth System Dynamics Grant EAR-1135382. We also acknowledge helpful suggestions from Johannes Wicht and Michael Evans.
References
Amit, H., and Olson, P. (2004). Helical core flow from geomagnetic secular variation. Phys. Earth Planet. Inter. 147, 1–25. doi: 10.1016/j.pepi.2004.02.006
Amit, H., and Olson, P. (2015). Lower mantle superplume growth excites geomagnetic reversals. Earth Planet. Sci. Lett. 414, 68–76. doi: 10.1016/j.epsl.2015.01.013
Ammann, M. W., Walker, A. M., Stackhouse, S., Wookey, J., Forte, A. M., Brodholt, J. P., et al. (2014). Variation of thermal conductivity and heat flux at the Earth's core mantle boundary. Earth Planet. Sci. Lett. 390, 175–185. doi: 10.1016/j.epsl.2014.01.009
Aubert, J., Labrosse, S., and Poitou, C. (2009). Modelling the paleo-evolution of the geodynamo. Geophys. J. Int. 179, 1414–1428. doi: 10.1111/j.1365-246X.2009.04361.x
Biggin, A. J., Steinberger, B., Aubert, J., Suttie, N., Holme, R., Torsvik, T. H., et al. (2012). Possible links between long-term geomagnetic variations and whole-mantle convection processes. Nat. Geosci. 5, 526–533. doi: 10.1038/ngeo1521
Burke, K., Steinberger, B., Torsvik, T. H., and Smethhurst, M. A. (2008). Plume generation zones at the margins of large low shear velocity provinces on the core-mantle boundary. Earth Planet. Sci. Lett. 265, 49–60. doi: 10.1016/j.epsl.2007.09.042
Channell, J. E., Ogg, J. G., and Lowrie, W. (1982). Geomagnetic polarity in the early Cretaceous and Jurassic. Phil. Trans. R. Soc. Lond. A 306, 137–146.
Christensen, U., and Aubert, J. (2006). Scaling properties of convection-driven dynamos in rotating spherical shells and application to planetary magnetic fields. Geophys. J. Int. 166, 97–114. doi: 10.1111/j.1365-246X.2006.03009.x
Conrad, C. P., and Gurnis, M. (2003). Seismic tomography, surface uplift, and the breakup of Gondwanaland: integrating mantle convection backwards in time. Geochem. Geophys. Geosyst. 4, 1031. doi: 10.1029/2001GC000299
Courtillot, V. E., and Renne, P. R. (2003). On the ages of flood basalt events. C. R. Geosci. 335, 113–140. doi: 10.1016/S1631-0713(03)00006-3
Courtillot, V., and Olson, P. (2007). Mantle plumes link magnetic superchrons to Phanerozoic mass depletion events. Earth Planet Sci. Lett. 260, 495–504. doi: 10.1016/j.epsl.2007.06.003
Davaille, A. (2007). “Laboratory studies of mantle convection,” in Treatise on Geophysics, Vol. 7, ed D. Bercovici (Amsterdam: Elsevier Science), 90–164.
Driscoll, P. E., and Olson, P. L. (2011). Superchron cycles driven by variable core heat flow. Geophys. Res. Lett. 38, L09304. doi: 10.1029/2011GL046808
Dziewonski, A. M., Lekic, V., and Romanowicz, B. A. (2010). Mantle anchor structure: an argument for bottom up tectonics. Earth Planet. Sci. Lett. 299, 69–79. doi: 10.1016/j.epsl.2010.08.013
Eldholm, O., and Coffin, M. F. (2000). Large igneous provinces and plate tectonics. AGU Monogr. 121, 309–326. doi: 10.1029/GM121
Flowers, R. M., and Schoene, B. (2010). (U-Th)/He thermochronometry constraints on unroofing of the eastern Kaapvaal craton and significance for uplift of the southern African Plateau. Geology 38, 827–830. doi: 10.1130/G30980.1
Gallet, Y., and Hulot, G. (1997). Stationary and nonstationary behaviour within the geomagnetic polarity time scale. Geophys. Res. Lett. 24, 1875–1878.
Glatzmaier, G., Coe, R., Hongre, L., and Roberts, P. (1999). The role of the earth's mantle in controlling the frequency of geomagnetic reversals. Nature 401, 885–890.
Gradstein, F., Ogg, J., Schmitz, M., and Ogg, G. (2012). The Geologic Time Scale 2012. Amsterdam: Elsevier Science.
Granot, R., Dyment, J., and Gallet, Y. (2012). Geomagnetic field variability during the Cretaceous normal superchron. Nature Geosci. 5, 220–223. doi: 10.1038/ngeo1404
Heimpel, M. H., and Evans, M. E. (2013). Testing the geomagnetic dipole and reversing dynamo models over Earth's cooling history. Phys. Earth Planet. Inter. 224, 124–131. doi: 10.1016/j.pepi.2013.07.007
Hulot, G., and Gallet, Y. (2003). Do superchrons occur without any palaeomagnetic warning? Earth Planet. Sci. Lett. 210, 191–201. doi: 10.1016/S0012-821X(03)00130-4
Ingham, E., Heslop, D., Roberts, A. P., Hawkins, R., and Sambridge, M. (2014). Is there a link between geomagnetic reversal frequency and paleointensity? A Bayesian approach. J. Geophy. Res. 119, 5290–5304. doi: 10.1002/2014JB010947
Jaupart, C., Labrosse, S., and Mareschal, J. C. (2007). “Temperatures, heat and energy in the mantle of the Earth,” in Treatise on Geophysics, Vol. 7, ed D. Bercovici (Amsterdam: Elsevier Science), 90–164.
Jung, G., Prange, M., and Schulz, M. (2014). Uplift of Africa as a potential cause for Neogene intensification of the Benguela upwelling system. Nat. Geosci. 7, 741–747. doi: 10.1038/ngeo2249
Kumagai, I., Davaille, A., and Kurita, K. (2007). On the fate of mantle thermal plumes at density interface. Earth Planet. Sci. Lett. 254, 180–193. doi: 10.1016/j.epsl.2006.11.029
Kutzner, C., and Christensen, U. R. (2004). Simulated geomagnetic reversals and preferred virtual geomagnetic pole paths. Geophys. J. Int. 157, 1105–1118. doi: 10.1111/j.1365-246X.2004.02309.x
Labrosse, S. (2003). Thermal and magnetic evolution of the earth's core. Phys. Earth Planet. Inter. 140, 127–143. doi: 10.1016/j.pepi.2003.07.006
Larson, R. L. (1991). Latest pulse of Earth: evidence for a mid-Cretaceous supreplume. Geology 19, 547–550. doi: 10.1130/0091-7613(1991)019<0547:LPOEEF>2.3.CO;2
Lay, T., Hernlund, J., and Buffett, B. A. (2008). Core-mantle boundary heat flow. Nat. Geosci. 1, 25–32. doi: 10.1038/ngeo.2007.44
Layer, P. W., Kröner, A., and McWilliams, M. (1996). An archean geomagnetic reversal in the Kaap Valley pluton, South Africa. Science 273, 943–946.
Lekic, V., Cottaar, S., Dziewonski, A., and Romanowicz, B. (2012). Cluster analysis of global lower mantle tomography: a new class of structure and implications for chemical heterogeneity. Earth Planet Sci. Lett. 357, 68–77. doi: 10.1016/j.epsl.2012.09.014
Le Bars, M., and Davaille, A. (2004). Large interface deformation in two-layer thermal convection of miscible viscous fluids. J. Fluid Mech. 499, 75–1 doi: 10.1017/S0022112003006931
Lhuillier, F., Hulot, G., and Gallet, Y. (2013). Statistical properties of reversals and chrons in numerical dynamos and implications for the geodynamo. Phys. Earth Planet. Inter. 220, 19–36. doi: 10.1016/j.pepi.2013.04.005
Lowrie, W., and Kent, D. (1983). Geomagnetic reversal frequency since the Late Cretaceous. Earth Planet. Sci. Lett. 62, 305–313.
McNamara, A. K., and Zhong, S. (2004). Thermochemical structures within a spherical mantle: superplumes or piles? J. Geophys. Res. 109, B07402. doi: 10.1029/2003JB002847
McNamara, A. K., and Zhong, S. J. (2005). Thermochemical structures beneath Africa and the Pacific Ocean. Nature 437, 1136–1139. doi: 10.1038/nature04066
Moore, A., Blenkinsop, T., and Cotterill, F. W. (2009). Southern African topography and erosion history: plumes or plate tectonics? Terra Nova 21, 310–315. doi: 10.1111/j.1365-3121.2009.00887.x
Moucha, R., and Forte, A. M. (2011). Changes in African topography driven by mantle convection. Nature Geosci. 4, 707–712. doi: 10.1038/ngeo1235
Muller, R. D., Gaina, C., and Roest, W. R. (2008). Age, spreading rates, and spreading asymmetry of the world's ocean crust. Geochem. Geophys. Geosyst. 9, Q04006. doi: 10.1029/2007GC001743
Nakagawa, T., and Tackley, P. J. (2010). Influence of initial CMB temperature and other parameters on the thermal evolution of Earth's core resulting from thermo-chemical spherical mantle convection. Geochem. Geophys. Geosys. 11, Q06001. doi: 10.1029/2010GC003031
Nyblade, A. A., and Sleep, N. H. (2003). Long lasting epeirogenic uplift from mantle plumes and the origin of the Southern African Plateau. Geochem. Geophys. Geosys. 4. doi: 10.1029/2003GC000573
Ohta, K., Yagi, T., Taketoshi, N., Hirose, K., Komabayashi, T., Baba, T., et al. (2012). Lattice conductivity of MgSiO3 perovskite and post-perovskite at the coremantle boundary. Earth Planet. Sci. Lett. 349–350, 109–115. doi: 10.1016/j.epsl.2012.06.043
Olson, P., and Amit, H. (2006). Changes in Earth's dipole. Naturwissenschaften 93, 519–542. doi: 10.1007/s00114-006-0138-6
Olson, P., and Amit, H. (2014). Magnetic reversal frequency scaling in dynamos with thermochemical convection. Phys. Earth Planet. Inter. 229, 122–133. doi: 10.1016/j.pepi.2014.01.009
Olson, P., and Christensen, U. R. (2006). Dipole moment scaling for convection-driven planetary dynamos. Earth Planet. Sci. Lett. 250, 561–571, doi: 10.1016/j.epsl.2006.08.008
Olson, P., and Kincaid, C. (1991). Experiments on the interaction of thermal convection and compositional layering at the base of the mantle. J. Geophys. Res. 96, 4347–4354. doi: 10.1029/90JB02530
Olson, P. L., Coe, R. S., Driscoll, P. E., Glatzmaier, G. A., and Roberts, P. H. (2010). Geodynamo reversal frequency and heterogeneous core-mantle boundary heat flow. Phys. Earth Planet. Inter. 180, 66–79. doi: 10.1016/j.pepi.2010.02.010
Olson, P., Deguen, R., Hinnov, L. A., and Zhong, S. (2013). Controls on geomagnetic reversals and core evolution by mantle convection in the phanerozoic. Phys. Earth Planet. Inter. 214, 87–103. doi: 10.1016/j.pepi.2012.10.003
Olson, P., Hinnov, L., and Driscoll, P. (2014). Nonrandom geomagnetic reversal times and geodynamo evolution. Earth Planet. Sci. Lett. 388, 9–17. doi: 10.1016/j.epsl.2013.11.038
Olson, P., Deguen, R., Rudolph, M. L., and Zhong, S. (2015). Core evolution driven by mantle global circulation. Phys. Earth Planet. Inter. 243, 44–55. doi: 10.1016/j.pepi.2015.03.002
Pavlov, V., and Gallet, Y. (2010). Variations in geomagnetic reversal frequency during the Earth's middle age. Geochem. Geophys. Geosyst. 11, Q01Z10. doi: 10.1029/2009GC002583
Pétrélis, F., Besse, J., and Valet, J.-P. (2011). Plate tectonics may control geomagnetic reversal frequency. Geophys. Res. Lett. 38, L19303. doi: 10.1029/2011GL048784
Prevot, M., Derder, M. E. M., McWilliams, M., and Thompson, J. (1990). Intensity of the Earth's magnetic field: evidence for a Mesozoic dipole low. Earth Planet. Sci. Lett. 97, 129–139. doi: 10.1016/0012-821X(90)90104-6
Roberts, G. G., and White, N. (2010). Estimating uplift rate histories from river profiles using African examples. J. Geophys. Res. 115, B02406. doi: 10.1029/2009JB006692
Schubert, G., Turcotte, D. L., and Olson, P. (2001). Mantle Convection in the Earth and Planets. New York, NY: Cambridge University Press.
Tarduno, J. A., and Cottrell, R. D. (2005). Dipole strength and variation of the time-averaged reversing and nonreversing geodynamo based on Thellier analyses of single plagioclase crystals. J. Geophys. Res. 110, B11101. doi: 10.1029/2005JB003970
Tauxe, L., Gee, J. S., Steiner, M., and Staudigel, H. (2013). Paleointensity results from the Jurassic: new constraints from submarine basaltic glasses of ODP Site 801C. Geochem. Geophys. Geosys. 14, 4718–4733. doi: 10.1002/2013GC004704
Torsvik, T. H., Smethhurst, M. A., Burke, K., and Steinberger, B. (2006). Large igneous provinces generated from the margins of the large low-velocity provinces in the deep mantle. Geophys. J. Int. 167, 1447–1460. doi: 10.1111/j.1365-246X.2006.03158.x
Torsvik, T. H., Smethurst, M. A., Burke, K., and Steinberger, B. (2008). Long term stability in deep mantle structure: evidence from the 300 Ma Skagerrak Centered Large Igneous Province (the SCLIP). Earth Planet. Sci. Lett. 267, 444–452. doi: 10.1016/j.epsl.2007.12.004
van Keken, P. E. (1997). Evolution of starting mantle plumes: a comparison between numerical and laboratory models. Earth Planet. Sci. Lett. 148, 1–11.
Wichura, H., Bousquet, R., Oberhänsli, R., Strecker, M. R., and Trauth, M. H. (2010). Evidence for middle Miocene uplift of the East African Plateau. Geology 38, 543–546. doi: 10.1130/G31022.1
Williams, G. E. (2000). Geological constraints on the Precambrian history of Earth's rotation and the Moon's orbit. Rev. Geophys. 38, 37–59. doi: 10.1029/1999RG900016
Wu, B., Olson, P., and Driscoll, P. (2011). A statistical boundary layer model for the mantle D"-region. J. Geophys. Res. 116, B12112. doi: 10.1029/2011JB008511
Zhang, N., and Zhong, S. (2011). Heat fluxes at the Earth's surface and core-mantle boundary since Pangea formation and their implications for the geomagnetic superchrons. Earth Planet. Sci. Lett. 306, 205–2016. doi: 10.1016/j.epsl.2011.04.001
Keywords: geodynamo, polarity reversals, core heat flux, mantle superplumes, core-mantle boundary, large igneous provinces
Citation: Olson P and Amit H (2015) Mantle superplumes induce geomagnetic superchrons. Front. Earth Sci. 3:38. doi: 10.3389/feart.2015.00038
Received: 09 April 2015; Accepted: 30 June 2015;
Published: 15 July 2015.
Edited by:
Moritz Heimpel, University of Alberta, CanadaReviewed by:
Michael Edwin Evans, University of Alberta, CanadaJohannes Wicht, Max Planck Institute for Solar System Research, Germany
Copyright © 2015 Olson and Amit. This is an open-access article distributed under the terms of the Creative Commons Attribution License (CC BY). The use, distribution or reproduction in other forums is permitted, provided the original author(s) or licensor are credited and that the original publication in this journal is cited, in accordance with accepted academic practice. No use, distribution or reproduction is permitted which does not comply with these terms.
*Correspondence: Peter Olson, Department of Earth and Planetary Sciences, Johns Hopkins University, Olin Hall, 3400 North Charles St., Baltimore, MD 21218, USA, olson@jhu.edu