Contribution of anisotropy of magnetic susceptibility (AMS) to reconstruct flooding characteristics of a 4220 BP tsunami from a thick unconsolidated structureless deposit (Banda Aceh, Sumatra)
 Patrick C. Wassmer1,2,3*
  Christopher A. Gomez3
  T. Yan W. M. Iskandarsyah2,4
  Franck Lavigne1
  Junun Sartohadi5
- 1Laboratory of Physical Geography, UMR- Centre National de la Recherche Scientifique 8591, University of Paris 1, Panthéon-Sorbonne, Meudon, France
- 2Laboratoire Image, Ville, Environnement, Université de Strasbourg, UMR 7362, Strasbourg, France
- 3Department of Geography, College of Sciences, University of Canterbury, Christchurch, New Zealand
- 4Laboratorium Geologi Lingkungan dan Hidrogeologi, Fakultas Teknik Geologi, Universitas Padjadjaran, Bandung, Indonesia
- 5Faculty of Geography, Gadjah Mada University, Yogjakarta, Indonesia
One of the main concerns of deciphering tsunami sedimentary records along seashore is to link the emplaced layers with marine high energy events. Based on a combination of morphologic features, sedimentary figures, grain size characteristics, fossils content, microfossils assemblages, geochemical elements, heavy minerals presence; it is, in principle, possible to relate the sedimentary record to a tsunami event. However, experience shows that sometimes, in reason of a lack of any visible sedimentary features, it is hard to decide between a storm and a tsunami origin. To solve this issue, the authors have used the Anisotropy of Magnetic Susceptibility technique (AMS) to characterize the sediment fabric. The validity of the method for reconstructing flow direction has been proved when applied on sediments in the aftermath of a tsunami event, for which the behavior was well-documented like the 2004 Indian Ocean Tsunami (IOT). We present herein an application of this method for a 56 cm thick paleo-deposit dated 4220 BP laying below the soil covered by the 2004 IOT at Lampuuk, SE of Banda Aceh, North Sumatra. We analyzed this homogenous deposit, lacking of any visible structure, using methods of classic sedimentology to confirm the occurrence of a high energy event. We then applied AMS technique that allowed the reconstruction of flow characteristics during sediment deposition. We show that the whole sequence was emplaced by successive uprush phases and that the local topography played a role on the re-orientation of a part of the uprush flow, creating strong reverse current. This particular behavior was reported by eyewitnesses for the 2004 IOT event.
Introduction
The Anisotropy of Magnetic Susceptibility (AMS) of rocks and sediments is certainly one of the most versatile techniques in geology, as it finds usage from Archean rocks (e.g., Borradaile et al., 2012) to contemporary deposits (e.g., Wassmer et al., 2010; Wassmer and Gomez, 2011). The method, known as AMS, based on a first inference that ferromagnetic minerals realign after a rock is subject to deformation, started with the early findings of Graham (1954) on sedimentary rocks and Balsley and Buddington (1960) who proved that the AMS could detect the fabric of minerals in orthogneiss and granites. Since then the method has been recognized as an effective petrofabric tool for granites (Bouchez et al., 1990; Bouchez, 1997; Benn et al., 2001; Esmaeily et al., 2007; Njanko et al., 2010; Raposo et al., 2012). By extension, the method has also been used for other types of magma and lava emplacement, such as mid-oceanic ridges basalts for instance (Veloso et al., 2014).
As mentioned above, sedimentary rocks have also been the subjects of similar research: Graham (1954) used the AMS to evidence the deformation of sedimentary rocks of the Appalachia Mountain (Graham, 1966). The method has then been extended to a variety of sedimentary environment, either consolidated material, e.g., the non-deformed Callovo-Oxfordian argillites of the Paris Basin, France (Esteban et al., 2006), the tectonically impacted marine clays of the Crotone basin, Italy (Macri et al., 2014), deep-sea sediments transport (Housen et al., 2014); or unconsolidated material, e.g., tsunami washover deposits in Indonesia (Wassmer et al., 2010; Wassmer and Gomez, 2011) and New Zealand (Kain et al., 2014), or lake sediments in China (Dong et al., 2013).
The AMS technique reveals the fabric acquired by sediments during deposition, i.e., the statistical common organization of the grains, providing that the grains have an oblong shape. AMS is based on the induction of a magnetic field (H) applied to a small sample of undisturbed sediment. The material exposed then produces an induced magnetic field (M) from which the volumic magnetic susceptibility can be calculated (M = k.H). This volumic magnetic susceptibility can vary along different orientations of the inductor magnetic field H, depending on the various magnetic minerals present in the sample. The induced magnetic field of the sample can be measured from different directions, for example by spinning the sample to the signal source in all three axes. These data characterize the shape of the induced field anisotropy. If this shape is a sphere, the field is perfectly isotropic but usually the field is close to an ellipsoid figured by a long, a short, and an intermediary axis, Kmax, Kmin, Kint. For sedimentary deposits, the maximum susceptibility axis, Kmax, generally parallel to the mean long axis of the individual particles, reflects the internal fabric of the material.
AMS Applied on the 2004 Indian Ocean Tsunami (IOT) Deposits in Banda Aceh
The research team has investigated tsunami deposits using the AMS technique at different locations worldwide, e.g., in Japan, in New Zealand (Kain et al., 2014), along the coast of Morocco, and in Indonesia near Banda Aceh (Wassmer et al., 2010; Wassmer and Gomez, 2011) and in the Sunda Strait (Paris et al., 2014).
The 2004 IOT offers a unique chance to link the flow characteristics over land with the sediment deposits. From the available sedimentary material, Wassmer et al. (2010) have (1) clearly identified tsunami sandy deposits, lying on the often-truncated ante-2004 soil; and (2) linked the sedimentary records to the flood characteristics described by numerous eyewitnesses (Lavigne et al., 2009). Despite the breadth of available data, numerous points remained unveiled, prior to the usage of AMS. Indeed, eyewitnesses agreed on the emplacement of most of the deposits by the landward flow or uprush, but traditional techniques of sediment analysis could not provide convincing corroborating evidence, and especially no recording of the precise wave orientation. Trying to solve this issue, the research team tested several methods, such as deposits peelings, resin impregnations and thin sections in order to derive a proxy of the sediment fabric, but none of these method provided conclusive results, and we therefore turned toward the AMS method to draw conclusion at the fine scale. The combination of AMS with other traditional sediment analysis techniques proved that it was possible:
1) to reconstruct the flow direction of each individual wave of the wave-train that contributed to the sedimentary signature of the event (Wassmer and Gomez, 2011);
2) to evidence that not all the waves have left perennial records, the deposit of the first wave being erased by the second and more energetic wave while the influence of the last waves, with less energy was restricted to the proximal zone Lavigne et al., 2009; Wassmer et al., 2010);
3) to estimate the sediment stock brought by each wave, sorting out the part emplaced after the turbulent front passed through and the part emplaced by the tail of the wave (unpublished data);
4) to identify the sediment sources that provided the material for the sediment recording of the event (Wassmer et al., 2007, 2010);
5) to evaluate, in a bay context, the role played by the refraction/reflexion of the waves along the surrounding shores on the incidence angle of each wave during the event (unpublished data);
6) to reconstruct the characteristics of each wave:
i. identifying the layers emplaced during the different phases of the tsunami swash cycle of the waves, i.e., uprush, slack, or backwash (Wassmer et al., 2010);
ii. retrieving the variations of sedimentation dynamics from base to top for each deposit interval corresponding to the material emplaced by individual waves within the wave train (ibidem);
All these studies helped us to build the knowledge necessary to tackle paleo-tsunami deposits investigation using AMS, for which both topography and flow dynamics are unknown.
Objectives
Building on this extensive broad experience, the present article aims to contribute to the research-body on AMS on unconsolidated sediments, with a central focus on the recording of the 4220 BP thick tsunami deposit near the present-day village of Lampuuk, South Banda Aceh, Sumatra (Wassmer, 2015). The AMS technique, tested, and applied on contemporary deposits will therefore prove to be efficient to characterize sediments deposited by paleo-extreme energy events, such as paleo-tsunami.
Study Material and Location
The very flat coastal plain of Lampuuk is delimited to the North and the North-West by an amphitheater-like morphology realized by the steep lowest slopes of the small mountain range ending Sumatra Island to the NW, and by the small crest line oriented SE-NW closing the plain to the NE (Figure 1). A 800 m large pass interrupts the amphitheater continuity at the level of Lampisang village. This particular morphology had a role in controlling the flow behavior during the 2004 tsunami event.
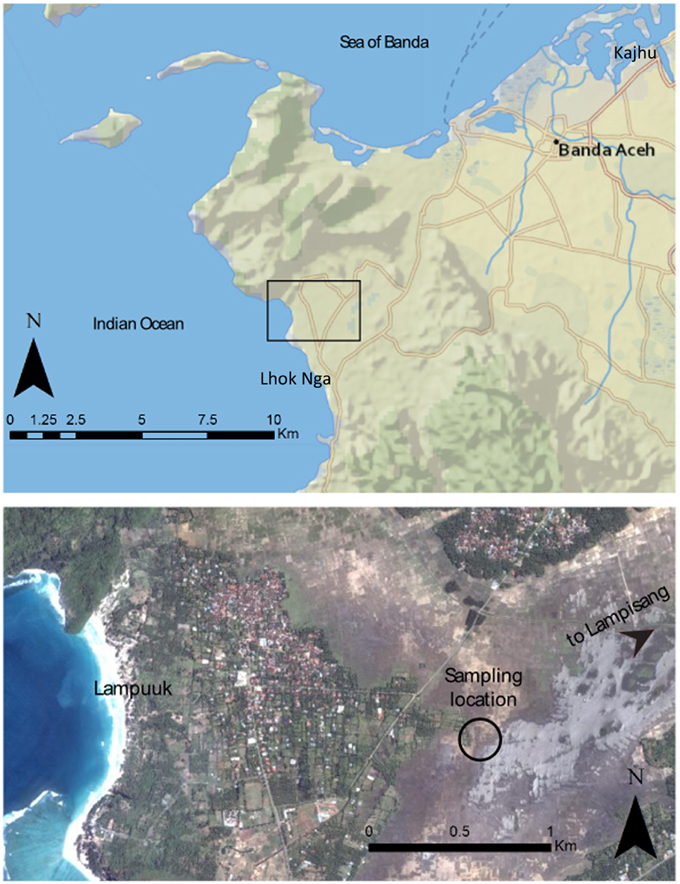
Figure 1. General map of Banda Aceh area, North Sumatra, Indonesia. Black circle corresponds to investigation site.
Investigations carried out at Lampuuk Bay in 2005, 2006, and 2007 allow identifying, below the 25 cm thick ante-2004 soil, a 56 cm thick tsunami deposit displaying the same characteristics than those of the 2004 IOT deposits. This paleo-event, that has been dated 4220 ± 40 BP (Poz. 16331) from wood debris collected at the base of the sediment layer, has never been revealed in this area before (Wassmer, 2015). This finding is most probably to be linked to tsunami deposits of the same period identified in Maldives (Mörner, 2007); in Sri Lanka (Jackson et al., 2008, 2014; Ranasinghage, 2010) and near Padang, West Sumatra (Dura et al., 2011).
Methodology
Field Sampling
The sampling of unconsolidated sediments for AMS analysis is a delicate operation. To ensure reliability of the results, the sampling must be done meticulously when dealing with soft-sediments, the fabric of unconsolidated grains being easily altered during sampling.
During the field work campaign of March 2007, the authors dug a trench for sediment sampling from the wall. The outcrop was reworked using a trowel, until the clinometer attested of perfectly vertical wall. To collect the samples, boxes with a small hole of 1 mm diameter at the bottom—to allow air to escape—were plugged horizontally in identified tsunami layers (Figure 2). A clinometer was used during the process, in order to keep a strict horizontality. Azimuth and plunge of the plugging axis (axis 3) of the box have been noted on the box side (permanent ink) as well as the axis 3 direction, and the two other axes of the box (1 and 2).
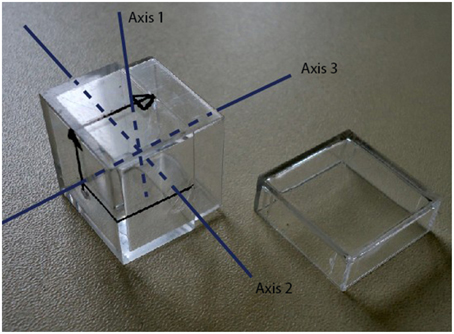
Figure 2. AMS sampling box.
The removal of the box from the wall must be done with the outmost care in order to avoid any disturbance of the structure of the sample. The material, once leveled to the rim, the box is sealed with a tape in order to keep its moisture, which guarantees the best preservation of the fabric. The sampling boxes must be propped up in a hard-box and away from any shock before laboratory analysis. The time slot between sampling and laboratory measurements must be as short as possible.
Laboratory Analysis and Data Representation
Grain Size
Before analysis, organic matter was removed from the samples with hydrogen peroxide, then washed with KCl or HCl to remove the flocculating ions, and agitated in distilled water and sodium hexametaphosphate during 4–6 h. Particles of size exceeding 2000 μm were separated thanks to the help of a T-34 sieve size. From normal samples, grain size measurement was performed using a Beckman Coulter LS-230 (Range: 0.04 to 2000 μm) at the EOST Laboratory, University of Strasbourg, France.
The data are represented by cumulative grain size curves (Figure 5, Section Sedimentology of the 4220 BP Tsunami).
Grain size parameters were calculated: Mean grain size (μm, Trask); Sorting (ô, Folk and Ward) and Skewness (mm, Trask). Each parameter was plotted vs. depth (Figure 4, Section Section Description) in order to enlight the hydrodynamic characteristics variations along the tsunami event.
Anisotropy of Magnetic Susceptibility
The AMS samples were analyzed in Strasbourg using an AGICO MFK1A Kappabridge® equipped with an automatic spinner. During the spinning on each of the three axes, 64 measurements are performed and allow visualizing the anisotropy ellipsoid characterized by three susceptibility tensors, each normal to the others: Kmax, Kint, and Kmin. Data are represented by an equal angle, lower hemisphere projection of the larger principal axis (Kmax) of the AMS tensor. On this lower hemisphere (Figure 3), each point is determined by the intersection of an axis passing by the center of the hemisphere and reflecting the magnetic fabric or the sediment fabric. Considering a horizontal flow, the plunge, and azimuth value of the Kmax axis mimics the upstream imbrications of sand grains. In consequence for sample 1, with an azimuth due North and a plunge of 23° to the North the assumed direction of the flow responsible for the fabric is oriented to the South. For sample 2, with an azimuth of 232° and a 0° plunge, the Kmax axis is horizontal and cross cuts the equatorial circle at 232° and 52° (Figure 3). Additional anisotropy parameters are determined by a combination of the values of the three main axis of the anisotropy ellipsoid (F or foliation parameter, L or lineation parameter, T or shape parameter, Fs or alignment parameter, q or ellipsoid shape factor). They reflect the shape of the ellipsoid and allow approaching the hydrodynamics conditions during sediment deposition (Tarling and Hrouda, 1993).
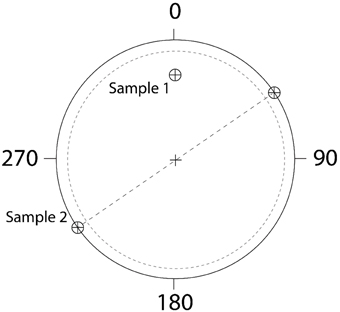
Figure 3. Example of AMS data projection. The confidence zone between 0° to 5° is limited by the dashed circle.
The sedimentary material of the deposit is made of almost 100% of quartz grains containing some very small individual black grains. This very weak content has been reported by Costa et al. (2015), for the same area of Lampuuk—Lhok Nga, who mentioned values ranging from 0.352 to 0.003%. The low bulk magnetic susceptibilities (76.10 to 149.95 10−6 SI) reflect a lack of ferromagnetic particles.
Weaknesses of the Method
Sampling Related
a) Careful sampling is a key point for the accuracy of AMS measurement. The sampling boxes must be plugged perfectly horizontally otherwise a light tilting of the box might induce a bias in the tilting interpretation. As a horizontal plugging is sometimes hard to realize, we interpret with caution the plunge values located within the bracket 0° to 5° (Figure 3).
b) Sampling box size: the 20 mm.-side of the sampling boxes may constitute a limit for sampling layers thinner than 20 mm. Within a tsunami sequence, sediment layers emplaced are sometimes very thin in reason of a weak deposition or a post-depositional scouring. For fine sediments displaying a good cohesion we circumvent this issue in uncovering the surface of the thin layer and we plugged successively twice or three times in the sediment in order to fill the box. The repetition of this unconventional technique (three plugging for a single sample) five times on the same layer gave results perfectly identical.
Material Related
a) Sampling is not possible on coarse sand: unsorted material containing coarse sands or gravels cannot be sampled. If the box edge meets a granule during plugging, a perturbation of the fabric of the sample may occur.
b) Sampling on moist sediments only: In order to maintain a good cohesion of the sediments during plugging well as between sampling and analysis, sediments must be moist. In dry conditions, a water mister can be used to slowly moist the outcrop.
Interpretation Related
a) Flow direction is retrieved from the overall sediment fabric but previous research (Rusnak, 1957; Allen, 1964; Rees, 1968) show that depending on the flow velocity, the grains long axes will parallel or be normal to the flow direction prevailing during emplacement. This issue is largely developed below in Section AMS Interpretation of the Flow Direction.
Results
Section Description (Figure 4)
The deposit is made of a 56 cm thick layer of uniform medium sand, which lacks visible sediment structure and lies on a thick black paleo-soil (paleo-soil 1). At the base of the deposit, just above this paleo-soil 1, abundant pieces of broken wood were retrieved, with elongated pieces following North-South orientation. Retrieved tree trunk- and branch- splinters showed diameters ranging from 1 to 5 cm with maximum length of 30 cm. Within and above this 10–20 cm thick layer of debris, abundant in bioclasts (coral and shells) incorporated in gray muds, lays a mixed silts (57%) and medium sands (36%) unit characterized by numerous rip-up clasts of gray clay with an average size of 4–5 cm. Above this 10–20 cm basal layer, the first 28 cm are composed of homogenous structureless medium sands, brownish-pale colored with locally browner patches. The deposit color evolves vertically to light gray, gaining a yellowish color in the 10 last cm below the ante 2004 IOT soil (palaeosoil 2). The color variation is not accompanied by any visual grain size variation. Within the palaeosoil 2, the texture corresponds to sandy loam at the base evolving progressively to clay loam to the top.
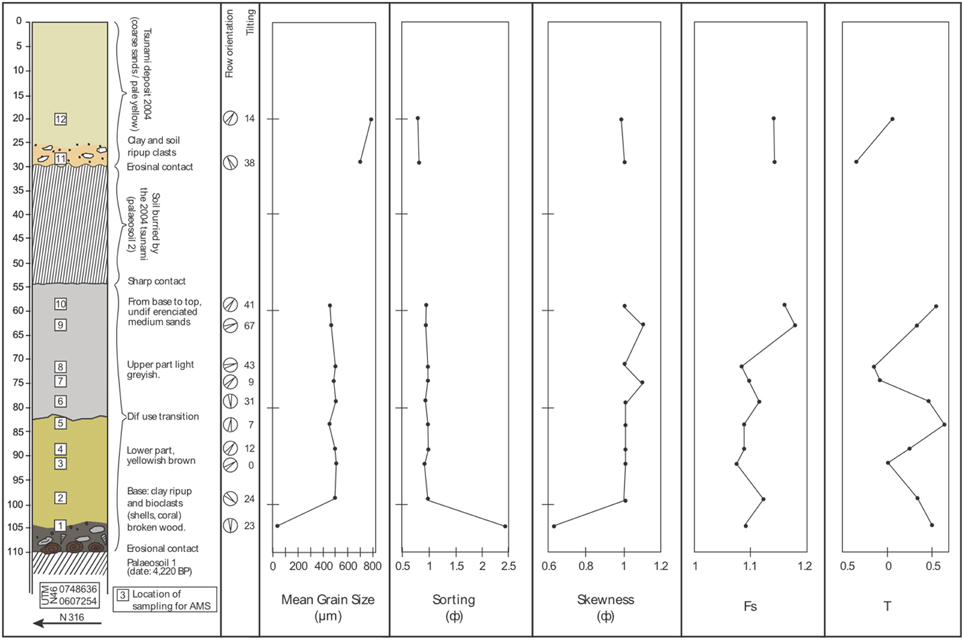
Figure 4. Section description showing the emplacement of sampling boxes.
Sedimentology of the 4220 BP Tsunami
The base of the section is made of silty material (mean grain size: 35 μm), very poorly sorted, and characterized by a positive skewness (very coarse skewed). Above, the mean grain size of the whole paleo-tsunami section ranges between 450 and 500 μm, and these moderately sorted medium sands represent 96–98% of the deposit. The skewness for all the section is again positive (very coarse skewed). The grain size cumulative curves of the 4220 BP deposit (Figure 5) show a curve shifted to silts for sample 1, at the very base. The curves for the samples 2–10 are almost perfectly superimposed and correspond to medium sands.
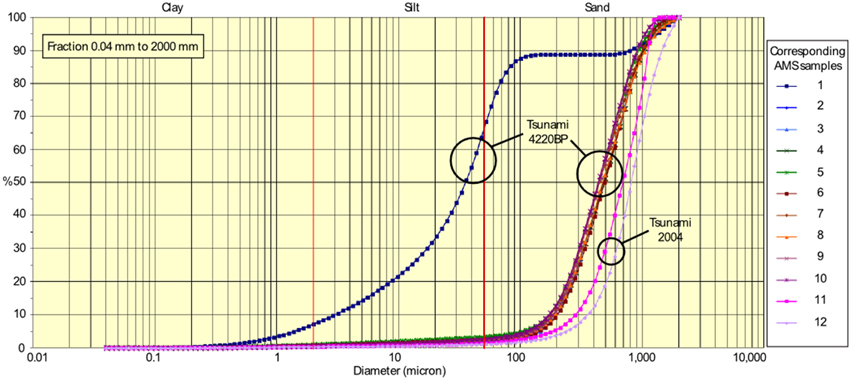
Figure 5. Cumulative grain size curves for 4220 BP and 2002 tsunamis deposits.
Sediment morphoscopy has been performed on the sands of the 4220 BP deposit and compared to the morphoscopy of the dune material which constituted the main sediment source for the 2004 event (Wassmer et al., 2007). The material of the deposit is composed almost exclusively by quartz material. The finer fraction (63–125 μm) is constituted by angular clasts. Angular clasts are present in the medium fraction (250–500 μm) but sub-angular grains dominate. The grain surfaces are mainly matted but the rounded angles are generally glossy. The coarser mode (1000–1600 μm) is represented by rounded to well-rounded grains displaying the matt surface characteristic of aeolian sands. Their most convex parts (rounded angles) are glossy. The bioclast content is very weak and only rare sponge spicules and foraminifera were identified. Compared to the potential source of the dune material, the proportion of mineral/bioclast content turns around 50–50%. The main part of the material is well-rounded and within the mineral part solely, coarse matt grains appears to be more frequent and do not display glossy convex surfaces.
Passega's CM diagram (Figure 6) is used to assess water flooding energy variations. The homogeneity of the processes revealed by grain size analysis is also reflected by the CM diagram that shows that the 4220 BP paleo-tsunami section was deposited by a strong energy flow under rolling and ground suspension conditions without evidence of any variations along the deposit emplacement at the exception of the silts deposited at the base.
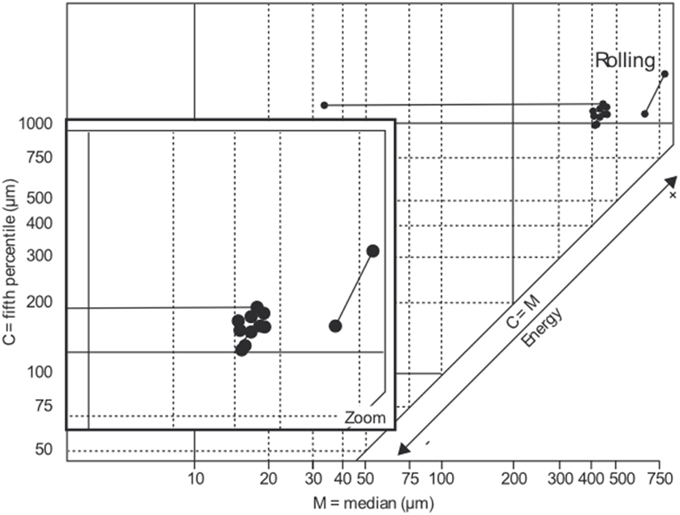
Figure 6. Passega CM diagram.
The analysis of the main physical characteristics of the deposit suggests the following conclusions:
i) The material originates from a unique and moderately-sorted sediment source, and most probably from the sand dunes located on the sea front:
ii) The material emplaced constituted exclusively by mineral sand grains underwent a strong winnowing action before deposition allowing to clear the sand dune material from its original bioclast content (50% of the dune material);
iii) The deposit reflects an apparent homogeneity of the processes from the base to the top during the emplacement of the whole 4220 BP sequence at the exception of the very base. The single and uniform transport and deposition process is reflected by the almost perfect superimposition of the grain size curves and a positive skewness from base to top of the deposit (Vijaya Lakshmi et al., 2010);
iv) The lack, within the deposited sequence, of any layer characterized by the presence of fine terrigenous material invokes a single uprush sequence.
v) The CM diagram strongly suggests that the material was deposited under high energy (Figure 6).
Even if these insights appear as significant for the understanding and reconstruction of the palaeo tsunami, the detailed behavior of the flow (directions, energy, and velocity variations) cannot be assessed only from the sedimentary characteristics of the deposits.
AMS Technique Contribution
Preamble
The ellipsoid shape factor q = (Kmax − Kint).(Kmax + Kint)/(2 − Kmin) is an indicator of either a depositional or a tectonic fabric. A value less than 0.7 indicates a non-deformed sediment (primary fabric) while a value higher than 0.7 suggests that a tectonic activity altered the primary fabric (Hamilton and Rees, 1970). For the 4220 BP deposit, q is ranging below 0.7 with the exception of samples 8 and 9 that are slightly above this value. Hence considering that the primary fabric was not modified by post-depositional processes, the AMS approach can be used on these sediments.
Reconstruction of Flow Behavior
Interpretation of the results (Figures 4, 7) allow proposing a reconstruction of the water flow behavior. From the beginning to the end of the 4220 BP event, six phases can be identified as follows (the number in brackets corresponds to sample number):
1. Uprush wave (0). The AMS was impossible to measure at the base of the deposits due to the material heterogeneity. We assume however, from field evidence that the first wave was heading for North with an energy strong enough to bring numerous marine bioclasts and coarse sands, to break trees, and align the debris with a rough North-South orientation and to remove rip-up clasts of palaeosoil 1.
2. First backwash phase: southbound first (1), then to SE (2).
3. Slack stage or very slow motion, to SE (see ® limits of the method: rolling/tilting) no evidence of tilting (3)
4. Second uprush stage, to the NNE first (4) and then due N (5).
5. Backwash stage to the South (6).
6. Third uprush stage to the NNE (7), to the NE (8 and 9) and to the NNE (10).
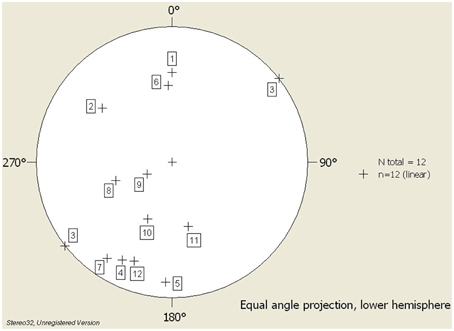
Figure 7. Equal angle, lower hemisphere projection of the Kmax for each layer investigated: 1-10 from bottom to top of the paleo-tsunami deposit, 11 and 12 for the 2004 IOT tsunami deposit.
If one considers the 24 cm thick soil developed from the paleo-tsunami deposit (paleo-soil 2), the sedimentary sequence emplaced by the 4220 BP event increases in thickness up to 65–70 cm. The clay loam texture of the upper part of the paleo-soil corresponds to the last slack and backwash stages, when the high concentration of fines in suspension resulting of the high turbulence of the water begins to settle in a laminar dominated flow. This fine material has been subject to paedogenesis processes. Bioturbation has erased the original fabric making useless an AMS approach.
Reconstructing Other Characteristics of Emplacement Processes from AMS
Besides the flow direction that constitutes the major contribution of AMS, additional parameters, calculated from the intensities of axes of the anisotropy ellipsoid, or from their logarithmic values, allow us to precise some characteristics of the emplacement process (Figure 4: T, Fs) The shape parameter (T) quantifies the relative role of lineation and foliation, i.e., indicates a deposition under the domination of settling or traction. The 4220 BP sediments have been emplaced mainly under a settling process (foliation dominant) with the exception of samples 7 and 8 where lineation dominates.
The alignment parameter (Fs), related to the intensity of the Kmax, is supposed to increases with the energy of the bottom currents (de Menocal, 1986; Park et al., 2000). It can be a sensitive recorder of paleo-velocity variations (Ellwood and Ledbetter, 1977) as for the 4220 BP tsunami (Figure 4). During the backwash stage a slight velocity increase (1) to (2) can be noted before a velocity drop (3). The uprush is rather low (4) and (5) while the following backwash is characterized by a higher velocity. The second uprush phase, first corresponds to a rather weak flow (7) and (8) before an acceleration of the flow (9) and (10).
The angle of imbrications being larger for a turbulent flow over a rough bottom (coarse grain size) than for a turbulent flow over a smooth bottom (small grain size; Rusnak, 1957), the plunge value (Figure 4) is considered to be related to the velocity of the flow and to the density of the particles in the bottom traction carpet. The 4220 BP deposit displays strong tilting values ranging from 12° to 67° with the exception of three weaker values. This is consistent with a grain inertia regime at the base of the water column (Hamilton et al., 1968) and with the medium to coarse grain size of the material.
The 2004 IOT deposit is thinner than the 4220 BP deposit. The sedimentary characteristics of its base reveal the domination of traction under high velocity current during deposition. Within the upper part of the deposit foliation dominates reflecting a velocity drop accompanied by an important settling under a stable current.
Discussion
Reconstruction of Water Behavior Combining Sedimentology and AMS
If we take into account the data provided by sedimentology and AMS, it is possible to reconstruct hydrodynamic conditions that prevailed during this paleo high-energy flooding on the coastal plain of Lampuuk (Figure 4).
This 4220 BP event was composed of:
a) A first northward oriented uprush; the strong flow is only attested by the abundance, composition and orientation of the debris laying on the paleo-soil 1;
b) A backwash flow oriented southward (1) with low velocity currents, followed by an increasing velocity of bottom currents with settling processes (2). Water acceleration in the proximal domain has been reported frequently by eyewitnesses at the end of the backwash stage of the 2004 event.
c) A weak flow to the southeast with an equilibrium between settling and traction corresponding to the end of the backwash stage (3);
d) A drastic increasing of sediment settling during a rather low velocity uprush phase [(4) and (5)];
e) Bottom currents increasing during this backwash phase (6) dominated by settling;
f) Last uprush phase recorded: first traction dominates [(7) and (8)] with a rather weak current then settling increases strongly [(9) and (10)] under conditions of strong bottom current. This part of the deposit may come from the contribution of different pulsations, the variations in Kmax azimuths thus reflecting wave refraction or diffraction along the bay.
Comparison with the 2004 Tsunami
The homogeneity of the 4220 BP deposit reflected by Figure 6 can be explained by two elements of local context:
1. A unique source for the sediments: by analogy with the 2004 event, the 15 m-height sand dunes may have been shaved to the ground by the two first waves, the moderately sorted sand stock being spread on the wide flat coastal plain. The grain size distribution of sand collected on a remnant part of a dune eroded during the 2004 event, and cleared out of bioclasts (constituting around 50% of the material), almost perfectly superimposes to the grain size distribution of sediments emplaced by the 2004 tsunami (lacking of any bioclast in this area in reason of an efficient winnowing action of the turbulent waves). Moreover, the sand morphoscopy analysis from the remnant parts of the dunes and the deposits of 2004 confirm that the sands are similar to the 4220 BP paleo-deposits. Therefore, the source of the paleo-deposit had likely similar characteristics than the 2004 event, i.e., the material mainly came from coastal sand dunes. This finding is consistent: (i) with the sedimentary records of the 2004 tsunami that were composed of moderately sorted sands with a mean grain size around 700–800 μm and very coarse skewed provided at 88–100% by sand from the dunes eroded on the sea front (Wassmer et al., 2007), and (ii) with the 2004 oral testimony of a New Zealander eyewitness who describes a huge yellowish-colored “geyser” of water and sand, higher than the dunes row, produced by the two first waves impacting and eroding the dunes (ibidem).
2. The energy of the surging waves in the investigated zone: on the eastern coast of Banda Aceh, Wassmer et al. (2010) showed that the energy of the flooding decreased landward, producing a progressive differentiation in the sedimentary signature. Near shore, in the proximal zone, the deposits are coarse and undifferentiated. In the distal zone, far inland, near the slack zone or “point of zero velocity prior to backwash flow” according to Dawson and Stewart (2007), fining upward sequences are superimposed and correspond to the record of individual successive waves. Lampuuk's palaeo tsunami site was located within the proximal zone, on the very flat coastal plain.
Huge Storm or Tsunami?
If the wood debris and the bioclasts abundance at the base of the sequence could be linked to a high-energy event, such as a catastrophic storm or a tsunami, the presence of large pieces of broken tree trunks and the clay rip-up clasts (Figure 8) strictly point toward a tsunami origin. The distance to the sea also calls for a tsunami hypothesis: 1.65 km at present day, this distance was probably slightly longer for thousands years ago, in reason of a local subsidence mentioned by Meltzner et al. (2006, 2010). Kawata et al. (2005) showed a co-seismic subsidence of 20 to 60 cm in Banda Aceh for the 2004 IOT, while Dura et al. (2011) state that the coastal lowlands of western Sumatra preserve an evidence of two Holocene ruptures (4200 and 3100 BP) of the Mentawai segment of the Sunda mega-thrust and that these ruptures resulted in a co-seismic subsidence of the coastline. The distance from the sea was therefore more important 4220 years BP at Lampuuk, rendering the site out of reach of the storm influence.
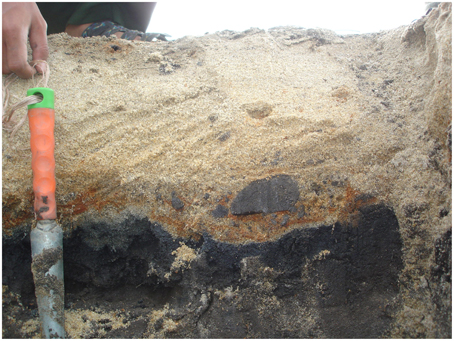
Figure 8. Contact paleo-soil 2 and 2004 IOT deposit showing rip-up clasts formation.
Additionally, the 2004 tsunami deposited coarser sands than the 4220 BP tsunami, suggesting a possible higher energy tsunami. This is also attested by the erosive basal contact with the soil and the presence of numerous rip-up clasts of soil within the sequence (Figures 4, 8). One of the characteristics of tsunami deposits is the landward fining grain size of the sediments (Kortekaas and Dawson, 2007; Morton et al., 2007; Paris et al., 2007; Jankaew et al., 2008). If the 2004 and 4220 BP tsunamis emplaced at the same site material of different grain size in all likelihood from the same sea-front dunes (450–500 μm for the 4220 BP event and 700–800 μm for 2004 IOT), source, then it is reasonable to consider that when the 4220 BP tsunami took place the seashore was more distant.
In summary, in giving access to the flow direction that prevailed during sediment emplacement, the application of AMS technique to unconsolidated sandy material related to paleo-tsunamis drastically increases our knowledge about the characteristics of such events.
The 2004 tsunami flooding orientation map was realized post-event in the same area of Lampuuk on the base of thousands measurements we performed on the orientation of elongated material laying on the ground as tree trunks, poles, fence posts (Figure 9). This map, which mainly reflects the behavior of the last energetic wave of the 2004 tsunami, shows a good correlation with the last recorded energetic waves of the paleo-tsunami (8, 9, and 10). The orientation of the 2004 first waves recorded (11 and 12) is well conforms to the orientation of the 4220 BP first waves (0, 4, and 5). In 2004 the first wave was followed by a receding and then, the following waves pushed inland without receding between them. At the end a strong backwash occurred. AMS data performed on the paleo-deposit show that the first wave (0) was followed by a backwash oriented first to the South (1) then to the southeast (2). This latter direction was also reported in 2004 by eyewitness that described the whirling movement of the water along the foot of the western slopes of the bay, guided by the amphitheater-like topography of the foothills (Figure 1), and the following receding toward southeast. The second receding (6) that is found for the paleo-event is likely due to a contrary bottom current oriented southeast initiated by the same whirling movement described in 2004 resulting from the strong impact of the second wave (34 m in this zone in 2004; Lavigne et al., 2009). The deposit emplaced by these two “apparent” backwash stages are then more related to impeded surging waves, producing a strong contrary seaward current, than actual backwash stages. This explanation is consistent with the homogeneity of the grain size and the positive skewness that otherwise would have been modified by a real backwash bringing a mixture of sandy and terrigenous material. Such behavior is, in this context, site dependant.
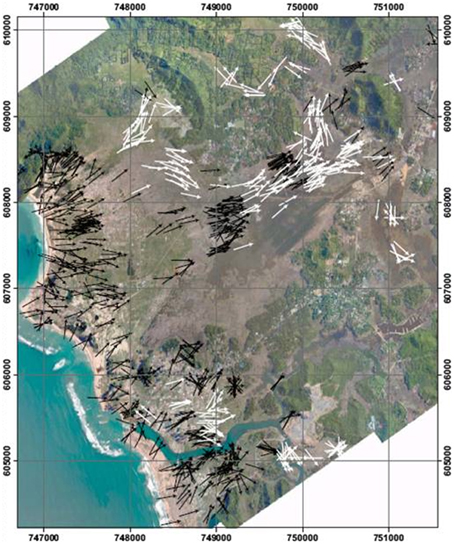
Figure 9. 2004 IOT flooding directions evidenced from the orientation of elongated material laying on the ground after the event as tree trunks, poles, fence posts (from Grancher et al., 2011).
AMS Interpretation of the Flow Direction
As presented above (section AMS) the flow direction is retrieved from the overall sediment fabric but previous research (Rusnak, 1957; Allen, 1964; Rees, 1968) show that depending on the flow velocity, the grains long axes will be parallel or normal to the flow direction prevailing during emplacement. In fact the general orientation of the long axis of the particles depends on the flow strength. For relatively strong currents (usually turbulent), the rolling and sliding of the prolate particles lead to their long-axis perpendicular to the flow direction, whereas a flow-parallel orientation dominates for weaker currents (laminar flow). Determination of the bulk orientation of the long axis of magnetic prolate particles (Kmax) through AMS measurements leads to similar conclusions (Hamilton and Rees, 1970; Hrouda, 1982; Tarling and Hrouda, 1993). Consequently, the orientation of Kmax is parallel to the direction of weak or laminar flow, whereas it is normal for stronger currents (Granar, 1958). This may render the flow directions evidenced by Kmax hard to interpret.
For the present study, informations from the Kmax were sufficiently clear (regarding the topographical context and the flooding behavior of the 2004 tsunami on the same area) to extract orientation data. In order to avoid misinterpretations in considering the flow direction as parallel to the long axis Kmax of the susceptibility ellipsoid, several authors have shown that the pole of the magnetic foliation (Kmin) points out the flow direction regardless of the depositional process, shingling, or rolling (Palmer et al., 1996; Ort et al., 2003; Giordano et al., 2008; Laberge et al., 2009; Willcock et al., 2014).
However, the method has several limitations, and results can't be yield from deposits modified by bioturbation and paedogenesis. The sediment records of high energy events like tsunamis along sea shore are prone to a more or less quick vegetation recovery, depending on the climate and the environmental conditions. This lead to a progressive loss of information, with soil construction, about the deposit characteristics for the upper part of the sequence deposited. This loss affected 20% of the original deposit thickness for the 4220 BP event, but we measured a loss of 14% from a 30 cm thick deposit in Kajhu area 5 years only after the 2004 IOT tsunami due to an active paedogenesis under tropical conditions).
Conclusions
The present contribution has demonstrated that the AMS technique applied to unconsolidated sediments can provide important proxies for paleo-events reconstructions, for which sedimentary signatures are preserved. In the present study, a 4220 BP tsunami deposit was clearly identified and its characteristics confirmed it to be a significant predecessor comparable to the 2004 Boxing Day tsunami. The AMS results helped the reconstruction of the flooding characteristics (orientation, energy, uprush flow patterns) and most especially the identification of at least three distinctive uprush pulsations during the paleo-event. AMS technique has contributed to show that the 4220 BP and the 2004 events behaved very similarly over the coastal plain of Lampuuk. The similarity here is most probably linked to the topographical context of the bay that controlled the uprush flow directions. Consequently, retrieved paleo-flow patterns from AMS also provided keys to unveil past-topographic features that would have disappeared.
Conflict of Interest Statement
The authors declare that the research was conducted in the absence of any commercial or financial relationships that could be construed as a potential conflict of interest.
Acknowledgments
Field work has been carried out in the frame of the Tsunarisk programme (coordinators: FL and R. Paris), funded by the French “Délégation Interministérielle pour l'Aide Post-tsunami” (DIPT). The authors are in debt to the reviewers who provided constructive comments, especially to Jean-Luc Bouchez and Hervé Regnauld, who conducted a very meticulous reading of the manuscript and contributes to significantly improve the original manuscript. We would like to express our gratitude to the editor for his prompt handling. The research has also been supported by Martine Trautmann, who helped with the sediment grain-size analysis.
References
Allen, J. R. L. (1964). Primary current lineation in the lower Old Red Sandstone (Devonian), Anglo-Welsh Basin. Sedimentology 3, 89–108. doi: 10.1111/j.1365-3091.1964.tb00635.x
Balsley, J. R., and Buddington, A. F. (1960). Magnetic susceptibility and fabric of some Adirondack granites and orthogneisses. Am. J. Sci. Bradley Vol. 258-A, 6–20.
Benn, K., Paterson, S. R., Lund, S. P., Pignotta, G. S., and Kruse, S. (2001). Magnetic fabrics in batholiths as markers of regional strains and plate kinematics: an example of the Cretaceous Mt Stuart Batholith. Phys. Chem. Earth A 26, 343–354. doi: 10.1016/S1464-1895(01)00064-3
Borradaile, G. J., Genviciene, I., and Charpentier, L. (2012). Magnetic fabrics in Archean granitoids, Northwestern Ontario: isolation of accessory and matrix contributions by inspection of AMS data. Tectonophysics 514–517, 115–122. doi: 10.1016/j.tecto.2011.10.011
Bouchez, J. L. (1997). “Granite is never isotropic: an introduction to AMS studies of granitic rocks,” in Granite: From Segregation of Melt to Emplacement Fabrics, eds J. L. Bouchez, D. H. W. Hutton, and W. E. Stephens (Dordrecht: Kluwer Academic Pub), 95–112.
Bouchez, J. L., Gleizes, G., Djouadi, T., and Rochette, P. (1990). Microstructure and magnetic susceptibility applied to emplacement kinematics of granites: the example of the Foix pluton (French Pyrenees). Tectonophysics 184, 157–171. doi: 10.1016/0040-1951(90)90051-9
Costa, P. J. M., Andrade, C., Cascalho, J., Dawson, A. G., Freitas, M. C., Paris, R., et al. (2015). Onshore tsunami sediment transport mechanisms inferred from heavy mineral assemblages. Holocene 25, 795–809. doi: 10.1177/0959683615569322
Dawson, A. G., and Stewart, I. (2007). Tsunami deposits in the geological record. Sediment. Geol. 200, 166–183. doi: 10.1016/j.sedgeo.2007.01.002
de Menocal, P. (1986). A magnetic Signature of Bottom-Current Erosion. MS thesis, University of Rhode Island.
Dong, J., Gao, R., Wang, Y., Zhang, S., Yao, P., Chi, Z., et al. (2013). Magnetic fabric study of late holocene sediments in huangqihai lake, inner mongolia and its sedimentary significance. Acta Geol. Sin. (Engl. Edn.) 87, 186–196. doi: 10.1111/1755-6724.12040
Dura, T., C. M., Rubin, H. M., Kelsey, B. P., Horton, A., Hawkes, C. H., Vane, M., et al. (2011). Stratigraphic record of Holocene coseismic subsidence, Padang, West Sumatra, J. Geophys. Res. 116, B11306. doi: 10.1029/2011JB008205
Ellwood, B. B., and Ledbetter, M. T. (1977). Antartic bottom water fluctuations in the Vema channel: effects of velocity change on particle alignment and size. Earth Planet. Sci. Lett. 35, 189–198. doi: 10.1016/0012-821X(77)90121-2
Esmaeily, D., Bouchez, J. L., and Siqueira, R. (2007). Magnetic fabrics and microstructures of the Jurassic Shah-Kuh granite pluton (Lut Block, Eastern Iran) and geodynamic inference. Tectonophysics 439, 149–170. doi: 10.1016/j.tecto.2007.04.002
Esteban, L., Bouchez, J.-L., and Trouiller, A. (2006). The Callovo-Oxfordian argillites from the eastern Paris Basin: magnetic data and petrofabrics. Compte Rendus Geosci. 338, 867–881. doi: 10.1016/j.crte.2006.03.011
Giordano, G., Porreca, M., Musacchio, P., and Mattei, M. (2008). The Holocene Secce di Lazzaro phreatomagmatic succession (Stromboli, Italy): evidence of pyroclastic density current origin deduced by facies analysis and AMS flow directions. Bull. Volcanol. 70, 1221–1236. doi: 10.1007/s00445-008-0198-x
Graham, J. W. (1954). Magnetic susceptibility anisotropy, an unexploited petrofabric element. Bull. Geol. Soc. Am. 65, 1257–1258.
Graham, J. W. (1966). “Significance of magnetic anisotropy in Appalachian sedimentary rocks,” in The Earth beneath the Continents. Geophysical Monographs 10, eds J. S. Steinhart and T. J. Smith (Washington: AGU), 627–648.
Granar, L. (1958). Magnetic measurements on Swedish varved sediments. Arkiv foer geofysik 3, 1–40. doi: 10.1029/2011JB008205
Grancher, D., Bar-Hen, A., Paris, R., Lavigne, F., Brunstein, D., and Wassmer, P. (2011). “Interpolation spatiale de données circulaires: application au tsunami du 26 décembre 2004,” in Tsunarisque: Le Tsunami du 26 Décembre 2004 A Aceh, Indonésie. eds F. Lavigne and R. Paris (Paris: Publications de la Sorbonne), 49–58.
Hamilton, N., Owens, W. H., and Rees, A. I. (1968). Laboratory experiments on the production of gain orientation in shearing sand. J. Geol. 76, 465–472. doi: 10.1086/627344
Hamilton, N., and Rees, A. I. (1970). “The use of magnetic fabric in paleocurrent estimation,” in Paleogeophysics, ed S. K. Runcorn (London: Academic Press), 445–464.
Housen, B. A., Novak, B., Kitamura, Y., Kanamatsu, T., and Kawamura, K. (2014). Magnetic fabric analysis as a method for determining sediment transport and deposition in deep sea sediment. Mar. Geol. 356, 19–30. doi: 10.1016/j.margeo.2013.12.001
Hrouda, F. (1982). Magnetic anisotropy of rocks and its application in geology and geophysics. Geophys. Surv. 5, 37–82. doi: 10.1007/BF01450244
Jackson, K. L., Eberli, G. P., Amelung, F., McFadden, M. A., Moore, A. L., Rankey, E. C., et al. (2014). Holocene Indian ocean tsunami history in Sri Lanka. Geology 42, 859–862. doi: 10.1130/G35796.1
Jackson, K. L., Eberli, G. P., Rankey, E. C., Amelung, F., and Moore, A. L. (2008). “High recurrence rate of paleotsunamis in southeastern Sri Lanka,” in Abstract Volume of the Eos Trans. AGU Fall Meeting, (San Francisco, CA).
Jankaew, K., Atwater, B. F., Sawai, Y., Choowong, M., Charoentitirat, T., Martin, M. E., et al. (2008). Medieval forewarning of the 2004 Indian Ocean tsunami in Thailand. Nature 455, 1228–1231. doi: 10.1038/nature07373
Kain, C. L., Gomez, C., Hart, D. E., Wassmer, P., Goff, J., and Starheim, C. (2014). Assessing topographic controls on flow direction in whashover deposits using measurements of Magnetic Susceptibility. Mar. Geol. 350, 16–26. doi: 10.1016/j.margeo.2014.01.010
Kawata, Y., Tsuji, Y., Sugimoto, Y., Hayashi, H., Matsutomi, H., Okamura, Y., et al. (2005). Comprehensive Analysis of the Damage and its Impact on Coastal Zones by the 2004 Indian Ocean Tsunami Disaster. Report, Disaster Prevention Research Institute, University of Kyoto.
Kortekaas, S., and Dawson, A. G. (2007). Distinguishing tsunami and storm deposits: an example from Martinhal, SW Portugal. Sediment. Geol. 200, 208–221. doi: 10.1016/j.sedgeo.2007.01.004
Laberge, R. D., Porreca, M., Mattei, M., Giordano, G., and Cas, R. A. F. (2009). Meandering flow of a pyroclastic density current document by the anisotropy of magnetic suseptibility (AMS) in the quartz latite ignimbrite of the Pleistocene Monte Cimino volcanic centre (central Italy). Tectonophysics 466, 64–78. doi: 10.1016/j.tecto.2008.09.009
Lavigne, F., Paris, R., Grancher, D., Wassmer, P., Brunstein, D., Vautier, F., et al. (2009). Reconstruction of Tsunami Inland propagation on december 26th, 2004 in banda aceh, indonesia, through field investigations. Pure Appl. Geophys. 166, 259–281. doi: 10.1029/2011JB008205
Macri, P., Speranza, F., and Capraro, L. (2014). Magnetic fabric of Plio-Pleistocene sediments from the Crotone fore-arc basin: insights on the recent tectonic evolution of the Calabrian Arc (Italy). J. Geodynam. 81, 67–79. doi: 10.1016/j.jog.2014.07.002
Meltzner, A. J., Sieh, K., Abrams, M., Agnew, D. C., Hudnut, K. W., Avouac, J. P., et al. (2006). Uplift and subsidence associated with the great Aceh-Andaman earthquake of 2004. J. Geophys. Res. 111, B02407. doi: 10.1029/2005JB003891
Meltzner, A. J., Sieh, K., Chiang, H.-W., Shen, C.-C., Suwargadi, B. W., Natawidjaja, D. H., et al. (2010). Coral evidence for earthquake recurrence and an AD1390–1455 cluster at the south end of the 2004 Aceh–Andaman rupture. J. Geophys. Res. 115:B10402. doi: 10.1029/2010JB007499
Mörner, N. A. (2007). Sea level changes and tsunamis. environmental stress and migration over the seas. Int. Asienforum. 38, 353–374.
Morton, R. A., Gelfenbaum, G., and Jaffe, B. E. (2007). Physical criteria for distinguishing sandy tsunami and storm deposits using modern examples. Sediment. Geol. 200, 184–207. doi: 10.1016/j.sedgeo.2007.01.003
Njanko, T., Nedelec, A., Kwekam, M., Siqueira, R., and Esteban, L. (2010). Emplacement and deformation of the Fomopea pluton: implication for the Pan-African history of Western Cameroon. J. Struct. Geol. 32, 306–320. doi: 10.1016/j.jsg.2009.12.007
Ort, M. H., Orsi, G., Pappalardo, L., and Fisher, R. V. (2003). Anisotropy of magnetic susceptibility studies of depositional processes in the Campanian Ignimbrite, Italy. Bull. Volcanol. 65, 55–72. doi: 10.1007/s00445-002-0241-2
Palmer, H. C., Macdonald, W. D., Gromme, C. S., and Ellwood, B. B. (1996). Magnetic properties and emplacement of the Bishop Tuff, California. Bull. Volcanol. 58, 101–116. doi: 10.1007/s004450050129
Paris, R., Lavigne, F., Wassmer, P., and Sartohadi, J. (2007). Coastal sedimentation associated with the December 26, 2004 tsunami in Lhok Nga, west Banda Aceh (Sumatra, Indonesia). Mar. Geol. 238, 93–106. doi: 10.1016/j.margeo.2006.12.009
Paris, R., Wassmer, P., Lavigne, F., Belousov, A., Belousova, M., Iskandarsyah, T. Y. W. M., et al. (2014). Coupling eruption and tsunami records: the 1883 Krakatau case-study, Indonesia. Bull. Volcanol. 76:814. doi: 10.1007/s00445-014-0814-x
Park, C. K., Doh, S. J., Suk, D. W., and Kim, K. H. (2000). Sedimentary fabric on deep-sea sediments from KODOS area in the eastern Pacific. Mar. Geol. 171, 115–126. doi: 10.1016/S0025-3227(00)00107-9
Ranasinghage, P. N. (2010). Holocene Coastal Development in Southeastern-Eastern Sri Lanka: Paleo- Depositional Environments and Paleo-Coastal Hazards. Ph.D. thesis, Kent, Ohio, Kent State University, 437.
Raposo, M. I. B., Pressi, L. F., and de Assis Janasi, V. (2012). Magnetic fabrics and their relationship with the emplacement of the Piracaia pluton, SE Brazil. Int, J. Earth Sci. 101, 773–786. doi: 10.1007/s00531-011-0696-5
Rees, A. I. (1968). The production of preferred orientation in a concentrated dispersion of elongated and flattened grains. J. Geol. 76, 457–465. doi: 10.1086/627343
Rusnak, G. A. (1957). The orientation of sand grains under conditions of “unidirectionnal” fluid flow. J. Geol. 65, 384–409. doi: 10.1086/626441
Tarling, D. H., and Hrouda, F. (1993). The Magnetic Anisotropy of Rocks. London: Chapman & Hall. 218.
Veloso, E. E., Hayman, N. W., Anma, R., Tominaga, M., Gonzales, R. T., Yamazaki, T., et al. (2014). Magma flow directions in the sheeted dike complex at superfast spreading mid-ocean ridges. Insights from IODP Hole 1256D, Eastern Pacific. Geochem. Geophys. Geosyst. 15, 1283–1295. doi: 10.1002/2013GC004957
Vijaya Lakshmi, C. S., Srinivasan, P., Murthy, S. G. N., Trivedi, D., and Nair, R. R. (2010). Granularity and textural analysis as a proxy for extreme wave events in southeast coast of India. J. Earth Syst. Sci. 119, 297–305. doi: 10.1007/s12040-010-0023-8
Wassmer, P., Baumert, P., Lavigne, F., Paris, R., and Sartohadi, J. (2007). Sedimentary facies and transfer associated with the December 26, 2004 tsunami on the north eastern littoral of Banda Aceh (Sumatra, Indonesia) / Faciés et transferts sédimentaires associés au tsunami du 26 décembre 2004 sur le littoral au nord-est de Banda Aceh (Sumatra, Indonésie). Geomorphologie 4, 55–66.
Wassmer, P., and Gomez, C. (2011). Development of the AMS method for unconsolidated sediments. Application to tsunami deposits. Geomorphol. Relief Process. 3, 279–290. doi: 10.4000/geomorphologie.9491
Wassmer, P., Schneider, J.-L., Fonfrege, A., Lavigne, F., Paris, R., and Gomez, C. (2010). Use of Anisotropy of Magnetic Susceptibility (AMS) in the study of tsunami deposits: application to the 2004 deposits on the eastern coast of Banda Aceh, North Sumtra, Indonesia. Mar. Geol. 275, 255–272. doi: 10.1016/j.margeo.2010.06.007
Willcock, M. A. W., Mattei, M., Hasalova, P., Giordano, G., Cas, R. A. F., and Morelli, C. (2014). “Flow behaviour in the intra-caldera setting: an AMS study of the large (>1290 km3) Permian Ora ignimbrite,” in The Use of Palaeomagnetism and Rock Magnetism to Understand Volcanic Processes, Vol. 396, eds M. H. Ort, M. Porreca, and J. W. Geissman (London: Geological Society, Special Publications), 177–204. doi: 10.1144/SP396.3
Keywords: paleo-tsunami, flow behavior reconstruction, anisotropy of magnetic susceptibility, structureless sediment deposit, Banda Aceh
Citation: Wassmer PC, Gomez CA, Iskandasyah TYWM, Lavigne F and Sartohadi J (2015) Contribution of anisotropy of magnetic susceptibility (AMS) to reconstruct flooding characteristics of a 4220 BP tsunami from a thick unconsolidated structureless deposit (Banda Aceh, Sumatra). Front. Earth Sci. 3:40. doi: 10.3389/feart.2015.00040
Received: 05 May 2015; Accepted: 03 July 2015;
Published: 21 July 2015.
Edited by:
Eric Font, University of Lisbon, PortugalReviewed by:
Jean-Luc Bouchez, Toulouse University, FranceHervé Regnauld, University of Rennes 2, France
Copyright © 2015 Wassmer, Gomez, Iskandasyah, Lavigne and Sartohadi. This is an open-access article distributed under the terms of the Creative Commons Attribution License (CC BY). The use, distribution or reproduction in other forums is permitted, provided the original author(s) or licensor are credited and that the original publication in this journal is cited, in accordance with accepted academic practice. No use, distribution or reproduction is permitted which does not comply with these terms.
*Correspondence: Patrick C. Wassmer, Laboratoire de Geographie Physique, UMR-Centre National de la Recherche Scientifique 8591, 1, Place Aristide Briand, 92195 Meudon, France, patrick.wassmer@unistra.fr