Calcium-Phosphate Biomineralization Induced by Alkaline Phosphatase Activity in Escherichia coli: Localization, Kinetics, and Potential Signatures in the Fossil Record
 Julie Cosmidis1†
  Karim Benzerara1*
  François Guyot1
  Fériel Skouri-Panet1
  Elodie Duprat1
  Céline Férard1 Jean-Michel Guigner1
  Florence Babonneau2 Cristina Coelho3
- 1Institut de Minéralogie, de Physique des Matériaux, et de Cosmochimie, Sorbonne Universités, UMR 7590, Centre National de la Recherche Scientifique, Muséum National d'Histoire Naturelle, Université Pierre et Marie Curie, IRD UMR 206, Paris, France
- 2Laboratoire de Chimie de la Matière Condensée de Paris, Université Pierre et Marie Curie, Centre National de la Recherche Scientifique, Collège de France, UMR 7574, Paris, France
- 3Institut des Matériaux de Paris-Centre, Université Pierre et Marie Curie, FR Centre National de la Recherche Scientifique 2482, Paris, France
Bacteria are thought to play an important role in the formation of calcium-phosphate minerals composing marine phosphorites, as supported by the common occurrence of fossil microbes in these rocks. Phosphatase enzymes may play a key role in this process. Indeed, they may increase the supersaturation with respect to Ca-phosphates by releasing orthophosphate ions following hydrolysis of organic phosphorus. However, several questions remain unanswered about the cellular-level mechanisms involved in this model, and its potential signatures in the mineral products. We studied Ca-phosphate precipitation by different strains of Escherichia coli which were genetically modified to differ in the abundance and cellular localization of the alkaline phosphatase (PHO A) produced. The mineral precipitated by either E. coli or purified PHO A was invariably identified as a carbonate-free non-stoichiometric hydroxyapatite. However, the bacterial precipitates could be discriminated from the ones formed by purified PHO A at the nano-scale. PHO A localization was shown to influence the pattern of Ca-phosphate nucleation and growth. Finally, the rate of calcification was proved to be consistent with the PHO A enzyme kinetics. Overall, this study provides mechanistic keys to better understand phosphogenesis in the environment, and experimental references to better interpret the microbial fossil record in phosphorites.
Introduction
Phosphorites are marine authigenic formations rich in phosphorus (>18 wt% P2O5) and the main long-term sink in the biogeochemical cycle of P (Filippelli, 2002; Paytan and McLaughlin, 2007). It is now generally accepted that bacteria play an important role in the precipitation of the Ca-phosphates composing phosphorites (Follmi, 1996; Omelon and Grynpas, 2008; Crosby and Bailey, 2012). This is supported by the many occurrences of microstructures interpreted as fossil bacteria observed in phosphorites of various ages and origins (e.g., Cosmidis et al., 2013a,b). In a different context, infection by bacteria also seems to be the cause of some Ca-phosphate kidney stones (Bazin et al., 2012) or calcified cardiac valves (Gilinskaya et al., 2007) and imprints of bacteria are often observed at the surface of the calcifications in these cases.
The most frequently invoked mechanism by which bacteria drive phosphogenesis in marine sediments is the liberation of orthophosphates (Pi) following the hydrolysis of organic forms of P by microbial degradation of organic matter (Follmi, 1996; Paytan and McLaughlin, 2007). The released soluble Pi then react with Ca2+ ions to form the insoluble Ca-phosphate minerals composing phosphorites, mostly carbonate-fluoroapatite, provided that supersaturation with respect to these minerals is reached. The bacterial enzymes responsible for the release of Pi by organic matter remineralization are called phosphatases. Alkaline phosphatases in particular occur in a broad diversity of microorganisms and are important for the microbial recycling of phosphoesters, one of the most abundant groups of dissolved organic P compounds in the ocean (Clark et al., 1998; Young and Ingall, 2010). Alkaline phosphatases catalyze the hydrolysis of phosphoester bounds in mono- or diester phosphates such as glycerol-phosphate, phosphoproteins and phospholipids, nucleic acids, and nucleotides (Ehrlich and Newman, 2009). Alkaline phosphatases are therefore key biomolecules involved in bacterially-driven phosphogenesis, as suggested by several laboratory experiments dealing with the microbial biomineralization of Ca-phosphates (Hirschler et al., 1990; Blake et al., 1998; Benzerara et al., 2004a) or U-phosphates (Beazley et al., 2007; Nilgiriwala et al., 2008; Shelobolina et al., 2009).
While this general scheme may seem straightforward, i.e., Pi release from organically bound P by phosphatases followed by precipitation of Pi with Ca2+, it should be kept in mind that these reactions do not occur in a homogeneous aqueous system but in a complex heterogeneous biological system. Phosphatase enzymes can possibly be located in the intracellular space (cytoplasm) and/or extracellular space and/or, for Gram-negative bacteria, in the periplasmic space (Luo et al., 2009). These different compartments, delimited by membranes, are characterized by different physico-chemical conditions (ion concentrations, protein concentrations, pH, etc.), all of them possibly influencing Ca-phosphate precipitation. For instance, the intracellular calcium concentration in bacteria is tightly regulated, ranging from 100 to 300 nM (Dominguez, 2004), while it has been shown that the periplasm of Escherichia coli cells can concentrate free calcium to concentrations several fold higher than the extracellular medium (Jones et al., 2002). The different compartments (cytoplasm/periplasm/extracellular space) in bacteria may thus present very different levels of supersaturation with respect to Ca-phosphates. Furthermore, bacterial membranes can act as nucleation templates for the precipitation of minerals (Fortin et al., 1997), and it is generally assumed that heterogeneous nucleation occurs with much more efficiency, i.e., at lower supersaturation, compared to homogeneous nucleation (De Yoreo, 2003). It therefore appears that a better understanding of Ca-phosphate precipitation by bacteria requires a detailed examination of the mechanisms leading to supersaturation with respect to Ca-phosphates in the different cell compartments, as well as the mechanism of nucleation and growth of Ca-phosphates in these different compartments.
In this work, we studied Ca-phosphate precipitation (sometimes called calcification hereafter) by the model Gram-negative bacterium Escherichia coli. E. coli possesses a periplasmic alkaline phosphatase, PHO A. Different strains of E. coli were engineered, differing in the abundance, and localization of PHO A. A calcification medium was designed to promote Ca-phosphate formation by these different strains. The mineralogy of Ca-phosphates formed in the calcification medium in the presence of the different strains of E. coli as well as purified PHO A was characterized using infrared and nuclear magnetic resonance spectroscopies as well as scanning and transmission electron microscopies and x-ray spectromicroscopy. Particular attention was given to the description of the textures of the minerals formed by the calcifying strains and enzymes, in an attempt to shed new light on the interpretation of purported traces of bacterial calcification in sediment and rock samples. Finally, the kinetics of Ca-phosphate precipitation by the bacteria in connection with PHO A enzymatic kinetics were modeled, in order to gain further insight into the biogeochemical mechanism of bacterial Ca-phosphate formation.
Materials and Methods
Experimental Design
Overexpression of PHO A in E. coli
Two strains of E. coli have been designed for this study, with the aim of overexpressing the pho a gene in E. coli, and controlling the final localization of the PHO A enzyme in the cells. The pET gene expression system (Studier and Moffatt, 1986) was used to transform E. coli BL 21 cells. In this system, a plasmid containing the target gene (here, pho a) linked to a T7 RNA polymerase promoter which can be activated by isopropyl β-D-thiogalactoside (IPTG), as well as an ampicillin resistance marker, is introduced in the cells. Two different strains were thus obtained (Figure 1). The first one, called AP1, was transformed with the native pho a gene, which possesses a targeting signal peptide allowing the translocation of PHO A across the plasma membrane of E. coli. AP1 cells thus produce abundant PHO A proteins which are transported to the periplasm of the cells. The second strain, called APm1 (m stands for modified), was transformed with the pho a gene with deletion of the targeting signal peptide, and thus produces abundant PHO A enzymes accumulating within the cytoplasm of the cells. We will refer to “wild type” (WT) E. coli AP1 or APm1 cells cultivated in the absence of IPTG. In this case, the expression of the target gene is strongly repressed and the cells only express the native pho a gene present on E. coli chromosome at a native low level.
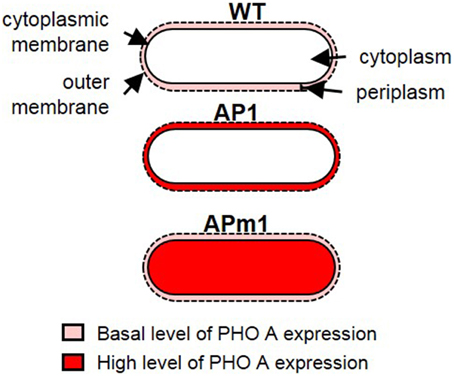
Figure 1. Schematic representation of the different E. coli strains used in the calcification experiments. In WT cells, PHO A is expressed at a basal level and is present in the periplasm. In induced AP1 cells, PHO A is overexpressed and accumulates in the periplasm. In APm1 cells, PHO A is overexpressed and accumulates in the cytoplasm.
AP1 and APm1 strains were stored at −80°C. These stock cells were grown on plates containing sterile LB agar medium (Sigma-Aldrich Co.) and ampicillin (50 μg/mL), and grown overnight at 37°C. Cells from one colony were inoculated in 2 mL of autoclaved liquid LB medium (Sigma-Aldrich Co.) with ampicillin (50 μg/mL). Liquid cultures were grown overnight at 30°C and 180 rpm. One hundred microliter of these cultures were used to inoculate 10 mL of liquid LB with ampicillin. The cells were grown in this medium at 30°C and 180 rpm and the optical density at 600 nm (OD600) was monitored. AP1 and APm1 cells were induced with IPTG (0.4 mM) once the OD600 reached a value between 0.6 and 0.8. Induced and non-induced E. coli were allowed to grow overnight in LB medium at 37°C, 180 rpm. The following day, cells were harvested by centrifugation at 6500 rpm for 10 min for the calcification experiments.
Calcification Medium and Calcification Experiments
The medium used for calcification was designed to limit the number of chemical parameters in the experimental system and enable geochemical modeling of the calcification process. It contained 10 mM of calcium-glycerophosphate (Sigma-Aldrich Co.) as an organic phosphate and a calcium source, and HEPES at 20 mM as a pH-buffer. The pH was adjusted to 7.5 using HCl (1 M). The calcification medium was sterilized by filtration through a 0.2 μm filter, and ampicillin (50 μg/mL) was finally added. The calcification medium could not sustain growth of E. coli but some cells remained viable in this medium during the few days of the experiments (see Results).
WT, AP1, and APm1 E. coli cells were inoculated into 50 mL of the calcification medium, at a cell density of 2 × 10⁷ cells/mL, and placed at 37°C, 180 rpm. In another experiment, Ca-phosphate precipitation by PHO A in a cell-free solution was tested by adding purified 5 × 10⁻³ mg/mL of PHO A (alkaline phosphatase from Escherichia coli, Sigma Aldrich Co.) to the calcification medium. Finally, in order to mimic Ca-phosphate precipitation by bacteria with extracellular PHO A, purified PHO A (5 × 10⁻³ mg/mL) was added to the calcification medium with WT cells (2 × 10⁷ cells/mL).
Viable Cells Counting
Enumerations of viable cells were performed using the plate count method: at different time intervals during the course of the calcification experiment, each experiment was sampled and serial dilutions of these samples were performed in distilled sterile water. One hundred microliters of these dilutions were spread on sterile LB agar plates with ampicillin (50 μg/mL), and grown at 37°C overnight. E. coli colonies were visible to the naked eye and the number of colonies on a plate were counted. The plates containing between 30 and 300 colonies were used to determine the abundance of colony forming units (CFU) in the original samples.
Quantification of the Kinetics of Calcification
Spectrophotometry Measurement of Calcium and Orthophosphate Concentrations in Solution and Calculation of the Supersaturation with Respect to Hydroxyapatite
Two milliliters of the experimental medium were sampled at different time intervals during the course of calcification experiments, sterile filtered at 0.2 μm, acidified with 1% HCl and stored at 4°C until they were analyzed. Dissolved calcium (Ca2+) concentrations were determined using a cresolphthalein complexone spectrophotometry procedure adapted from Moorehead and Biggs (1974). Dissolved inorganic phosphate (Pi) concentrations were determined using an ascorbic acid spectrophotometry procedure adapted from Chen et al. (1956). The pH of the solutions was measured prior to HCl acidification. Ca2+ and Pi concentrations as well as the pH were used to calculate the degree of supersaturation of the medium with respect to hydroxyapatite ΩHA using the CHESS code (Van der Lee, 1998) and a solubility constant for hydroxyapatite KHA as log(KHA) = −57.74 (Nancollas and Tomazic, 1974).
Enzymatic Assay of PHO A Activity
The enzymatic activity of PHO A was measured along the time-course of the experiments using an enzymatic assay adapted from Martinez et al. (1992). This assay uses p-Nitrophenyl phosphate (p-Npp), a chromogenic substrate of the alkaline phosphatase. The hydrolysis of p-Npp produces p-Nitrophenol, a colored (yellow) soluble end-product, the concentration of which can be monitored by its absorption at 410 nm. One milliliter of the experimental medium containing E. coli cells was sampled at different time intervals during the course of the experiment. The cells were harvested by centrifugation, resuspended in the assay buffer (0.1 M Tris pH 7.5, 1 mM MgCl2) and stored on ice until they were assayed for enzyme activity. The assays were carried out in a spectrophotometer cuvette containing variable concentrations of p-Npp (4-Nitrophenyl phosphate disodium salt hexahydrate, Sigma-Aldrich Co.), 100 μL of the cell suspension, and the assay buffer. The total assay volume was 1 mL. The cells were added to the assay mixture in the last step. Starting from 60 s after cell addition (a period necessary to obtain stable readings), absorption at 410 nm was read every 30 s. The evolution of absorption with time was used to determine initial reaction rates of p-Nitrophenol release by the alkaline phosphatase. According to Beer-Lambert law, the absorbance A is indeed proportional to the concentration of the absorbing substance C (here, p-nitrophenol): A = εlC, where l is the path length of the light through the solution in the spectrophotometer (1 cm) and ε is the extinction coefficient of p-nitrophenol at 410 nm. ε was determined by measuring the absorption at 410 nm of a small and known amount of pNPP totally hydrolyzed by PHO A. Its value was ~2.4 × 10⁴ M−1.cm−1. It can be compared with the value of 7.8 × 10³ M−1.cm−1 obtained by Martinez et al. (1992) using a different assay buffer (0.1 M MOPS, pH 7.2, with 86 mM NaCl and 1 mM MgC12).
Microscopic Characterization of the Calcifying E. coli Cells and PHO A
Scanning Electron Microscopy (SEM)
One milliliter of calcification medium containing E. coli cells and/or PHO A was sampled at different time points during the course of the experiment. The samples were harvested by centrifugation, rinsed three times in distilled water, and deposited on a polycarbonate filter (Isopore membrane filters, Merck Millipore, pore size 0.2 μm). The filters were dried at ambient temperature and mounted on aluminum stubs using double-sided carbon tape. The samples were carbon coated prior to SEM analyses. SEM analyses were performed using a Zeiss ultra 55 SEM equipped with a field emission gun. Unless mentioned in the captions, images were acquired in the secondary electron (SE) mode with the microscope operating at 3 kV and a working distance (WD) of ~2.5 mm, using the SE2 detector, and in the backscattered electron (BSE) mode, at 10 kV and WD ~7.5 mm, using the AsB detector. Energy-dispersive x-ray spectrometry (SEM-EDXS) analyses were performed at 15 kV and WD ~7.5 mm.
Transmission Electron Microscopy (TEM)
Two types of samples were used for transmission electron microscopy (TEM) analyses. The first type consisted of rinsed samples, prepared using the same method as SEM samples, and deposited on copper grids covered with a lacey carbon film. The second sample type was ultrathin ultramicrotomy sections. Ultra-thin sections were used for TEM observations of highly calcified samples, which were no longer electron-transparent. For that purpose, the samples were fixed with glutaraldehyde and post-fixed with osmium tetroxide in HEPES buffer, then dehydrated (ethanol and propylene oxide) and embedded in an Epoxy resin (Epoxy embedding medium kit, Sigma-Aldrich Co.). Ultrathin sections (50–70 nm) were obtained using diamond knife ultramicrotomy. TEM analyses were performed using a JEOL 2100F (FEG) operating at 200 kV and equipped with a field emission gun. Scanning transmission electron microscopy (STEM) observations were performed in the high angle annular dark field mode (HAADF) and a probe size of 1 nm. EDXS chemical mapping was performed using the STEM mode.
Cryo-Transmission Electron Microscopy (Cryo-TEM)
E. coli cells collected from the calcification medium 5–7 h after the beginning of the calcification experiment were concentrated by centrifugation to an OD600 of ~2–3. A ~5 μL drop was deposited on a Quantifoil holey-carbon-coated grid. The grids were blotted with filter paper and rapidly plunge-frozen in liquid ethane in order to form a thin amorphous ice film and avoid water crystallization. Grids were loaded onto a side entry Gatan 626 cryoholder cooled at −180°C with liquid nitrogen. Images were recorded on ultrascan 2 k CCD camera, using a LaB6 JEOL JEM 2100 microscope operating at 200 kV with a low dose system (Minimum Dose System, MDS) to protect the thin ice film from irradiation before imaging and to minimize the irradiation during image capture.
Scanning Transmission X-ray Microscopy (STXM)
Cells harvested at different times during the course of the experiment were rinsed three times in distilled water and a small drop (~1 μL) was deposited on a Si3N4 window and allowed to dry at ambient temperature. Reference hydroxyapatite and amorphous calcium phosphate purchased from Sigma-Aldrich Co. were gently ground in pure ethanol in an agate mortar, deposited on Si3Ni4 windows and similarly dried at ambient temperature. STXM analyses were performed on beamline 11.0.2.2. of the Advanced Light Source (Lawrence Berkeley National Laboratory, Berkeley, USA). Energy calibration was achieved using the well-resolved 3p Rydberg peak of gaseous CO2 at 294.96 eV (Ma et al., 1991). A 25 nm zone plate was used. Data included images and image stacks, from which XANES spectra and maps were retrieved. The aXis2000 software was used for data processing. Stacks were acquired in an energy range covering both C K and Ca L2, 3-edges (260–360 eV). X-ray absorption near edge structure (XANES) spectra were extracted from these stacks. A linear background correction was applied to the spectra at the C K and Ca L2, 3-edges (by setting to zero the slope of the spectra baseline in the 260–280 eV region and 340–345 eV region, respectively) to eliminate the contribution of lower energy absorption edges. Then, the two edge steps at the Ca L2, 3-edges resulting from transitions to the continuum were subtracted using double arctan functions, as described in Cosmidis et al. (2015). Maps of organic C were obtained by subtracting an optical density (OD) converted image obtained at 280 eV (i.e., below the C K-edge) from an OD-converted image at 288.2 eV (1s → π* electronic transitions in peptides). Maps of Ca were obtained by subtracting an OD-converted image obtained at 342 eV (i.e., below the Ca L3-edge) from an OD-converted image at 349.2 eV (energy of the Ca L3-edge).
Spectroscopic Characterization of the Ca-Phosphate Biominerals
Fourier-Transform Infrared Spectroscopy (FT-IR)
Precipitates formed in the presence of APm1 cells or PHO A only (no cell) were harvested by centrifugation after 7 and 2 days of incubation in the calcification medium, respectively. The samples were dried for 48 h at ~40°C. About 3 mg of sample were gently ground in an agate mortar and mixed with ~300 mg of dried potassium bromide (KBr). Pellets were formed in a vacuum press under nine tons of pressure for ~1 min. The pellets were placed overnight in a drying oven at ~90°C to remove water vapor of ambient air. After a second pressing, FT-IR spectra were recorded between 400 and 4000 cm−1 with a resolution of 1 cm−1 using a Nicolet 7600 FT-IR spectrometer. One hundred absorbance spectra were averaged for each sample. The baseline subtraction was done with Omnic 7.3 software. A reference hydroxyapatite (hydroxyapatite nanopowder, Sigma-Aldrich Co.) was prepared and analyzed similarly.
31P, 1H, and 13C Nuclear Magnetic Resonance (NMR)
Precipitates formed in the presence of APm1 cells or PHO A only were harvested by centrifugation 2 weeks after inoculation into the calcification medium. The samples were dried for 48 h at ~40°C and prepared for NMR experiments. 31P and 1H solid state NMR experiments were performed on a Bruker AVANCE III 700 spectrometer at B0 = 16.4 T (ν0(31P) = 283.46 MHz, ν0(1H) = 700.23 MHz) with a 2.5 mm double resonance Bruker magic angle spinning (MAS) probe spinning at 30 kHz. 31P MAS NMR spectra were recorded with the acquisition of 48 transients and a recycle delay of 60s. 31P CP MAS NMR spectra were recorded with the acquisition of 2000 transients, a recycle delay of 5 s and a contact time of 2 ms. 1H MAS spectra were recorded with the acquisition of 8 transients and a recycle delay of 5 s. 1H-31P Heteronuclear Correlation (HetCor) spectra were recorded with the acquisition of 112 transients and 256 t1 increments, a recycle delay of 5 s and a contact time of 2 ms. 13C solid state NMR experiments were performed on a Bruker AVANCE III 500 spectrometer at B0 = 11.7 T (ν0(13C) = 125.78 MHz) with a 4 mm double resonance Bruker MAS probe spinning at 10 kHz. Samples were spun at the magic angle using ZrO2 rotors. The spectra were recorded with a contact time of 1.5 ms. The number of transients was respectively 155540 and 30600 for PHO A and APm1. 31P and 13C NMR chemical shifts were referenced respectively to 85% aqueous H3PO4 (δ = 0 ppm) and adamantane (δ = 1.85 ppm).
Results
Microscopic Characterization of Calcifying E. coli and PHO A
Samples collected at different time intervals during the course of the calcification experiments were observed by SEM (Figures 2, 6), TEM (Figures 3, 4, 6), cryo-TEM (Supplementary Figure 1) and STXM (Figure 5, Supplementary Figure 2).
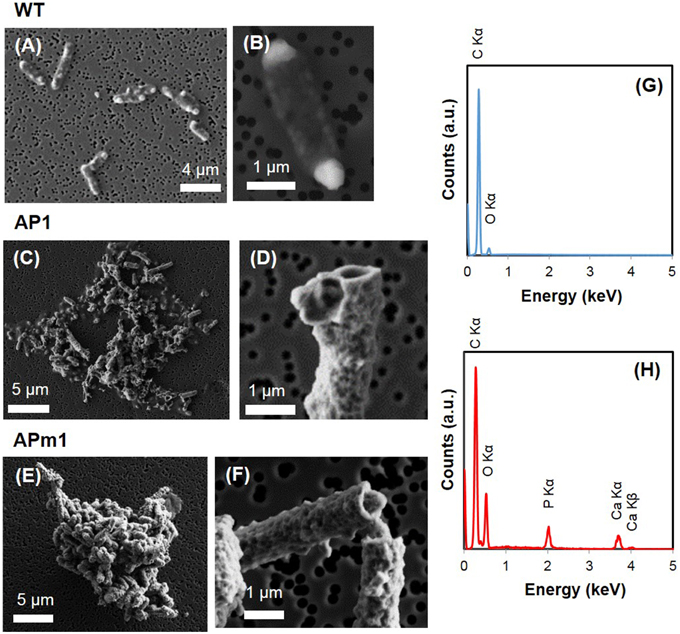
Figure 2. SEM images of WT, AP1, and APm1 E. coli after 24 in the calcification medium. (A,B) WT E. coli. (C,D) AP1. (E,F) APm1. (G) EDXS spectrum obtained on WT E. coli cells. (H) EDXS spectra obtained on calcified APm1 cells.
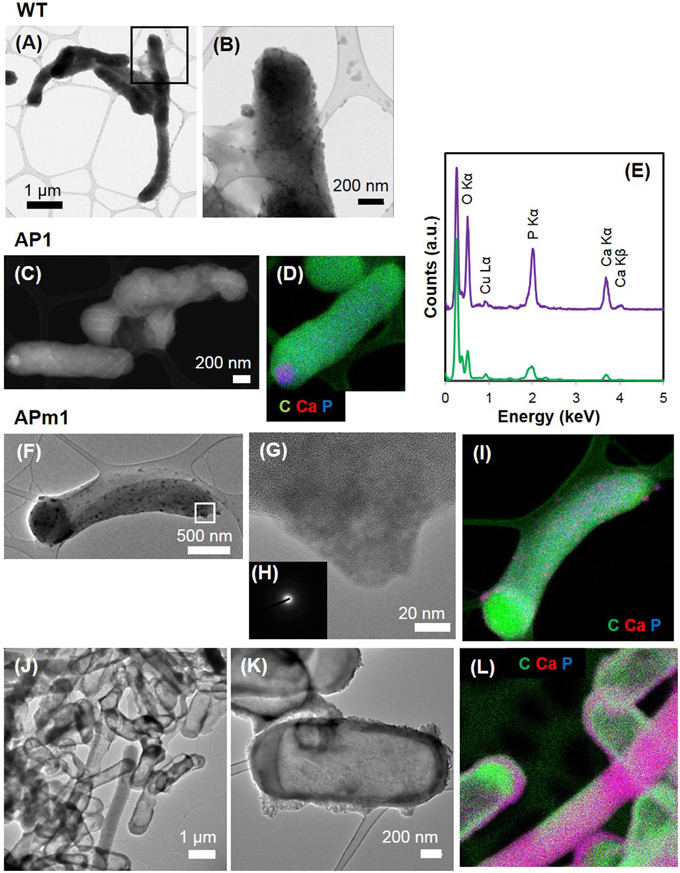
Figure 3. TEM and STEM images of WT, AP1, and APm1 E. coli during the calcification experiments. (A,B) WT E. coli after 1 week in the calcification medium. (B) is a close-up of the area depicted by a square on (A). (C,D) AP1 after 6 h in the calcification medium. (C) STEM image. (D) EDXS map of C (in green), Ca (in red), and P (in blue), showing that the intracellular dense grains contain Ca and P. (E) EDXS spectrum obtained on the Ca and P-rich grain (in purple) and bacterium (in green) on (D). The tall peak on the left of the spectrum corresponds to the C Kα x-ray emission line. Cu comes from the grid on which the sample was deposited. (F–L) APm1 after 6 and 24 h in the calcification medium, respectively. (G) is a close-up of a patch at the surface of a cell at 6 h, depicted by a rectangle in (F). (H) Diffuse electron diffraction pattern obtained on the grain on (G). (I) EDXS maps of C (in green), Ca (in red), and P (in blue) at 6 h. (J,K) Show fully encrusted APm1 cells. (L) EDXS maps of C (in green), Ca (in red), and P (in blue). Some bacteria are both encrusted and filled by Ca-phosphate.
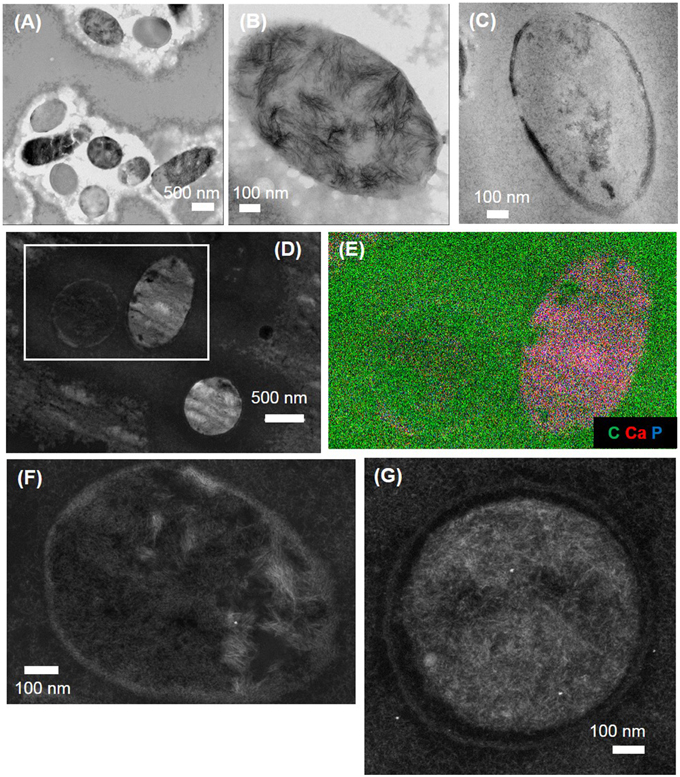
Figure 4. TEM (A–C) and STEM (D,F,G) images of APm1 after 1 week in the calcification medium. (A) Cluster of encrusted cells. The Ca-phosphates located directly in contact with the cells have been partially removed by ultramicrotomy, leaving holes around the bacteria. (B) Cell having intracellular Ca-phosphate precipitate presenting a fibrous texture, with fibers radiating from the periphery of the cell. (C,F,G) Cells surrounded by an electron-dense crown, with a mean thickness of ~24.4 (±5.3) nm, likely resulting from the precipitation of Ca-phosphates within the periplasm of the cells. (E) EDXS map of C (in green), Ca (in red), and P (in blue) obtained on the area depicted by a rectangle in (D).
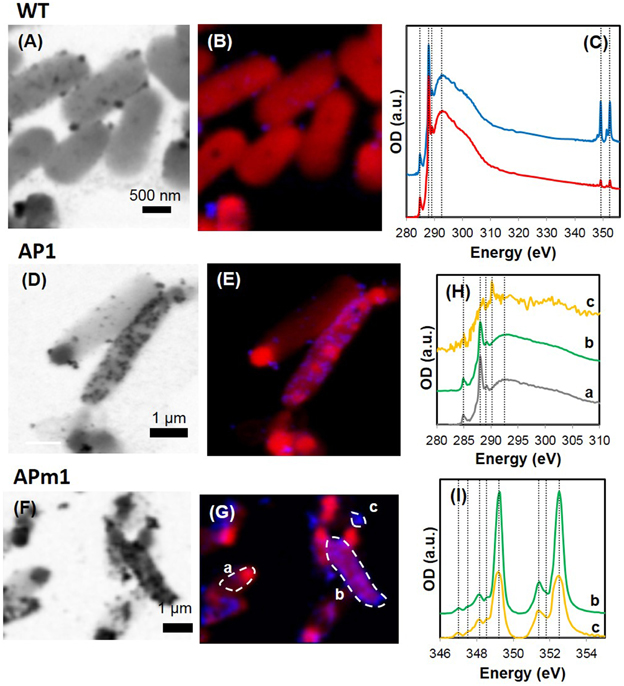
Figure 5. STXM analyses of WT, AP1, and APm1 E. coli during the calcification experiments. (A–C) WT E. coli after 24 h in the calcification medium. (A) Image at 349 eV. (B) Map of organic C (red) and Ca (blue) obtained on the same area as (A). XANES spectra at the C K and Ca L2, 3-edges obtained on the cells (red) and on the particles at the surface of the cells (blue). The spectrum of the precipitates at the Ca L2, 3-edge is shown in greater detail in SM 1. (D,E) AP1 after 7 h in the calcification medium. (D) Image at 349.2 eV. (E) Map of Ca (in blue) and organic C (in red) obtained on the same area as (E). (F,G) APm1 after 7 h in the calcification medium. (F) Image at 349.2 eV. (G) Map of Ca (in blue) and organic C (in red) obtained on the same area as (F). (H) XANES spectra at the C K-edge, obtained on the areas depicted on (F). XANES signal at the C K-edge is similar for non-calcified cells (a) and calcified cells (b), with peaks corresponding to organic C functional groups at 284.9, 288.1, 289.1, and 292.5 eV. The signal of extracellular Ca-phosphate precipitates (c) is much noisier, due to a smaller total C concentration. A peak at 290.2 eV is present corresponding to 1s → π* transitions in carbonate groups. (I) XANES spectra at the Ca L2, 3-edges obtained on area (b) (calcified cell) and (c) (extracellular precipitate). Vertical positions correspond to peak energy positions in the reference HA spectrum (see Supplementary Figure 2).
Non-induced E. coli (WT)
Calcification by non-induced E. coli cells (WT) was limited to the formation of small (20–100 nm) electron-dense particles at the surface of the cells, only visible by TEM (Figures 3A,B) and STXM (Figures 5A–C) after several days in the calcification medium. The XANES spectra at the Ca L2, 3-edge of the small particles formed at the surface of WT cells matched that of hydroxyapatite (HA) and amorphous Ca-phosphate (ACP) (Supplementary Figure 2). The energy positions and relative intensities of major and minor peaks in reference ACP and HA spectra were indeed very similar, suggesting a similar Ca site structure in ACP and HA. As a comparison, only a very faint XANES signal at these energies was present for WT cells prior to their inoculation into the calcification medium, accounting for the Ca present in the cells and/or adsorbed onto their surfaces (Figure 5C). The XANES signal of the bacteria at the C K-edge was identical before and after their inoculation into the calcification medium, with peaks at 284.9, 288.1, 289.1, and 292.5 eV, attributed respectively to 1s → π* electronic transitions in aromatic groups, 1s → π* transitions in amide groups (proteins), 1s→3p/σ* transitions in ethers or hydroxylated aliphatics and 1s → σ* transitions in aromatics (Cody et al., 2003; Benzerara et al., 2004b; Brandes et al., 2004; Lehmann et al., 2005; Schumacher et al., 2005; Haberstroh et al., 2006).
Additionally, WT E. coli cells often presented prominent electron-dense globular bodies at one or both poles on SEM images (Figures 2A,B). These globular bodies were also observed by SEM in cells grown in LB before inoculation in the calcification medium, and thus were not indicative of Ca-phosphate precipitation. They were also visible in some WT, AP1, and APm1 cells on STXM images but had the same composition as the rest of the cytoplasm based on XANES spectroscopy at the C K-edge. These globular bodies are thus composed of organic molecules at a concentration higher than in the rest of the cells. Since such globular bodies were not observed by cryo-TEM (Supplementary Figure 1), it is assumed that they formed artefactually during SEM and STXM sample preparation and/or were caused by dehydration within the chamber of the SEM or STXM.
E. coli Expressing PHO A in the Cytoplasm (APm1)
Calcification was quantitatively much more important in APm1 than in non-induced cells. The very first stages of calcification were captured by TEM (Figures 3F–L) and cryo-TEM (Supplementary Figures 1G–L) observations. The first precipitates were small electron-dense patches (20–90 nm) with TEM-EDXS compositions consistent with a Ca-phosphate, forming at the periphery of the cells as early as 2 h after incubation in the calcification medium. Cryo-TEM shows that the Ca-phosphates formed on the external surface of the outer membrane of the cells. These Ca-phosphates presented a fibrous texture, with fibers distributed radially around the cell surface (Supplementary Figures 1G,H). Some cells were observed to produce outer membrane vesicles (Kulp and Kuehn, 2010), on the surface of which Ca-phosphate precipitates were also present (Supplementary Figures 1K,L). These vesicles were sometimes observed at a distance from the bacteria (Supplementary Figure 1J), showing that they could detach from the cells. Electron diffraction analyses performed on the patches after 6 h of incubation showed a diffuse ring pattern (Figure 3H), suggesting poor crystallinity. With time, the size and number of Ca-phosphate precipitates per bacterium increased, to finally form a continuous crust around the cells, measuring 100–200 nm in thickness (Figures 3J,K). SEM observations after 24 h showed fully encrusted cells forming large aggregates (10 to more than 100 μm in width) (Figure 2E).
The XANES spectrum at the Ca L2, 3-edges of Ca-phosphates encrusting APm1 cells matched the spectra of ACP and HA (Supplementary Figure 2). Some Ca-phosphate precipitates were also observed by STXM at distance from the cells (Figures 5F–I). These extracellular precipitates had XANES spectra at the Ca L2, 3-edges similar to precipitates encrusting the cells, and moreover contained carbonate ions, as shown by XANES spectroscopy at the C K-edge with a peak at 290.2 eV attributed to 1s → π* electronic transitions in carbonate groups (Benzerara et al., 2004b). Interestingly, this peak at 290.2 eV was not present in the spectra of the Ca-phosphates encrusting the cells, suggesting that they are carbonate-free.
After several days, the thickness of the crusts increased up to ~700 nm and the interior of at least some of the cells was filled with Ca-phosphate (Figure 4). The Ca-phosphate precipitated inside some of the cells presented a fibrous texture with fibers radiating from the periphery of the cells (Figure 4B). Some of the cells were surrounded by an electron-dense crown (Figures 4C,F,G), with a mean thickness of ~24.4 (±5.3) nm. This value is consistent with the width of the periplasmic space of E. coli, as measured by Matias et al. (2003) using CEMOVIS (Cryo Electron Microscopy on Vitreous Sections) (~20 nm). These crowns likely resulted from the precipitation of Ca-phosphates within the periplasm of the cells. Some cells did not show this periplasmic precipitate, suggesting a diversity in cell calcification patterns among cells from the same culture.
E. coli Expressing PHO A in the Periplasm (AP1)
Similarly to APm1, calcification in AP1 was quantitatively much more important than in WT cells. However, the initial stage of calcification was different from that described for APm1. Indeed, after 6 h of incubation in the calcification medium, intracellular electron dense granules were observed by cryo-TEM (Supplementary Figure 1) and conventional STEM (Figures 3C,D), corresponding to Ca-phosphates based on TEM-EDXS composition. Surprisingly, the localization of the first Ca-phosphate precipitates was thus not correlated with the expected localization of alkaline phosphatase, i.e., within the periplasm. The later stages were similar to those described for APm1 cells, with Ca- and P-bearing patches at the surface of the cells, observed by STXM (Figures 5D,E). XANES spectra at the Ca L2, 3-edges acquired on the patches were similar to that of HA and ACP (Supplementary Figure 2). After several days, large aggregates of heavily encrusted cells were observed by SEM (Figures 2C,D).
PHO A Enzymes in the Presence or Absence of WT E. coli
A Ca-phosphate phase was observed to form within a few minutes after purified PHO A was introduced in the calcification medium, with and without WT E. coli. In both cases, precipitates appeared on SEM images as clusters of empty spherical or ovoid structures, measuring ~2 μm in diameter (Figures 6A–D). In both cases the minerals presented plate-like textures. The precipitates formed by PHO A in the presence or absence of bacteria thus presented strikingly similar morphologies at the SEM scale. However, they could be discriminated when observed with TEM. In the presence of E. coli, well-delimited structures corresponding to the cells were visible in section (Figure 6H). The interior of most bacteria was free of Ca-phosphate. An electron-dense irregular and discontinuous crown of Ca-phosphate was observed at the periphery of some of the cells only (Figures 6J,K). The Ca-phosphates forming the crowns were needle-like, and oriented tangentially to the border of the cells. Extracellular Ca-phosphate crystals also had needle-like shapes, with randomly oriented needles, less than 50 nm in length. In contrast, precipitates formed in the absence of bacteria did not show well-delimitated round structures. Instead of that, it looked as if several empty spheres had merged together (Figure 6E). The walls of the spheres were composed of needle-like Ca-phosphate crystals oriented perpendicularly to the walls, their length increasing (from ~20 nm to more than 100 nm) outwardly. On some images, the needle-like crystals appeared as plates seen in cross section (Figure 6G), consistent with SEM observations.
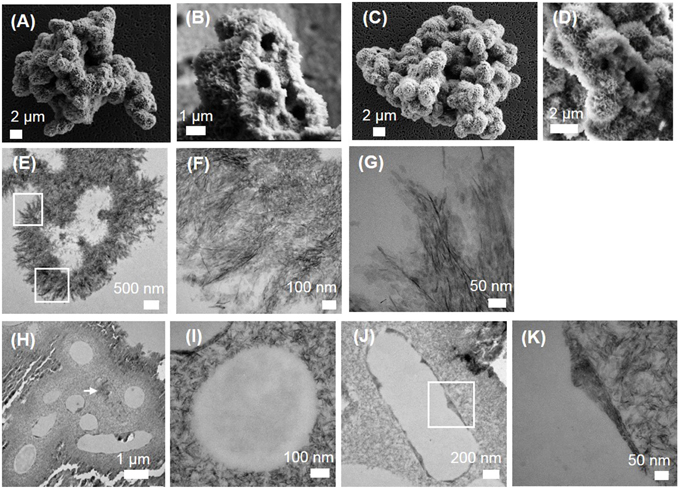
Figure 6. SEM and TEM images of calcification by PHO A in the absence or the presence of WT E. coli. (A,B) SEM images of calcification by PHO A in the absence of WT E. coli. (C,D) SEM images of calcification by PHO A in the presence of WT E. coli. Clusters of spherical or ovoid void structures, measuring ~2 μm in diameter are formed in both cases. (E–G) TEM images of calcification by PHO A in the absence of WT E. coli. (F) and (G) are close-ups of the areas depicted by rectangle on (E). (H–K) TEM images of calcification by PHO A in the presence of WT E. coli. (H) Most cells are empty, with a few exceptions (white arrow). The cell on (J) is surrounded by an electron-dense discontinuous layer of Ca-phosphate. (K) is a close-up of the area depicted by rectangle on (J). The Ca-phosphates forming the discontinuous electron-dense layer are needle-like, and oriented tangentially to the border of the cells.
FT-IR and NMR Characterization of the Ca-Phosphates Formed during the Calcification Experiments
FT-IR
The Ca-phosphate precipitates formed by APm1 or PHO A without cells, after 1 week and 2 days of incubation in the calcification medium, respectively, were analyzed by FT-IR spectroscopy (Figure 7). Based on a comparison with a reference HA, the bacterial and enzymatic Ca-phosphate precipitates could be identified as poorly crystalline HA. The main peaks in the FT-IR spectra are assigned to the characteristic vibrational bands of HA: (i) P-O-P bending ν2 (472 cm−1), (ii) P-O-P bending ν4 (563 and 602 cm−1), (iii) P-O stretching ν1 (960–962 cm−1), and (iv) P-O stretching ν3 (1035–1045 cm−1) of PO4 groups, or to the librational modes of OH− groups (the two bands at 630–633 and 3570 cm−1). The additional broad absorption band at 3300–3600 cm−1 is related to the presence of adsorbed water, whereas the band near 1650 cm−1 might be related to the C = O stretching ν1 of amide groups in the samples (Roche et al., 2010). The observed bands are generally broader than those in the reference HA spectrum, suggesting that the HA in the samples have a more disordered structure than the reference compound (Nawrot et al., 1976; Jäger et al., 2006). Moreover, the P-O stretching ν3 is less defined in the spectrum of APm1 precipitates than in the spectrum of PHO A precipitates, which might indicate a lower crystallinity for the APm1 precipitates (Nawrot et al., 1976). Other indicators, such as linewidth of the ν4 PO4 bands (Surovell and Stiner, 2001; Pucéat et al., 2004; Roche et al., 2010), or the linewidth of the ν1 PO4 band (Balan et al., 2010), also suggest a more disordered structure for the bacterial precipitates.
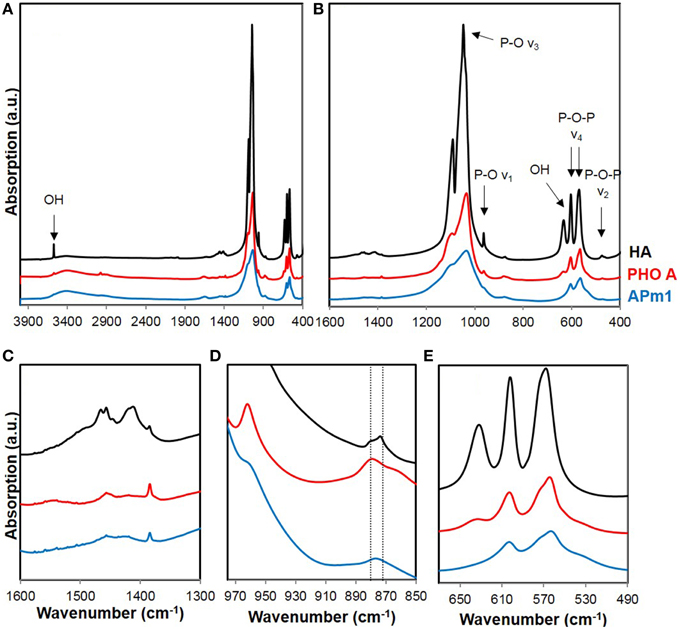
Figure 7. (A) Full FT-IR spectra of reference HA (in black) and Ca-phosphate precipitates formed in the presence of APm1 (in blue) and PHO A (in red), after 7 and 2 days of incubation in the calcification medium, respectively. (B–E) are close-ups of different frequency domains. The vertical lines in (D) correspond to the frequency positions of vibration bands assigned to A-type and B-type carbonate groups in apatite.
The two vibrational bands corresponding to OH− groups are much weaker (for PHO A) or almost absent (for Apm1) compared to the HA spectrum, indicating a lower concentration of hydroxyl ions in the samples compared with stoichiometric HA. The charge balance within the crystals has thus to be maintained by lattice substitutions, generally the replacement of the PO anions by bivalent species, HPO and/or A-type CO (i.e., CO ions substituting for OH− in the c-axis channels of apatite). A vibration band at 880 cm−1 is present in the FT-IR spectra of the samples. While it is usually assigned to A-type CO in the literature (Gibson and Bonfield, 2002; Rey et al., 2007; Lafon et al., 2008), it can alternatively be attributed to the P-O(H) stretching in HPO groups substituting PO groups in the apatite structure (Vallet-Regi et al., 1997; Liou et al., 2004; Müller and Müller, 2006; Nassif et al., 2010). Since the signal in the 1400–1600 cm−1 frequency domain, where absorption bands corresponding to A- and B-type CO are expected (Fleet and Liu, 2004) is very weak here (Figure 7C) and C K-edge XANES measurements did not show 1s → π* electronic transitions characteristic of carbonate groups in the Ca-phosphates associated with E. coli cells, a very low carbonate content is inferred in the samples. Hydroxyl groups in the samples are therefore mainly substituted by HPO ions. OH− ions are more heavily substituted in the HA precipitated by APm1 than in the HA precipitated by PHO A without cells, which is consistent with a lower crystallinity of this sample (Pasteris et al., 2004).
31P, 1H, and 13C NMR
The precipitates formed in the presence of APm1 and PHO A 2 weeks after inoculation in the calcification medium were characterized by 31P MAS and CPMAS NMR and 1H MAS NMR (Supplementary Figure 3), as well as 1H-31P HetCor (Figure 8). In the 2D spectra of both samples, a sharp correlation peak can be distinguished between the phosphate site from HA (3.1 ppm) and the hydroxyl anions (0 ppm). Furthermore, a broad correlation peak between the phosphate resonance and a proton resonance at 5.5 ppm is observed, which corresponds to water according to its chemical shift. The HetCor experiment signal at 5.5 ppm corresponds to water in close proximity (far less than 1 nm) to P, either hydrogen-bounded to the surface of the crystals or included in their structure (Cho, 2003; Duer et al., 2009; Wang et al., 2012). Apatite nanocrystals usually present a structurally disordered surface with a hydrated layer containing labile ionic species, a large proportion of which are CO and HPO in non-apatitic environments (Dorozhkin, 2009; Rey et al., 2009). Here the peak corresponding to the resonance of the phosphate ions in the hydrated environment (31P projection at δ(1H) = 5.5 ppm) is significantly broader than the peak corresponding to the resonance coming from the phosphate ions in the apatitic phase (31P projection at δ(1H) = 0 ppm). The linewidth of the 31P signals make it possible to attribute them (and through them, the correlated 1H signals as well) to surface and core regions of the crystals, as the core is expected to be relatively well-ordered and crystalline and therefore give relatively sharp 31P lines, while surface regions are expected to be more heterogeneous and disordered and hence present broader 31P lines (Duer et al., 2009). The Gaussian line shape of the broad signal is attributed to a distribution of 31P chemical shifts due to a variety of chemical environments in the disordered hydrated non-apatitic domain around HA nanocrystals (Wu et al., 2002; Jäger et al., 2006; Huang et al., 2009; Wang et al., 2012). This line is broader for APm1 compared to PHO A. This suggests a more important disordered surface layer compared to apatitic core in this sample than in the PHO A sample. No signal is observed at 1H chemical shifts >10 ppm, where a broad peak attributed to HPO in the surface layer has been described in previous 1H-31P HetCor studies of synthetic (Jäger et al., 2006) or bone (Duer et al., 2009; Bradley et al., 2010) minerals. However, in the presence of water in the samples, exchange reactions may occur between protons in HPO groups and in H2O that prevent the detection of this group (Wang et al., 2013).
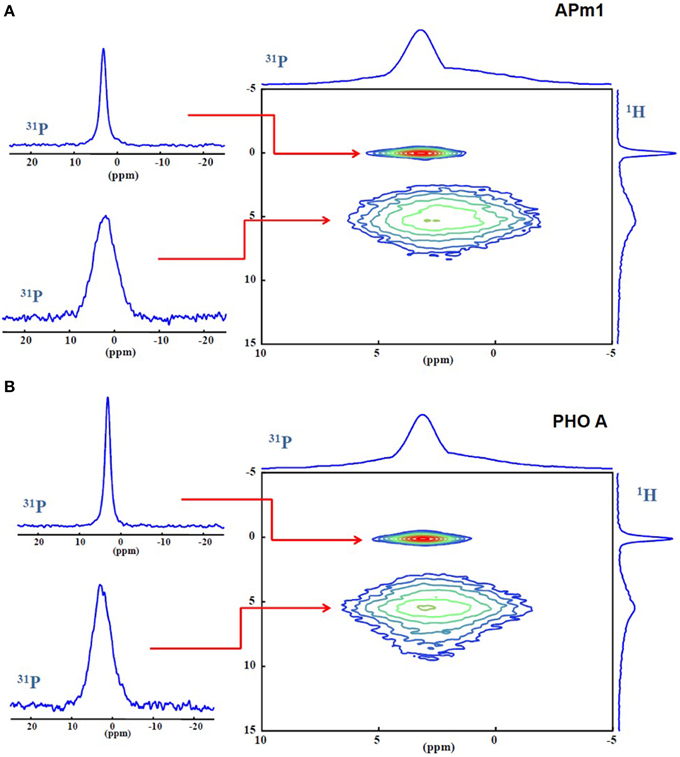
Figure 8. (A) 1H-31P HetCor spectra of the Ca-phosphate precipitates formed in the presence of APm1 (A) and PHO A (B), after 2 weeks in the calcification medium, and extracted 31P slices at δ(1H) = 0 and 5.5 ppm.
Figure 9 shows the 13C CPMAS spectra of the bacterial and enzymatic precipitates. In both spectra, a broad peak is observed at ~69 ppm, corresponding to C-OH groups, and thus likely corresponding to glycerol precipitated with or adsorbed onto the samples during their preparation for NMR experiments. Additional peaks are present in the APm1 spectrum. The peaks in the 10–50 ppm chemical shift domain could be attributed to aliphatic carbons (Duer et al., 2009). The peak at ~173 ppm corresponds to C = O groups in amide and carboxylate carbons (Duer et al., 2009; Bradley et al., 2010). This peak is not present in the PHO A spectrum, probably because the concentration of proteins in this sample is below the detection limit, and/or PHO A enzymes did not co-precipitate with HA. A- and B-type carbonate ions in HA, with resonances at 166.5 and 170.5 ppm, respectively (Beshah et al., 1990; Nassif et al., 2010), are not observed here consistently with STXM and FT-IR analyses.
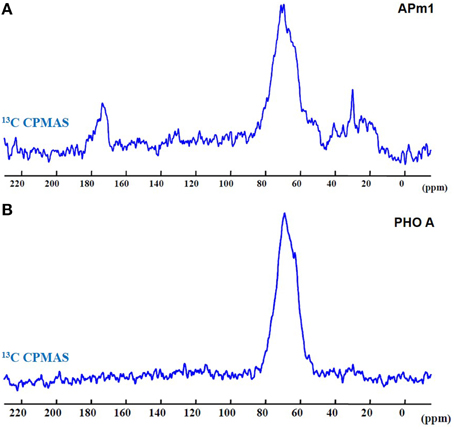
Figure 9. 13C CPMAS spectra of the Ca-phosphate precipitates formed in the presence of APm1 (A) and PHO A (B), after 2 weeks in the calcification medium.
Geochemical Modeling of Ca-Phosphate Precipitation
The evolution of dissolved calcium and inorganic phosphate (Pi) concentrations and pH during the calcification experiments are shown in Figure 10. Pi concentration rapidly increases with time in the presence of bacteria, as a consequence of glycerophosphate hydrolysis catalyzed by the alkaline phosphatase of the cells. However, part of Pi also precipitates with calcium to form solid HA. The evolution of Pi concentration is therefore a balance between Pi release by glycerophosphate hydrolysis and precipitation of Pi as HA. The increase of calcium concentration observed with time in the control (where almost no Ca-phosphate precipitation occurred) is due to evaporation of the mineralization medium during the course of the experiment. The effect of evaporation is then corrected for all the data assuming that evaporation was the same in the control and the different samples. Consistent with microscopy observations, chemical analyses show that HA precipitation by the WT is very limited and delayed compared to AP1 and APm1 strains. The pH of the calcification medium decreases with time in the presence of AP1 and APm1, and, to a lesser extent, WT cells. Indeed, the precipitation of HA results in an acidification of the solution, as shown by the equation:
Dissolved Ca2+ and Pi concentrations have been used to calculate phosphate release rates (d[Pi]t/dt). Indeed, the amount of phosphate released by the cells (total inorganic phosphate, [Pi]t) can be calculated by adding the measured phosphate concentration ([Pi]m) and the phosphate having precipitated with calcium ([Pi]p):
The precipitated phosphate was determined as the amount of phosphate having precipitated with calcium as hydroxyapatite (Ca5(PO4)3(OH)). The Ca/P ratio of the Ca-phosphate precipitated by the cells might differ from that of hydroxyapatite (5/3), but using a different ratio does not change significantly the value of d[Pi]t/dt calculated here:
[Ca]p is the precipitated calcium, calculated as the difference between the maximal calcium concentration [Ca]M (measured for the abiotic control, for which no precipitation was observed) and the measured calcium concentration [Ca]m, which corrects for the evaporation. The results are shown in Figure 10E. As expected, phosphate release rate is more important for cells overexpressing PHO A than for WT E. coli. Phosphate release rates decrease during the course of the experiment, which might be due to the degradation of the enzyme with time and/or inhibition of the enzyme by inorganic phosphate (Garen and Levinthal, 1960).
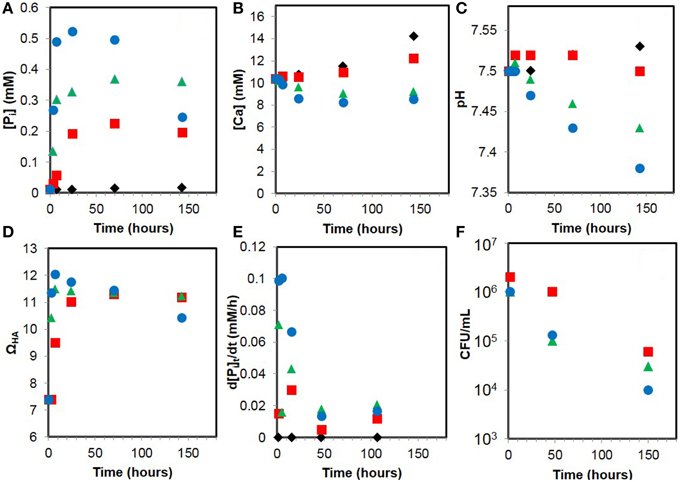
Figure 10. Evolution of geochemical parameters during the calcification experiments with WT E. coli cells (red squares), AP1 (green triangles), APm1 (blue dots), and abiotic control (black diamonds). (A) Dissolved inorganic phosphate. (B) Dissolved calcium. (C) pH. (D) Supersaturation with respect to hydroxyapatite (ΩHA). (E) Phosphate release rate (d[Pi]t/dt). (F) Viable cell counts (CFU/mL).
Supersaturations of the calcification medium with respect to hydroxyapatite (ΩHA) have been calculated using Ca2+ and Pi concentrations as well as the pH (Figure 10D). Before adding cells (t = 0), ΩHA is ~7.4. ΩHA is positive since a small concentration of Pi (~13 μM) is already present in the medium at the beginning of the experiment (most likely due to the hydrolysis of glycerophosphate). Maximal values of ΩHA were measured at 7 h in the presence of AP1 and APm1 and were respectively 11.5 and ~12.0. For WT E. coli, the maximal ΩHA was reached at 70 h and was ~11.3. High supersaturation thus occurs sooner for the cells overexpressing PHO A than for the WT cells, consistently with the timing of Ca-phosphate precipitation for these different strains. After ΩHA has reached a maximal value, it slowly decreases for all the strains, in parallel with the decrease of Pi and pH with time.
Viability of E. coli Cells during Calcification
The results of viable cells counting for AP1, APm1 and WT strains along the course of the experiment are shown in Figure 10F. Two hours after inoculation into the calcification medium, only ~106 CFU/mL were enumerated for all the strains. This is one order of magnitude smaller than the density of cells initially introduced in the calcification medium (2 × 10⁷ cells/mL). Ca is known to interfere with E. coli cellular division (Dominguez, 2004; Ferguson, 2004) and, as a result, filamentous E. coli are frequent in Ca-rich media and were observed in our experiments. Filaments are unlikely to form colonies on agar plates, which could account for this low CFU density. The number of CFU/mL decreased by a factor of 10 after 2 days of experiments for AP1 and APm1 cells which were heavily calcified, whereas it almost remained constant for the WT cells, which did not significantly calcify at this stage. After about 1 week, a significant number of viable cells (at least ~104 CFU/mL) were still present in the experiments, even for the heavily calcified AP1 and APm1 strains.
Discussion
Experimental Validation of a Ca-Phosphate Formation Model Involving the Alkaline Phosphatase
In order to test the model of microbial phosphogenesis based on alkaline phosphatase activity, we aimed to correlate Ca-phosphate precipitation with PHO A activity in the calcification experiments. To do this, the concentration of active PHO A enzymes ([E]0) associated with E. coli cells had to be assessed. In an enzymatic reaction, [E]0 is proportional to the maximum reaction rate Vmax:
where kcat is turnover number (the maximum number of substrate molecules converted to product per enzyme molecule per unit of time). In the Michaelis-Menten model (e.g., Johnson and Goody, 2011), Vmax is usually determined using enzymatic assays by measuring the reaction rate at different substrate concentrations. However, as shown by Martinez et al. (1992, 1996, 1999), a Michaelis-Menten model alone cannot explain the kinetic behavior of PHO A in vivo (i.e., inside bacteria), because under some conditions diffusion across the cell membranes is the rate-limiting step of the enzymatic dynamics. Indeed, we were unable to determine the value of Vmax during the calcification experiments with E. coli cells using a classical p-nitrophenol enzymatic-assay and classical Michalis-Menten plots (Enzymatic Assays Performed on E. coli Cells during the Calcification Experiments Supplementary Data Section). Nevertheless, the value of Vmax in E. coli calcification experiments could be estimated using phosphate release rates d[Pi]t/dt. Indeed, during the first hours of the experiment, d[Pi]t/dt provides a measure of the initial reaction rate vi. This approach is further justified in Determination of the Turnover Number kcat of PHO A Using Purified Enzymes Supplementary Data Section. vi is equal to Vmax when the substrate (glycerophosphate) concentration is several orders of magnitude higher than the Michaelis constant Km. During the course of the experiment, no more than 4 mM of glycerophosphate (out of the 10 mM initially present in the medium) was hydrolyzed. The remaining substrate concentration (>6 mM) is therefore always several orders of magnitude higher than the value of Km for the purified alkaline phosphatase (Km ~15 μM; Martinez et al., 1992). However, it has been shown by Martinez et al. (1992) that in the case where PHO A is present inside the cells, the apparent Km can be 1000-fold higher than the Km of pure alkaline phosphatase because of diffusion issues. The rates of phosphate release thus correspond to the maximal reaction rate Vmax when phosphate release is due to free (i.e., outside cells) PHO A, e.g., PHO A released after cell lysis. In contrast, the phosphate release rates are smaller than Vmax when the enzymes are associated with the cells. The calcification medium likely contains both free and cell-bound enzymes, so the values of d[Pi]/dt given in Figure 10E should be interpreted by a combination of Michaelis-Menten behavior as well as of diffusion controlled enzyme kinetics (Martinez et al., 1992, 1996, 1999), and thus yields minimum estimates of Vmax. These values can be used to calculate minimum estimates of enzyme concentrations during the experiment (E0), using Equation 4 and kcat = 8.1 s−1. This value of kcat was obtained using purified PHO A in the calcification medium conditions (Supplementary Data Determination of the Turnover Number kcat of PHO A Using Purified Enzymes). Its use is justified by the fact that this kinetic parameter has proved to be the same for PHO A in dilute solution and in the periplasm of E. coli (Martinez et al., 1996).
Using the computed values of [E]0 at the beginning of the experiment, we can then calculate the initial number of enzymes per cell (Ni) for AP1, APm1 and WT E. coli using this equation:
where Na = 6.022 × 10²³ mol−1 is Avogadro's number and Di is the initial cell density (2 × 10⁷ cells/mL). We obtain 1.6 104 enzymes/cell for WT E. coli, 7.3 × 10⁴ enzymes/cell for AP1 and 1.02 × 10⁵ enzymes/cell for APm1. This is in very good agreement with the numbers given by Martinez et al. (1996) who found that about 2 × 10⁴ alkaline phosphatases are present in wild-type E. coli and up to 2 × 10⁵ in cells overexpressing PHO A. This means that at the time scale of the calcification experiment (a few hours), the solution “sees” all the enzymes present in the bacteria as free enzymes, i.e., diffusion is not a limiting parameter. This might be due to the fact that diffusion times through the outer or periplasmic membrane of E. coli are very small compared to the characteristic time scale of the calcification experiment (hours) (this also explains why diffusion is indeed a limiting parameter in pNPP enzymatic assays with E. coli, which are only a few minutes long). Alternatively, one might argue that enzymes could have been released in the mineralization medium due to cell lysis. However, the pNPP enzymatic assays performed with E. coli harvested and rinsed at different times show that an important phosphatase activity was still associated with the cells, even after 70 h of experiments (Supplementary Data Enzymatic Assays Performed on E. coli Cells during the Calcification Experiments). The values of vi measured in these assays were comparable to those obtained on intact cells by Martinez et al. (1992) for similar cell densities and pNPP concentrations, which confirms that the enzymes were (at least in great part) still present in the cells.
This suggests that the main factor controlling phosphate release by bacteria is the number of PHO A molecules per cell. The localization (intra- or extracellular) of the enzyme has little importance since at time scales larger than hours, diffusion through the membranes of the bacteria has no impact on the phosphate release rate. On the other hand, it is not clear whether cell viability has an influence on calcification. In the experiments where the bacteria became heavily calcified (AP1 and APm1), the number of viable cells in the calcification medium decreased more rapidly than in the experiment where calcification was limited (WT). A correlation between cell viability and calcification was therefore observed, but it is not totally clear whether a causal link exists between those two variables. Alkaline phosphatases are known to be remarkably stable enzymes, with the ability of maintaining an activity over a wide range of environmental conditions, a property that has to be related to the fact that they are often secreted by the microorganisms to hydrolyze phosphate esters and release Pi in the extracellular medium (Luo et al., 2009). Most PHO A enzymes were therefore probably still active long after the cell that produced them had ceased to be viable.
These results thus confirm the microscopy observations showing that bacteria play an important role in Ca-phosphate precipitation by producing alkaline phosphatases, in addition to serving as nucleation templates for the precipitation of the minerals. This finding confirms a number of previous studies suggesting the importance of alkaline phosphatase activity in bacterial phosphate formation (Lucas and Prévôt, 1981, 1984; Hirschler et al., 1990; Blake et al., 1998; Macaskie et al., 2000; Beazley et al., 2007; Martinez et al., 2007; Nilgiriwala et al., 2008; Shelobolina et al., 2009; Salome et al., 2013).
Relation between Bacterial Calcification Patterns and Alkaline Phosphatase Localization
The calcification of WT as well as APm1 E. coli cells started with the precipitation of Ca-phosphate at the surface of the cells. Ca2+ is highly concentrated in the calcification medium, and phosphate generated through PHO A activity in the cells can be exported to the medium via several phosphate exchange systems inserted in the cytoplasmic membrane of the bacteria (Blake et al., 1998). We calculated that the calcification medium is supersaturated with respect to HA from the beginning of the experiment. Extracellular Ca-phosphate precipitation is therefore expected. Heterogeneous precipitation of minerals on bacteria is moreover a very common phenomenon, resulting from the ionic interactions of metals ions (such as Ca2+) with reactive chemical anionic groups (such as carboxyl, phosphate, or amide groups) exposed at the cells surfaces (Fortin et al., 1997).
In contrast, the start of calcification of AP1 cells, overexpressing PHO A in the periplasm, within the cytoplasm of the cells was more surprising. Indeed, intracellular free calcium concentration in metabolically active E. coli is strictly regulated, and usually range from 100 to 300 nM (Dominguez, 2004). Similarly, PO concentrations in the cytoplasm of E. coli is tightly regulated through Pho regulon (Shimizu, 2013). Many AP1 cells presented disruptions of the cell wall and/or membrane vesicles when observed by cryo-TEM (Figure 3F). However, even in such lysed cells, where above-mentioned regulatory systems are likely inactive, it is not clear why Ca-phosphate precipitation occurs in the cytoplasm and not the periplasm or extracellular medium. It is possible that a fraction of the PHO A enzymes produced by AP1 are not translocated in the periplasm and accumulate in the cytoplasm. PHO A precursor has been shown to dimerize and to form active enzymes even without cleavage of the signal peptide and excretion across the periplasmic membrane (Inouye and Beckwith, 1977), suggesting that PHO A enzymes could have been active in the cytoplasm of AP1.
Latter stages of calcification were similar for AP1 and APm1. The precipitates finally formed throughout the periplasm (forming a 24 nm–thick periplasmic Ca-phosphate crown around the cells) and the cytoplasm, while Ca-phosphate also continued to precipitate outside the cells. As stated above, the precipitation of Ca-phosphate is most likely prevented by Ca2+ and Pi regulation systems in the cytoplasm of intact cells, and intracellular precipitation probably occurs only upon death, in particular after disruption of the cell membranes. Only ~1% of cells initially inoculated into the calcification medium were still viable after 2 days of experiment, and ~0.1% after 1 week (Figure 10F). The Ca-phosphate precipitated inside some of the APm1 cells presented a fibrous texture with fibers radiating from the periphery of the cells (Figure 4B). This suggests nucleation starting on the inner surface of the plasma membrane and growth of acicular Ca-phosphate crystals inwards away from this nucleation site. Cultures of Bacterionema matruchotii in a solution supersaturated with respect to Ca-phosphate similarly formed HA crystals in their cytoplasm (Ennever, 1963; Takazoe et al., 1963) and this was attributed to the nucleation of HA on a cytoplasmic membrane proteolipid, which was later isolated (Ennever et al., 1976, 1978). Intracellular HA formation by E. coli cells was also achieved by the same authors (Ennever et al., 1974, 1981). Such a mechanism of nucleation on a membrane proteolipid might occur during E. coli calcification.
In the experiment with WT cells in the presence of extracellular PHO A, a discontinuous crown with irregular thickness was present at the periphery of some cells (Figures 6J,K), as opposed to the regular ~24 nm–thick periplasmic Ca-phosphate crown observed with APm1 cells (Figure 4). This discontinuous crown therefore probably does not result from Ca-phosphate precipitation in the periplasm of the cells, but is more likely formed by minerals accumulating at their surface. The interior of most cells remained free of precipitate, even after 1 week. The absence of Ca-phosphate precipitation in the cytoplasm and periplasm might be due to insufficient PO concentrations when PHO A is not overexpressed in the cells. It is indeed likely that Pi released extracellularly by PHO A directly precipitates in the presence of high Ca2+ concentrations in the medium, before being taken up by the bacteria.
The localization (intra- vs. extracellular) of the alkaline phosphatase therefore has an influence on the calcification patterns in E. coli, and could partly explain differences in the patterns of Ca-phosphate precipitation among different bacterial species as described for instance by Rizzo et al. (1963), Ennever et al. (1981), and Streckfuss et al. (1974). However, it is likely that calcification patterns are also influenced by the composition (and in particular, saturation) of the medium. Indeed, in an experiment by Dunham-Cheatham et al. (2011) with non-metabolizing Bacillus subtilis and Shewanella oneidensis that were placed under supersaturated conditions with respect to U-phosphates, hydrogen uranyl phosphate minerals precipitated homogeneously (i.e., at distance from the cells) at low supersaturations whereas they precipitated at the surface and within the cell walls of cells at higher supersaturation.
Mineralogy of the Ca-Phosphates Formed during Calcification Experiments and Influence of the Bacteria
Based on FT-IR and NMR results, the Ca-phosphate precipitates obtained at the end of the experiments with bacteria as well as purified PHO A were all poorly crystalline non-stoichiometric hydroxyapatite free of carbonate ions. Similarly, hydroxyapatite substituted by HPO ions with no or very little CO ions were obtained in the experimental studies by Lagno et al. (2012), Vallet-Regi et al. (1997), and Wright et al. (2011). The incorporation of carbonate ions in the apatite lattice greatly depends on the presence and concentration of carbonate in the precipitation medium (Vignoles et al., 1988; Pan and Darvell, 2010), a parameter that is rarely assessed in above-mentioned in vitro HA precipitation studies. It is likely that the calcification medium did not contain significant concentrations of carbonate ions, those mainly originating from the dissolution of CO2 from the atmosphere or CO2 produced during glycerol metabolism in E. coli (either respiration or fermentation; Murarka et al., 2007).
HA crystals formed by APm1 cells were relatively smaller (a few tens of nm vs. more than 100 nm) compared to the precipitates formed by PHO A. They were furthermore less crystalline, having a larger disordered HPO-containing surface hydrated layer relative to apatitic core. The relative contribution of the disordered surface layer vs. apatitic core could be simply related to the size of the crystals, smaller crystals having greater surface to volume ratio than large ones. A similar result was obtained by Dunham-Cheatham et al. (2011), were HA formed in the presence of bacteria were relatively smaller and less crystalline compared to precipitates formed abiotically. Similarly, in a study by Wright et al. (2011), poorly crystalline calcium-deficient hydroxyapatite (CDHA) with a Ca/P ratio of ~1.4 was formed when bacteria were present, whereas quasi-stoichiometric HA (Ca/P~1.67) precipitated without bacteria. According to Wright et al., the presence of the bacteria moreover resulted in a higher a and smaller c lattice parameter compared with the abiotic experiment, due to the incorporation of HPO and water in the crystal structure in the presence of the bacteria. Smaller crystal sizes and more disordered structure of HA in the presence of bacteria have been interpreted as a consequence of an interaction between organic bacterial exudates with precipitating HA particles in Dunham-Cheatham et al. (2011). The presence of citrate, an organic ligand of Ca2+, was for instance shown to induce the precipitation of HA crystals of relatively smaller size and containing more lattice imperfections compared to crystals formed without citrate (Van Der Houwen et al., 2003). In our experiment with APm1, obvious interactions exist between HA and organic molecules in this experiment (organic molecules serving for instance as nucleation templates for HA minerals), which might account for reduced crystal size and crystallinity compared to HA formed in the experiment with purified PHO A.
HA precipitation occurred at very high supersaturations (ΩHA > 11), which were maintained over the course of the calcification experiments in the presence of cells. It is likely that our values of ΩHA are slightly overestimated. Indeed, the exact determination of ΩHA of the solution requires knowledge of the exact activity of each of the entities in solution included in the ionic activity product, i.e., in the case of HA, all ionic and neutral forms of calcium and phosphate present in the medium. Even in a relatively simple solution, the possible formation in solution of many calcium- and phosphate-bearing species such as CaH2PO and CaPO, can be incompletely taken into account by the thermodynamic models used in chemical equilibrium modeling softwares (Pan and Darvell, 2009; Söhnel and Grases, 2011). The omission of such complexes leads to an overestimation of the activities of free dissolved calcium and phosphate in solution, and thus an overestimation of the saturation of the solution. Another effect can also affect the observed supersaturation: the complexation of Ca2+ by organic ligands. The HEPES used as a buffer in our study is a good complexing agent of Ca2+ (Crowell and Bowers, 1985) because of the affinity of calcium for sulfonate groups. Anionic functional groups such as carboxylates and phosphates present at the bacterial surfaces can also complex calcium (Fortin et al., 1997). Moreover, bacterial cells can produce extracellular organic polymers that also complex Ca2+ (Dunham-Cheatham et al., 2011). These species could not be modeled in the geochemical precipitation model. Such complexation effects might have increased the values of ΩHA calculated in our experiments by a few units, but cannot alone explain the very high values of ΩHA that were obtained. Although a definitive explanation of these elevated levels of supersaturation remains to be found, one can propose that the chemistry of the solution is controlled by the formation of a poorly crystalline non-stoichiometric hydroxyapatite (or CDHA) (as observed in our experiments), which is more soluble than pure HA (Driessens and Verbeeck, 1981; Meyer and Fowler, 1982; Ducheyne et al., 1993; Fulmer et al., 2002; Pan and Darvell, 2009). As an example, if the solubility of the amorphous calcium phosphate (ACP) AM1 from Wright et al. (2011) is used as a proxy for the thermodynamics of this metastable intermediate, one computes values of ΩACP of about 0 at all the conditions investigated in our experiments. The question then becomes why a more soluble metastable phase precipitate spontaneously instead of the thermodynamically stable HA. A kinetic explanation is provided by Zawacki et al. (1990). They showed that aqueous phosphate ions in a solution where non-stoichiometric hydroxyapatite forms are always more extensively protonated (i.e., under HPO form) than those of the precipitating solid. They assume that it may be difficult to deprotonate the excess HPO ions before they are incorporated in the crystal lattice. The electroneutrality of the solid then has to be maintained by exclusion of both calcium and hydroxyl ions to allow a HPO ion to enter the crystal, leading to the formation of CDHA instead of HA. The formation of less thermodynamically stable CDHA would therefore be favored over more stable HA because of faster nucleation, a phenomenon known as the Ostwald rule of stages (e.g., Nıvlt, 1995). The importance of kinetic factors rather than thermodynamic considerations in determining the formation of different Ca-phosphate phases has also been stressed by Valsami-Jones (2001).
Interpretation of Putative Microbial Fossils in Phosphorites
Many occurrences of microstructures morphologically similar to microorganisms have been reported in phosphorites of various ages and origins, and have been used as major evidence of the implication of microbes in their formation (e.g., Mullins and Rasch, 1985; Soudry and Lewy, 1988; Lamboy, 1994; Purnachandra Rao et al., 2000; Soudry, 2000; Bailey et al., 2013; She et al., 2013). These microstructures are often interpreted as fossil bacteria, based on their resemblance in sizes and shapes with modern type bacilli or cocci on SEM images. In the calcification experiment with purified PHO A, we obtained ovoid structures, measuring ~2 μm in diameter, which could easily be confused with calcified bacteria based on SEM only (Figures 6A–D). Similar objects, sometimes referred to as spherules or microspheres and composed of apatite or octocalcium phosphate, have been obtained in the past by abiotic synthesis (Van Kemenade and de Bruyn, 1987; Kniep and Simon, 2007; Sun et al., 2009; Teshima et al., 2009; Gan et al., 2010; Perez et al., 2011). Therefore, SEM images should be considered only very cautiously for inferring the biogenicity of objects in phosphorites.
In contrast, calcified bacteria might be discriminated from enzymatic precipitates using higher resolution techniques such as TEM and STXM. The presence of a calcified periplasm (i.e., a continuous crown of mineral with a regular thickness consistent with the width of a bacterial periplasm), obtained with E. coli overexpressing PHO A intracellularly (Figure 4), seems to be a conclusive indicator of the biogenicity of the objects, since such a feature has so far never been observed in abiotic precipitates. Calcification of the periplasm was moreover not achieved in the experiment mixing WT E. coli cells and extracellular PHO A. A fossil calcified periplasm may therefore be an indication of intracellular phosphate release, i.e., active Ca-phosphate biomineralization (as opposed to simple passive encrustment of the cells in a precipitating calcium and phosphate-rich solution). The present study provides some experimental support to the recent discovery of bacterial microfossils with a calcified periplasm, observed in a Paleocene (~60 Ma old) phosphorite from the Ouled Abdoun phosphate basin (Morocco) (Cosmidis et al., 2013a). In that study, STXM revealed the presence of organics associated with the fossilized cell wall of the bacteria. In a diagenesis experiment using calcified E. coli cells, Li et al. (2014) showed that microbial biomineralization had a positive influence on the chemical preservation of organics during fossilization processes. The association of a fossilized periplasm and organic residues thus appears as a potential trace of microbial biomineralization that can be searched for in ancient phosphorites.
Conclusion
The main findings in the present study have direct implications on our understanding of the mechanism by which microorganism influence P cycling and phosphorite formation in the environment. We indeed demonstrated experimentally that alkaline phosphatase activity is the main parameter controlling the amount of Ca-phosphate precipitation by E. coli. PHO A activity is indeed responsible for the build-up of high supersaturation with respect to hydroxyapatite (ΩHA > 11) at which calcification can occur. Interestingly, the cellular localization of the alkaline phosphatase might influence the calcification pattern, but not supersaturation nor the amount of Ca-phosphate eventually formed by the bacteria. These results confirm that phosphatase activity might be one of the important enzymatic processes involved in the formation of phosphorites in the environment, and provide experimental references (for instance, critical supersaturation for microbial Ca-phosphate formation) that could be used for the geochemical modeling of modern or past conditions conducive to Ca-phosphate formation in nature. It furthermore suggests that phosphatase activities, either directly measured in natural water columns and sediments (Hoppe, 2003) or indirectly assessed using metagenomics approaches (Kathuria and Martiny, 2011; Luo et al., 2011), might be used in a first-order model to predict Ca-phosphate precipitation rates in the environment.
This study furthermore provides experimental clues to better interpret the microbial fossil record in phosphorites. The composition, structure and morphology of the HA precipitates formed in the presence of E. coli cells was very similar to HA formed in the absence of cells, suggesting that such features cannot be used as biogenicity criteria. Texture however, i.e., the way precipitates are spatially distributed and crystallographically oriented at the sub-micrometer scale, was different in precipitates formed with and without E. coli. In particular, the textural evidence of a calcified periplasm might be a powerful biosignature and an indicator of active microbial Ca-phosphate biomineralization in modern and ancient phosphorites. Importantly, such textural features could only be observed using nano-scale methods such as TEM and STXM. This argues for a more systematic use of high-resolution methods for the identification and interpretation of biomorphic microstructures in phosphorites and other rocks.
Conflict of Interest Statement
The authors declare that the research was conducted in the absence of any commercial or financial relationships that could be construed as a potential conflict of interest.
Acknowledgments
This work was supported by the CNRS-INSU EC2CO program (PI: ED). Advanced Light Source (ALS) Molecular Environmental Science beamline 11.0.2 was supported by the Office of Science, Office of Basic Energy Sciences, Division of Chemical Sciences, Geosciences, and Biosciences and Materials Sciences Division, U.S. Department of Energy, at the Lawrence Berkeley National Laboratory. The TEM facility at IMPMC was purchased owing to a support by Region Ile-de-France grant SESAME 2000 E 1435. The SEM facility at IMPMC was purchased owing to a support by Région Ile de France grant SESAME 2006 I-07-593/R. We thank Haohao Yi and Etienne Balan (IMPMC, Paris) for helping with FT-IR data acquisition and interpretation. The authors are indebted to Eric Ellison (University of Colorado) for proofreading this article.
Supplementary Material
The Supplementary Material for this article can be found online at: https://www.frontiersin.org/article/10.3389/feart.2015.00084
References
Bailey, J. V., Corsetti, F. A., Greene, S. E., Crosby, C. H., Liu, P., and Orphan, V. J. (2013). Filamentous sulfur bacteria preserved in modern and ancient phosphatic sediments: implications for the role of oxygen and bacteria in phosphogenesis. Geobiology 11, 397–405. doi: 10.1111/gbi.12046
Balan, E., Delattre, S., Roche, D., Segalen, L., Morin, G., Guillaumet, M., et al. (2010). Line-broadening effects in the powder infrared spectrum of apatite. Phys. Chem. Miner. 38, 111–122. doi: 10.1007/s00269-010-0388-x
Bazin, D., Daudon, M., Combes, C., and Rey, C. (2012). Characterization and some physicochemical aspects of pathological microcalcifications. Chem. Rev. 112, 5092–5120. doi: 10.1021/cr200068d
Beazley, M. J., Martinez, R. J., Sobecky, P. A., Webb, S. M., and Taillefert, M. (2007). Uranium biomineralization as a result of bacterial phosphatase activity: insights from bacterial isolates from a contaminated subsurface. Environ. Sci. Technol. 41, 5701–5707. doi: 10.1021/es070567g
Benzerara, K., Menguy, N., Guyot, F., Skouri, F., de Luca, G., Barakat, M., et al. (2004a). Biologically controlled precipitation of calcium phosphate by Ramlibacter tataouinensis. Earth Planet. Sci. Lett. 228, 439–449. doi: 10.1016/j.epsl.2004.09.030
Benzerara, K., Yoon, T. H., Tyliszczak, T., Constantz, B., Spormann, A. M., and Brown, G. E. (2004b). Scanning transmission X-ray microscopy study of microbial calcification. Geobiology 2, 249–259. doi: 10.1111/j.1472-4677.2004.00039.x
Beshah, K., Rey, C., Glimcher, M. J., Schimizu, M., and Griffin, R. G. (1990). Solid state carbon-13 and proton NMR studies of carbonate-containing calcium phosphates and enamel. J. Solid State Chem. 84, 71–81. doi: 10.1016/0022-4596(90)90185-Z
Blake, R. E., O'Neil, J. R., and Garcia, G. A. (1998). Effects of microbial activity on the delta 18 O of dissolved inorganic phosphate and textural features of synthetic apatites. Am. Mineral. 83, 1516–1531.
Bradley, J. V., Bridgland, L. N., Colyer, D. E., Duer, M. J., Friščič, T., Gallagher, J., et al. (2010). NMR of biopolymer-apatite composites: developing a model of the molecular structure of the mineral-matrix interface in calcium phosphate biomaterials. Chem. Mater. 22, 6109–6116. doi: 10.1021/cm101730f
Brandes, J. A., Lee, C., Wakeham, S., Peterson, M., Jacobsen, C., Wirick, S., et al. (2004). Examining marine particulate organic matter at sub-micron scales using scanning transmission X-ray microscopy and carbon X-ray absorption near edge structure spectroscopy. Mar. Chem. 92, 107–121. doi: 10.1016/j.marchem.2004.06.020
Chen, P. S., Toribara, T. Y., and Warner, H. (1956). Microdetermination of Phosphorus. Anal. Chem. 28, 1756–1758. doi: 10.1021/ac60119a033
Cho, G. (2003). Detection of hydroxyl ions in bone mineral by solid-state NMR spectroscopy. Science 300, 1123–1127. doi: 10.1126/science.1078470
Clark, L. L., Ingall, E. D., and Benner, R. (1998). Marine phosphorus is selectively remineralized. Nature 393, 426. doi: 10.1038/30881
Cody, G., Boyce, C., Knoll, A., Wirick, S., and Jacobsen, C. (2003). In-situ chemical analysis of ancient micro-fossils with STXM. Abstr. Pap. Am. Chem. Soc. 225, U928–U928.
Cosmidis, J., Benzerara, K., Gheerbrant, E., Estève, I., Bouya, B., and Amaghzaz, M. (2013a). Nanometer-scale characterization of exceptionally preserved bacterial fossils in Paleocene phosphorites from Ouled Abdoun (Morocco). Geobiology 11, 139–153. doi: 10.1111/gbi.12022
Cosmidis, J., Benzerara, K., Menguy, N., and Arning, E. (2013b). Microscopy evidence of bacterial microfossils in phosphorite crusts of the Peruvian shelf: implications for phosphogenesis mechanisms. Chem. Geol. 359, 10–22. doi: 10.1016/j.chemgeo.2013.09.009
Cosmidis, J., Benzerara, K., Nassif, N., Tyliszczak, T., and Bourdelle, F. (2015). Characterization of Ca-phosphate biological materials by scanning transmission X-ray microscopy (STXM) at the Ca L2, 3-, P L2, 3- and C K-edges. Acta Biomater. 12, 260–269. doi: 10.1016/j.actbio.2014.10.003
Crosby, C. H., and Bailey, J. V. (2012). The role of microbes in the formation of modern and ancient phosphatic mineral deposits. Front. Microbiol. 3:241. doi: 10.3389/fmicb.2012.00241
Crowell, J. A., and Bowers, G. N. Jr. (1985). Apparent binding of ionized calcium by various buffers. Clin. Chem. 31, 267–270.
De Yoreo, J. J. (2003). Principles of crystal nucleation and growth. Rev. Mineral. Geochem. 54, 57–93. doi: 10.2113/0540057
Dominguez, D. C. (2004). Calcium signalling in bacteria. Mol. Microbiol. 54, 291–297. doi: 10.1111/j.1365-2958.2004.04276.x
Dorozhkin, S. V. (2009). Nanodimensional and nanocrystalline apatites and other calcium orthophosphates in biomedical engineering, biology and medicine. Materials 2, 1975–2045. doi: 10.3390/ma2041975
Driessens, F. C. M., and Verbeeck, R. M. H. (1981). Metastable states in calcium phosphate—aqueous phase equilibrations. J. Cryst. Growth 53, 55–62. doi: 10.1016/0022-0248(81)90055-5
Ducheyne, P., Radin, S., and King, L. (1993). The effect of calcium phosphate ceramic composition and structure on in vitro behavior. I. Dissolution. J. Biomed. Mater. Res. 27, 25–34. doi: 10.1002/jbm.820270105
Duer, M. J., Friscic, T., Murray, R. C., Reid, D. G., and Wise, E. R. (2009). The mineral phase of calcified cartilage: its molecular structure and interface with the organic matrix. Biophys. J. 96, 3372–3378. doi: 10.1016/j.bpj.2008.12.3954
Dunham-Cheatham, S., Rui, X., Bunker, B., Menguy, N., Hellmann, R., and Fein, J. (2011). The effects of non-metabolizing bacterial cells on the precipitation of U, Pb and Ca phosphates. Geochim. Cosmochim. Acta 75, 2828–2847. doi: 10.1016/j.gca.2011.02.030
Ehrlich, H. L., and Newman, D. K. (eds.). (2009). “Geomicrobial interactions with phosphorus,” in Geomicrobiology, 5th Edn. (Boca Raton, FL: CRC Press), 219–232.
Ennever, J. (1963). Microbiologic calcifications. Ann. N.Y. Acad. Sci. 109, 4–13. doi: 10.1111/j.1749-6632.1963.tb13457.x
Ennever, J., Riggan, L. J., Vogel, J. J., and Boyan-Salyers, B. (1978). Characterization of bacterionema matruchotii calcification nucleator. J. Dent. Res. 57, 637–642. doi: 10.1177/00220345780570041901
Ennever, J., Streckfuss, J. L., and Goldschmidt, M. C. (1981). Calcifiability comparison among selected microorganisms. J. Dent. Res. 60, 1793–1796. doi: 10.1177/00220345810600101001
Ennever, J., Vogel, J. J., Rider, L. J., and Boyan-Salyers, B. (1976). Nucleation of microbiologic calcification by proteolipid. Proc. Soc. Exp. Biol. Med. 152, 147–150. doi: 10.3181/00379727-152-39348
Ennever, J., Vogel, J. J., and Streckfuss, J. L. (1974). Calcification by Escherichia coli. J. Bacteriol. 119, 1061–1062.
Ferguson, P. L. (2004). Human S100B protein interacts with the Escherichia coli division protein ftsz in a calcium-sensitive manner. J. Biol. Chem. 279, 18806–18813. doi: 10.1074/jbc.M313948200
Filippelli, G. M. (2002). The global phosphorus cycle. Rev. Mineral. Geochem. 48, 391–425. doi: 10.2138/rmg.2002.48.10
Fleet, M. E., and Liu, X. (2004). Location of type B carbonate ion in type A–B carbonate apatite synthesized at high pressure. J. Solid State Chem. 177, 3174–3182. doi: 10.1016/j.jssc.2004.04.002
Follmi, K. (1996). The phosphorus cycle, phosphogenesis and marine phosphate-rich deposits. Earth-Sci. Rev. 40, 55–124. doi: 10.1016/0012-8252(95)00049-6
Fortin, D., Ferris, F. G., and Beveridge, T. J. (1997). Surface-mediated mineral development by bacteria. Rev. Mineral. Geochem. 35, 161–180.
Fulmer, M. T., Ison, I. C., Hankermayer, C. R., Constantz, B. R., and Ross, J. (2002). Measurements of the solubilities and dissolution rates of several hydroxyapatites. Biomaterials 23, 751–755. doi: 10.1016/S0142-9612(01)00180-6
Gan, Y., Han, D., Gu, F., Wang, Z., and Guo, G. (2010). Biomimetic synthesis of calcium-strontium apatite hollow nanospheres. Sci. China Chem. 53, 1723–1727. doi: 10.1007/s11426-010-3171-4
Garen, A., and Levinthal, C. (1960). A fine-structure genetic and chemical study of the enzyme alkaline phosphatase of E. coli. I. Purification and characterization of alkaline phosphatase. Biochim. Biophys. Acta 38, 470–483. doi: 10.1016/0006-3002(60)91282-8
Gibson, I. R., and Bonfield, W. (2002). Novel synthesis and characterization of an AB-type carbonate-substituted hydroxyapatite. J. Biomed. Mater. Res. 59, 697–708. doi: 10.1002/jbm.10044
Gilinskaya, L. G., Zanin, Y. N., and Rudina, N. A. (2007). Bacterial genesis of calcium phosphates in human organism and nature. Lithol. Miner. Resour. 42, 56–67. doi: 10.1134/S0024490207010063
Haberstroh, P. R., Brandes, J. A., Gélinas, Y., Dickens, A. F., Wirick, S., and Cody, G. (2006). Chemical composition of the graphitic black carbon fraction in riverine and marine sediments at sub-micron scales using carbon X-ray spectromicroscopy. Geochim. Cosmochim. Acta 70, 1483–1494. doi: 10.1016/j.gca.2005.12.001
Hirschler, A., Lucas, J., and Hubert, J. (1990). Apatite genesis: a biologically induced or biologically controlled mineral formation process? Geomicrobiol. J. 8, 47–56. doi: 10.1080/01490459009377877
Hoppe, H. (2003). Phosphatase activity in the sea. Hydrobiologia 493, 187–200. doi: 10.1023/A:1025453918247
Huang, S.-J., Tsai, Y.-L., Lee, Y.-L., Lin, C.-P., and Chan, J. C. C. (2009). Structural model of rat dentin revisited. Chem. Mater. 21, 2583–2585. doi: 10.1021/cm9006537
Inouye, H., and Beckwith, J. (1977). Synthesis and processing of an Escherichia coli alkaline phosphatase precursor in vitro. Proc. Natl. Acad. Sci. U.S.A. 74, 1440–1444. doi: 10.1073/pnas.74.4.1440
Jäger, C., Welzel, T., Meyer-Zaika, W., and Epple, M. (2006). A solid-state NMR investigation of the structure of nanocrystalline hydroxyapatite. Magn. Reson. Chem. 44, 573–580. doi: 10.1002/mrc.1774
Johnson, K. A., and Goody, R. S. (2011). The original michaelis constant: translation of the 1913 Michaelis–Menten Paper. Biochemistry 50, 8264–8269. doi: 10.1021/bi201284u
Jones, H. E., Holland, I. B., and Campbell, A. K. (2002). Direct measurement of free Ca(2+) shows different regulation of Ca(2+) between the periplasm and the cytosol of Escherichia coli. Cell Calcium 32, 183–192. doi: 10.1016/S0143416002001537
Kathuria, S., and Martiny, A. C. (2011). Prevalence of a calcium-based alkaline phosphatase associated with the marine cyanobacterium Prochlorococcus and other ocean bacteria. Environ. Microbiol. 13, 74–83. doi: 10.1111/j.1462-2920.2010.02310.x
Kniep, R., and Simon, P. (2007). “Fluorapatite-gelatine-nanocomposites: self-organized morphogenesis, real structure and relations to natural hard materials,” in Biomineralization I, ed K. Naka (Berlin; Heidelberg: Springer), 73–125. Available online at: http://www.springerlink.com/index/10.1007/128_053 (Accessed June 22, 2013). doi: 10.1007/128_053
Kulp, A., and Kuehn, M. J. (2010). Biological functions and biogenesis of secreted bacterial outer membrane vesicles. Annu. Rev. Microbiol. 64, 163–184. doi: 10.1146/annurev.micro.091208.073413
Lafon, J. P., Champion, E., and Bernache-Assollant, D. (2008). Processing of AB-type carbonated hydroxyapatite Ca10-x(PO4)6-x(CO3)x(OH)2-x-2y(CO3)y ceramics with controlled composition. J. Eur. Ceram. Soc. 28, 139–147. doi: 10.1016/j.jeurceramsoc.2007.06.009
Lagno, F., Rocha, S. D. F., Katsarou, L., and Demopoulos, G. P. (2012). Supersaturation-controlled synthesis of dicalcium phosphate dihydrate and nanocrystalline calcium-deficient hydroxyapatite. Ind. Eng. Chem. Res. 51, 6605–6612. doi: 10.1021/ie300059d
Lamboy, M. (1994). Nannostructure and genesis of phosphorites from ODP Leg 112, the Peru margin. Mar. Geol. 118, 5–22. doi: 10.1016/0025-3227(94)90110-4
Lehmann, J., Liang, B., Solomon, D., Lerotic, M., Luizão, F., Kinyangi, J., et al. (2005). Near-edge X-ray absorption fine structure (NEXAFS) spectroscopy for mapping nano-scale distribution of organic carbon forms in soil: application to black carbon particles. Glob. Biogeochem. Cycles 19, 1013–1025. doi: 10.1029/2004gb002435
Li, J., Bernard, S., Benzerara, K., Beyssac, O., Allard, T., Cosmidis, J., et al. (2014). Impact of biomineralization on the preservation of microorganisms during fossilization: an experimental perspective. Earth Planet. Sci. Lett. 400, 113–122. doi: 10.1016/j.epsl.2014.05.031
Liou, S.-C., Chen, S.-Y., Lee, H.-Y., and Bow, J.-S. (2004). Structural characterization of nano-sized calcium deficient apatite powders. Biomaterials 25, 189–196. doi: 10.1016/S0142-9612(03)00479-4
Lucas, J., and Prévôt, F. (1981). Synthèse d'apatite à partir de matière organique phosphatée (ARN) et de calcite par voie bactérienne. Comptes Rendus Académie Sci. Sér. 2 Mécanique Phys. Chim. Astron. 292, 1203.
Lucas, J., and Prévôt, L. (1984). Synthèse de l'apatite par voie bactérienne à partir de matière organique phosphatée et de divers carbonates de calcium dans des eaux douce et marine naturelles. Chem. Geol. 42, 101–118. doi: 10.1016/0009-2541(84)90008-1
Luo, H., Benner, R., Long, R. A., and Hu, J. (2009). From the Cover: subcellular localization of marine bacterial alkaline phosphatases. Proc. Natl. Acad. Sci. U.S.A. 106, 21219–21223. doi: 10.1073/pnas.0907586106
Luo, H., Zhang, H., Long, R., and Benner, R. (2011). Depth distributions of alkaline phosphatase and phosphonate utilization genes in the North Pacific Subtropical Gyre. Aquat. Microb. Ecol. 62, 61–69. doi: 10.3354/ame01458
Ma, Y., Chen, C., Meigs, G., Randall, K., and Sette, F. (1991). High-resolution K-shell photoabsorption measurements of simple molecules. Phys. Rev. A 44, 1848–1858. doi: 10.1103/PhysRevA.44.1848
Macaskie, L. E., Bonthrone, K. M., Yong, P., and Goddard, D. T. (2000). Enzymically mediated bioprecipitation of uranium by a Citrobacter sp.: a concerted role for exocellular lipopolysaccharide and associated phosphatase in biomineral formation. Microbiol. Read. Engl. 146(Pt 8), 1855–1867. doi: 10.1099/00221287-146-8-1855
Martinez, M. B., Flickinger, M. C., and Nelsestuen, G. L. (1996). Accurate kinetic modeling of alkaline phosphatase in the Escherichia coli periplasm: implications for enzyme properties and substrate diffusion. Biochemistry 35, 1179–1186. doi: 10.1021/bi951955a
Martinez, M. B., Flickinger, M. C., and Nelsestuen, G. L. (1999). Steady-state enzyme kinetics in the Escherichia coli periplasm: a model of a whole cell biocatalyst. J. Biotechnol. 71, 59–66. doi: 10.1016/S0168-1656(99)00015-2
Martinez, M. B., Schendel, F. J., Flickinger, M. C., and Nelsestuen, G. L. (1992). Kinetic properties of enzyme populations in vivo: alkaline phosphatase of the Escherichia coli periplasm. Biochemistry 31, 11500–11509. doi: 10.1021/bi00161a031
Martinez, R. J., Beazley, M. J., Taillefert, M., Arakaki, A. K., Skolnick, J., and Sobecky, P. A. (2007). Aerobic uranium (VI) bioprecipitation by metal-resistant bacteria isolated from radionuclide- and metal-contaminated subsurface soils. Environ. Microbiol. 9, 3122–3133. doi: 10.1111/j.1462-2920.2007.01422.x
Matias, V. R. F., Al-Amoudi, A., Dubochet, J., and Beveridge, T. J. (2003). Cryo-transmission electron microscopy of frozen-hydrated sections of Escherichia coli and Pseudomonas aeruginosa. J. Bacteriol. 185, 6112–6118. doi: 10.1128/JB.185.20.6112-6118.2003
Meyer, J. L., and Fowler, B. O. (1982). Lattice defects in nonstoichiometric calcium hydroxylapatites. A chemical approach. Inorg. Chem. 21, 3029–3035. doi: 10.1021/ic00138a021
Moorehead, W. R., and Biggs, H. G. (1974). 2-Amino-2-methyl-1-propanol as the Alkalizing agent in an improved continuous-flow cresolphthalein complexone procedure for calcium in serum. Clin. Chem. 20, 1458–1460.
Müller, L., and Müller, F. A. (2006). Preparation of SBF with different HCO3- content and its influence on the composition of biomimetic apatites. Acta Biomater. 2, 181–189. doi: 10.1016/j.actbio.2005.11.001
Mullins, H. T., and Rasch, R. F. (1985). Sea-floor phosphorites along the Central California continental margin. Econ. Geol. 80, 696–715. doi: 10.2113/gsecongeo.80.3.696
Murarka, A., Dharmadi, Y., Yazdani, S. S., and Gonzalez, R. (2007). Fermentative utilization of glycerol by escherichia coli and its implications for the production of fuels and chemicals. Appl. Environ. Microbiol. 74, 1124–1135. doi: 10.1128/AEM.02192-07
Nancollas, G. H., and Tomazic, B. (1974). Growth of calcium phosphate on hydroxyapatite crystals. Effect of supersaturation and ionic medium. J. Phys. Chem. 78, 2218–2225. doi: 10.1021/j100615a007
Nassif, N., Martineau, F., Syzgantseva, O., Gobeaux, F., Willinger, M., Coradin, T., et al. (2010). In vivo inspired conditions to synthesize biomimetic hydroxyapatite. Chem. Mater. 22, 3653–3663. doi: 10.1021/cm903596q
Nawrot, C. F., Campbell, D. J., Schroeder, J. K., and van Valkenburg, M. (1976). Dental phosphoprotein-induced formation of hydroxylapatite during in vitro synthesis of amorphous calcium phosphate. Biochemistry 15, 3445–3449. doi: 10.1021/bi00661a008
Nilgiriwala, K. S., Alahari, A., Rao, A. S., and Apte, S. K. (2008). Cloning and overexpression of alkaline phosphatase PhoK from Sphingomonas sp. Strain BSAR-1 for bioprecipitation of uranium from alkaline solutions. Appl. Environ. Microbiol. 74, 5516–5523. doi: 10.1128/AEM.00107-08
Nıvlt, J. (1995). The ostwald rule of stages. Cryst. Res. Technol. 30, 443–449. doi: 10.1002/crat.2170300402
Omelon, S. J., and Grynpas, M. D. (2008). Relationships between polyphosphate chemistry, biochemistry and apatite biomineralization. Chem. Rev. 108, 4694–4715. doi: 10.1021/cr0782527
Pan, H.-B., and Darvell, B. W. (2009). Calcium phosphate solubility: the need for re-evaluation. Cryst. Growth Des. 9, 639–645. doi: 10.1021/cg801118v
Pan, H., and Darvell, B. W. (2010). Effect of carbonate on hydroxyapatite solubility. Cryst. Growth Des. 10, 845–850. doi: 10.1021/cg901199h
Pasteris, J. D., Wopenka, B., Freeman, J. J., Rogers, K., Valsami-Jones, E., van der Houwen, J. A. M., et al. (2004). Lack of OH in nanocrystalline apatite as a function of degree of atomic order: implications for bone and biomaterials. Biomaterials 25, 229–238. doi: 10.1016/S0142-9612(03)00487-3
Paytan, A., and McLaughlin, K. (2007). The oceanic phosphorus cycle. Chem. Rev. 107, 563–576. doi: 10.1021/cr0503613
Perez, R. A., Del Valle, S., Altankov, G., and Ginebra, M.-P. (2011). Porous hydroxyapatite and gelatin/hydroxyapatite microspheres obtained by calcium phosphate cement emulsion. J. Biomed. Mater. Res. B Appl. Biomater. 97B, 156–166. doi: 10.1002/jbm.b.31798
Pucéat, E., Reynard, B., and Lécuyer, C. (2004). Can crystallinity be used to determine the degree of chemical alteration of biogenic apatites? Chem. Geol. 205, 83–97. doi: 10.1016/j.chemgeo.2003.12.014
Purnachandra Rao, V., Naqvi, S. W. A., Dileep Kumar, M., Cardinal, D., Michard, A., Borole, D. V., et al. (2000). A comparative study of Pleistocene phosphorites from the continental slope off western India. Sedimentology 47, 945–960. doi: 10.1046/j.1365-3091.2000.00331.x
Rey, C., Combes, C., Drouet, C., and Glimcher, M. J. (2009). Bone mineral: update on chemical composition and structure. Osteoporos. Int. 20, 1013–1021. doi: 10.1007/s00198-009-0860-y
Rey, C., Combes, C., Drouet, C., Sfihi, H., and Barroug, A. (2007). Physico-chemical properties of nanocrystalline apatites: implications for biominerals and biomaterials. Mater. Sci. Eng. C 27, 198–205. doi: 10.1016/j.msec.2006.05.015
Rizzo, A. A., Scott, D. B., and Bladen, H. A. (1963). Calcification of oral bacteria. Ann. N.Y. Acad. Sci. 109, 14–22. doi: 10.1111/j.1749-6632.1963.tb13458.x
Roche, D., Ségalen, L., Balan, E., and Delattre, S. (2010). Preservation assessment of Miocene–Pliocene tooth enamel from Tugen Hills (Kenyan Rift Valley) through FTIR, chemical and stable-isotope analyses. J. Archaeol. Sci. 37, 1690–1699. doi: 10.1016/j.jas.2010.01.029
Salome, K. R., Green, S. J., Beazley, M. J., Webb, S. M., Kostka, J. E., and Taillefert, M. (2013). The role of anaerobic respiration in the immobilization of uranium through biomineralization of phosphate minerals. Geochim. Cosmochim. Acta 106, 344–363. doi: 10.1016/j.gca.2012.12.037
Schumacher, M., Christl, I., Scheinost, A. C., Jacobsen, C., and Kretzschmar, R. (2005). Chemical heterogeneity of organic soil colloids investigated by scanning transmission X-ray microscopy and C-1s NEXAFS microspectroscopy. Environ. Sci. Technol. 39, 9094–9100. doi: 10.1021/es050099f
She, Z., Strother, P., McMahon, G., Nittler, L. R., Wang, J., Zhang, J., et al. (2013). Terminal Proterozoic cyanobacterial blooms and phosphogenesis documented by the Doushantuo granular phosphorites I: in situ micro-analysis of textures and composition. Precambrian Res. 235, 20–35. doi: 10.1016/j.precamres.2013.05.011
Shelobolina, E. S., Konishi, H., Xu, H., and Roden, E. E. (2009). U(VI) sequestration in hydroxyapatite produced by microbial glycerol 3-phosphate metabolism. Appl. Environ. Microbiol. 75, 5773–5778. doi: 10.1128/AEM.00628-09
Shimizu, K. (2013). Metabolic regulation of a bacterial cell system with emphasis on Escherichia coli Metabolism. ISRN Biochem. 2013, 1–47. doi: 10.1155/2013/645983
Söhnel, O., and Grases, F. (2011). Supersaturation of body fluids, plasma and urine, with respect to biological hydroxyapatite. Urol. Res. 39, 429–436. doi: 10.1007/s00240-011-0387-5
Soudry, D. (2000). “Microbial phosphate sediment,” in Microbial Sediments, eds R. E. Riding and S. M. Awramik (Berlin; Heidelberg: Springer-Verlag), 127–136. doi: 10.1007/978-3-662-04036-2_15
Soudry, D., and Lewy, Z. (1988). Microbially influenced formation of phosphate nodules and megafossil moulds (Negev, Southern Israel). Palaeogeogr. Palaeoclimatol. Palaeoecol. 64, 15–34. doi: 10.1016/0031-0182(88)90139-3
Streckfuss, J. L., Smith, W. N., Brown, L. R., and Campbell, M. M. (1974). Calcification of selected strains of streptococcus mutans and Streptococcus sanguis. J. Bacteriol. 120, 502–506.
Studier, F. W., and Moffatt, B. A. (1986). Use of bacteriophage T7 RNA polymerase to direct selective high-level expression of cloned genes. J. Mol. Biol. 189, 113–130. doi: 10.1016/0022-2836(86)90385-2
Sun, R., Lu, Y., and Chen, K. (2009). Preparation and characterization of hollow hydroxyapatite microspheres by spray drying method. Mater. Sci. Eng. C 29, 1088–1092. doi: 10.1016/j.msec.2008.08.010
Surovell, T. A., and Stiner, M. C. (2001). Standardizing infra-red measures of bone mineral crystallinity: an experimental approach. J. Archaeol. Sci. 28, 633–642. doi: 10.1006/jasc.2000.0633
Takazoe, I., Kurahashi, Y., and Takuma, S. (1963). Electron microscopy of intracellular mineralization of oral filamentous microorganisms in vitro. J. Dent. Res. 42, 681–685. doi: 10.1177/00220345630420021601
Teshima, K., Sakurai, M., Lee, S., Yubuta, K., Ito, S., Suzuki, T., et al. (2009). Morphologically controlled fibrous spherulites of an apatite precursor biocrystal. Cryst. Growth Des. 9, 650–652. doi: 10.1021/cg800791s
Vallet-Regi, M., Rodriguez-Lorenzo, L. M., and Salinas, A. J. (1997). Synthesis and characterization of calcium deficient apatite. Solid State Ion. 101–103, 1279–1285. doi: 10.1016/S0167-2738(97)00213-0
Valsami-Jones, E. (2001). Mineralogical controls on phosphorus recovery from wastewaters. Mineral. Mag. 65, 611–620. doi: 10.1180/002646101317018433
Van Der Houwen, J. A. M., Cressey, G., Cressey, B. A., and Valsami-Jones, E. (2003). The effect of organic ligands on the crystallinity of calcium phosphate. J. Cryst. Growth 249, 572–583. doi: 10.1016/S0022-0248(02)02227-3
Van der Lee, J. (1998). Thermodynamic and Mathematical Concepts of CHESS. Technical Report Nr. LHM/RD/98/39. Ecole des mines de Paris. Fontainebleau, France.
Van Kemenade, M. J. J. M., and de Bruyn, P. L. (1987). A kinetic study of precipitation from supersaturated calcium phosphate solutions. J. Colloid Interface Sci. 118, 564–585. doi: 10.1016/0021-9797(87)90490-5
Vignoles, M., Bonel, G., Holcomb, D. W., and Young, R. A. (1988). Influence of preparation conditions on the composition of type B carbonated hydroxyapatite and on the localization of the carbonate ions. Calcif. Tissue Int. 43, 33–40. doi: 10.1007/BF02555165
Wang, Y., Azaïs, T., Robin, M., Vallée, A., Catania, C., Legriel, P., et al. (2012). The predominant role of collagen in the nucleation, growth, structure and orientation of bone apatite. Nat. Mater. 11, 724–733. doi: 10.1038/nmat3362
Wang, Y., Von Euw, S., Fernandes, F. M., Cassaignon, S., Selmane, M., Laurent, G., et al. (2013). Water-mediated structuring of bone apatite. Nat. Mater. 12, 1144–1153. doi: 10.1038/nmat3787
Wright, K. E., Hartmann, T., and Fujita, Y. (2011). Inducing mineral precipitation in groundwater by addition of phosphate. Geochem. Trans. 12:8. doi: 10.1186/1467-4866-12-8
Wu, Y., Ackerman, J. L., Kim, H.-M., Rey, C., Barroug, A., and Glimcher, M. J. (2002). Nuclear magnetic resonance spin-spin relaxation of the crystals of bone, dental enamel, and synthetic hydroxyapatites. J. Bone Miner. Res. Off. J. Am. Soc. Bone Miner. Res. 17, 472–480. doi: 10.1359/jbmr.2002.17.3.472
Young, C. L., and Ingall, E. D. (2010). Marine dissolved organic phosphorus composition: insights from samples recovered using combined electrodialysis/reverse osmosis. Aquat. Geochem. 16, 563–574. doi: 10.1007/s10498-009-9087-y
Keywords: biomineralization, hydroxyapatite, alkaline phosphatase, phosphorites, microbial fossils
Citation: Cosmidis J, Benzerara K, Guyot F, Skouri-Panet F, Duprat E, Férard C, Guigner J-M, Babonneau F and Coelho C (2015) Calcium-Phosphate Biomineralization Induced by Alkaline Phosphatase Activity in Escherichia coli: Localization, Kinetics, and Potential Signatures in the Fossil Record. Front. Earth Sci. 3:84. doi: 10.3389/feart.2015.00084
Received: 29 July 2015; Accepted: 02 December 2015;
Published: 21 December 2015.
Edited by:
Karyn L. Rogers, Rensselaer Polytechnic Institute, USAReviewed by:
William Patrick Gilhooly III, Indiana University Purdue University Indianapolis, USAChristian März, Newcastle University, UK
Copyright © 2015 Cosmidis, Benzerara, Guyot, Skouri-Panet, Duprat, Férard, Guigner, Babonneau and Coelho. This is an open-access article distributed under the terms of the Creative Commons Attribution License (CC BY). The use, distribution or reproduction in other forums is permitted, provided the original author(s) or licensor are credited and that the original publication in this journal is cited, in accordance with accepted academic practice. No use, distribution or reproduction is permitted which does not comply with these terms.
*Correspondence: Karim Benzerara, karim.benzerara@impmc.upmc.fr
†Present Address: Julie Cosmidis, Geomicrobiology Laboratory, Department of Geological Sciences, University of Colorado, Boulder, CO, USA