Pan-Arctic Trends in Terrestrial Dissolved Organic Matter from Optical Measurements
 Paul J. Mann1*
  Robert G. M. Spencer2
  Peter J. Hernes3
  Johan Six4
  George R. Aiken5
  Suzanne E. Tank6
  James W. McClelland7 Kenna D. Butler5
  Rachael Y. Dyda3 Robert M. Holmes8
- 1Department of Geography, Northumbria University, Newcastle-Upon-Tyne, UK
- 2Department of Earth, Ocean and Atmospheric Science, Florida State University, Tallahassee, FL, USA
- 3Department of Land, Air, and Water Resources, University of California, Davis, Davis, CA, USA
- 4Department of Environmental Systems Science, ETH-Zurich, Zurich, Switzerland
- 5United States Geological Survey, Boulder, CO, USA
- 6Department of Biological Sciences, University of Alberta, Edmonton, AB, Canada
- 7Marine Science Institute, University of Texas, Port Aransas, TX, USA
- 8Woods Hole Research Center, Falmouth, MA, USA
Climate change is causing extensive warming across Arctic regions resulting in permafrost degradation, alterations to regional hydrology and shifting amounts and composition of dissolved organic matter (DOM) transported by streams and rivers. Here, we characterize the DOM composition and optical properties of the six largest Arctic rivers draining into the Arctic Ocean to examine the ability of optical measurements to provide meaningful insights into terrigenous carbon export patterns and biogeochemical cycling. The chemical composition of aquatic DOM varied with season, spring months were typified by highest lignin phenol and dissolved organic carbon (DOC) concentrations with greater hydrophobic acid content, and lower proportions of hydrophilic compounds, relative to summer and winter months. Chromophoric DOM (CDOM) spectral slope (S275–295) tracked seasonal shifts in DOM composition across river basins. Fluorescence and parallel factor analysis identified seven components across the six Arctic rivers. The ratios of “terrestrial humic-like” vs. “marine humic-like” fluorescent components co-varied with lignin monomer ratios over summer and winter months, suggesting fluorescence may provide information on the age and degradation state of riverine DOM. CDOM absorbance (a350) proved a sensitive proxy for lignin phenol concentrations across all six river basins and over the hydrograph, enabling for the first time the development of a single pan-arctic relationship between a350 and terrigenous DOC (R2 = 0.93). Combining this lignin proxy with high-resolution monitoring of a350, pan-arctic estimates of annual lignin flux were calculated to range from 156 to 185 Gg, resulting in shorter and more constrained estimates of terrigenous DOM residence times in the Arctic Ocean (spanning 7 months to 2½ years). Furthermore, multiple linear regression models incorporating both absorbance and fluorescence variables proved capable of explaining much of the variability in lignin composition across rivers and seasons. Our findings suggest that synoptic, high-resolution optical measurements can provide improved understanding of northern high-latitude organic matter cycling and flux, and prove an important technique for capturing future climate-driven changes.
Introduction
Northern high-latitude regions contain substantial quantities of organic carbon in perennially and seasonally frozen soils, comprising more than half the entire global carbon soil stock (Tarnocai et al., 2009). Large Arctic rivers play an increasingly recognized role in regional carbon cycling by transporting a proportion of this terrigenous material from land to the ocean, whilst also acting as sites for active carbon metabolism and transformation (Striegl et al., 2005; Holmes et al., 2012; Mann et al., 2015; Spencer et al., 2015). Arctic riverine export is substantial enough (~10% of the global freshwater discharge) that it imparts estuarine-like water quality characteristics throughout the Arctic Ocean, influencing coastal salinity structure on a localized basis (Aagaard and Carmack, 1989; Serreze et al., 2006; McClelland et al., 2011). Furthermore, significant quantities of dissolved organic matter (DOM) accompany this freshwater flux causing higher than average dissolved organic carbon (DOC) concentrations in the Arctic Ocean relative to other ocean basins (Opsahl et al., 1999; Mathis et al., 2005; Hernes and Benner, 2006). Six major Arctic rivers account for the majority of freshwater flux, each draining vast watersheds on the Eurasian (Kolyma, Ob', Lena, Yenisey) or North American (Mackenzie, Yukon) continents, combined delivering ~64% of the total freshwater supplied to the Arctic Ocean (Holmes et al., 2012).
Arctic rivers are characterized by their strong seasonality and large intra-annual variability in runoff, driven by extreme fluctuations in snow cover and air temperatures. Discharge rapidly peaks with the onset of snow melt and ice-breakup, resulting in dramatic spring freshet events and rapid transport of terrigenous DOM offshore (Stedmon et al., 2011a; Amon et al., 2012; Mann et al., 2012). By contrast, winter months are distinguished by low discharge and DOC concentrations, with DOM exhibiting lower average aromaticity and molecular weight (Spencer et al., 2008; O'Donnell et al., 2012). Future changes in the fluxes and composition of terrigenous DOM released to and exported from Arctic rivers are likely. River discharge across much of the pan-arctic watershed is increasing, particularly during winter months (Peterson, 2002; McClelland et al., 2006; Smith et al., 2007; Déry et al., 2009; Rawlins et al., 2010). Deepening of the seasonally thawed active layer will also result in leaching of deeper soil and permafrost horizons altering the amount and type of DOM liberated to inland waters (Romanovsky et al., 2010). Changes in the quality of DOM affect the reactivity and fate of terrigenous DOM, influencing carbon turnover rates and regional carbon budgets (Holmes et al., 2008; Mann et al., 2012, 2014; Wickland et al., 2012). Tracing future alterations in the composition as well as concentration of riverine DOM is therefore crucial for understanding the effects of climate change.
Lignin phenols are unique biomarkers of vascular plant material and therefore act as sensitive indicators for the terrigenous component of aquatic DOM. As well as providing pertinent information on DOM source, lignin phenols also have the capacity to capture degradative processing and source information (Opsahl and Benner, 1995; Hernes et al., 2007; Spencer et al., 2010a). DOM source and composition has also been assessed via separation of the DOM pool using XAD fractionation techniques. DOC fractionation has been used to differentiate between high molecular weight, aromatic dominated carbon DOM fractions, primarily sourced from allochthonous materials, and those dominated by microbially-derived or photodegraded DOM (e.g., Aiken et al., 1992; Spencer et al., 2012). Despite providing critical information, both lignin phenol and XAD fractionation techniques are costly and extremely time consuming to conduct, limiting their applicability for high-resolution monitoring. The remote nature of Arctic watersheds and the rapid shifts in hydrology make effective sampling and observation of these regions incredibly challenging. Despite far greater understanding of constituent fluxes and biogeochemical cycles across Arctic river systems, much garnered from international sampling campaigns (e.g., PARTNERS, Arctic-GRO), insufficient temporal and spatial resolution in measurements still limits our ability to capture changes in terrigenous DOM supply and examine how it may alter under future scenarios. For example, the Arctic Great Rivers Observatory (Arctic-GRO) captures the major seasonal patterns in river chemistry and freshwater discharge across the six major Arctic rivers, ensuring identical sampling and analytical protocols yet is limited with respect to the number of samples that can be feasibly collected. The use of optical measurements, which can be rapidly collected and measured, remotely derived or determined in-situ is one pathway that can help to address these problems.
A number of studies have investigated the ability of optical measurements to capture changes in DOM composition occurring across rivers or over the hydrograph, or to relate optical and lignin-based proxies to improve estimates of terrigenous DOM residence times in the Arctic Ocean (Spencer et al., 2009; Stedmon et al., 2011a; Walker et al., 2013). Recently, chromophoric DOM (CDOM) absorbance measurements from 30 unique US watersheds were shown to correlate to DOM composition, as derived via XAD fractionation, highlighting the potential of optical measurements to improve our understanding of DOM dynamics in fluvial systems (Spencer et al., 2012). Additionally, CDOM absorbance-lignin relationships have been developed for the Yukon River and then scaled to the pan-arctic, assuming similar relative loads of lignin in freshwater fluxes across all Arctic rivers (Spencer et al., 2009). Using this approach, Spencer et al. (2009) found that terrigenous DOM export to the Arctic Ocean was higher than previously thought, and thus concluded that a greater proportion must either be modified during transit though estuaries, or removal processes in the Arctic Ocean are greater than previously thought. CDOM fluorescence measurements have also shown to be potentially useful proxies for lignin phenol concentration and composition in freshwaters (Hernes et al., 2009; Walker et al., 2013). Successful relationships have been reported between CDOM fluorescence, collected as excitation-emission matrices (EEMs) and decomposed using parallel factor analysis (PARAFAC), and lignin measurements across individual Arctic rivers, yet pan-arctic relationships remain elusive (Walker et al., 2013). In particular, no studies have attempted to develop relationships between DOM optical properties from across all six Arctic rivers and DOC fractionation measurements (XAD), or with vascular plant biomarkers (lignin phenols) as rapid proxies for terrestrial DOC export and composition across the Arctic. Additionally, no studies have examined the utility of combining absorbance and fluorescence techniques to develop Arctic proxies for terrigenous DOM export.
Here, we characterize the DOM optical properties and composition (XAD and lignin phenol) of the six largest Arctic rivers to examine the ability of optical measurements to provide meaningful insights into terrigenous carbon export patterns and biogeochemical cycling across broad spatial scales in the Arctic. Specifically, we attempt to identify common optical indices that trace DOC and lignin phenol concentration and compositional information across all six Arctic rivers. Further, we examine the utility of using a combination of absorbance and fluorescence measurements to predict trends in DOC and lignin phenol biomarkers. Finally, we develop, for the first time, a pan-arctic optical proxy for estimating terrestrial OC flux from Arctic rivers to the Arctic Ocean and apply our findings to high-resolution optical measurements to improve terrigenous DOC export estimates.
Materials and Methods
Study Areas and Sample Collection
Samples from each of the six largest Arctic rivers were collected as part of the Arctic Great Rivers Observatory (Arctic-GRO; www.arcticgreatrivers.org; Figure 1). Each of the six rivers was sampled five times per year in 2009 and 2010 (except for 2009 on the Yukon with six samples) using a standardized collection method as detailed elsewhere (Raymond et al., 2007; McClelland et al., 2008; Holmes et al., 2012). Depth and width integrated samples were collected from near the mouth of each river (above tidal influence) across the hydrograph, incorporating baseflow, spring melt, and summer conditions. Near-daily surface sampling (0.5 m) was also conducted over the spring freshet hydrographs on each of the six Arctic rivers during both years to provide high-resolution optical measureents for this period (n = 241).
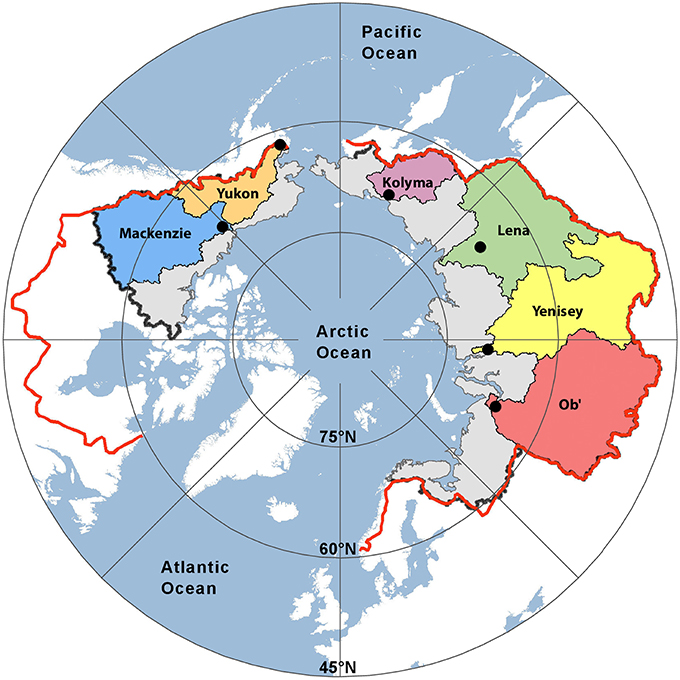
Figure 1. Map showing the six Arctic river catchments sampled. Black dots indicate sampling locations. The black (PA1) and red lines (PA2) represent two estimates of the total pan-arctic watershed area (16.8 × 10⁶ km2 and 20.5 × 10⁶ km2, respectively).
Samples collected for DOC concentration, optical properties and lignin analyses were filtered within a few hours of collection into pre-cleaned high-density polyethylene bottles through pre-rinsed 0.45 μm capsule filters (Geotech or Pall Aquaprep 600) and measured on unfractionated waters. Samples for DOC fractionation were filtered as above and acidified to pH 2.
Dissolved Organic Carbon and XAD Fractionation
Dissolved organic carbon (DOC) measurements were performed on a Shimadzu (TOC-V) organic carbon analyzer as the mean of 3–5 replicate injections where the coefficient of variance was < 2% (Mann et al., 2012). River water DOC samples were chromatographically separated into operationally defined hydrophobic organic acid (HPOA), hydrophobic neutral (HPON), low molecular weight hydrophilic (HPI) and transphilic organic acid (TPIA) fractions using XAD-8 and XAD-4 resins and established methodologies (Aiken et al., 1992). The amount of organic matter within each fraction is expressed as a percentage of the total DOC concentration and the sample mass of each fraction. The HPOA fraction typically contains more aromatic humic and fulvic acids and the HPI fraction less aromatic and more aliphatic forms of carbon, providing information on DOC composition.
Lignin Phenol Biomarkers
Lignin phenols were measured via the CuO oxidation method described by Hedges and Ertel (1982), with modifications as outlined by Spencer et al. (2010b). In brief, filtered whole waters were acidified to pH 2 with 12N HCl, rotary evaporated to ~3 mL and the concentrate transferred to Monel reaction vessels (Prime Focus, Inc.) and dried under vacuum centrifugation. All samples were alkaline oxidized at 155°C in a stoichiometric excess of CuO, followed by acidification (pH = 1 with 12 N H2SO4) and extracted three times with ethyl acetate, passed through Na2SO4 drying columns and taken to dryness under a gentle stream of ultrapure nitrogen. After redissolution in pyridine, lignin phenols were silylated (BSTFA) and quantified on a GC-MS (Agilent 6890 gas chromatograph equipped with an Agilent 5973 mass selective detector and a DB5-MS capillary column; 30 m, 0.25 mm inner diameter, Agilent) using cinnamic acid as an internal standard and a five-point calibration scheme. Eight lignin phenols were quantified for all samples, including three vanillyl phenols (vanillin, acetovanillone, vanillic acid), three syringyl phenols (syringaldehyde, acetosyringone, syringic acid), and two cinnamyl phenols (p-coumaric acid, ferulic acid). One blank was run for every ten-sample oxidations and all samples were blank corrected. Blank concentrations of lignin phenols were low (30–40 ng) and consequently never exceeded 5% of the total lignin phenols in a sample. Lignin phenol concentrations are reported as the sum of the cinnamyl, syringyl and vanillyl phenols (Σ8). Additionally, the carbon normalized sum of the lignin phenols (Λ8) were calculated.
DOM Absorbance and Fluorescence
UV-visible absorbance was measured in a 1 cm quartz cuvette across 200–800 nm at room temperature (20°C) with a dual beam Shimadzu UV-1800 spectrophotometer. Measurements were recorded in triplicate at 1 nm wavelength intervals and referenced against Milli-Q water blanks. Absorbance values were converted to Naperian absorption coefficients by multiplying raw absorbance values by 2.303 and dividing by the pathlength (m) (Hu et al., 2002). The slope (S) of the absorbance spectra was calculated from wavelength ranges spanning 275–295, 290–350, and 350–400 nm and the slope ratio (SR) determined (Helms et al., 2008). Slope coefficients can provide information pertaining to CDOM composition and source, with steeper values and increasing SR indicative of lower molecular weight and decreasing DOM aromaticity (Blough and Green, 1995; Blough and Del Vecchio, 2002; Helms et al., 2008). Specific UV absorbance (SUVA254) was calculated by dividing the decadal UV absorbance at 254 nm by the DOC concentration (Weishaar et al., 2003). The specific UV absorbance (SUVA254) has been shown to be positively correlated to percent aromaticity within DOM (Weishaar et al., 2003).
Fluorescence was analyzed using a Horiba Fluoromax-4 spectrofluorometer (Jobin-Yvon). Excitation-emission matrices (EEMs) were collected at 20°C in ratio (S/R) mode over excitation and emission wavelengths of 250–450 and 320–550 nm, in 5 and 2 nm increments respectively. Measurements were performed with 0.1s integration times and 5 nm slit widths on the excitation and emission monochromators. Instrument specific correction files were applied before further analyses. Fluorescence EEMs were blank corrected from at least daily Milli-Q blanks collected identically to samples. Daily water Raman scans were collected at Ex = 350 nm (e.g., Lawaetz and Stedmon, 2009). Raman and Rayleigh-Tyndall scatter were removed and interpolated using the smootheem function and absorbance measurements were used to correct EEMs for inner filter effects according to the method of Lakowicz (2006), within the drEEM toolbox (Murphy et al., 2013). The fluorescence index (FI) was also calculated as the ratio of emission at 470 to 520 nm, at an excitation wavelength of 370 nm (McKnight et al., 2001; Cory et al., 2010).
PARAFAC and Statistical Analyses
Exploratory analysis of fluorescence EEM data was conducted using parallel factor analysis (PARAFAC) to decompose the number, shape and amounts of underlying spectral components among samples. PARAFAC was conducted using the drEEM (version 2.0) and N-way (version 3.20) toolbox (Murphy et al., 2013) within the MATLAB R2013a environment.
To aid decomposition and provide greater variance within the dataset, additional EEMs (total n = 645) collected across a wide range of stream and river environments from the Kolyma River Basin were included and analyzed alongside the Arctic-GRO fluorescence dataset. PARAFAC modeling was performed after normalizing each EEM to its total signal (to unit norm) by dividing by the sum of the squared values of all variables in the sample, and imposing non-negativity constraints, thus negating problems caused by large concentration gradients apparent in seasonal samples (Murphy et al., 2013). The number of components within the model was validated using all of the techniques recommended in Murphy et al. (2013), including examination of systematic variation in the dataset, visualization of spectral loadings and split half analysis. The final model was successfully validated using four splits of the data and three validation tests across six different dataset halves (S4C6T3) (Harshman and Lundy, 1994; Murphy et al., 2013). Fluorescence loadings were calculated after normalizing the dataset ensuring unscaled model scores were recovered.
Principle component analysis (PCA; nonrotated solutions) was employed to explore relationships between optical properties, DOC and lignin phenol concentration and composition using the PLS_Toolbox (Eigenvector, Inc., Seattle, WA v. 8.0) within MATLAB (R2013a). Autoscaling was used on variables measured prior to PCA. Multiple linear regression models were developed using a forward stepwise approach minimizing the Akaike Information Criterion, and were conducted in SPSS v22 (IBM).
Constituent Flux Calculations
Constituent fluxes were estimated using the USGS LoadEstimator software (LOADEST) within the LoadRunner software interface (Runkel et al., 2004; Booth et al., 2007). LOADEST calculates daily constituent flux estimates by generating relationships between measured discharge and element concentrations and was run as in Holmes et al. (2012). Daily discharge data were obtained from US Geological Survey (Yukon), Water Survey of Canada (Mackenzie) and Roshydromet (Kolyma, Lena, Ob', and Yenisey), and are freely available from http://arcticgreatrivers.org/data.html and the Water Survey of Canada http://wateroffice.ec.gc.ca/mainmenu/historical_data_index_e.html. Corrections were applied to allow for the distance between the discharge measurement station and sample location as has been previously described (Holmes et al., 2012). Any gaps in the discharge data were filled by interpolation, however there were no gaps during peak flow on any river.
Results
Spatial and Temporal Patterns in Chemical Fractions of DOC
Total DOC concentrations ranged over the study period from 2.6 to 17.5 mg L−1. Highest average DOC concentrations were measured in the Lena river (15.7 ± 0.9 mg L−1, ± SE) during spring, and lowest during winter in the Yukon river (2.9 mg L−1, n = 1; Table 1). DOC concentrations from all six rivers were correlated with runoff (m3 km−2 d−1; R2 = 0.44, not shown). Riverine DOC was mainly comprised of high contributions from the HPOA fraction, averaging 53 ± 1% across the six Arctic rivers (Table 1). Eurasian rivers contained higher average proportions of the HPOA fraction over the year (54 to 56 ± 2%) relative to the North American Yukon (50 ± 2%) and Mackenzie rivers (45 ± 2%, t-test p < 0.001). HPI and TPIA fractions contributed a smaller proportion to bulk DOC, averaging 19 ± 0 and 17 ± 0% respectively. The average HPI and TPIA fractions were less variable than HPOA, ranging from 17 to 21 and 16 to 19% respectively across all sites and seasons (Table 1). HPON fractions generally contributed < 10% to bulk DOC across rivers and were thus omitted from further study.
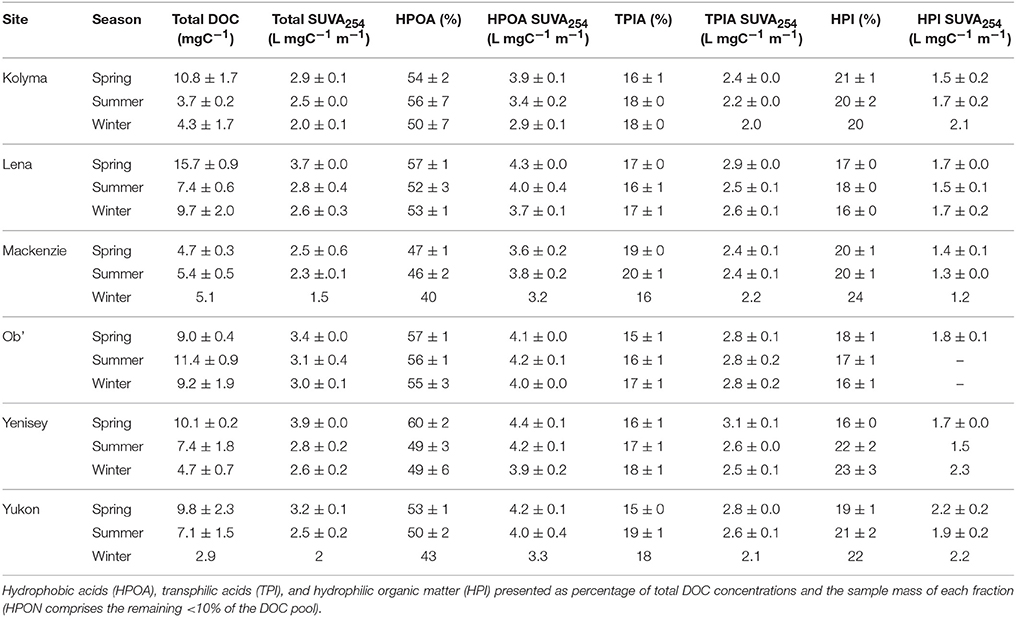
Table 1. Total dissolved organic carbon concentrations (DOC) and major chemical fractions of DOC and fraction-specific ultraviolet absorbance (SUVA254) across the six great Arctic rivers (mean ± standard error) during Spring (May and June), Summer (July through to October) and Winter (November through to April).
The composition of DOC was further characterized by calculating specific UV-visible absorbance (SUVA254) of DOC and its major chemical fractions (Table 1). Mean SUVA254 values of total DOC varied considerably among rivers with lowest values measured in the Mackenzie River (2.5 L mgC−1 m−1) and highest in the Yenisey River (3.4 L mgC−1 m−1). Mean SUVA254 values of the HPOA fraction also varied among rivers with lowest values observed in the Kolyma River (3.6 L mgC−1 m−1) and highest in the Yenisey (4.3 L mgC−1 m−1), and were consistently higher than bulk DOC highlighting the greater number of highly aromatic compounds represented by this fraction. The SUVA254 values of the HPI (1.2 to 2.3 L mgC−1 m−1) and TPIA (2.0 to 3.1 L mgC−1 m−1) fractions were less variable across rivers, and lower than bulk DOC, indicating the presence of a lower relative number of aromatic moieties (Table 1).
The contribution of HPOA to the total DOC pool was generally highest during spring months with maximum contributions varying considerably between rivers (47–60%; Table 1). Percent contributions of the HPOA fraction were typically lowest during winter flow periods. No clear seasonal differences in the fraction of HPOA present were observed in the Ob' River (55 ± 3 to 57 ±1%). Mean SUVA254 values of total DOC were consistently highest across all rivers during spring months, intermediate during summer months (2.3 to 3.1 L mgC−1 m−1) and lowest in winter across all rivers (1.5 to 3.0 L mgC−1 m−1; Table 1). SUVA254 values of the HPOA fraction followed similar seasonal trends as total DOC. TPIA and HPI SUVA254 values displayed less clear seasonal patterns (Table 1).
Spatial and Temporal Patterns in Lignin Phenols
Mean lignin phenol concentrations (Σ8) varied significantly among the six rivers, with lowest concentrations observed in the Mackenzie River (9.5 μg L−1) and highest in the Lena River (70.0 μg L−1; Table 2). Highest carbon normalized lignin yields (Λ8) were observed in the Yenisey River, mostly due to lower mean DOC concentrations relative to the Lena River (Table 2). Lowest mean Λ8 values were measured in the Mackenzie River [0.19 (mg(100 mg OC))−1]. Lignin values measured in this study were consistent with prior measurements in the Yukon and Russian Arctic rivers (Lobbes et al., 2000; Spencer et al., 2009) but notably lower than lignin measurements from the earlier PARTNERS project (Amon et al., 2012).
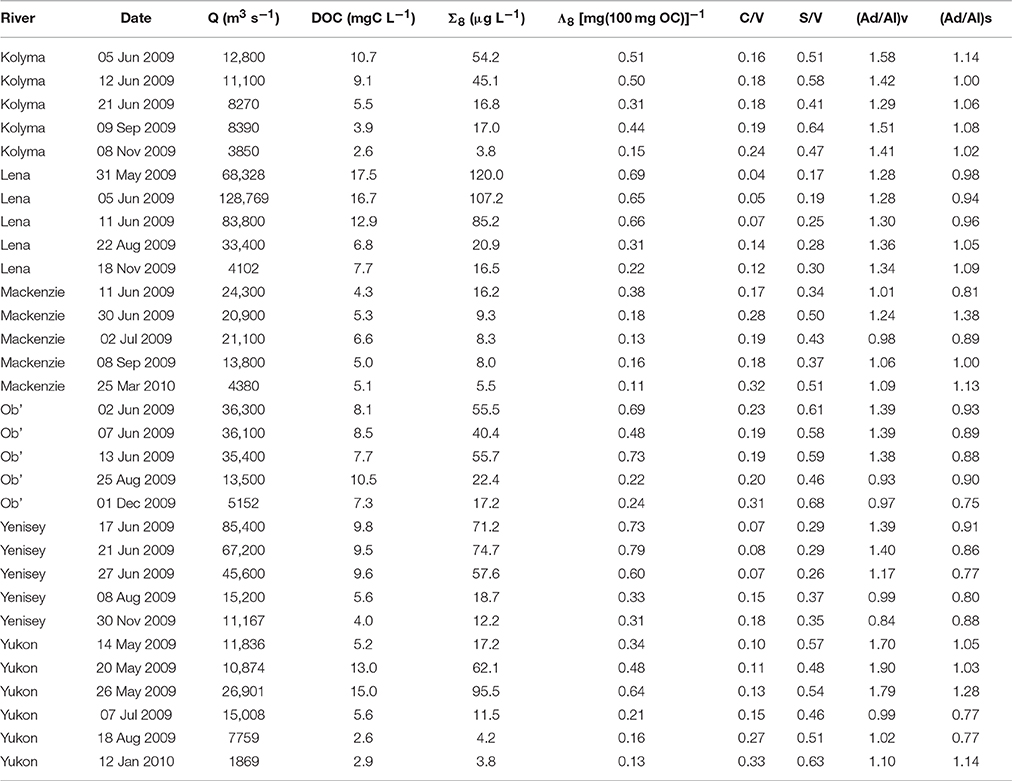
Table 2. Sampling location and date of dissolved organic carbon (DOC) and lignin phenol concentration (Σ8), carbon normalized sum of lignin yields (Λ8), lignin ratios (C/V and S/V), and acid aldehyde ratios (Ad/Al) measurements. Site-normalized discharge (Q) is also presented.
The Lena and Yenisey rivers displayed lowest mean cinnamyl (C) to vanillyl (V) phenol ratios (C/V), indicative of greater contributions of woody versus non-woody sources to bulk DOM of these rivers (Hedges and Mann, 1979). Highest C/V ratios were measured in the Mackenzie and Ob' Rivers (Table 2). Spatial variability in syringyl (S) to vanillyl ratios (S/V) mainly mirrored those of C/V, except for higher S/V values in the Yukon River as compared to the Mackenzie River (Table 2). Higher S/V ratios are indicative of greater proportions of angiosperm vs. gymnosperm sources to DOM (Hedges and Mann, 1979).
Acid to aldehyde ratios (Ad/Al) have been suggested to provide evidence of the relative degree of DOM degradation, with higher ratios indicating greater degradation of plant tissues (Hedges et al., 1988; Opsahl and Benner, 1995; Hernes and Benner, 2003). Mean ratios of vanillic acid to vanillin (Ad/Al)v ranged from 1.07 in the Mackenzie River to 1.48 in the Yukon River (Table 2). Ratios of syringic acid to syringaldehyde (Ad/Al)s varied from 0.84 in the Yenisey to 1.06 in the Mackenzie River.
Σ8 values among rivers were strongly linearly related to runoff (R2 = 0.69, not shown) suggesting terrigenous DOM export dynamics were largely controlled by hydrology. Accordingly, highest Σ8 concentrations were recorded across all rivers during the spring freshet and lowest concentrations during base flow winter conditions. Highest individual Σ8 values were measured in the Lena River (120 μg L−1) and lowest in the Kolyma and Yukon Rivers (3.8 μg L−1). During the freshet, Λ8 yields were between 2.6 and 4.8 times higher than winter Λ8 values across sites, the Yenisey River displaying the least variability and the Yukon the greatest (Table 2).
C/V and S/V ratios generally declined with increasing runoff across all rivers (Table 2). Acid aldehyde ratios (Al/Ad) were highly variable among rivers, generally increasing with greater runoff, yet in some cases (e.g., Lena River) demonstrated opposing patterns. Highest Ad/Al ratios during the spring freshet may represent the export of greater quantities of largely “fresh” microbially unprocessed DOM relative to later in the year (Hernes et al., 2007; Spencer et al., 2008; Amon et al., 2012).
Chromophoric and Fluorescence DOM of Arctic Rivers
The absorbance coefficient of CDOM at 350 nm (a350) ranged from 2.3 to 42.6 m−1 among rivers and seasons, and similar to DOC and Σ8 concentrations, generally increased with greater freshwater runoff (R2 = 0.57, p < 0.001, n = 60; Supplemental Table 1). Spectral slope values (S275–295, S290–350, S350–400) steepened with decreasing runoff, in good agreement with previous studies (Spencer et al., 2009; Stedmon et al., 2011a), indicating the export of lower molecular weight material, or DOM with decreasing aromaticity as discharge rates decline (Blough and Green, 1995; Blough and Del Vecchio, 2002). The slope ratio (SR) showed an opposing pattern to spectral slopes, declining at higher runoff rates thus confirming an increase in DOM molecular weight during the spring freshet and reduction during winter baseflow months (Helms et al., 2008; Spencer et al., 2010a, 2012).
Fluorescence index (FI) values were similar across rivers and averaged 1.34 ± 0.01 across all sites and sampling dates reflecting DOM from a mixture of terrigenous and microbial sources (McKnight et al., 2001). Highest FI values were measured across all rivers during winter months (mean 1.41 ± 0.03), reflecting a potentially higher contribution of microbial derived or lower aromaticity DOM during this period. Lowest FI values among rivers (mean 1.31 ± 0.01), indicative of greatest terrigenous and aromatic DOM supply, were observed during the high discharge spring freshet.
Parallel Factor Analysis (PARAFAC)
The PARAFAC analysis of DOM excitation-emission scans collected from all six Arctic rivers over the hydrograph identified seven unique components (Figure 2; Supplemental Figure 1). The spectra of each component identified were compared with the open fluorescence database (openfluor.org) containing spectra from previous studies (currently 53 studies) detailing PARAFAC models. All seven components (AG1-7) closely matched (tucker congruence coefficient, TCC > 0.95; Tucker, 1951) the excitation and emission spectra of previously identified components from 37 independent studies (Table 3).
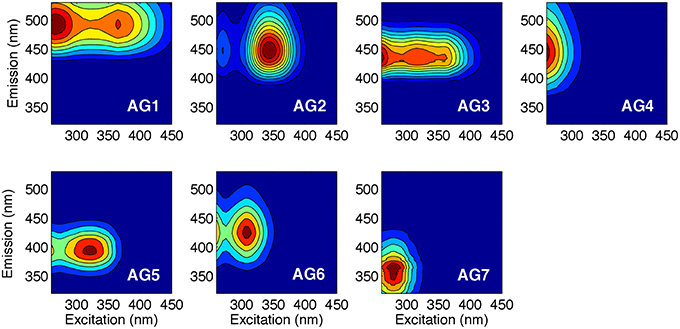
Figure 2. Seven independent fluorescent components (AG1-7) identified using PARAFAC analysis of 645 excitation-emission matrices. Excitation and emission peak positions are reported alongside descriptions in Table 3.
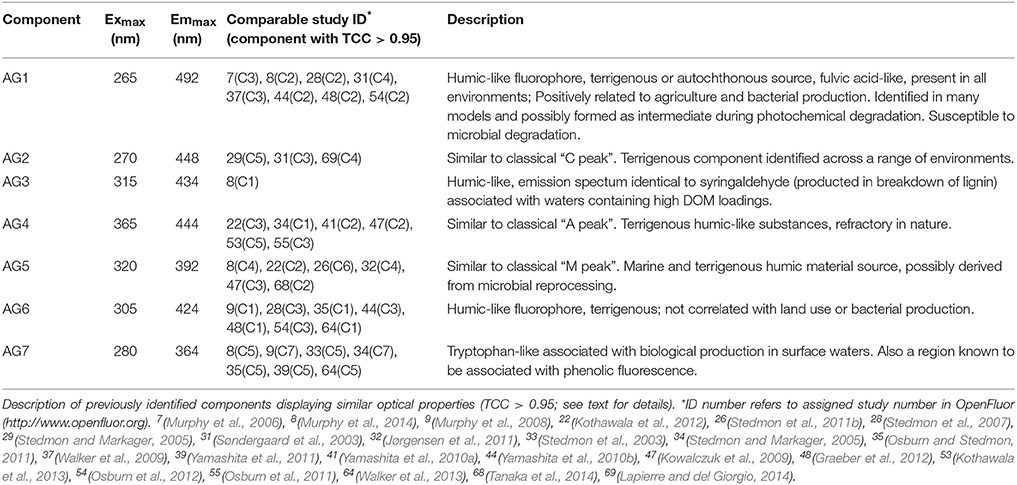
Table 3. Excitation and emission maxima (Exmax/Emmax) of the seven components identified using parallel factor analysis of DOM fluorescence (Figure 2).
Four of the seven AG components were very closely related (TCC ≥ 0.97) to those reported in the five-component Horsens catchment model (Murphy et al., 2014). For each of the seven components identified here, at least three independent studies had previously identified statistically similar spectra, except for component AG3 for which there was only a single match. Table 3 provides information and a description of the seven components identified.
AG3 was closely related (TCC = 0.97) to C1 in Murphy et al. (2014) where it was identified as displaying an emission spectrum identical to syringaldehyde, a product of lignin breakdown. The AG model shared two components with a five-component PARAFAC model explaining florescence DOM collected from five of the major Arctic rivers sampled here over 2004–2005 (Walker et al., 2013). AG6 was similar (TCC > 0.95) to C1 from this model (Walker et al., 2013), while AG7 was identical to C5, which can be described as tryptophan-like and has been commonly associated with biological production in surface waters (Determann et al., 1994).
Two AG model components were also highly related to components previously reported in sea ice. AG1 was comparable to the terrestrially-derived component C2 found within Baltic sea ice (Stedmon et al., 2007). AG1 was also identical to C3 in coastal Canadian Arctic waters, which proved to be highly positively correlated with Σ8 (Walker et al., 2009). AG5 was identical to C6 in a study of Antarctic sea ice brines (Stedmon et al., 2011b), and is similar to the commonly described “M” peak across a wide range of environments (Coble, 1996, 2007; Fellman et al., 2010).
Component AG4 contributed the greatest (23.4 ± 0.6%) and AG7 the lowest percentage (5.1 ± 0.3%) toward total fluorescence across all rivers and seasons. In contrast to previous studies, no consistent pan-arctic seasonal or spatial patterns were apparent in the fluorescence loadings or percent contribution of any of the seven components (Walker et al., 2009). Individual patterns in fluorescence were however observed across rivers and seasons. Component AG1 contributed a significantly higher proportion of total fluorescence during the summer months in the Kolyma (20.5 ± 0.1%) and Lena Rivers (20.6 ± 0.6%) relative to each of the other rivers (16.8 to 17.7%), yet comprised similar amounts during the rest of the year. Similarly, the proportion of AG3 was significantly higher in the Kolyma (23.2 ± 0.8%) and Lena (19.1 ± 1.4%) Rivers relative to the others (11.3 to 17.6%) during the summer months alone. Opposing patterns were observed in AG6, with significantly lower proportions in the Kolyma (4.4 ± 0.1%) and Lena Rivers (5.3 ± 0.6%) relative to the others, in particular the Yenisey (9.7 ± 1.2%) and Ob' Rivers (8.4 ± 1.8%). The Mackenzie River contained high proportions of AG7 during the summer months (6.7 ± 1.1%) relative to all other rivers (3.9 to 5.2%).
Discussion
Optical Measurements, DOC Concentration and DOM Composition
CDOM absorption (a350) correlated strongly with DOC concentration across all rivers during the standard Arctic-GRO sampling over 2009 and 2010 (R2 = 0.89; p < 0.001; n = 60). This strong positive linear relationship persisted when DOC concentration and a350 values from the additional high-resolution measurements collected over the freshet period were included (R2 = 0.81; p < 0.001; n = 301; Figure 3A). Despite this robust pan-arctic relationship however, when rivers were analyzed independently significant differences in the slopes and intercepts for the DOC to a350 relationships were observed (Table 4). This indicates that the relative amount of non-chromophoric DOM varies across Arctic rivers, and suggests that the proportion of DOC per unit CDOM within individual river basins should in future be separately determined (Table 4). Interestingly, we also find that the variability in river-specific slope and intercepts were well-explained by total annual river discharge, with increasing discharge resulting in higher DOC:a350 intercepts (R2 = 0.58; p < 0.05, not shown) and shallower slopes (R2 = 0.72, p < 0.05, not shown). The relationship between annual discharge and DOC:a350 intercepts improved significantly (R2 = 0.98; p < 0.01) with the exclusion of the Mackenzie River. Thus, greater dilution of DOM and export of non-chromophoric organics occurs with increasing total discharge. The different relationship observed in the Mackenzie may be due to its relatively low DOM yield, high abundance of suspended sediments as well as high proportion of lakes relative to other watersheds (Stedmon et al., 2011a).
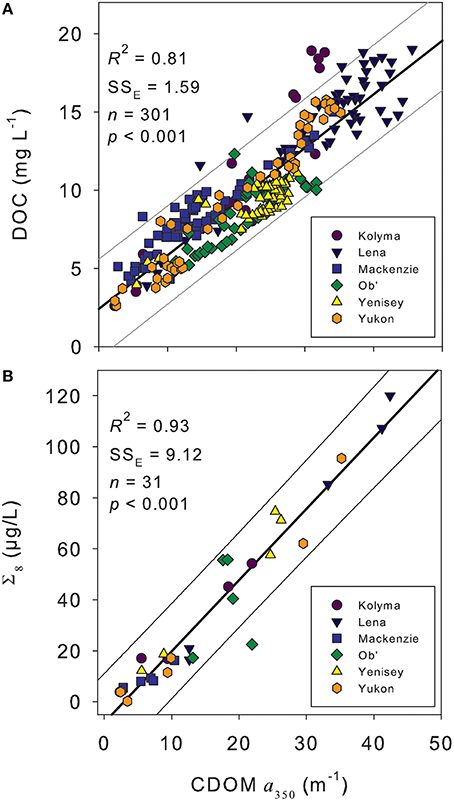
Figure 3. (A) Dissolved organic carbon (DOC) concentration vs. the CDOM absorbance coefficient at 350 nm (a350) from across the hydrograph of the six Arctic rivers. (B) Lignin phenol concentration (Σ8) vs. a350 from across the hydrographs of the six Arctic rivers. Thick black line represents the linear regression of the data. Thin gray lines represent the extent of the prediction of fit (95% confidence limit). SSE indicates the error of estimate providing an indication of variation around the fit.
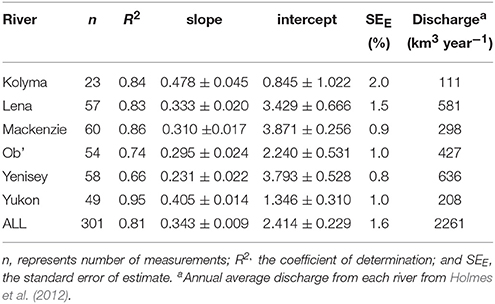
Table 4. Linear regression fits for relationships between dissolved organic carbon concentration (DOC) and absorbance coefficient (a350) determined for each river.
HPOA fraction was closely related to S275–295 across rivers, with the relative proportion of HPOA decreasing with steepening slope (R2 = 0.65; p < 0.001, n = 58), as previously reported across five of these rivers in 2004–2005 (Walker et al., 2013). This suggests that average DOM molecular weight and aromaticity decreases as the proportion of HPOA declines, in good agreement with a number of previous studies (Neff et al., 2006; Striegl et al., 2007; O'Donnell et al., 2012; Spencer et al., 2012). This was further supported by a positive linear relationship between average HPOA and SUVA254 across rivers (R2 = 0.56, p < 0.01, Supplemental Figure 2). The DOM composition of winter flow has been shown to contain lower proportions of the HPOA fraction as compared to HPI, with lower SUVA254 values relative to summer and spring months in the Yukon River (O'Donnell et al., 2012). The aromaticity of the HPOA fraction (HPOA-SUVA254), was negatively correlated with FI (R2 = 0.32, p < 0.001, n = 47), confirming the role of terrigenous supply on delivering increased proportions of aromatic organics to the exported DOM pool.
No pan-arctic relationships were observed between any of the fluorescence component loadings and DOC concentration or composition (Supplemental Tables 2 and 3). However, weak yet significant relationships were observed between the relative proportions of components AG3 and AG4 to total fluorescence, and DOC concentrations across all six rivers (R2 = 0.15 and 0.16 respectively, p < 0.01). AG3 proportions generally decreased with increasing DOC concentrations, where AG4 proportions increased with greater DOC concentrations. These relationships were largely driven by particularly strong relationships across the Kolyma and Lena Rivers (AG3 R2 = 0.70; AG4 R2 = 0.70, p < 0.001). The relatively weak pan-arctic relationships we observe here contrasts with the findings of Walker et al. (2013), whom report strong correlations between DOC concentration and fluorescence loadings. These conflicting findings may have been due to the additional normalization step we applied to scale each EEM to its total signal, thus ensuring the model focused entirely on compositional rather than concentration gradients. Alternately, the addition of a significant number of EEMs from upstream sources may have resulted in the validation of different components during PARAFAC decomposition. The latter seems unlikely however, as two of the seven components were spectrally identical (TCC > 0.95) to the PARAFAC model used by Walker et al. (2013), including component AG6 which was spectrally indistinguishable from a component (C1) identified as most closely tracing DOC and Σ8 concentrations. Other potential causes include differences in the treatment of inner filter effects. We applied a commonly employed post-hoc method by Lakowicz (2006) to correct our EEMs for inner filter effects using parallel CDOM absorbance measurements, whereas samples in Walker et al. (2013) were diluted prior to measurement. Our method more closely reflects direct measurement of field samples and is similar to information that could be derived from in-situ instruments. Our findings suggest that loadings derived from fluorescence EEMs decomposed using PARAFAC may not always be useful when tracing DOC concentration.
Optical Measurements and Lignin Concentration and Composition
CDOM (a350) measurements were highly correlated to Σ8 across all six rivers basins (R2 = 0.92; p < 0.001; n = 31; Figure 3B). This represents the first pan-arctic relationship to be reported between a350 and Σ8 across all six major rivers. The observed linear relationship [Σ8 = −8.06 ± 2.71+ (2.80 ± 0.14a350)] was similar to, yet displayed a slightly higher slope, than reported in Spencer et al. (2008) for the Yukon River Basin only [Σ8= −6.67 ± 2.88+ (2.21 ± 0.11a350)]. Previous studies have reported a much steeper linear relationship between a350 and Σ8, with the Mackenzie and Ob' Rivers grouping separately from the Kolyma, Lena, and Yenisey (Walker et al., 2013). The steeper slope of the previously reported relationship is caused by the substantially higher (often greater than double) lignin concentrations (Σ8) reported in Amon et al. (2012) and used in Walker et al. (2013) relative to those presented here. The differences in Σ8 concentrations may be due to methodological differences, as suggested by Walker et al. (2013), and raises concern over future potential in comparing datasets. For example, comparison of data from Spencer et al. (2008) in Walker et al. (2013) suggested low relative lignin concentrations in DOM from the Yukon, whereas we identify a similar Σ8 to a350 relationship across all six major Arctic rivers.
Carbon normalized lignin (Λ8) yields decreased exponentially with steepening S275–295 values across all rivers and seasons (R2 = 0.80; p < 0.01, n = 31). Steepening S275–295 values were associated with decreasing runoff rates, thus Λ8 yields typically increased as DOM average molecular weight and aromaticity increased, and during spring and summer months in response to greater allochthonous DOM supply.
Lignin phenols have been shown to comprise a major component of the HPOA fraction (Templier et al., 2005; Spencer et al., 2008, 2010a). This was confirmed by a significant positive correlation between proportion HPOA and Λ8 yields (R2 = 0.71, p < 0.001, n = 29; not shown). Lignin phenol biomarkers thus appear capable of providing information on the biogeochemical cycling of the entire hydrophobic DOM pool, which comprises up to two-thirds of aquatic DOM.
Lignin phenol C/V ratios increased with steepening S275–295 values (R2 = 0.54; p < 0.001, n = 31) and declining total SUVA254 values (R2 = 0.48; p < 0.001, n = 31). The overall decline in C/V ratios with increasing freshwater runoff appears to represent increased contributions of lignin from litter and surface soil layers alongside greater proportions of aromatic and higher molecular weight DOM export (Hedges and Mann, 1979). These findings however appear counterintuitive relative to what we currently understand about hydrologic flowpaths and sources of DOM to aquatic systems. Non-woody litter tissues associated with surficial, predominantly overland flow paths are expected to impart higher C/V ratios and lower degradative alteration than observed in DOM exported during deeper baseflow conditions. Physical processes, such as leaching and sorption, can however also influence lignin phenol ratios (Hernes et al., 2007, 2008) and may therefore be responsible for the observed trends. S/V and acid to aldehyde ratios did not correlate closely with spectral slope, SUVA254 or SR values. The overall trends in lignin phenol composition we report are similar to those previously shown across Arctic rivers (Spencer et al., 2008, 2009; Amon et al., 2012), and demonstrate a shift from predominantly modern surface-derived and lignin-rich DOM during the spring freshet to older, less lignin-rich DOM under baseflow winter conditions.
No pan-arctic relationships were observed between fluorescent PARAFAC component loadings and lignin phenol concentration or composition measures. A weak yet significant relationship was however found between the %AG4 and Σ8 concentration (R2 = 0.18; p < 0.02) but again was significantly stronger across the Kolyma and Lena Rivers in particular (R2 = 0.79; p < 0.001). FI values positively correlated with increasing C/V ratios (R2 = 0.48, p < 0.001, n = 30) confirming losses in the proportion of woody tissues with increased autochthonous or less aromatic DOM supply.
Linking Optical Properties to Arctic River DOM Composition
Underlying patterns and relationships between optical DOM parameters, DOC and lignin were further explored using principle component analysis (PCA), which can identify the structure of data that best explains the variance within the dataset. The optical properties of DOM varied with season across all rivers, as demonstrated by PCA plots containing PARAFAC fluorescence components (percent contribution) and spectral slope information. The addition of FI and SR values added little additional information to the PCA analyses. Furthermore, SUVA254 followed identical patterns to each of the spectral slope parameters and its inclusion led to similar PCA plots. These indices were therefore omitted from the final PCA model for clarity. Three principle components (PCs; eigenvalue > 1) were identified that together explained 80% of the total variance in the optical data (PCopt 1–3). PC1opt was related to increasing fluorescence contributions from AG3, AG1 and AG5, but decreasing contributions from AG6, AG4 and AG2 (Figure 4). Components AG1, 3 and 5 represent DOM fluorescence signatures that have all previously been reported to be susceptible to microbial processing, or to be a byproduct of vascular material degradation (Table 3 and references herein). These fluorescence signatures may therefore represent indicators of “degraded” or processed humic-like components. In contrast, components AG 2, 4, and 6 appear to represent more unreactive and stable components, previously being described as refractory in nature and shown not to co-vary with bacterial production (Table 3). PC1opt may therefore reflect potential reactivity or be an indicator of prior DOM processing. PC2opt appeared to be related to the shifting molecular weight of DOM, as indicated by strong relationships with changes in all spectral slopes (and SUVA254, not shown), whereas PC3opt was positively related to increased protein-like or phenolic DOM (AG7) and decreasing contributions from humic-like DOM (AG2 and AG1). PCA models ran with only PARAFAC components contained two principle components, each indistinguishable from PC1opt and PC3opt, demonstrating that information on DOM potential reactivity and the relative contribution of protein-like versus humic-like could be obtained from fluorescence measurements alone.
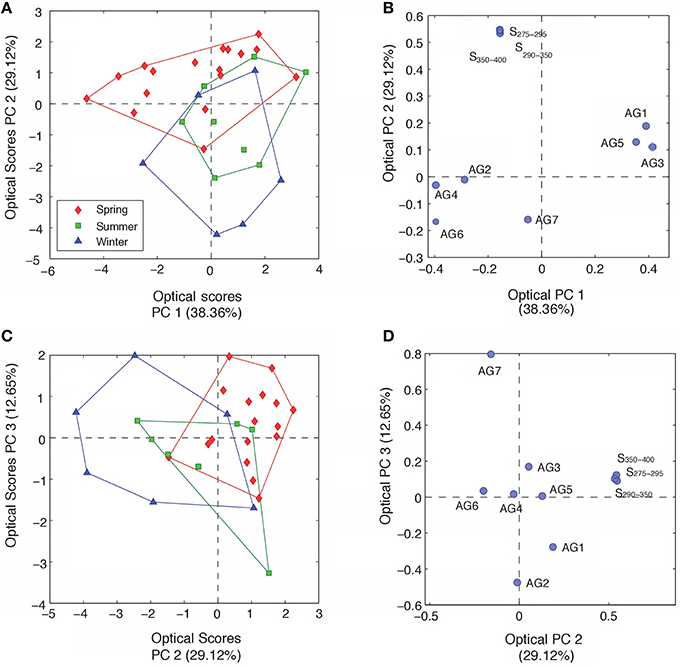
Figure 4. (A) Principle component scores across PC1opt and PC2opt for all optical samples labeled by season. (B) PC scores of each optical parameter across PC1opt and PC2opt. (C) Principle component scores across PC2opt and PC3opt for all optical samples labeled by season. (D) PC scores of each optical parameter across PC2opt and PC3opt. FI and SUVA254 values were not included in the final optical PCA, see text for details.
Seasonal changes in DOM composition across all six rivers were most clearly separated along the PC2opt axis, with spring waters containing higher molecular weight material with shallower spectral slopes than summer and winter month waters. Positive scores on PC3opt during spring and winter months, relative to summer, suggest greater contributions of protein-like or phenolic material (as inferred by the proportion of component AG7), potentially representing reductions in allochthonous supply or increased export of fresh organics from surface layers, respectively. No clear separation among the six different rivers was apparent with optical properties alone across any of the PC axes.
To examine if the observed trends in DOM optical properties were related to geochemical changes in organic matter we conducted a separate PCA incorporating all lignin phenol and DOC fractionation variables. We subsequently compared the identified PCs with those extracted from optical measurements alone. Two PCs (PCmol 1–2) were identified, in combination explaining 67% of the total variance in geochemical composition (Figure 5). PC1mol positively related to increasing HPOA, Σ8 and Λ8 contributions and negatively with C/V ratio and proportions of the hydrophobic neutral and hydrophilic fractions. The axis therefore primarily separates seasonal variability observed in DOC, with spring months delivering greater proportions of HPOA with high concentrations of Σ8 and Λ8 values. PC2mol most strongly correlated to (Ad/Al) ratios suggesting it represented changing proportions of DOM degradation state. S/V ratio was also positively related with PC2mol, indicating that shifts in the relative proportions of sources waters may also be represented by this axis or similar processes (e.g., leaching and sorption) may be driving the observed S/V and (Ad/Al) ratios.
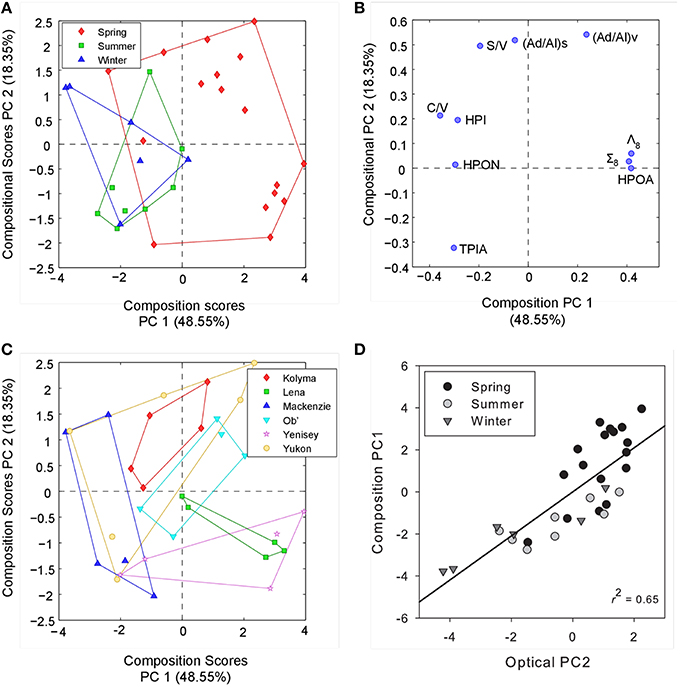
Figure 5. (A) Principle component scores across PC1mol and PC2mol for all compositional measurements labeled by season. (B) PC scores of each compositional parameter across PC1mol and PC2mol. (C) Principle component scores across PC1mol and PC2mol for all compositional measurements labeled by river.(D) Relationship between PC2opt derived from optical data alone and PC1mol explaining compositional measurements. Black line represents the linear regression (R2 = 0.65, p < 0.001).
Comparing separate PCs from both optical and geochemical PCAs across all sites and sampling dates, only a single significant positive correlation was observed between PC2opt extracted from optical characteristics and PC1mol from DOC and lignin composition (R2 = 0.65, p < 0.001, n = 30; Figure 5). Thus, seasonal variability in DOC composition was explained by relatively simple CDOM slope (and SUVA254) metrics. Separating over seasons, PC1opt correlated significantly with PC2mol during the summer (R2 = 0.85, p < 0.05, n = 8) and winter months (R2 = 0.65, p = 0.06, n = 6), but not over spring periods across all six rivers. This further suggests that shifts in the relative proportions of PARAFAC components reflect shifts in the relative degradation signature of DOC inferred from acid:aldehyde ratios during certain periods of the year. Information pertaining to the source (S/V ratios) of DOM may therefore also be contained in the relative ratio of more or less reactive or degraded PARAFAC components. Interestingly, (Ad/Al)v ratios have also been shown to correlate with the average 14C age of DOC within these Arctic Rivers (Amon et al., 2012). Fluorescence measurements may therefore provide information pertaining to both the age and degradation history of DOM across Arctic systems. Broad patterns in the temporal variability of DOM composition over pan-arctic scales therefore appear best captured using simple CDOM spectral slope and SUVA254 measurements. Information on DOM processing, source and age may instead be contained within CDOM fluorescence spectra and the relative contributions of PARAFAC components.
Modeling Terrestrial Biomarkers with Optical Measurements
We ran a series of multiple linear regression models with the aim of predicting Λ8, C/V, S/V, (Ad/Al)s, and (Ad/Al)v across all sampling dates and rivers. Incorporating absorbance (a350, slope ratios, SUVA254), and fluorescence optical measurements (FI, % PARAFAC component contributions) as potential parameters, Λ8 (R2 = 0.76; Figure 6A), C/V (R2 = 0.70; Figure 6B) and S/V values (R2 = 0.68, Figure 6C) could be successfully predicted by model fits (all p < 0.001; n = 31). Modeled values for (Ad/Al)v were also strongly correlated with observed values (p < 0.001), but predictive capability was low (R2 = 0.49, not shown). Model fits failed to accurately predict the variability in the (Ad/Al)s ratios (p > 0.05).
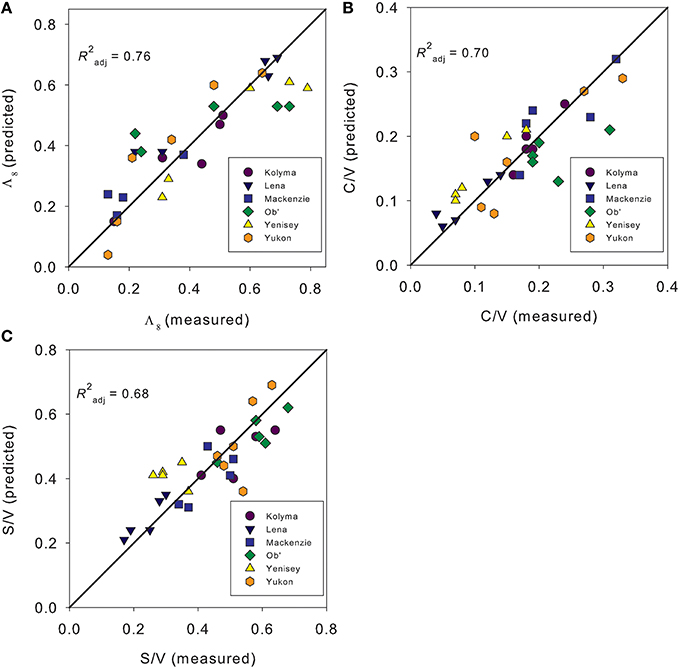
Figure 6. Model predicted values against observed measurements of (A). Carbon normalized sum of the lignin phenols [Λ8;mg (100 mg OC)−1], (B) Cinnamyl to vanillyl phenol ratios (C/V), and (C) Syringyl to vanillyl phenol ratios (S/V).
The optical parameters providing the greatest predictive power varied between each lignin parameter. Models predicting Λ8 only incorporated S275–295 and a350 values [Λ8 = 1.136 ± 0.250 + (55.742 ± 14.152 *S275–295)+ (0.006 ± 0.003 *a350)]. Modeling C/V values also used S275–295 and a350 values (alone explaining 58% of the variance), but improved with inclusion of %AG7 and S290–350 values [C/V = −0.153 ± 0.127 - (57.265 ± 17.921*S275–295) + (0.040 ± 0.015*%AG7) + (45.225 ± 18.604*S290–350) - (0.002*a350)]. Models explaining S/V values incorporated S290–350, a350, %AG7 and FI (S/V = −2.704 ± 0.827+ (64.131 ± 14.843*S290–350) + (2.896 ± 0.695*FI) − (0.009 ± 0.002*a350) + (0.074 ± 0.027*%AG7)]. S/V could not be explained with absorbance measurements alone. The ability to predict lignin composition as well as concentration using fluorescence measurements has previously been reported using partial least squares model of samples collected over a 2 year period on the Sacremento River/San Joaquin River Delta, California (Hernes et al., 2009). The authors demonstrated that the most significant predictive capability for lignin was within the commonly referred to protein-like fluorescence region (similar to our component AG7). Fluorescence of propylphenol monomers, that structurally comprise lignin, can generate fluorescence signatures in a similar region to amino acids and in the region known as “protein-like,” thus our results may indicate information obtained from changes in dissolved phenolics rather than amino acid or proteins (Hernes et al., 2009). Therefore, it seems that rapid, inexpensive optical measurements may be capable of acting as a proxy for dissolved lignin compositional parameters as well as concentration across pan-arctic scales and catchments. The combination of absorbance and fluorescence metrics can also add predictive power when attempting to predict shifts in the composition of terrigenous DOC.
Improving Terrigenous OC Export Estimates
The absorbance coefficient at 350 nm (a350) has previously been shown to be a sensitive and inexpensive proxy for lignin phenol concentration across a range of freshwater environments within Arctic river basins (Spencer et al., 2008, 2009; Stedmon et al., 2011a). Furthermore, increased sampling frequency of Arctic rivers has led to significantly higher and better constrained DOC export estimates, particularly after the inclusion of samples from across the spring freshet period (e.g., Köhler et al., 2003; Striegl et al., 2005; Holmes et al., 2012). Here, we investigate if the combination of a lignin proxy with high-resolution monitoring of a350 over Arctic river hydrographs may be used to develop improved estimates of pan-arctic terrigenous DOC export, hereby refining land-to-ocean carbon flux estimates.
CDOM-derived lignin phenol concentrations (lignin350) were calculated using the linear regression of Σ8 and a350 (Figure 3B). Lignin350 values were derived from a350 measurements taken from waters collected over the main Arctic-GRO sampling campaign and additional high-resolution samples taken over the freshet hydrographs. Inclusion of near-daily absorbance measurements collected over the peak discharge period alongside measurements spanning the entire year was crucial in adequately constraining fluxes during the spring freshet, when the majority of annual lignin export is expected (Spencer et al., 2008; Amon et al., 2012). Lignin350 concentrations calculated for samples with concurrent Σ8 measurements were highly correlated across all Arctic rivers (R2 = 0.92, p < 0.01, n = 31, Standard error of estimate, SEE = 8.8%) demonstrating the robust nature of this approach.
Daily model loads (mass d−1) of Σ8 in each river were calculated using a hydrologic load estimation model (LOADEST) integrating the lignin350 concentrations and 12 years of daily discharge data ranging from 1999 to 2010 (see Materials and Methods). Estimated lignin loads varied from 4.0 Gg year−1 in the Mackenzie to 43.1 Gg year−1 in the Lena River (Table 5). The Lena, Yenisey and Ob' Rivers export >85% of the total annual lignin discharge from the six largest Arctic rivers, a proportion that is very similar to that found by Amon et al. (2012). Flux estimates using lignin phenol concentrations measured using identical methods and approaches compared well. Our mean annual Yukon River lignin flux derived for 2001–2009 (5.4 ± 1.7 Gg year−1; Table 5) is similar to previous estimates of 5.3 ± 1.3 Gg year−1 independently derived from measurements from 2004 to 2005 (Spencer et al., 2009), confirming the modeling approach is reproducible and robust. Our estimated lignin loads from all six major Arctic rivers (98.4 Gg year−1) were however almost half of the 192.0 Gg year−1 reported by Amon et al. (2012) for the same rivers from 2003 to 2007. These differences were primarily due to the significantly higher lignin concentrations (Σ8) reported by Amon et al. (2012) versus those of Spencer et al. (2009) and reported here, demonstrating the necessity for more standardization and intercomparison across lignin phenol measurements to ensure comparable datasets across studies.
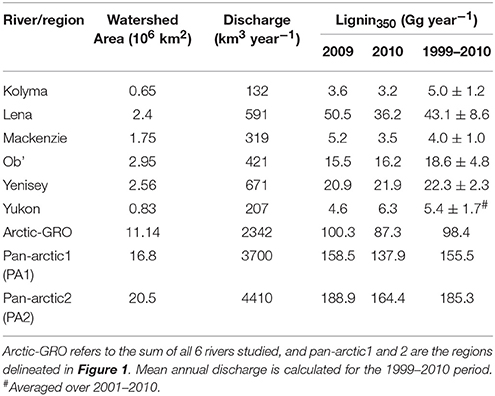
Table 5. Total annual mean fluxes of CDOM-derived lignin (Lignin350) and DOC calculated using LOADEST.
Freshwater fluxes were scaled to the unsampled proportion of the Arctic using two published estimates of total Arctic Ocean watershed area. The smallest estimate (PA1; black line Figure 1) spans an area of 16.8 × 10⁶ km2, where the largest (PA2; red line; Figure 1) encompassing Hudson Bay drainage covers an area of 20.5 × 10⁶ km2 (Hernes et al., 2014). Pan-arctic lignin fluxes were estimated to span between 155.5 Gg year−1 (PA1) and 185.3 Gg year−1 (PA2; Table 5) across these two geographic regions.
Dissolved lignin concentrations have previously been applied as a tracer of terrigenous DOM to the Arctic Ocean (Opsahl et al., 1999; Benner et al., 2005; Fichot et al., 2013) and used to estimate turnover rates of terrigenous DOC in the ocean (Opsahl et al., 1999; Hernes and Benner, 2006). Applying our pan-arctic flux (derived using our lignin350 proxy) and assuming Arctic Ocean lignin concentrations ranging between 84 and 320 ng L−1 (Opsahl et al., 1999), we calculate the residence time of terrigenous DOC in polar surface waters to be in the order of 7 months to 2.5 years. This compares well, yet slightly shorter than residence time estimates of < 1 to 4 years calculated with comparable freshwater fluxes but scaled from the Yukon River alone (Spencer et al., 2009). Assuming the export of lignin phenol concentrations twice as high, similar to those reported by Amon et al. (2012), would result in even faster residence time estimates of < 4 months to 1 year. Overall, the short timeframes identified by these studies indicate either rapid losses of terrigenous DOC, via microbial, photochemical, or flocculation processes, or faster physical transport from Arctic Ocean waters to the North Atlantic than previously thought.
Conclusions
Employing optical techniques can increase the temporal and spatial coverage of DOM measurements across Arctic river systems, shedding light on future changes in the composition and concentration of exported DOM, and help to more accurately estimate the amount and timing of terrigenous DOC flux. Here, river-specific relationships between a350 and DOC concentrations are presented and attributed to the export of varying proportions of non-chromophoric DOM from Arctic catchments. We show that simple absorbance proxies (a350, S275–295), which can be measured with in-situ techniques, are capable of tracing dissolved lignin concentrations (Σ8) and seasonal changes in geochemical DOM composition (e.g., Λ8 and percent HPOA) occurring across the six major Arctic rivers. Furthermore, we demonstrate that lignin phenol biomarkers appear capable of providing information on the biogeochemical cycling of the hydrophobic DOC fraction, thus knowledge on a major proportion of the aquatic DOM pool. More complex fluorescence DOM measurements followed by PARAFAC decomposition provided few direct pan-arctic proxies of DOM concentration or composition. However, the proportion of fluorescence signatures previously attributed to microbial processing or suggested to be by-products of vascular material degradation co-varied with lignin monomer ratios over much of the year, suggesting these optical measurements may be capable of offering insights into changing DOM degradation state and source. Combining fluorescence and absorbance indices further strengthened our ability to predict DOM composition, in particular inclusion of fluorescence index and protein-like contributions with absorbance coefficient and spectral slope measurements enabled predictive models of lignin ratios; suggesting potential to distinguish DOM source characteristics. Finally, we combine our pan-arctic relationship between a350 and Σ8 with high resolution monitoring of a350 to develop more accurately constrained residence times for terrigenous DOC in the Arctic Ocean of between 7 months to 2½ years. Optical measurements can provide key insights into the flux and biogeochemical cycling of terrigenous DOC in the Arctic which will prove critical for understanding how carbon budgets and fluxes alter under future climate change scenarios.
Author Contributions
All authors contributed to the design of the study. PH, KB, and RD analyzed samples for XAD fractionation and lignin phenol analyses. PM, RS, and ST conducted modeling studies. All authors contributed to the interpretation of data and writing of the manuscript.
Conflict of Interest Statement
The authors declare that the research was conducted in the absence of any commercial or financial relationships that could be construed as a potential conflict of interest.
Acknowledgments
This work was supported by grants from the National Science Foundation for the Global Rivers Project (0851101), the PARTNERS Project (0229302), the Arctic Great Rivers Observatory I & II (0732522 and 1107774), Detecting the Signature of Permafrost Thaw in Arctic Rivers (1203885 and 1500169) and the US Geological Survey's National Research Program. This work was aided by an NSF equipment grant to upgrade the analytical facilities at the North-East Science Station (0938254). We thank Alexander Shiklomanov for providing additional river discharge data, and the field staff of the USGS Alaska Science Center for their sample collection efforts. Special thanks to Ekaterina Bulygina and Lydia Russell-Roy for help running laboratory analyses. Also thanks to Greg Fiske for production of Figure 1. Any use of trade, firm, or product names is for descriptive purposes only and does not imply endorsement by the U.S. Government.
Supplementary Material
The Supplementary Material for this article can be found online at: https://www.frontiersin.org/article/10.3389/feart.2016.00025
References
Aagaard, K., and Carmack, E. C. (1989). The role of sea ice and other fresh water in the Arctic circulation. J. Geophys. Res. Atmosph. 94, 14485–14498. doi: 10.1029/JC094iC10p14485
Aiken, G. R., McKnight, D. M., Thorn, K. A., and Thurman, E. M. (1992). Isolation of hydrophilic organic acids from water using nonionic macroporous resins. Org. Geochem. 18, 567–573. doi: 10.1016/0146-6380(92)90119-I
Amon, R. M. W., Rinehart, A. J., Duan, S., Louchouarn, P., Prokushkin, A., Guggenberger, G., et al. (2012). Dissolved organic matter sources in large Arctic rivers. Geochim. Cosmochim. Acta 94, 217–237. doi: 10.1016/j.gca.2012.07.015
Benner, R., Louchouarn, P., and Amon, R. M. W. (2005). Terrigenous dissolved organic matter in the Arctic Ocean and its transport to surface and deep waters of the North Atlantic. Global Biogeochem. Cycles 19, GB2025. doi: 10.1029/2004GB002398
Blough, N. V., and Del Vecchio, R. (2002). “Chromophoric DOM in the coastal environment,” in Biogeochemistry of Marine Dissolved Organic Matter, eds D. A. Hansell and C. A. Carlson (San Diego, CA: Academic Press), 509–546.
Blough, N. V., and Green, S. A. (1995). “Spectroscopic characterization and remote sensing of non-living organic matter,” in The Role of Non-Living Organic Matter on the Earths Carbon Cycle, eds R. G. Zepp and C. Sonntag (Chichester, UK: Wiley), 23–45.
Booth, G. P., Raymond, P. A., and Oh, N. H. (2007). LoadRunner. Software and Website. New Haven, CT: Yale University.
Coble, P. G. (1996). Characterization of marine and terrestrial DOM in seawater using excitation-emission matrix spectroscopy. Mar. Chem. 51, 325–346. doi: 10.1016/0304-4203(95)00062-3
Coble, P. G. (2007). Marine optical biogeochemistry: the chemistry of ocean color. Chem. Rev. 107, 402–418. doi: 10.1021/cr050350
Cory, R. M., Miller, M. P., and McKnight, D. M. (2010). Effect of instrument−specific response on the analysis of fulvic acid fluorescence spectra. Limnol. Oceanogr. Methods 8, 67–78. doi: 10.4319/lom.2010.8.67
Déry, S. J., Stahl, K., Moore, R. D., Whitfield, P. H., Menounos, B., and Burford, J. E. (2009). Detection of runoff timing changes in pluvial, nival, and glacial rivers of western Canada. Water Resour. Res. 45, W04426. doi: 10.1029/2008WR006975
Determann, S., Reuter, R., Wagner, P., and Willkomm, R. (1994). Fluorescent matter in the eastern Atlantic Ocean. Part 1: method of measurement and near-surface distribution. Deep Sea Res. Part I Oceanogr. Res. Papers 41, 659–675.
Fellman, J. B., Hood, E., and Spencer, R. G. M. (2010). Fluorescence spectroscopy opens new windows into dissolved organic matter dynamics in freshwater ecosystems: a review. Limnol. Oceangr. 55, 2452–2462. doi: 10.4319/lo.2010.55.6.2452
Fichot, C. G., Kaiser, K., Hooker, S. B., Amon, R. M. W., Babin, M., Bélanger, S., et al. (2013). Pan-Arctic distributions of continental runoff in the Arctic Ocean. Sci. Rep. 3:1053. doi: 10.1038/srep01053
Graeber, D., Gelbrecht, J., Pusch, M. T., Anlanger, C., and von Schiller, D. (2012). Agriculture has changed the amount and composition of dissolved organic matter in Central European headwater streams. Sci. Total Environ. 438, 435–446. doi: 10.1016/j.scitotenv.2012.08.087
Harshman, R. A., and Lundy, M. E. (1994). PARAFAC: parallel factor analysis. Comput. Stat. Data Anal. 18, 39–72. doi: 10.1016/0167-9473(94)90132-5
Hedges, J. I., Clark, W. A., and Cowie, G. L. (1988). Organic matter sources to the water column and surficial sediments of a marine bay. Limnol. Oceangr. 33, 1116–1136. doi: 10.4319/lo.1988.33.5.1116
Hedges, J. I., and Ertel, J. R. (1982). Characterization of lignin by gas capillary chromatography of cupric oxide oxidation products. Anal. Chem. 54, 174–178. doi: 10.1021/ac00239a007
Hedges, J. I., and Mann, D. C. (1979). The characterization of plant tissues by their lignin oxidation products. Geochim. Cosmochim. Acta 43, 1803–1807.
Helms, J. R., Stubbins, A., and Ritchie, J. D. (2008). Absorption spectral slopes and slope ratios as indicators of molecular weight, source, and photobleaching of chromophoric dissolved organic matter. Limnol. Oceanogr. Methods 53, 955–969. doi: 10.4319/lo.2008.53.3.0955
Hernes, P. J., and Benner, R. (2003). Photochemical and microbial degradation of dissolved lignin phenols: implications for the fate of terrigenous dissolved organic matter in marine environments. J. Geophys. Res. 108, 3291. doi: 10.1029/2002JC001421
Hernes, P. J., and Benner, R. (2006). Terrigenous organic matter sources and reactivity in the North Atlantic Ocean and a comparison to the Arctic and Pacific oceans. Mar. Chem. 100, 66–79. doi: 10.1016/j.marchem.2005.11.003
Hernes, P. J., Bergamaschi, B. A., Eckard, R. S., and Spencer, R. G. M. (2009). Fluorescence-based proxies for lignin in freshwater dissolved organic matter. J. Geophys. Res. 114, G00F03–G00F10. doi: 10.1029/2009JG000938
Hernes, P. J., Holmes, R. M., Raymond, P. A., Spencer, R. G. M., and Tank, S. E. (2014). “Fluxes, processing, and fate of riverine organic and inorganic carbon in the Arctic Ocean,” in Biogeochemical Dynamics at Major River-Coastal Interfaces:Linkages with Global Change, eds T. S. Bianchi, M. A. Allison, and W.-J. Cai (Cambridge, UK: Cambridge University Press), 530–553.
Hernes, P. J., Robinson, A. C., and Aufdenkampe, A. K. (2007). Fractionation of lignin during leaching and sorption and implications for organic matter “freshness.” Geophys. Res. Lett. 34, L17401–L17406. doi: 10.1029/2007GL031017
Hernes, P. J., Spencer, R. G. M., Dyda, R. Y., Pellerin, B. A., Bachand, P. A. M., and Bergamaschi, B. A. (2008). The role of hydrologic regimes on dissolved organic carbon composition in an agricultural watershed. Geochim. Cosmochim. Acta 72, 5266–5277. doi: 10.1016/j.gca.2008.07.031
Holmes, R. M., McClelland, J. W., Peterson, B. J., Tank, S. E., Bulygina, E., Eglinton, T. I., et al. (2012). Seasonal and annual fluxes of nutrients and organic matter from Large Rivers to the Arctic Ocean and Surrounding Seas. Estuar. Coasts 35, 369–382. doi: 10.1007/s12237-011-9386-6
Holmes, R. M., McClelland, J. W., Raymond, P. A., Frazer, B. B., Peterson, B. J., and Stieglitz, M. (2008). Lability of DOC transported by Alaskan rivers to the Arctic Ocean. Geophys. Res. Lett. 35, L03402–L03405. doi: 10.1029/2007GL032837
Hu, C., Muller-Karger, F. E., and Zepp, R. G. (2002). Absorbance, absorption coefficient, and apparent quantum yield: a comment on common ambiguity in the use of these optical concepts. Limnol. Oceangr. 47, 1261–1267. doi: 10.4319/lo.2002.47.4.1261
Jørgensen, L., Stedmon, C. A., Kragh, T., Markager, S., Middelboe, M., and Søndergaard, M. (2011). Global trends in the fluorescence characteristics and distribution of marine dissolved organic matter. Mar. Chem. 126, 139–148. doi: 10.1016/j.marchem.2011.05.002
Köhler, H., Meon, B., Gordeev, V. V., Spitzy, A., and Amon, R. M. W. (2003). “Dissolved organic matter (DOM) in the estuaries of Ob and Yenisei and the adjacent Kara Sea, Russia,” in Siberian River Run-Off in the Kara Sea, eds R. Stein, K. Fahl, D. K. Fütterer, E. M. Galimov, and O. V. Stepanets (Amsterdam: Elsevier Science B.V.), 281–308.
Kothawala, D. N., von Wachenfeldt, E., Koehler, B., and Tranvik, L. J. (2012). Selective loss and preservation of lake water dissolved organic matter fluorescence during long-term dark incubations. Sci. Total Environ. 433, 238–246. doi: 10.1016/j.scitotenv.2012.06.029
Kothawala, D. N., Stedmon, C. A., Müller, R. A., Weyhenmeyer, G. A., Köhler, S. J., and Tranvik, L. J. (2013). Controls of dissolved organic matter quality: evidence from a large-scale boreal lake survey. Global Change Biol. 20, 1101–1114. doi: 10.1111/gcb.12488
Kowalczuk, P., Durako, M. J., Young, H., Kahn, A. E., Cooper, W. J., and Gonsior, M. (2009). Characterization of dissolved organic matter fluorescence in the South Atlantic Bight with use of PARAFAC model: Interannual variability. Mar. Chem. 113, 182–196. doi: 10.1016/j.marchem.2009.01.015
Lakowicz, J. R. (2006). Principles of Fluorescence Spectroscopy, 3rd Edn. Kolkata: Springer. doi: 10.1007/978-0-387-46312-4
Lapierre, J.-F., and del Giorgio, P. A. (2014). Partial coupling and differential regulation of biologically and photochemically labile dissolved organic carbon across boreal aquatic networks. Biogeosciences 11, 5969–5985. doi: 10.5194/bg-11-5969-2014
Lawaetz, A. J., and Stedmon, C. A. (2009). Fluorescence intensity calibration using the Raman scatter peak of water. Appl. Spectrosc. 63, 936–940. doi: 10.1366/000370209788964548
Lobbes, J. M., Fitznar, H. P., and Kattner, G. (2000). Biogeochemical characteristics of dissolved and particulate organic matter in Russian rivers entering the Arctic Ocean. Geochim. Cosmochim. Acta 64, 2973–2983. doi: 10.1016/S0016-7037(00)00409-9
Mann, P. J., Davydova, A., Zimov, N., Spencer, R. G. M., Davydov, S., Bulygina, E., et al. (2012). Controls on the composition and lability of dissolved organic matter in Siberia's Kolyma River basin. J. Geophys. Res. 117, G01028. doi: 10.1029/2011jg001798
Mann, P. J., Eglinton, T. I., McIntyre, C. P., Zimov, N., Davydova, A., Vonk, J. E., et al. (2015). Utilization of ancient permafrost carbon in headwaters of Arctic fluvial networks. Nat. Commun. 6, 7856. doi: 10.1038/ncomms8856
Mann, P. J., Spencer, R. G. M., Dinga, B. J., Poulsen, J. R., Hernes, P. J., Fiske, G., et al. (2014). The biogeochemistry of carbon across a gradient of streams and rivers within the Congo Basin. J. Geophys. Res. Biogeosci. 119, 687–702. doi: 10.1002/(ISSN)2169-8961
Mathis, J. T., Hansell, D. A., and Bates, N. R. (2005). Strong hydrographic controls on spatial and seasonal variability of dissolved organic carbon in the Chukchi Sea. Deep Sea Res. Part II Topic. Stud. Oceanogr. 52, 3245–3258. doi: 10.1016/j.dsr2.2005.10.002
McClelland, J. W., Déry, S. J., Peterson, B. J., Holmes, R. M., and Wood, E. F. (2006). A pan-arctic evaluation of changes in river discharge during the latter half of the 20th century. Geophys. Res. Lett. 33, L06715–L06714. doi: 10.1029/2006GL025753
McClelland, J. W., Holmes, R. M., Dunton, K. H., and Macdonald, R. W. (2011). The Arctic Ocean Estuary. Estuar. Coasts 35, 353–368. doi: 10.1007/s12237-010-9357-3
McClelland, J. W., Holmes, R. M., Peterson, B. J., Amon, R. M. W., Brabets, T., Cooper, L. W., et al. (2008). Development of a Pan−Arctic database for river chemistry. Eos 89, 217–218. doi: 10.1029/2005JG000031
McKnight, D. M., Boyer, E. W., Westerhoff, P. K., Doran, P. T., Kulbe, T., and Andersen, D. T. (2001). Spectrofluorometric characterization of dissolved organic matter for indication of precursor organic material and aromaticity. Limnol. Oceangr. 46, 38–48. doi: 10.4319/lo.2001.46.1.0038
Murphy, K. R., Bro, R., and Stedmon, C. A. (2014). “Chemometric analysis of organic matter fluorescence,” in Aquatic Organic Matter Fluorescence, eds P. Coble, J. Lead, A. Baker, D. Reynolds, and R. G. M. Spencer (Cambridge, UK: Cambridge University Press), 339–375. doi: 10.13140/2.1.2595.8080
Murphy, K. R., Ruiz, G. M., Dunsmuir, W. T. M., and Waite, T. D. (2006). Optimized parameters for fluorescence-based verification of ballast water exchange by ships. Environ. Sci. Technol. 40, 2357–2362. doi: 10.1021/es0519381
Murphy, K. R., Stedmon, C. A., Graeber, D., and Bro, R. (2013). Fluorescence spectroscopy and multi-way techniques. PARAFAC. Anal. Methods 5, 6557–6566. doi: 10.1039/c3ay41160e
Murphy, K. R., Stedmon, C. A., Waite, T. D., and Ruiz, G. M. (2008). Distinguishing between terrestrial and autochthonous organic matter sources in marine environments using fluorescence spectroscopy. Mar. Chem. 108, 40–58. doi: 10.1016/j.marchem.2007.10.003
Neff, J. C., Finlay, J. C., Zimov, S. A., Davydov, S. P., Carrasco, J. J., Schuur, E. A. G., et al. (2006). Seasonal changes in the age and structure of dissolved organic carbon in Siberian rivers and streams. Geophys. Res. Lett. 33, L23401. doi: 10.1029/2006GL028222
O'Donnell, J. A., Aiken, G. R., Walvoord, M. A., and Butler, K. D. (2012). Dissolved organic matter composition of winter flow in the Yukon River basin: implications of permafrost thaw and increased groundwater discharge. Global Biogeochem. Cycles 26, 4. doi: 10.1029/2012GB004341
Opsahl, S., and Benner, R. (1995). Early diagenesis of vascular plant tissues: Lignin and cutin decomposition and biogeochemical implications. Geochim. Cosmochim. Acta 59, 4889–4904. doi: 10.1016/0016-7037(95)00348-7
Opsahl, S., Benner, R., and Amon, R. M. W. (1999). Major flux of terrigenous dissolved organic matter through the Arctic Ocean. Limnol. Oceangr. 44, 2017–2023. doi: 10.4319/lo.1999.44.8.2017
Osburn, C. L., Handsel, L. T., Mikan, M. P., Paerl, H. W., and Montgomery, M. T. (2012). Fluorescence tracking of dissolved and particulate organic matter quality in a river-dominated estuary. Environ. Sci. Technol. 46, 8628–8636. doi: 10.1021/es3007723
Osburn, C. L., and Stedmon, C. A. (2011). Linking the chemical and optical properties of dissolved organic matter in the Baltic–North Sea transition zone to differentiate three allochthonous inputs. Mar. Chem. 126, 281–294. doi: 10.1016/j.marchem.2011.06.007
Osburn, C. L., Wigdahl, C. R., Fritz, S. C., and Saros, J. E. (2011). Dissolved organic matter composition and photoreactivity in prairie lakes of the U.S. Great Plains. Limnol. Oceangr. 56, 2371–2390. doi: 10.4319/lo.2011.56.6.2371
Peterson, B. J. (2002). Increasing River Discharge to the Arctic Ocean. Science 298, 2171–2173. doi: 10.1126/science.1077445
Rawlins, M. A., Steele, M., Holland, M. M., Adam, J. C., Cherry, J. E., Francis, J. A., et al. (2010). Analysis of the Arctic System for freshwater cycle intensification: observations and expectations. J. Climate 23, 5715–5737. doi: 10.1175/2010JCLI3421.1
Raymond, P. A., McClelland, J. W., Holmes, R. M., Zhulidov, A. V., Mull, K., Peterson, B. J., et al. (2007). Flux and age of dissolved organic carbon exported to the Arctic Ocean: a carbon isotopic study of the five largest arctic rivers. Global Biogeochem. Cycles 21:4. doi: 10.1029/2007GB002934
Romanovsky, V. E., Drozdov, D. S., Oberman, N. G., Malkova, G. V., Kholodov, A. L., Marchenko, S. S., et al. (2010). Thermal state of permafrost in Russia. Permafrost Periglac. Process. 21, 136–155. doi: 10.1002/ppp.683
Runkel, R. L., Crawford, C. G., and Cohn, T. A. (2004). Load Estimator (LOADEST): A FORTRAN Program for Estimating Constituent Loads in Streams and Rivers: U.S. Geological Survey Techniques and Methods Book 4, Chapter A5. CreateSpace Independent Publishing Platform.
Serreze, M. C., Barrett, A. P., Slater, A. G., Woodgate, R. A., Aagaard, K., Lammers, R. B., et al. (2006). The large-scale freshwater cycle of the Arctic. J. Geophys. Res. 111, C11010–C11019. doi: 10.1029/2005JC003424
Smith, L. C., Pavelsky, T. M., MacDonald, G. M., Shiklomanov, A. I., and Lammers, R. B. (2007). Rising minimum daily flows in northern Eurasian rivers: a growing influence of groundwater in the high-latitude hydrologic cycle. J. Geophys. Res. 112, S47. doi: 10.1029/2006JG000327
Søndergaard, M., Stedmon, C. A., and Borch, N. H. (2003). Fate of terrigenous dissolved organic matter (DOM) in estuaries: aggregation and bioavailability. Ophelia 57, 161–176. doi: 10.1080/00785236.2003.10409512
Spencer, R. G. M., Aiken, G. R., Butler, K. D., Dornblaser, M. M., Striegl, R. G., and Hernes, P. J. (2009). Utilizing chromophoric dissolved organic matter measurements to derive export and reactivity of dissolved organic carbon exported to the Arctic Ocean: a case study of the Yukon River, Alaska. Geophys. Res. Lett. 36, L06401–L06406. doi: 10.1029/2008GL036831
Spencer, R. G. M., Aiken, G. R., Dyda, R. Y., Butler, K. D., Bergamaschi, B. A., and Hernes, P. J. (2010b). Comparison of XAD with other dissolved lignin isolation techniques and a compilation of analytical improvements for the analysis of lignin in aquatic settings. Org. Geochem. 41, 445–453. doi: 10.1016/j.orggeochem.2010.02.004
Spencer, R. G. M., Aiken, G. R., Wickland, K. P., Striegl, R. G., and Hernes, P. J. (2008). Seasonal and spatial variability in dissolved organic matter quantity and composition from the Yukon River basin, Alaska. Global Biogeochem. Cycles 22, 4. doi: 10.1029/2008GB003231
Spencer, R. G. M., Butler, K. D., and Aiken, G. R. (2012). Dissolved organic carbon and chromophoric dissolved organic matter properties of rivers in the USA. J. Geophys. Res. 117, G03001–G03014. doi: 10.1029/2011JG001928
Spencer, R. G. M., Hernes, P. J., Ruf, R., Baker, A., Dyda, R. Y., Stubbins, A., et al. (2010a). Temporal controls on dissolved organic matter and lignin biogeochemistry in a pristine tropical river, Democratic Republic of Congo. J. Geophys. Res. 115, G03013. doi: 10.1029/2009JG001180
Spencer, R. G. M., Mann, P. J., Dittmar, T., Eglinton, T. I., McIntyre, C., Holmes, R. M., et al. (2015). Detecting the signature of permafrost thaw in Arctic rivers. Geophys. Res. Lett. 42, 2830–2835. doi: 10.1002/2015GL063498
Stedmon, C. A., Amon, R., Rinehart, A. J., and Walker, S. A. (2011a). The supply and characteristics of colored dissolved organic mater (CDOM) in the Arctic Ocean: pan Arctic trends and differences. Mar. Chem. 124, 108–118. doi: 10.1016/j.marchem.2010.12.007
Stedmon, C. A., and Markager, S. (2005). Resolving the variability in dissolved organic matter fluorescence in a temperate estuary and its catchment using PARAFAC analysis. Limnol. Oceangr. 50, 686–697. doi: 10.4319/lo.2005.50.2.0686
Stedmon, C. A., Markager, S., and Bro, R. (2003). Tracing dissolved organic matter in aquatic environments using a new approach to fluorescence spectroscopy. Mar. Chem. 82, 239–254. doi: 10.1016/S0304-4203(03)00072-0
Stedmon, C. A., Thomas, D. N., Granskog, M., Kaartokallio, H., Papadimitriou, S., and Kuosa, H. (2007). Characteristics of dissolved organic matter in Baltic Coastal Sea Ice: Allochthonous or Autochthonous Origins? Environ. Sci. Technol. 41, 7273–7279. doi: 10.1021/es071210f
Stedmon, C. A., Thomas, D. N., Papadimitriou, S., Granskog, M. A., and Dieckmann, G. S. (2011b). Using fluorescence to characterize dissolved organic matter in Antarctic sea ice brines. J. Geophys. Res. 116, G03027–G03029. doi: 10.1029/2011JG001716
Striegl, R. G., Aiken, G. R., Dornblaser, M. M., Raymond, P. A., and Wickland, K. P. (2005). A decrease in discharge-normalized DOC export by the Yukon River during summer through autumn. Geophys. Res. Lett. 32, L21413. doi: 10.1029/2005GL024413
Striegl, R. G., Dornblaser, M. M., Aiken, G. R., Wickland, K. P., and Raymond, P. A. (2007). Carbon export and cycling by the Yukon, Tanana, and Porcupine rivers, Alaska, 2001-2005. Water Resour. Res. 43, 2. doi: 10.1029/2006WR005201
Tanaka, K., Kuma, K., Hamasaki, K., and Yamashita, Y. (2014). Accumulation of humic-like fluorescent dissolved organic matter in the Japan Sea. Sci. Rep. 4, 1–7. doi: 10.1038/srep05292
Tarnocai, C., Canadell, J. G., Schuur, E. A. G., Kuhry, P., Mazhitova, G., and Zimov, S. (2009). Soil organic carbon pools in the northern circumpolar permafrost region. Global Biogeochem. Cycles 23, 2. doi: 10.1029/2008GB003327
Templier, J., Derenne, S., Croué, J.-P., and Largeau, C. (2005). Comparative study of two fractions of riverine dissolved organic matter using various analytical pyrolytic methods and a 13C CP/MAS NMR approach. Org. Geochem. 36, 1418–1442. doi: 10.1016/j.orggeochem.2005.05.003
Tucker, L. R. (1951). A Method for Synthesis of Factor Analysis Studies (Personnel Research Section Report No. 984). Washington, DC: Department of the Army.
Walker, S. A., Amon, R. M. W., and Stedmon, C. A. (2013). Variations in high-latitude riverine fluorescent dissolved organic matter: a comparison of large Arctic rivers. J. Geophys. Res. Biogeosci. 118, 1689–1702. doi: 10.1002/2013JG002320
Walker, S. A., Amon, R. M. W., Stedmon, C. A., Duan, S., and Louchouarn, P. (2009). The use of PARAFAC modeling to trace terrestrial dissolved organic matter and fingerprint water masses in coastal Canadian Arctic surface waters. J. Geophys. Res. 114, G00F06–G00F012. doi: 10.1029/2009JG000990
Weishaar, J. L., Aiken, G. R., Bergamaschi, B. A., Fram, M. S., Fujii, R., and Mopper, K. (2003). Evaluation of Specific Ultraviolet Absorbance as an Indicator of the Chemical Composition and Reactivity of Dissolved Organic Carbon. Environ. Sci. Technol. 37, 4702–4708. doi: 10.1021/es030360x
Wickland, K. P., Aiken, G. R., Butler, K., Dornblaser, M. M., Spencer, R. G. M., and Striegl, R. G. (2012). Biodegradability of dissolved organic carbon in the Yukon River and its tributaries: seasonality and importance of inorganic nitrogen. Global Biogeochem. Cycles 26, 4. doi: 10.1029/2012GB004342
Yamashita, Y., Kloeppel, B. D., Knoepp, J., Zausen, G. L., and Jaffé, R. (2011). Effects of watershed history on dissolved organic matter characteristics in headwater streams. Ecosystems 14, 1110–1122. doi: 10.1007/s10021-011-9469-z
Yamashita, Y., Maie, N., Briceño, H., and Jaffé, R. (2010b). Optical characterization of dissolved organic matter in tropical rivers of the Guayana Shield, Venezuela. J. Geophys. Res. 115, G00F10–G00F15. doi: 10.1029/2009JG000987
Keywords: carbon cycle, Arctic, lignin, colored dissolved organic matter (CDOM), parallel factor analysis (PARAFAC), DOC, climate change, hydrology
Citation: Mann PJ, Spencer RGM, Hernes PJ, Six J, Aiken GR, Tank SE, McClelland JW, Butler KD, Dyda RY and Holmes RM (2016) Pan-Arctic Trends in Terrestrial Dissolved Organic Matter from Optical Measurements. Front. Earth Sci. 4:25. doi: 10.3389/feart.2016.00025
Received: 05 October 2015; Accepted: 23 February 2016;
Published: 17 March 2016.
Edited by:
Christopher Osburn, North Carolina State University, USAReviewed by:
Rudolf Jaffe, Florida International University, USAJean-Francois Lapierre, Michigan State University, USA
Copyright © 2016 Mann, Spencer, Hernes, Six, Aiken, Tank, McClelland, Butler, Dyda and Holmes. This is an open-access article distributed under the terms of the Creative Commons Attribution License (CC BY). The use, distribution or reproduction in other forums is permitted, provided the original author(s) or licensor are credited and that the original publication in this journal is cited, in accordance with accepted academic practice. No use, distribution or reproduction is permitted which does not comply with these terms.
*Correspondence: Paul J. Mann, paul.mann@northumbria.ac.uk