Global DEM Errors Underpredict Coastal Vulnerability to Sea Level Rise and Flooding
 Scott Kulp
 Benjamin H. Strauss
- Climate Central, Princeton, NJ, USA
Elevation data based on NASA's Shuttle Radar Topography Mission (SRTM) have been widely used to evaluate threats from global sea level rise, storm surge, and coastal floods. However, SRTM data are known to include large vertical errors in densely urban or densely vegetated areas. The errors may propagate to derived land and population exposure assessments. We compare assessments based on SRTM data against references employing high-accuracy bare-earth elevation data generated from lidar data available for coastal areas of the United States. We find that both 1-arcsecond and 3-arcsecond horizontal resolution SRTM data systemically underestimate exposure across all assessed spatial scales and up to at least 10 m above the high tide line. At 3 m, 1-arcsecond SRTM underestimates U.S. population exposure by more than 60%, and under-predicts population exposure in 90% of coastal states, 87% of counties, and 83% of municipalities. These fractions increase with elevation, but error medians and variability fall to lower levels, with national exposure underestimated by just 24% at 10 m. Results using 3-arcsecond SRTM are extremely similar. Coastal analyses based on SRTM data thus appear to greatly underestimate sea level and flood threats, especially at lower elevations. However, SRTM-based estimates may usefully be regarded as providing lower bounds to actual threats. We additionally assess the performance of NOAA's Global Land 1-km Base Elevation Project (GLOBE), another publicly-available global DEM, but do not reach any definitive conclusion because of the spatial heterogeneity in its quality.
Introduction
Understanding the exposure of coastal nations and communities to sea level rise and coastal flooding is critical in informing policymakers about the potential benefits of protective strategies, as well as in building awareness of the tangible effects of climate change. In recent years, a number of studies have used high resolution, high vertical accuracy, bare earth digital elevation models (DEMs) derived from lidar to produce coastal exposure estimates in individual countries, such as the United States (Knowles, 2010; Strauss et al., 2012, 2015). However, since availability of lidar is limited outside of the US, many non-US and global analyses have relied on DEMs of poorer accuracy and resolution, notably ones based on NASA's Shuttle Radar Topography Mission (SRTM; McGranahan et al., 2007; Hallegatte et al., 2013; Hinkel et al., 2014; Neumann et al., 2015).
Recent studies have investigated the absolute elevation error in SRTM (Shortridge, 2006; Tighe and Chamberlain, 2009; Becek, 2014), including the impacts of vegetation (LaLonde et al., 2010; Shortridge and Messina, 2011) and urban development (Gamba et al., 2002) on error. As most coastal exposure analysis is performed within the first few vertical meters above high tide lines, estimates are highly sensitive to small errors and differences in land elevation. For example, (Hinkel et al., 2014) recently found that using SRTM to compute exposed population below the 100-year flood event produces global estimates less than half those predicted by NOAA's Global Land 1-km Base Elevation Project (GLOBE). Additionally, recent studies, such as (Kuleli, 2010; Hallegatte et al., 2013; Strauss et al., 2015), have begun to investigate global sea level rise exposure at the municipality scale, which may be more sensitive to local noise in the DEM. While the elevation error in global DEMs has been studied, the impact of these elevation errors on computed coastal exposure is not well understood, making interpretation of such exposure analysis challenging. Here, we characterize bias and variability in exposure error based on global DEMs, including any behavior with respect to flood level and spatial scale.
This paper seeks to fill this need by building an error model from computed land and population exposure within the contiguous United States. Over most coastal areas, high-quality elevation models based on lidar are available from NOAA (NOAA, 2015). Previous studies have used lidar-based DEMs as a reference to assess the accuracy of SRTM elevation (Hofton et al., 2006). In this work, we similarly use NOAA's lidar-based coastal DEMs as a baseline against which we can assess flood exposure error under SRTM and GLOBE. After converting each DEM to the same tidal datum, we use US Census block data to compute population and land exposure at water levels between 1 and 10 m above local high tide lines, and sum this exposure up to municipality, county, state, and national scales. By treating exposure under lidar as ground truth, we can compute relative error at every location, allowing us to characterize error at all water surface levels and spatial scales, and assess not only bias and variability, but how often each elevation source underestimates (or overestimates) exposure under different conditions.
Data Set Characteristics and Analysis Methods
NOAA maintains and makes publically available a collection of lidar-derived DEMs generated by a range of governmental sources across the US coast, collected between 1996 and 2015. We use these lidar data as our baseline topography, which is classified to measure bare earth elevation, has a roughly 5 m horizontal resolution, and most data have published vertical errors <20 cm RMSE (NOAA, 2012). SRTM, based on a NASA mission in 2000, is available globally at both 3 arcsecond (“SRTM-3”) and 1 arcsecond (“SRTM-1”) horizontal resolutions (roughly 90 and 30 m, respectively), each with a vertical RMSE <10 m (Rodriguez et al., 2006; LaLonde et al., 2010). However, SRTM is an unclassified (“surface”) elevation model, and thus tall buildings and vegetation are expected to introduce significant positive bias (LaLonde et al., 2010; Shortridge and Messina, 2011). Additionally, we note that coastal processes between SRTM collection and the generally more recent lidar datasets may produce additional error in some marginal coastal strips. We expect this source of error to be minimal due to the small amount of elapsed time, and the large ratios of land area to coastline length for our municipal, county, and state units of analysis.
GLOBE has a much coarser horizontal resolution of 1 km (roughly 30 arcseconds), and is classified to measure bare earth elevation. However, GLOBE was developed using a patchwork of several different data sources, collected between the 1950's and 1998, and so its accuracy is inconsistent across the world's surface. Roughly 1/3 of the global land surface(including the United States), has absolute vertical RMSE ≤ 18 m, while another 1/3 of Earth's land surface has over 97 m vertical RMSE (Hastings et al., 1999).
As distributed by NOAA, the Coastal Lidar dataset is referenced to the NAVD88 geoid. Both SRTM and GLOBE are referenced to the EGM96 geoid. We convert these datasets to NAVD88 with a correction grid generated from geoid height calculators developed by NOAA (2011) and NGA (2013). Since we are interested in flood exposure due to SLR and coastal storms, we then convert all elevations to reference the local mean higher high water (MHHW) tidal datum using NOAA's VDatum grid (Parker et al., 2003) and nearest neighbor interpolation.
The US Census provides block boundaries and block populations (www.census.gov/geo/maps-data/data/tiger-line.html), which we use to compute population and land exposed below 1–10 m MHHW in increments of 1 m for each DEM. The exposure values computed within each block are then summed across their corresponding census places (municipalities), counties, and states. For all DEM's, this analysis assumes uniform population density within Census blocks, except for zero density over wetland areas, following the methodology described in Strauss et al. (2012). We define a sample's “true” exposure value (land or population), etrue, to be its computed exposure using lidar, and its “test” values, etest, as its computed exposure under SRTM-1 or GLOBE. In addition to using relative error, we also define the log10-multiplier (LM10) as follows:
This metric has advantages in error visualization, as it is centered about zero (no error), and gives equal weight, though opposite sign, to underestimation or overestimation of exposure.
This analysis is performed within every coastal state within the contiguous United States (CONUS), except for Virginia and Rhode Island, as there exist large regions of coastline within both of these states in which SRTM elevation is unavailable. Accordingly, we also do not consider VA or RI in any of the lidar nor GLOBE exposure analysis discussed below. At the municipality and county levels, to prevent very large relative error values occurring due to exceptionally small levels of exposure in certain locations, we only consider those places in which estimated exposure under both lidar and SRTM/GLOBE exceeds 1% of the total population/land area of that place.
Results and Discussion
Our results present three major findings, which are discussed in detail below. First, SRTM is very likely to underestimate exposure at all subnational locations and scales, while GLOBE exhibits more positive bias. Secondly, we see that error variability at subnational spatial scales is high under both DEM's, but drops considerably at higher water heights, especially under SRTM. Finally, across CONUS as a whole, SRTM-1 underpredicts exposure by a factor as high as 2.5, while GLOBE performs with higher accuracy, with nearly zero relative error at larger water heights.
In our analysis, we have empirically found that SRTM-1 and SRTM-3 produce nearly identical patterns in exposure error. For the purposes of clarity and brevity, we focus the rest of our discussion on SRTM-1, as this is the most recent and highest resolution version of SRTM currently available. The complete set of tables and figures for our SRTM-3 analysis is available in the Supplementary Materials.
Under/Overprediction Rates
SRTM-1 consistently underpredicts exposure at all spatial scales (Figure 1). At 1 m, no clear patterns of bias in population exposure error are apparent, but at 3 m, SRTM-1 underestimates population exposure in 83% of municipalities, 87% of counties, and 90% of states. By 10 m, SRTM-1 underestimation becomes nearly universal, with 86% of municipalities, 92% of counties, and 95% of states underpredicting population exposure. Land exposure under SRTM-1 follows similar patterns of error, though is more likely to underestimate at 1 m.
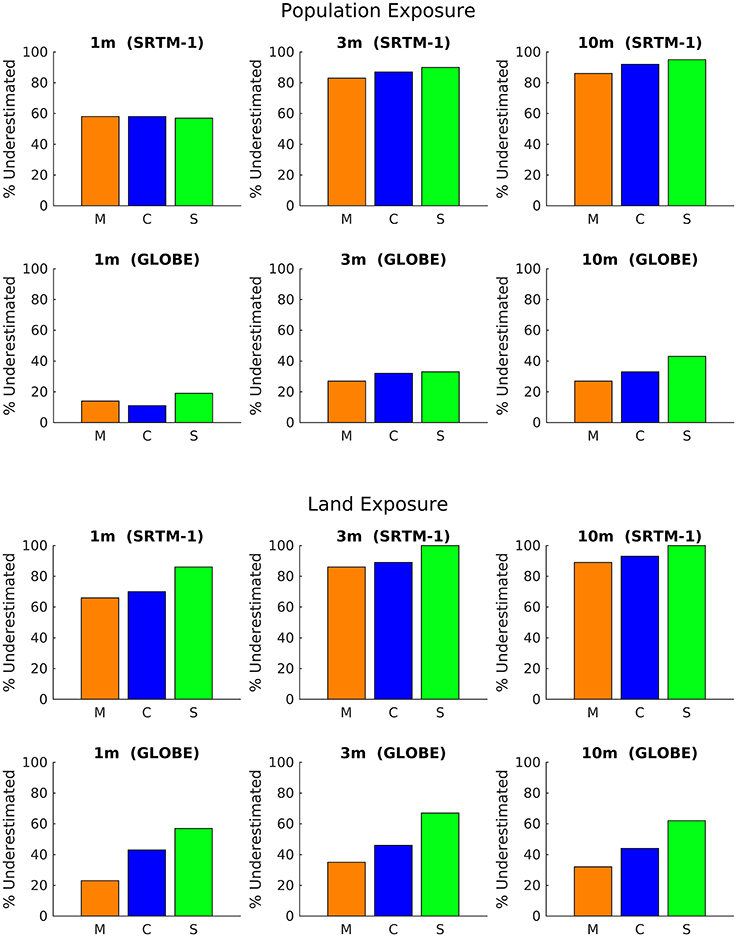
Figure 1. Bar graph of percent of places underestimating population (A) and land (B) exposure under SRTM-1 and GLOBE, across Municipalities (M, orange), Counties (C, blue), and States (S, green).
Conversely, GLOBE is more likely to overpredict exposure than SRTM-1, especially at smaller spatial scales. At 1 m, GLOBE overestimates population exposure in 85% of municipalities, 83% of counties, and 81% of states (values complementary to the underestimation rates listed in Figure 1 and Table 2). These high overestimation rates may be caused by GLOBE's low resolution and high vertical error in the DEM, causing inaccurately flooded pixels to cover large (1 km2) regions of populated land, while total exposure under lidar at 1 m is much smaller. However, these error rates drop rapidly as water elevation rises, such that at 3 m, GLOBE overpredicts in just 61% of municipalities, 67% of counties, and 67% of states. By the 10 m flood level, 28% of municipalities reach 100% population exposure under both lidar and GLOBE, implying zero error in exposure assessment for such locations. This causes overestimation rate in municipalities to fall to 40% under GLOBE, while county and state overpredict population exposure in 65 and 57% of cases, respectively.
Error Variability
In Figure 2, we also see that both global elevation datasets produce exposure estimates of highly variable error. In Table 1(SRTM-1) and Table 2 (GLOBE), we aggregate these exposure error results across each subnational spatial scale. As municipalities and states clearly represent the high and low ends of error variability in both DEM's, we focus on these two spatial scales in this discussion, and we note that error variability at the county level tends to fall between these two extremes.
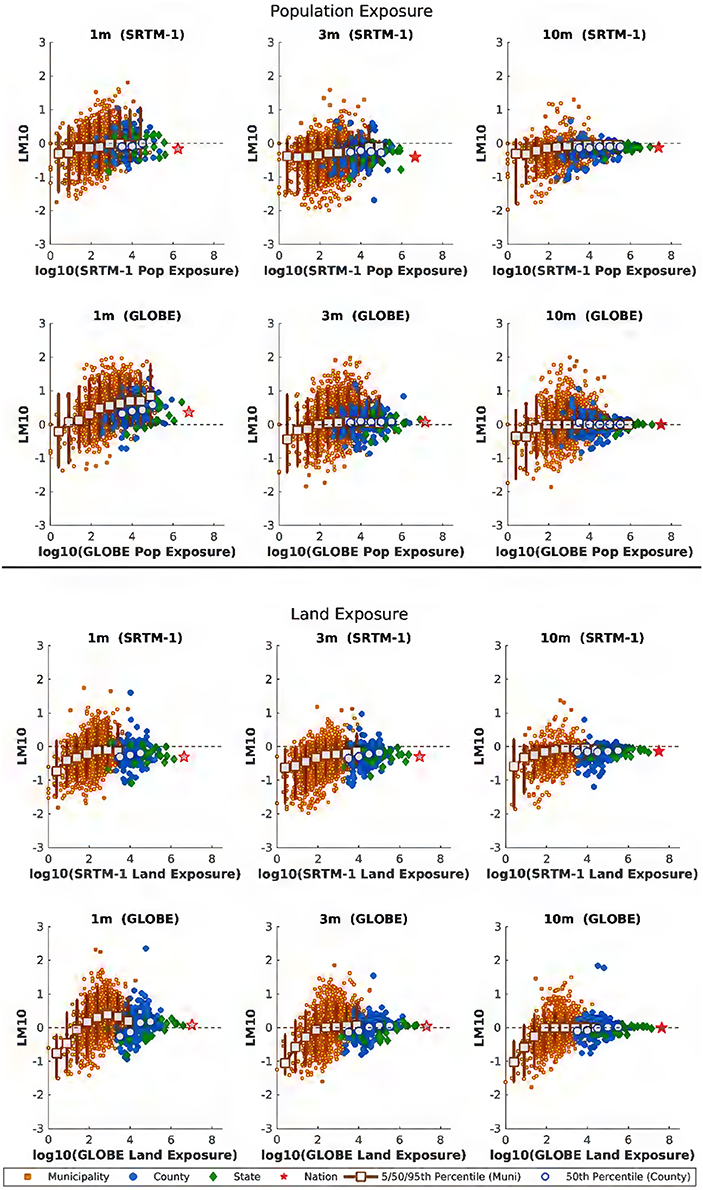
Figure 2. Scatter plot of LM10 vs. estimated population (rows 1 and 2) and land (rows 3 and 4) exposure at individual places. LM10 is defined as log10([SRTM1 or GLOBE exposure]/[lidar exposure]). Error bars for municipalities represent the 5/50/95th percentiles of LM10 values of neighboring points. County medians are also included, but error bars are removed to reduce clutter. Counties and municipalities with less than 1% exposure are not included.
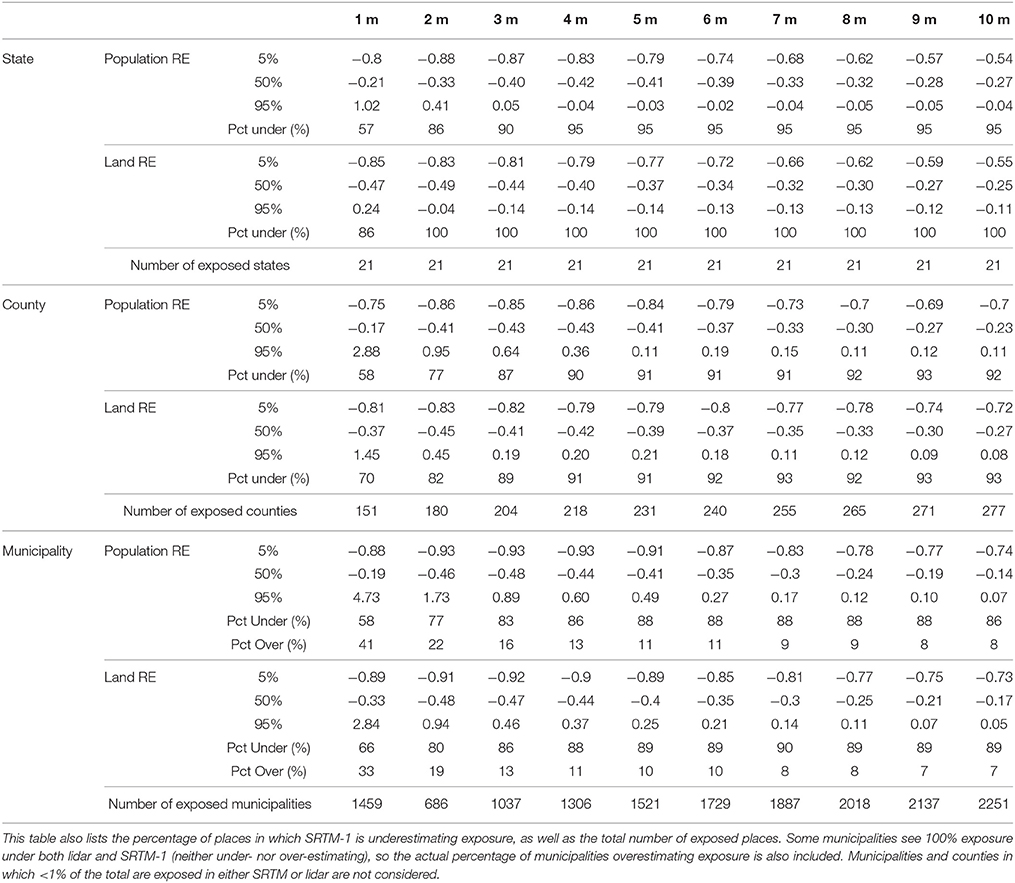
Table 1. Relative error values at the 5/50/95th percentiles across exposed states, counties, and towns under SRTM-1.
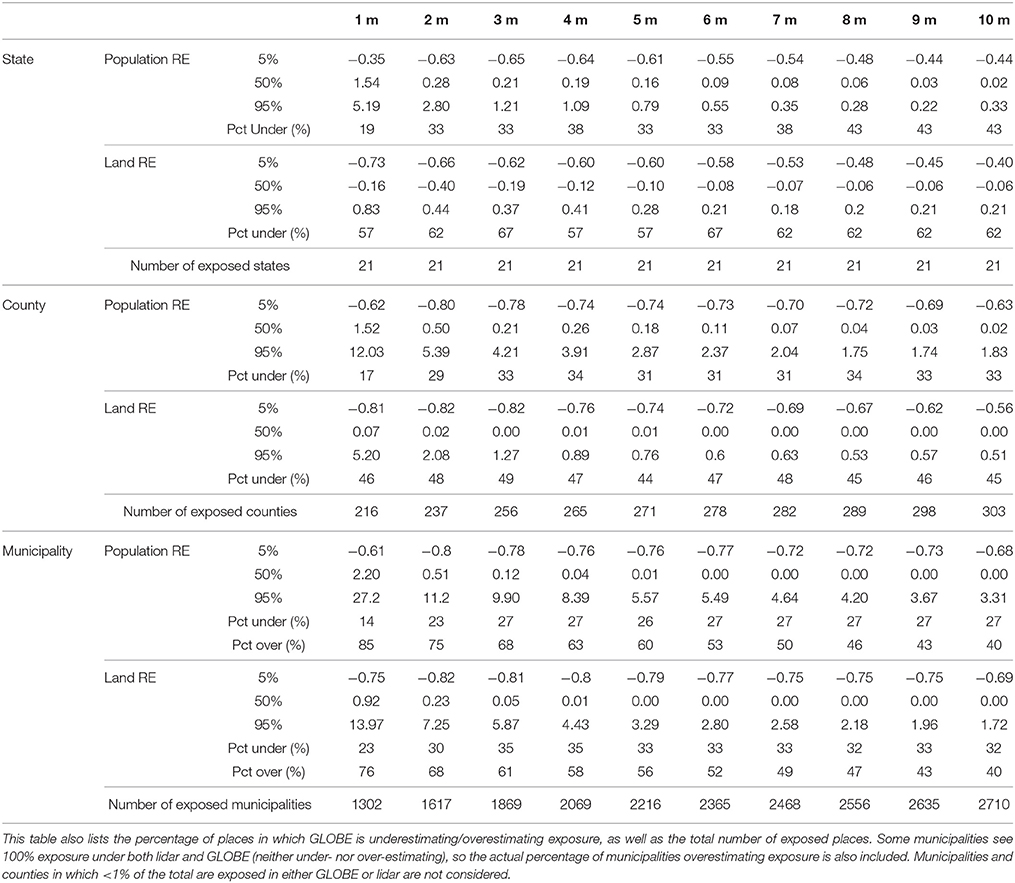
Table 2. Relative error values at the 5/50/95th percentiles across exposed states, counties, and towns under GLOBE.
We see that at 1 m, even across states, 90% of population exposure errors fall between –80 and 102% under SRTM-1, and between −35 and 519% under GLOBE. Across municipalities, this variability is worse, with between −88 and 473% error under SRTM-1, and between –61 and 2720% error under GLOBE.
This variability shrinks at higher water elevations, particularly under SRTM-1, which at 3 m produces errors across states between −87 and 5%. However, variability across municipalities under SRTM-1 remains relatively high, between −92 and 89%, while error under GLOBE falls between −65 and 121% across states, and between −78 and 990% across municipalities.
At 10 m, under SRTM-1, error variability drops even further across states (−54 to −4%) and municipalities (−74 to 7%). However, while GLOBE experiences smaller bias in exposure at 10 m, the error spread in both states (−44 to 33%), and municipalities (−68% to 331%) is much higher than SRTM-1, making GLOBE a less reliable option, especially at smaller spatial scales.
National Error Assessment
Table 3 presents a detailed summary of national-scale error analysis of population and land for both SRTM-1 and GLOBE. We see that at every flood level and for both variables, SRTM-1 underestimates exposure. At 1 m, SRTM-1 estimates 31% fewer people exposed than lidar, while at 2 and 3 m, this difference rises to over 61%. Rising water heights see shrinking error values, and by 10 m, SRTM underestimates exposure by just 24%. Analysis of land produces similar results, with SRTM estimating 50% less exposure than lidar between 1 and 3 m, and 28% lower by 10 m.
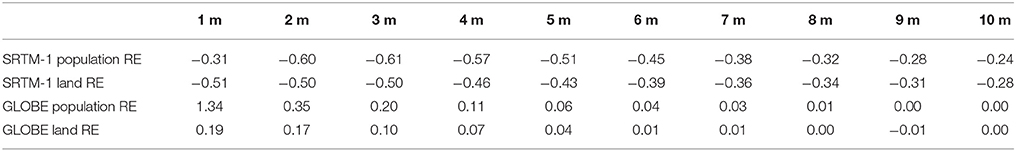
Table 3. Population and Land exposure relative error for the contiguous USA (omitting VA and RI) under SRTM-1 and GLOBE.
However, we again find GLOBE overestimates national population exposure at the lower water levels, with values over 130% higher than lidar at 1 m. Between 2 and 4 m, GLOBE error drops rapidly to 11%, and produces estimates nearly identical to lidar above 8 m. GLOBE performs noticeably better in land exposure analysis, overestimating by only 20% at 1 m, and nearly zero error above 5 m.
GLOBE's excellent performance across the US as a whole at flood heights >5 m could be attributed to the wide spatial scale, its high quality data source in the US (Digital Terrain Elevation Data), as well the bare-earth classification properties of this DEM, resulting in minimal elevation (and thus exposure) bias. However, we note that GLOBE's relative success in the US would not likely translate to most of the rest of the world, due to variable data sources and larger known errors. As such, SLR exposure analysis using GLOBE is probably only useful in those countries with elevation sources of known high quality, and is inappropriate for exposure analysis comparing multiple countries. Additionally, as we have seen, smaller-scale locations, including states, generally perform worse under GLOBE than SRTM-1.
Conclusions
At any scale, using SRTM in sea level rise exposure analysis is highly likely to underestimate true vulnerability—especially at water surface levels of 2–3 m. For example, at 2 m flood height, SRTM-1 underpredicts population exposure by a factor of over 2.5, as compared to estimates produced by using NOAA's more accurate Coastal Lidar. This error is most likely explained the presence of vegetation and urban development causing bias in SRTM's surface measurements. That said, increasing the flood height shrinks this error and its variability across smaller spatial scales to more reasonable levels, and may provide lower bounds of exposure in individual nations and municipalities globally. However, this also implies that global coastal threats may be even more damaging than what the recent literature suggests, especially at low elevations. While GLOBE may produce acceptable results at the wide spatial scales and high water elevations, it can only be expected to perform this well across 1/3 of the earth's land surface, where the highest quality data sources are used. In any other wider global-scale or narrower municipality-scale sea level rise and coastal flooding analysis, despite its nature of underestimating exposure, SRTM is the most reliable DEM publically available.
Author Contributions
SK and BS designed research; SK performed research and analyzed data; SK and BS wrote the paper.
Conflict of Interest Statement
The authors declare that the research was conducted in the absence of any commercial or financial relationships that could be construed as a potential conflict of interest.
Acknowledgments
We thank Claudia Tebaldi for statistical advice and Ashton Shortridge for geoid datum conversion grids. The research leading to these results received funding from the Kresge Foundation, V. Kann Rasmussen Foundation, and the Schmidt Family Foundation.
Supplementary Material
The Supplementary Material for this article can be found online at: https://www.frontiersin.org/article/10.3389/feart.2016.00036
References
Becek, K. (2014). Assessing global digital elevation models using the runway method: the advanced spaceborne thermal emission and reflection radiometer versus the shuttle radar topography mission case. IEEE Trans. Geosci. Remote Sens. 52, 4823–4831. doi: 10.1109/TGRS.2013.2285187
Gamba, P., Dell Acqua, F., and Houshmand, B. (2002). “SRTM data characterization in urban areas,” in International Archives of Photogrammetry Remote Sensing and Spatial Information Sciences, Vol. 34.3/B, 55–58.
Hallegatte, S., Green, C., Nicholls, R. J., and Corfee-Morlot, J. (2013). Future flood losses in major coastal cities.Nature Publishing Group. Nat. Clim. Chang. 3, 802–806. doi: 10.1038/nclimate1979
Hastings, D. A., Dunbar, P. K., Elphingstone, G. M., Bootz, M., Murakami, H., Masaharu, H., et al. (1999). Global Land One-Kilometer Base Elevation (GLOBE) Digital Elevation Model, Documentation, Volume 1.0. Boulder, CO: National Oceanic and Atmospheric Administration.
Hinkel, J., Lincke, D., Vafeidis, A. T., Perrette, M., Nicholls, R. J., Tol, R. S. J., et al. (2014). Coastal flood damage and adaptation costs under 21st century sea-level rise. Proc. Natl. Acad. Sci. U.S.A. 111, 3292–3297. doi: 10.1073/pnas.1222469111
Hofton, M., Dubayah, R., Blair, J. B., and Rabine, D. (2006). Validation of SRTM elevations over vegetated and non-vegetated terrain using medium footprint lidar. Photogramm. Eng. Remote Sens. 72, 279–285. doi: 10.14358/PERS.72.3.279
Knowles, N. (2010). Potential Inundation due to Rising Sea Levels in the San Francisco Bay region. Davis, CA: San Francisco Estuary Watershed Science.
Kuleli, T. (2010). Quantitative analysis of shoreline changes at the Mediterranean Coast in Turkey. Environ. Monit. Assess. 167, 387–397. doi: 10.1007/s10661-009-1057-8
LaLonde, T., Shortridge, A., and Messina, J. (2010). The influence of land cover on shuttle radar topography mission (SRTM) elevations in low-relief areas. Trans. GIS. 14, 461–479. doi: 10.1111/j.1467-9671.2010.01217.x
McGranahan, G., Balk, D., and Anderson, B. (2007). The rising tide: assessing the risks of climate change and human settlements in low elevation coastal zones. Environ. Urban. 19, 17–37. doi: 10.1177/0956247807076960
Neumann, B., Vafeidis, A. T., Zimmermann, J., and Nicholls, R. J. (2015). Future coastal population growth and exposure to sea-level rise and coastal flooding - a global assessment. PLoS ONE 10:e0118571. doi: 10.1371/journal.pone.0118571
NGA (2013). WGS 84 Earth Gravitational Model. Available online at: http://earth-info.nga.mil/GandG/wgs84/gravitymod/index.html (Accessed October 28, 2015).
NOAA (2011). Computation of GEOID03 Geoid Height. Available online at: http://www.ngs.noaa.gov/cgi-bin/GEOID_STUFF/geoid03_prompt1.prl (Accessed October 28, 2015).
NOAA (2012). Lidar 101: An Introduction to Lidar Technology, Data, and Applications. Charleston, SC.
NOAA (2015). Digital Coast Coastal Lidar. Available online at: http://coast.noaa.gov/digitalcoast/data/coastallidar (Accessed January 1, 2013).
Parker, B., Milbert, D., Hess, K., and Gill, S. (2003). National VDatum - The Implementation of a National Vertical Datum Transformation Database. Silver Spring, MD: NOAA's National Ocean Service.
Rodriguez, E., Morris, C., and Belz, J. (2006). An assessment of the SRTM topographic products. Photogramm. Eng. Remote Sensing 72, 249–260.
Shortridge, A. (2006). Shuttle Radar Topography Mission elevation data error and its relationship to land cover. Cartogr. Geogr. Inf. Sci. 33, 65–75. doi: 10.1559/152304006777323172
Shortridge, A., and Messina, J. (2011). Spatial structure and landscape associations of SRTM error. Remote Sens. Environ. 115, 1576–1587. doi: 10.1016/j.rse.2011.02.017
Strauss, B. H., Kulp, S., and Levermann, A. (2015). Mapping Choices: Carbon, Climate, and Rising Seas — Our Global Legacy. Princeton, NJ: Climate Central.
Keywords: sea level rise, climate impacts, srtm, globe, error analysis
Citation: Kulp S and Strauss BH (2016) Global DEM Errors Underpredict Coastal Vulnerability to Sea Level Rise and Flooding. Front. Earth Sci. 4:36. doi: 10.3389/feart.2016.00036
Received: 13 December 2015; Accepted: 23 March 2016;
Published: 19 April 2016.
Edited by:
Guy Jean-Pierre Schumann, University of California, Los Angeles, USAReviewed by:
Brian C. Gunter, Georgia Institute of Technology, USAAlessio Pugliese, University of Bologna, Italy
Copyright © 2016 Kulp and Strauss. This is an open-access article distributed under the terms of the Creative Commons Attribution License (CC BY). The use, distribution or reproduction in other forums is permitted, provided the original author(s) or licensor are credited and that the original publication in this journal is cited, in accordance with accepted academic practice. No use, distribution or reproduction is permitted which does not comply with these terms.
*Correspondence: Scott Kulp, skulp@climatecentral.org