Inter-Annual and Geographical Variations in the Extent of Bare Ice and Dark Ice on the Greenland Ice Sheet Derived from MODIS Satellite Images
 Rigen Shimada
 Nozomu Takeuchi
 Teruo Aoki
- 1Department of Earth Sciences, Chiba University, Chiba, Japan
- 2Climate Research Department, Meteorological Research Institute, Tsukuba, Japan
Areas of dark ice have appeared on the Greenland ice sheet every summer in recent years. These are likely to have a great impact on the mass balance of the ice sheet because of their low albedo. We report annual and geographical variations in the bare ice and dark ice areas that appeared on the Greenland Ice Sheet from 2000 to 2014 by using MODIS satellite images. The July monthly mean of the extent of bare ice showed a positive trend over these 15 years, and large annual variability ranging from 89,975 to 279,075 km2, 5 and 16% of the entire ice sheet, respectively. The extent of dark ice also showed a positive trend and varied annually, ranging from 3575 to 26,975 km2, 4 and 10% of the bare ice extent. These areas are geographically varied, and their expansion is the greatest on the western side, particularly the southwestern side of the ice sheet. The bare ice extent correlates strongly with the monthly mean air temperature in July, suggesting that the extent was determined by snow melt. The dark ice extent also correlates with the air temperature; however, the correlation is weaker. The dark ice extent further correlates negatively with solar radiation. This suggests that the extent of dark ice is not only controlled by snow melt on the ice, but also by changes in the surface structures of the bare ice surface, such as cryoconite holes, which are associated with impurities appearing on the ice surface.
Introduction
The surface albedo of the Greenland Ice Sheet has recently been reported to have declined significantly. Remote sensing data, in situ glaciological observations, and climate modeling has consistently shown large negative anomalies of albedo with a negative trend in previous decades (e.g., Tedesco et al., 2011; Stroeve et al., 2013; Alexander et al., 2014). In particular, the albedo reduction was significant in 2010 (Tedesco et al., 2011) and in 2012 (Tedesco et al., 2013; Alexander et al., 2014), and albedo in 2012 was recorded as the minimum after 2000 (Alexander et al., 2014). Because a lower reflectance enhances the absorption of solar radiation at the surface, the surface reflectance substantially affects melting. Recent mass loss of the Greenland ice sheet has not only been caused by climatic warming and terminus retreat of ocean curving front, but also by surface melting enhancement due to albedo reduction (e.g., Box et al., 2012). Therefore, to understand the factors affecting the mass balance of the ice sheet, it is important to assess the change of albedo.
Recent studies have shown that there are several factors for the recent albedo reduction of the Greenland ice sheet. In the snow-covered areas, the surface albedo can be determined by the snow grain size for the near-infrared wavelength, and by the concentration of light absorbing impurities for the visible wavelength (Wiscombe and Warren, 1980; Aoki et al., 2000, 2003). Snow grain size increases due to snow crystal metamorphism in warmer meteorological conditions, resulting in reduction of albedo (Warren and Wiscombe, 1980; Wiscombe and Warren, 1980). Box et al. (2012) suggest that the recent albedo decline over the accumulation area of Greenland can be attributed to an increase in snow grain size. The reduction of snow albedo is also suggested to be due to impurities, such as black carbon and mineral dust derived from the atmosphere. Dumont et al. (2014) suggested that snow surface albedo could be affected with the increase of snow impurities rather than snow grain growth after 2009. Furthermore, the albedo effect of impurities can be intensified by the increase in snow grain size, thus, these processes can provide a positive feedback to albedo reduction (Aoki et al., 2011).
Expanding bare ice surfaces also substantially contribute to the recent albedo decline because the ice surface albedo is lower than that of snow (Box et al., 2012; Stroeve et al., 2013). Persistent negative anomalies in summer albedo have occurred in recent years across western Greenland in areas below 2000 m, these indicated by remote sensing data as well as by automatic water station data (e.g., Alexander et al., 2014). The decreasing in albedo is caused by early melt onset, decreasing snow cover, and the expansion of the bare ice area (Stroeve et al., 2013). The expansion of the ice surface was observed especially over the ablation area of the southwestern part of the ice sheet (Tedesco et al., 2011; van As, 2011). Furthermore, the ice surface albedo declines further as impurities accumulate on the surface. A surface covered with abundant impurities is referred to as dark ice, and such surfaces have appeared on the bare ice of the southwestern ice sheet every summer (Wientjes and Oerlemans, 2010). The extent of dark ice surfaces can potentially have an impact on the total mass balance of the ice sheet since its low albedo strongly influences melt. The regional distribution of these dark ice surfaces remains, however, poorly constrained.
The ablation area surface albedo exhibits complicated spatial and temporal variations, depending on the surface ice type. Successive lowering of ice albedo and changing of the surface ice type after snow melt has been observed by in situ (Chandler et al., 2015) and remote sensing data (Moustafa et al., 2015). Superimposed ice, which has a relatively higher albedo than bare ice, appears first after snow melt; this is followed by dark ice with impurities being exposed in the middle of the melt season. The albedo of the ice surface can further change as the ice surface structure changes, e.g., during the formation of cryoconite holes. Cryoconite holes are small cylindrical pits formed on the ice surface, and can sink impurities at the bottom. Since the impurities in cryoconite holes become shielded from sunlight, their development causes relatively higher area-averaged ice albedo than the ice surface uniformly covered with impurities (Bøggild et al., 2010; Chandler et al., 2015). The bare ice albedo determined by surface ice type has multi-modal distributions and varies from year to year (Moustafa et al., 2015). Pigmented ice algae, growing on the ice surface can also reduce the albedo (Yallop et al., 2012; Lutz et al., 2013). Ice algae are cold-tolerant photosynthetic microbes, and grow on the melting ice surfaces out of cryoconite holes; their carbon production has been reported to be greater than that in cryoconite holes (Cook et al., 2010). The appearance of ice algae, which varies spatially and seasonally on glaciers (Uetake et al., 2010; Takeuchi, 2013), possibly contributes the albedo decline in ablation areas. These physical and biological processes may have contributed to the recent decline of surface albedo in ablation areas; however, the dynamics of the impurities and their effect on ice albedo are still unclear.
In this study, we report annual and geographical variations in the areas of bare ice and dark ice that appeared in melting season on the Greenland ice sheet using Moderate resolution Imaging Spectroradiometer (MODIS) satellite images obtained between 2000 and 2014, and discuss possible factors affecting their variations.
Data and Methodology
We used a 5 km sub-sampled calibrated radiance product of non-map projected granule scene (product ID: MOD02SSH) derived from the NASA Terra platform MODIS, which are available at NASA's data archive Level 1 and Atmosphere Archive and Distribution System (LAADS) web (http://ladsweb.nascom.nasa.gov/). The study period was from 1 July 2000 to 31 July 2014. The reflectance of seven bands, including visible and infrared wavelength regions, were converted from the product with transformation described in MODIS L1B Product User's Guide (Toller et al., 2003), this is the radiance of the spectral bands. Cloud, ocean, and sea ice areas on each MODIS image were masked with the method described by Stamnes et al. (2007). We then created daily and monthly composite images of cloud free pixels from the MODIS scene data. The pixels were combined with mosaic processing to cover Greenland in its entirety and re-projected to Lambert's Azimuthal Equal-area Projection using the nearest neighbor method. Pixel overlap is averaged in the composite process.
To classify the surface conditions of the ice sheet, we developed snow/ice discriminator based on the method described by Stamnes et al. (2007). Although this method can classify cloud, ocean and snow or ice regions, it is unable to distinguish the surface conditions on the ice sheet, such as snow and bare ice. We improved the method to discriminate snow, bare ice and dark ice surfaces by adding new thresholds. When snow is transformed into ice, surface reflectance becomes lower by density and grain radius increasing (Bergen, 1975). In order to discriminate snow and ice surfaces with reflectance in the visible and near-infrared bands, we used an image of the ice sheet during the melting season taken on 12 July 2012; this has a maximum variability of surface conditions, including snow and ice without cloud cover. Spectral reflectance of representative pixels of snow and bare ice on a MODIS image shows that snow surface reflectance was significantly higher than ice surface reflectance in all bands, especially at a wavelength of λ = 0.86 μm (band 2, Figure 1). Since the visible and near-infrared reflectance become lower with increasing grain radius (Warren and Wiscombe, 1980), the difference at λ = 0.86 μm shows the surface condition differing with snow metamorphism. Bare ice was defined as the surface with the following threshold using reflectance at λ = 0.86 μm (R0.86μm) (Equation 1).
Furthermore, we determined the threshold for the classification between ice surfaces and bare soil areas with λ = 0.86 and 1.64 μm (band 6). Although reflectance at λ = 0.86 μm is sensitive to the difference between ice and snow, the reflectance of the dark ice surface is close to the reflectance of the bare soil surrounding the ice sheet (Figure 1). Reflectance at λ = 1.64 μm (R1.64μm) was significantly different between bare soil and bare ice surfaces, including dark ice. Weidong et al. (2002) showed that soil reflectance was low in the visible region and high in the near-infrared region and that the spectral reflectance properties did not change with the soil moisture content. Our results showed this same feature. Warren (1984) showed that the ice complex refractive index in the shortwave infrared region was large, therefore the light absorption of λ = 1.64 μm was stronger than λ = 0.86 μm. Thus, we used the following normalized index with λ = 0.86 and 1.64 μm in order to distinguish between the bare soil, bare ice, and dark ice surfaces. Bare soil surfaces can be recognized by a negative number in this index (Isnow) (Equation 2).
In order to distinguish the dark ice surfaces in the bare ice areas, we used the reflectance at λ = 0.66 μm (R0.66μm), which is sensitive to impurities in both snow and ice. Dark ice was defined as the surface with:
As we tested different values of the threshold to the image (Figure S1), this threshold value was best to be consistent with the “dark band” area of the southwestern area of the ice sheet in July 2012 indicated in Moustafa et al. (2015). It was also consistent with the dark ice reflectance from field observation in the northwest Greenland (Bøggild et al., 2010).
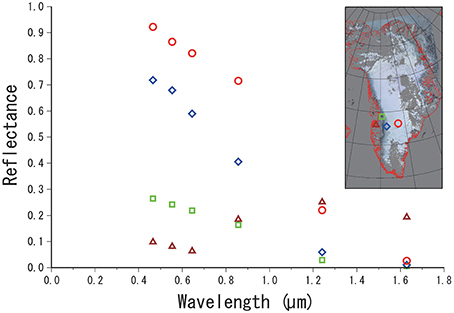
Figure 1. Spectral reflectance of snow (68°56′33″N, 42°27′16″W, red circle), bare ice (68°05′10″N, 48°01′23″W, blue diamond), dark ice (69°32′25″N, 50°26′56″W, green square), and bare soil (68°23′02″N, 53°48′13″W, brown triangle) and RGB color composite image band 1, 4, and 3 taken on 12 July 2012 derived from MODIS.
In order to check the classification result, we compared our result with an image of Landsat 8/OLI (Figure 2). We applied the thresholds to Landsat and MODIS images in the region of southwestern Greenland (68.9–67.7°N,49.7–48.0°W) on 12 July 2014. The classification from the Landsat image was in good agreement with that from the MODIS image. The relative errors in the area of each classification were 2.51% (snow), 0.16% (bare ice), and −3.30% (dark ice).
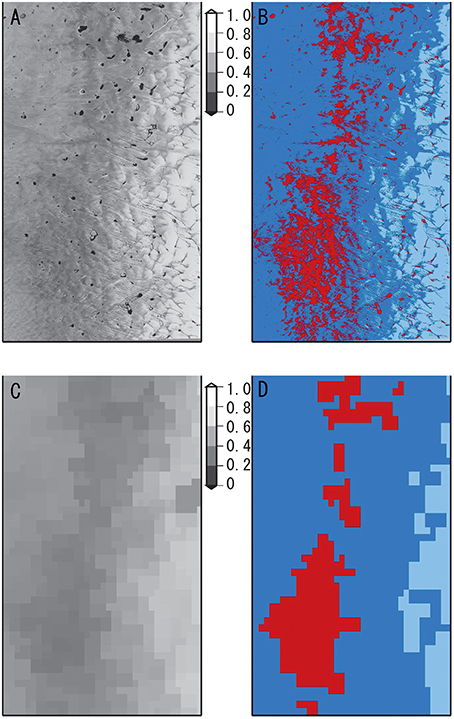
Figure 2. Comparison of reflectance image (λ = 0.66 μm) and distribution of snow (light blue), bare ice (blue), and dark ice (red) between Landsat 8/OLI (A,B) and MODIS (C,D) satellites acquired on 12 July 2014.
We obtained MODIS image composite data for the month of July from 2000 to 2014 and the areas of the bare and dark ice surface of the ice sheet were obtained with the thresholds in the index or reflectance described above. We chose this month because the monthly averaged albedo shows a minimal value at this time of year (Stroeve et al., 2013), indicating the month with most melting and usually showing a maximum expansion of the bare ice surface. Furthermore, in order to analyze geographical variations in albedo, we divided the ice sheet into four regions, namely, northwestern, southwestern, northeastern, and northwestern regions using the 72.5°N and 45°W lines of latitude and longitude, and obtained the extent of bare ice and dark ice within each region (Figure 3).
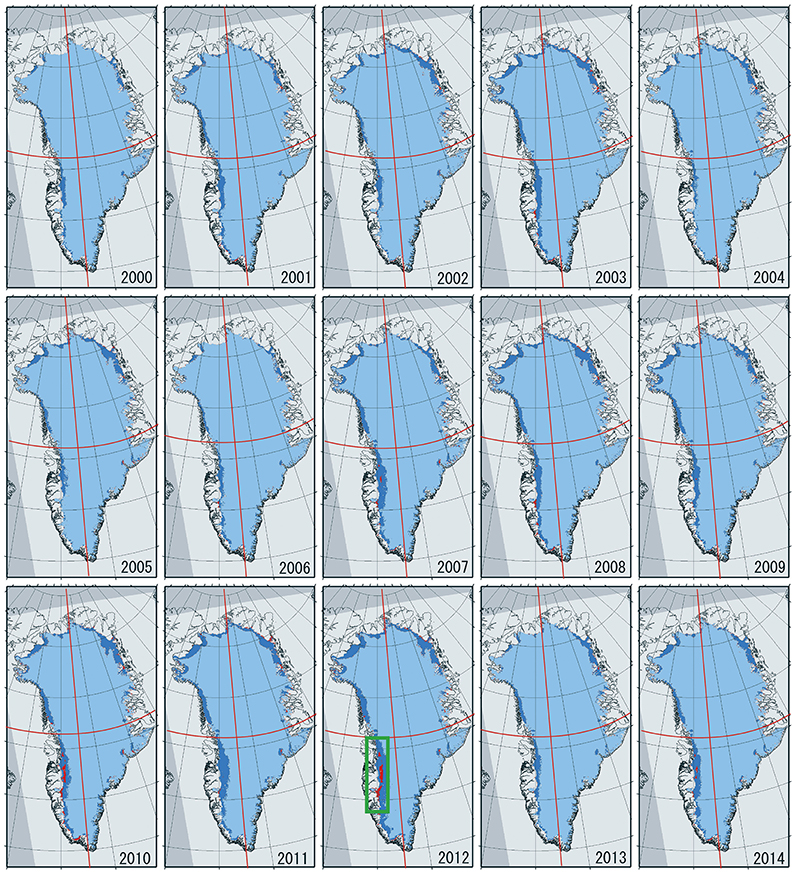
Figure 3. Distribution of snow (light blue), bare ice (blue), and dark ice (red) in July from 2000 to 2014. Red lines are regional division (72.5°N and 45°W). Green frame in 2012 showed the dark band.
In order to discuss the meteorological factors controlling the annual and geographical variations in the area of bare ice and dark ice, we used NCEP/NCAR reanalysis 2.5° grid data covering 2000–2014 to derive meteorological components (Kalnay et al., 1996). We used July monthly mean of air temperature, downward shortwave radiation flux, and downward longwave radiation flux, and the precipitation from January to May from the reanalysis data. The areal average of each component was obtained for the four geographical regions. The data used are only at the area lower than an elevation of 2000 m on the ice sheet, where the bare ice appeared.
Results
The analyses of the MODIS satellite images showed that bare ice appeared in the melting season along the terminus of the ice sheet in every year, but its extent varied annually (Table S1) and geographically (Figure 3). For example, the bare ice surface was smaller in 2000, 2004, and 2006, but larger in 2010, 2011, and 2012. Prominent bare ice surfaces were repeatedly observed in the southwestern and northeastern regions. The surfaces extended approximately 30 km in the southwestern region, from the ice terminus to inland of the ice sheet in 2012. Dark ice surfaces appeared generally when the bare ice surface was extended. Their distribution was, however, not uniform. For example, the dark ice in the southwestern region repeatedly appeared along the dark band where albedo was lower than in the surrounding areas (Wientjes and Oerlemans, 2010; Wientjes et al., 2011), and was located in the middle part of the bare ice area (Figure 3-2012, green frame). On the other hand, in the northeastern region, the dark ice tended to appear near the ice terminus.
The extent of the bare ice surfaces showed a positive annual trend and a large variability over the 15 years (Figure 4A). Mean and standard deviations of the extent of the bare ice for the 15 years was 163,620 ± 53,580 km2. The maximal extent of the bare ice was 279,075 km2 in 2012, which is 3.1 times larger than the minimal extent of 89,975 km2 in 2000. The maximal and minimal extents corresponded to 16 and 5% of the entire ice sheet. The increasing rate of the bare ice extent in whole region over the 15 years was 7158 km2 (4.4%) per year.
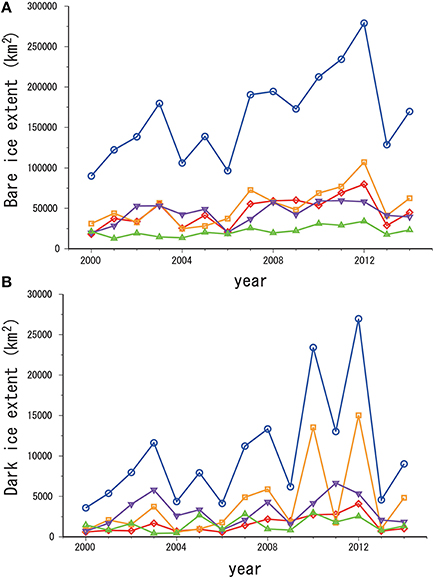
Figure 4. Annual variability of bare ice (A) and dark ice (B) extents in the whole region (blue circle) and northwestern (red diamond), northeastern (purple inverted triangle), southwestern (orange square), and southeastern (green triangle) regions from 2000 to 2014.
The extent of dark ice also showed a positive annual trend over the 15 years and a variability ranging from 3575 to 26,975 km2 (Figure 4B). Mean and standard deviations of the dark ice extent was 10,180 ± 6,940 km2, which is 6.2% of the mean bare ice extent. The largest extent of dark ice occurred in 2012, when the bare ice extent was also maximal, and was 7.6 times larger than the minimal extent in 2000. The increasing rate was 703 km2 per year (7.6%). There is a significant correlation between the dark ice and bare ice extent (Pearson's correlation coefficient: r = 0.89, Probability: P < 0.01). In spite of the positive correlation, the percentage of the dark ice extent to the bare ice extent varied from 4 to 11%. The first and second highest percentages occurred in 2010 (11%) and 2012 (9.7%). Although the annual variations of the bare ice and dark ice synchronized with each other during most of the study period, they showed different variations in some years. For example, the bare ice extent was more than 210,000 km2 from 2010 to 2012, while the dark ice extent showed drastic changes, it shrunk from 23,400 km2 in 2010 to 13,025 km2 in 2011, and increased again to 26,975 km2 in 2012.
The bare ice and dark ice extents of the four regions showed distinctive annual variabilities (Figures 4A,B). The mean bare ice extent was largest in the southwestern region (52,603 km2, 32% of the total mean bare ice area); intermediate in the northwestern and northeastern regions (45,518 km2, 28% and 43,975 km2, 27%); and smallest in southeastern region (21,520 km2, 13% of the total). Annual variations in the bare ice extent of each of the four regions showed that there are significant correlations between the regions except between northeastern and southeastern, and between northeastern and southwestern regions (Table S2). Although all four regions showed a positive trend during the study period, the increasing rate was greatest in the southwestern (5.8% per year) while was lowest in the northeastern region (2.8% per year). The trend is statistically significant in the whole region, as well as in the south-eastern and south-western region (p < 0.05).
The mean dark ice extents in the southwestern and northeastern regions were larger (4013 and 3133 km2, corresponding to 39 and 31% of the total dark ice extent, respectively) than northwestern and southeastern regions of the ice sheet (1530 and 1500 km2, corresponding to 15%, respectively). However, the extent in each region largely changed annually, and the extent was generally largest in the northeastern region before 2005, but in the southwestern region after 2005. The percentage of dark ice extent to bare ice extent was greater in the southwestern (7.6%), northeastern (7.1%), and southeastern region (7.0%), but smaller in the northeastern region (3.4%). Annual variations of the dark ice extents in the four regions showed that there are significant correlations between northwestern and southwestern; northwestern and northeastern; southwestern and southeastern regions, but no significant correlation between other pairs (Table S2). The range of variation is largest in the southwestern region (from 575 to 15,025 km2), while is smallest in the southeastern region (from 425 to 2975 km2). The maximum extent in the southwestern region occurred in 2012, which was ~26 times larger than the minimal extent in 2000. The dark ice extents in all four regions showed a positive trend during the study period. The increasing rate was greater in the southwestern (12%), northwestern (7.8%) and southeastern region (3.1%), but smaller in the northeastern region (2.8%; Figure 4B).
Discussion
Factors Controlling the Trend and Variability of Bare Ice Extent
According to Stroeve et al. (2013), the July monthly mean albedo of the Greenland ice sheet annually varied from 0.57 to 0.66, and showed a decreasing rate of -0.032 per decade from 2000 to 2012. The annual variability of albedo was consistent with the result for the bare ice extent shown by this study, and the bare ice extent also showed a positive trend during the period. This suggests that the expansion of the bare ice surface is a major contributor to the decline of surface albedo, as already noted by Box et al. (2012) and Tedesco et al. (2011). The bare ice extent showed a greater increasing rate on the western side compared with the eastern side, which is consistent with the trend of surface albedo reported by Alexander et al. (2014).
The annual variability of the bare ice extent is likely to be controlled by meteorological factors. Stroeve et al. (2013) suggested that the decline of albedo is due to higher summer temperature anomalies. Comparison of the bare ice extent with meteorological components of the ice sheet below 2000 m (temperature, precipitation, and radiation fluxes) from NCEP reanalysis data revealed that the bare ice extent showed a significant positive correlation with the mean July air temperature during the 15 years (r = 0.66, p < 0.01). This significant positive correlation was also found in all four geographical regions (Table 1). In contrast, the bare ice extent does not significantly correlate with precipitation (January to May) or July mean shortwave or long-wave radiation fluxes. Higher air temperatures cause faster melting of the snow cover, and result in an upward shift of the snow line. This causes more bare ice surfaces to become exposed. The variability of the bare ice area is, thus, influenced by the location of the snow line, which is associated mainly with mean air temperature in the melting season. The trend of the bare ice extent can also be explained by the air temperature. The increasing rate of the air temperature was higher on the western side (0.113 and 0.128 degree per year for northwestern and southwestern regions, respectively) than on the eastern side (0.049 and 0.098 degree per year for northeastern and southwestern region, respectively, Figure 5).
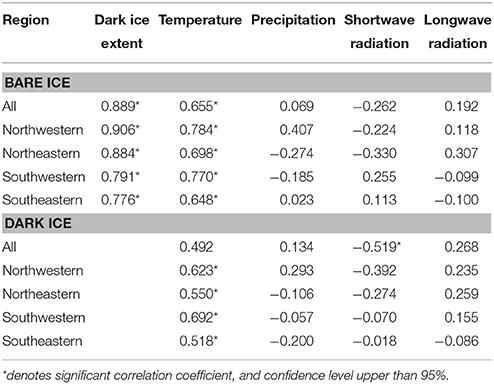
Table 1. Correlation coefficient of dark ice extent, temperature, winter precipitation, shortwave radiation flux, and longwave radiation flux for the extent of bare ice and dark ice.
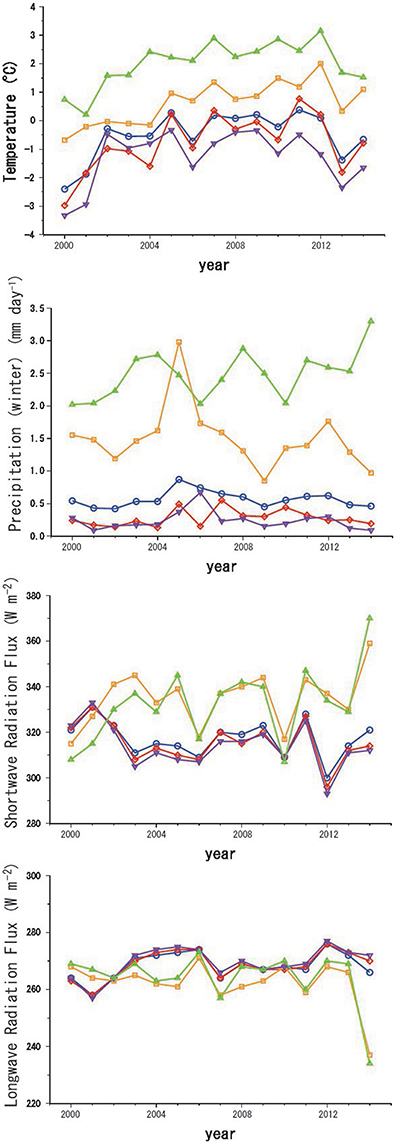
Figure 5. Annual variability of temperature, precipitation, shortwave radiation flux, and long-wave radiation flux calculated from NCEP/NCAR reanalysis data (Kalnay et al., 1996) in whole region (blue circle) and northwestern (red diamond), northeastern (purple inverted triangle), southwestern (orange square), and southeastern (green triangle) regions from 2000 to 2014.
The geographical variability of the bare ice extent is due to the different climate and topographic conditions of each region. July monthly mean air temperatures derived from NCEP reanalysis data showed that of southeastern region (2.0°C) was highest of the four region, and it was followed in order by the southwestern, northwestern, and northeastern regions (0.6, −0.8, and −1.3°C). The higher temperature accounted for the longer melting season, resulting in a greater extent of bare ice.
The larger extent of bare ice on the western side compared with the eastern side is probably due to the location of drainage divides (Zwally et al., 2012). Since the drainage divides are located in the eastern part of the ice sheet, the distance from ice terminus to drainage divide is longer on the western side than on eastern side of the ice sheet (Zwally and Giovinetto, 2001). Therefore, slope gradient is gentler, and thus the area below the equilibrium line, which corresponds to the bare ice extent, is larger on the western side. The equilibrium line altitude of the ice sheet is generally higher on the western side than on the eastern side because the snow accumulation rate is lower on the western side (Zwally and Giovinetto, 2001). Annual variation in the equilibrium line altitude along a transect near Kangerlussaq (K-transect) located at 67°N on the southwestern region (van de Wal et al., 2005) showed that it was positively correlated with the bare ice extent from 2000 to 2011 (van de Wal et al., 2012). Therefore, the largest extent of the bare ice in the southwestern region is likely to be due to higher equilibrium line altitude and gentle slope.
Relationship between Bare Ice and Dark Ice Surfaces
The positive correlation between bare ice and dark ice extents suggests that the dark ice extent is controlled by the same factors as those for the bare ice, however, both annual and geographical variability of the dark ice surface were not exactly same as those of the bare ice surface. Although, the dark ice extent in each region was positively correlated with the July mean air temperature over the 15 years similarly to the bare ice extent, their correlations were weaker. Furthermore, the total extent of dark ice was not correlated with temperature (Table 1). The dark ice surface also showed a distinct geographical variability compared with that of the bare ice surface. A greater extent of dark ice was observed in the southwestern and northeastern regions, but the relative extent of the bare ice surface was greatest in the southwestern, and less so in northwestern, and northeastern regions of the ice sheet. This suggests that the extent of the dark ice is not simply associated with exposure of the bare ice surface, and its distribution is not geographically uniform across the ice sheet.
As the satellite images showed, dark ice did not appear uniformly on the bare ice surface, but tended to appear in certain parts of the area. As Wientjes and Oerlemans (2010) indicated, the dark ice in the southwestern region repeatedly appeared along the dark band in the middle part of the bare ice. The dark ice in the northeastern region tended to appear along the ice terminus. Furthermore, dark ice rarely appeared near the snow line when the bare ice surface had expanded. These facts suggest that the appearance of the dark ice is not simply determined by the location of the snow line, but is associated with the distribution of impurities or physical properties of the bare ice surface.
Possible Factors Affecting the Extent of Dark Ice
As many studies have already shown, dark ice in the ablation area is caused by impurities covering the ice surface (e.g., Bøggild et al., 2010; Wientjes and Oerlemans, 2010; Wientjes et al., 2011; Chandler et al., 2015). Variability in dark ice extent is likely to reflect changes in such coverage. Studies reveal that the impurities affecting ice surface albedo on the Greenland ice sheet include black carbon, mineral dust, and biogenic organic matter (cryoconite and ice algae) (Bøggild et al., 2010; Yallop et al., 2012; Lutz et al., 2013). They have different origins, and accumulating processes on the ice surface. Goelles et al. (2015a) reported four sources of impurities: (1) from the atmosphere by dry or wet deposition, (2) from surrounding tundra by regional wind transport, (3) from englacial material deposited in the past in the accumulation area, and (4) from in situ biological production of dark organic material. A model for impurity accumulation proposed by Goelles and Bøggild (2015b) indicated that englacial material is the main source. This is consistent with the results of this study that the dark ice repeatedly appeared in almost the same locations, i.e., the middle part of the southwestern region and the lower part of the northeastern region (Figure 6). As previous work suggests, the concentration of englacial impurities is probably greater in the subsurface ice and this may be due to the abundant deposition of windblown dust in the past, possibly during the early Holocene (Wientjes and Oerlemans, 2010; Takeuchi et al., 2014). Geographical variability of the extent of dark ice may also be explained by the difference in the concentration of englacial material. The higher proportion of dark ice in the southwestern, southeastern, and northeastern regions may be due to the greater content of impurities in the subsurface ice, while it being lower in the northwest may be due to lower concentrations of englacial impurities although in situ data is not yet available.
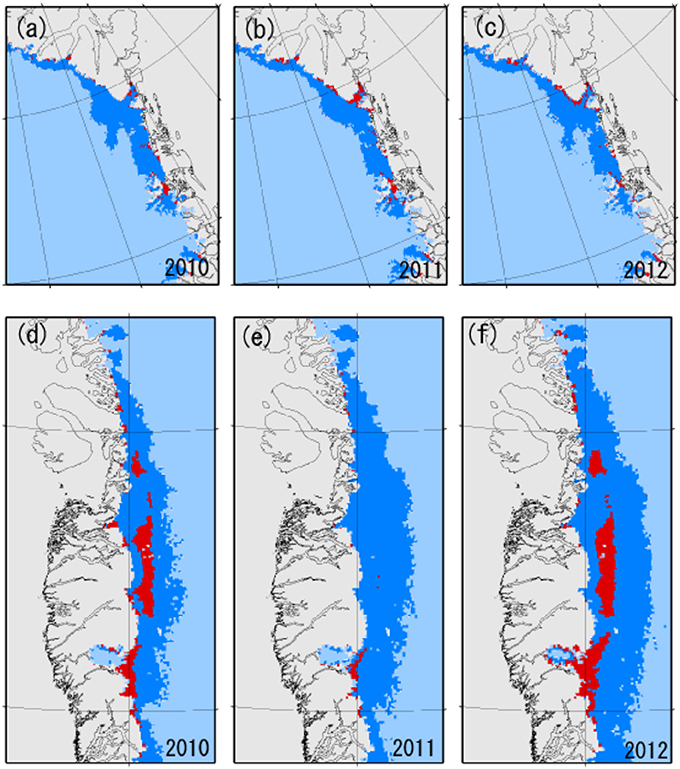
Figure 6. Distribution of snow (light blue), bare ice (blue), and dark ice (red) in northeastern region (A–C) and southwestern region (D–F) during July from 2010 to 2012.
The positive trend in dark ice extent may be caused by exposure of impurities from subsurface ice. As suggested by Moustafa et al. (2015), an increase in ice melt can cause more exposure of englacial impurities, and can extend the dark ice in the bare ice surface. According to Box et al. (2012), the melting of ice on the ice sheet increased 261.5 mm w.e. per year from 2000 to 2011. However, annual variability of dark ice extent cannot only be explained by the outcrop of englacial impurities. In particular, the change in dark ice extent from 2010 to 2012 appears to be too large in spite of the almost constant extent of the bare ice surface for these 3 years (Figure 6). As air temperature was also generally higher in all of these 3 years, the decrease in dark ice extent from 2010 to 2011 cannot be explained by the removal of surface impurities by melt water on the ice surface.
The extent of dark ice from 2010 to 2012 suggests that it is associated with the ice type of the bare ice surface. Studies have revealed that the surface ice type of the Greenland ice sheet has a wide variation in ablation area, such as clean ice, dirty ice, stream, and cryoconite holes (Chandler et al., 2015). Surface albedo of the bare ice varies with these surface ice types. For example, albedo is lower for dirty ice, which is the ice covered with impurities. On the other hand, it is higher for ice with cryoconite holes, which aggregate and sink the impurities at the bottom of the hole, resulting in increased area-averaged albedo (Bøggild et al., 2010). It is also higher for weathering crust, which is the porous ice developed in the shallow layer of the ablation ice surface (Muller and Keeler, 1969). Therefore, the extent of dark ice can drastically change with the transition of ice types, in particular, the formation and decay of cryoconite holes without a change in impurities abundance. According to previous studies, development of cryoconite holes is controlled by the dominant heat source of the surface ice melting (McIntyre, 1984). A cryoconite hole can develop when radiation heat is dominant, while it can decay when latent or sensible heat is dominant. In fact, the development and decay of cryoconite holes connected with changing weather conditions have been observed in the ablation ice area of the ice sheet (Chandler et al., 2015). Many cryoconoite holes melt out completely during a period of warm, cloudy or very windy weather, resulting in the dispersal of their debris on the bare ice surface. This might have been the case in 2011, where the lower solar radiation and warm conditions may have caused the decay of holes and the release the cryoconite onto the ice, thereby extending the areas of dark ice in 2012. In this way, dark ice extent can be changed annually by meteorological conditions, even if the areal abundance of impurities on the ice sheet did not change. Dark ice might extend further under conditions of lower solar radiation and warmer temperatures.
Our results showed that the dark ice extent was not simply controlled by the same factors as the bare ice and is likely to be attributed to impurity supply and surface ice structure. Therefore, it is important to develop an impurity accumulation model and to understand the physical processes of cryoconite holes and ice weathering in order to evaluate and predict future dark ice extents on the Greenland ice sheet. Estimates made using the impurity accumulation model of Goelles et al. (2015a) appear to be relevant, but there are still some uncertain values in using this model. For example, the movement of impurities across the ice surface by running melt water is uncertain, and this might affect the impurity abundance on the surface. There is also a lack of microbial processes in the model. In particular, the effect of ice algae may also significantly affect the ice surface albedo. Blooms of pigmented ice algae such as Ancylonema nordenskioldii, can change the ice to a dark color (Yallop et al., 2012). Moreover, the development of cryoconite granules, which are aggregates of organic and inorganic particles bound by filamentous cyanobacteria, might largely affect the retention time of all impurity particles, including mineral dust and black carbon because the formation of the granule is resistant to running melt water (Takeuchi et al., 2001). The structures of the surface ice should also be studied, in particular, the physical processes of their development, and relationship with ice surface albedo. Furthermore, as suggested by Irvine-Fynn and Edwards (2014) and Chandler et al. (2015), these ice structures could further interact with microbial production on the bare ice surface. The further study of ice surface processes may enable us to understand the dynamics of the extent of dark ice.
Conclusions
Analysis of MODIS satellite images revealed that the areas of bare ice and dark ice on the Greenland ice sheet showed a positive trend and large annual variability from 2000 to 2014. The extent of these areas also varied geographically. Comparison of the variability with NCEP reanalysis meteorological data showed a significant correlation between the extent of the bare ice and the July mean air temperature, suggesting that the variability of the bare ice extent is mainly controlled by air temperature, which affects snow melt and the location of the snow line on the ice sheet. The extent of the dark ice also correlated with the air temperature. However, the correlation was weaker than that of the bare ice, and the distribution of dark ice was not uniform in the bare ice areas, indicating that the extent of dark ice was not simply controlled by snow melt caused by high air temperature. According to previous studies, dark ice in the ablation area is caused by impurities covering the ice surface, and englacial material is the main source of the impurity mass on the ice surface. The positive trend of the extent of dark ice may be due to the increase in exposure of the englacial impurities due to recent ice melt. However, annual variability in the extent of dark ice cannot be explained only by the outcrop of englacial impurities. The negative correlation between the extent of dark ice and shortwave radiation flux suggests that the extent of dark ice is associated with the ice type of the bare ice surface. Intense solar radiation can cause the development of cryoconite holes and hide impurities within the ice, this results in a rise of ice surface albedo. Thus, the extent of dark ice probably changes drastically with the transition of ice types, in particular, the formation and decay of cryoconite holes without changes in impurity abundance.
The expansion of the extent of dark ice can further reduce the ice surface albedo, and cause more melting of the ice sheet. Therefore, it is necessary to understand the process of dark ice expansion. In particular, there is the need to develop an impurities accumulation model, and to understand the physical and biological processes associated with cryoconite holes and weathering ice to evaluate and predict the future extent of dark ice extent on the Greenland ice sheet.
Author Contributions
RS designed the study, analyzed data, and wrote the paper. NT gave technical support and conceptual advice and wrote the paper. TA gave technical support and conceptual advice.
Conflict of Interest Statement
The authors declare that the research was conducted in the absence of any commercial or financial relationships that could be construed as a potential conflict of interest.
Acknowledgments
This study was supported by Japan Society for the Promotion of Science (JSPS), Grant-in-Aid for Scientific Research (No. 23221004, 26247078, and 26241020), and the GCOM-C/SGLI Mission, the Japan Aerospace Exploration Agency (JAXA).
Supplementary Material
The Supplementary Material for this article can be found online at: https://www.frontiersin.org/article/10.3389/feart.2016.00043
References
Alexander, P. M., Tedesco, M., Fettweis, X., van de Wal, R. S. W., Smeets, C. J. P. P., and van den Broeke, M. R. (2014). Assessing spatio-temporal variability and trends in modelled and measured Greenland Ice Sheet albedo (2000–2013). Cryosphere, 8, 2293–2312. doi: 10.5194/tc-8-2293-2014
Aoki, T., Hachikubo, A., and Hori, M. (2003). Effects of snow physical parameters on shortwave broadband albedos. J. Geophys. Res. 108, 4616. doi: 10.1029/2003JD003506
Aoki, T., Kuchiki, K., Niwano, M., Kodama, Y., Hosaka, M., and Tanaka, T. (2011). Physically based snow albedo model for caluclating broadband albedos and the solar heating profile in snow pack for general circulation models. J. Geophys. Res. 116, D11114. doi: 10.1029/2010JD015507
Aoki, Te., Aoki, Ta., Fukabori, M., Hachikubo, A., Tachibana, Y., and Nishio, F. (2000). Effects of snow physical parameters on spectral albedo and bidirectional reflectance of snow surface. J. Geophys. Res. 105, 10219–10236. doi: 10.1029/1999JD901122
Bergen, J. D. (1975). A possoble relation of albedo to the density and grain size of natural snow cover water. Water Resour. Res. 11, 745–746. doi: 10.1029/WR011i005p00745
Bøggild, C. E., Brandt, R. E., Brown, K. J., and Warren, S. G. (2010). The ablation zone in northeast Greenland: ice types, albedos and impurities. J. Glaciol. 56, 101–113. doi: 10.3189/002214310791190776
Box, J. E., Fettweis, X., Stroeve, J. C., Tedesco, M., Hall, D. K., and Steffen, K. (2012). Greenland ice sheet albedo feedback: thermodynamics and atmospheric drivers. Cryosphere 6, 821–839. doi: 10.5194/tc-6-821-2012
Chandler, D. M., Alcock, J. D., Wadham, J. L., MacKie, S. L., and Telling, J. (2015). Seasonal changes of ice surface characteristics and productivity in the ablation zone of the Greenland Ice Sheet. Cryosphere 9, 487–504. doi: 10.5194/tc-9-487-2015
Cook, J., Hodson, A., Telling, J., Anesio, A., Irvine-Fynn, T., and Bellas, C. (2010). The mass–area relationship within cryoconite holes and its implications for primary production. Ann. Glaciol. 51, 106–110. doi: 10.3189/172756411795932038
Dumont, M., Brun, E., Picard, G., Michou, M., Libois, Q., Petit, J.-R., et al. (2014). Contribution of light-absorbing impurities in snow to Greenland's darkening since 2009. Nat. Geosci. 7, 509–512. doi: 10.1038/ngeo2180
Goelles, T., and Bøggild, C. E. (2015b). Albedo reduction caused by black carbon and dust accumulation: quantitive model applied to the western margin of the Greenland ice sheet. Cryosphere 9, 1345–1381. doi: 10.5194/tcd-9-1345-2015
Goelles, T., Bøggild, C. E., and Greve, R. (2015a). Ice sheet mass loss caused by dust and black carbon accumulation. Cryosphere 9, 1845–1856. doi: 10.5194/tc-9-1845-2015
Irvine-Fynn, T. D., and Edwards, A. (2014). A frozen asset: the potential of flow cytometry in constraining the glacial biome. Cytometry Part A 85, 3–7. doi: 10.1002/cyto.a.22411
Kalnay, E., Kanamitsu, M., Kistler, R., Collins, W., Deaven, D., Gandin, L., et al. (1996). The NCEP/NCAR 40-Year Reanalysis Project. Bull. Am. Met. Soc. 77, 437–471.
Lutz, S., Anesio, A. M., Villar, S. E. J., and Bbenning, L. G. (2013). Variations of algal communities cause darkening of a Greenland glacier. Microb. Ecol. 89, 402–414. doi: 10.1111/1574-6941.12351
McIntyre, N. F. (1984). Cryoconite hole thermodynamics. Can. J. Earth Sci. 21, 152–156. doi: 10.1139/e84-016
Moustafa, S. E., Rennermalm, A. K., Smith, L. C., Miller, M. A., Mioduszewski, J. R., Koenig, L. S., et al. (2015). Multi-modal albedo distributions in the ablation area of the southwestern Greenland Ice Sheet. Cryosphere 9, 905–923. doi: 10.5194/tc-9-905-2015
Muller, F., and Keeler, C. M. (1969). Errors in short-term abulation measurements on melting ice surface. J. Glaciol. 8, 91–105.
Stamnes, K., Li, W., Eide, H., Aoki, T., Hori, M., and Storvold, R. (2007). ADEOS-II/GLI snow/ice products - Part I: scientific basis. Remote Sens. Environ. 111, 258–273. doi: 10.1016/j.rse.2007.03.023
Stroeve, J., Box, J. E., Wang, Z., Schaaf, C., and Barett, A. (2013). Re-evaluation of MODIS MCD43 Greenland albedo accuracy and trends. Remote Sens. Environ. 138, 99–214. doi: 10.1016/j.rse.2013.07.023
Takeuchi, N. (2013). Seasonal and altitudinal variations in snow algal communities on an Alaskan glacier (Gulkana glacier in the Alaska range). Environ. Res. Lett. 8:035002. doi: 10.1088/1748-9326/8/3/035002
Takeuchi, N., Kohshima, S., and Seko, K. (2001). Structure, formation, and darkening process of albedo-reducing material (cryoconite) on a himalayan glacier: a granular algal mat growing on the glacier. Arc. Antarc. Alp. Res. 33, 115–122. doi: 10.2307/1552211
Takeuchi, N., Nagatsuka, N., Uetake, J., and Shimada, R. (2014). Spatial variations in impurities (cryoconite) on glaciers in northwest Greenland. Bull. Glaciol. Res. 32, 85–94. doi: 10.5331/bgr.32.85
Tedesco, M., Fettweis, X., Mote, T., Wahr, J., Alexander, P., Box, J. E., et al. (2013). Evidence and analysis of 2012 Greenland records from spaceborne observations, a regional climate model and reanalysis data. Cryosphere 7, 615–630. doi: 10.5194/tc-7-615-2013
Tedesco, M., Fettweis, X., van den Broeke, M. R., van de Wal, R. S. W., Smeets, C. J. P. P., van de Berg, W. J., et al. (2011). The role of albedo and accumulation in the 2010 melting record in Greenland. Environ. Res. Lett. 6:014005. doi: 10.1088/1748-9326/6/1/014005
Toller, G. N., Isaacman, A., and Salomonson, V. (2003). MODIS Level 1B Product User's Guide. Greenbelt, MD: NASA Goddard Space Flight Center.
Uetake, J., Naganuma, T., Hebsgaard, M. B., Kanda, H., and Kohshima, S. (2010). Communities of algae and cyanobacteria on glaciers in west Greenland. Polar Sci. 4, 71–80. doi: 10.1016/j.polar.2010.03.002
van As, D. (2011). Warming, glacier melt and surface energy budget from weather station observations in the Melville Bay region of northwest Greenland. J. Glaciol. 57, 208–220. doi: 10.3189/002214311796405898
van de Wal, R. S. W., Boot, W., Smeets, C. J. P. P., Snellen, H., van den Broele, M. R., and Oerlemans, J. (2012). Twenty-one years of mass balance observations along the K-transect, West Greenland. Earth Syst. Sci. Data Discuss. 4, 31–35, doi: 10.5194/essd-4-31-2012
van de Wal, R. S. W., Greuell, W., van den Broeke, M. R., Reijmer, C. H., and Oerlemans, J. (2005). Surface mass-balance observations and automatic weather station data along a transect near Kangerlussuaq, West Greenland. Ann. Glaciol. 42, 311–316. doi: 10.3189/172756405781812529
Warren, S. G. (1984). Optical constants of ice from the ultraviolet to the microwave. Appl. Opt. 23, 1206–1225. doi: 10.1364/AO.23.001206
Warren, S. G., and Wiscombe, W. J. (1980). A model for the spectral albedo of snow. II: snow containing atmospheric aerosol. J. Atmos. Sci. 37, 2734–2745.
Weidong, L., Baret, F., Xingfa, G., Qingxi, T., Lanfen, Z., and Bing, Z. (2002). Relating soil surface moisture ot reflectance. Remote Sens. Environ. 81, 238–246. doi: 10.1016/S0034-4257(01)00347-9
Wientjes, I. G. M., and Oerlemans, J. (2010). An explanation for the dark region in the western melt zone of the Greenland ice sheet. Cryosphere 4, 261–268. doi: 10.5194/tc-4-261-2010
Wientjes, I. G. M., Van de Wal, R. S. W., Reichart, G. J., Sluijs, A., and Oerlemans, J. (2011). Dust from the dark region in the western ablation zone of the Greenland ice sheet. Cryosphere 5, 589–601. doi: 10.5194/tc-5-589-2011
Wiscombe, W. J., and Warren, S. G. (1980). A Model for the spectral albedo of snow. I: pure snow. J. Atmos. Sci. 37, 2712–2733.
Yallop, M. L., Anesio, A. M., Perkins, R. G., Cook, J., Telling, J., Fagan, D., et al. (2012). Photophysiology and albedo-changing potential of the ice algal community on the surface of the Greenland ice sheet. ISME J. 6, 2303–2313. doi: 10.1038/ismej.2012.107
Zwally, H. J., and Giovinetto, M. B. (2001). Balance mass flux and ice velocity across the equilibrium line in drainage systems of Greenland. J. Geophys. Res. 106, 33717–33728. doi: 10.1029/2001JD900120
Zwally, H. J., Giovinetto, M. B., Beckley, M. A., and Saba, J. L. (2012). Antarctic and Greenland Drainage Systems, GSFC Cryospheric Sciences Laboratory. Available online at: http://icesat4.gsfc.nasa.gov/cryo_data/ant_grn_drainage_systems.php
Keywords: bare ice, dark ice, MODIS, Greenland ice sheet, climate change
Citation: Shimada R, Takeuchi N and Aoki T (2016) Inter-Annual and Geographical Variations in the Extent of Bare Ice and Dark Ice on the Greenland Ice Sheet Derived from MODIS Satellite Images. Front. Earth Sci. 4:43. doi: 10.3389/feart.2016.00043
Received: 31 October 2015; Accepted: 04 April 2016;
Published: 21 April 2016.
Edited by:
Michael Lehning, EPFL and WSL Institute for Snow and Avalanche Research SLF, SwitzerlandReviewed by:
Daniel Farinotti, Swiss Federal Institute for Forest, Snow, and Landscape Research WSL, SwitzerlandQiao Liu, Institute of Mountain Hazards and Environment, Chinese Academy of Sciences, China
Stefan Wunderle, University of Bern, Switzerland
Copyright © 2016 Shimada, Takeuchi and Aoki. This is an open-access article distributed under the terms of the Creative Commons Attribution License (CC BY). The use, distribution or reproduction in other forums is permitted, provided the original author(s) or licensor are credited and that the original publication in this journal is cited, in accordance with accepted academic practice. No use, distribution or reproduction is permitted which does not comply with these terms.
*Correspondence: Rigen Shimada, shimada.rigen@jaxa.jp
†Present Address: Rigen Shimada, Earth Observation Research Center, Japan Aerospace Exploration Agency, Tsukuba, Japan;
Teruo Aoki, Department of Earth Sciences, Okayama University, Okayama, Japan