Conduit Dynamics in Transitional Rhyolitic Activity Recorded by Tuffisite Vein Textures from the 2008–2009 Chaitén Eruption
 Elodie Saubin1
  Hugh Tuffen2*
  Lucia Gurioli1
  Jacqueline Owen2
  Jonathan M. Castro3
  Kim Berlo4 Ellen M. McGowan2
  C. Ian Schipper5 Katia Wehbe6
- 1Laboratoire Magmas et Volcans, Université Blaise Pascal-Centre National de la Recherche Scientifique-OPGC, Clermont Ferrand, France
- 2Lancaster Environment Centre, Lancaster University, Lancaster, UK
- 3Institute of Geosciences, Johannes Gutenberg University of Mainz, Mainz, Germany
- 4Department of Earth and Planetary Sciences, McGill University, Montreal, QC, Canada
- 5School of Geography, Environment and Earth Sciences, Victoria University of Wellington, Wellington, New Zealand
- 6B22: Multimode InfraRed Imaging and Microspectroscopy (MIRIAM), Diamond Light Source Ltd, Oxford, UK
The mechanisms of hazardous silicic eruptions are controlled by complex, poorly-understood conduit processes. Observations of recent Chilean rhyolite eruptions have revealed the importance of hybrid activity, involving simultaneous explosive and effusive emissions from a common vent. Such behavior hinges upon the ability of gas to decouple from magma in the shallow conduit. Tuffisite veins are increasingly suspected to be a key facilitator of outgassing, as they repeatedly provide a transient permeable escape route for volcanic gases. Intersection of foam domains by tuffisite veins appears critical to efficient outgassing. However, knowledge is currently lacking into textural heterogeneities within shallow conduits, their relationship with tuffisite vein propagation, and the implications for fragmentation and degassing processes. Similarly, the magmatic vesiculation response to upper conduit pressure perturbations, such as those related to the slip of dense magma plugs, remains largely undefined. Here we provide a detailed characterization of an exceptionally large tuffisite vein within a rhyolitic obsidian bomb ejected during transitional explosive-effusive activity at Chaitén, Chile in May 2008. Vein textures and chemistry provide a time-integrated record of the invasion of a dense upper conduit plug by deeper fragmented magma. Quantitative textural analysis reveals diverse vesiculation histories of various juvenile clast types. Using vesicle size distributions, bubble number densities, zones of diffusive water depletion, and glass H2O concentrations, we propose a multi-step degassing/fragmentation history, spanning deep degassing to explosive bomb ejection. Rapid decompression events of ~3–4 MPa are associated with fragmentation of foam and dense magma at ~200–360 m depth in the conduit, permitting vertical gas and pyroclast mobility over hundreds of meters. Permeable pathway occlusion in the dense conduit plug by pyroclast accumulation and sintering preceded ultimate bomb ejection, which then triggered a final bubble nucleation event. Our results highlight how the vesiculation response of magma to decompression events is highly sensitive to the local melt volatile concentration, which is strongly spatially heterogeneous. Repeated opening of pervasive tuffisite vein networks promotes this heterogeneity, allowing juxtaposition of variably volatile-rich magma fragments that are derived from a wide range of depths in the conduit. This process enables efficient but explosive removal of gas from rhyolitic magma and creates a complex textural collage within dense rhyolitic lava, in which neighboring fused clasts may have experienced vastly different degassing histories.
Introduction
Explosive-effusive behavioral transitions during silicic volcanic eruptions remain poorly understood, yet are typical of rhyolitic activity (e.g., Eichelberger et al., 1986; Gonnermann and Manga, 2003). The 2008–2009 rhyolitic eruption of Chaitén, in the Chilean Southern Volcanic Zone, is the first to be closely scientifically observed, and is providing unprecedented insights into processes controlling rhyolitic eruptive transitions (Castro et al., 2014). Chaitén was closely followed by the 2011–2012 Cordón Caulle eruption, also in Chile, which is providing additional insights into vent and plume processes (e.g., Schipper et al., 2013; Bonadonna et al., 2015). Notably, both recent eruptions were dominated by hybrid explosive-effusive behavior, which requires a new paradigm to explain the nature of eruptive controls (Schipper et al., 2013; Castro et al., 2014).
Explosive behavior is broadly characterized by magma fragmentation and the transition from a bubble-bearing liquid to a particle-bearing gas (e.g., Gonnerman and Manga, 2007). By contrast, fragmentation is less prevalent during effusive behavior, which is dominated by ductile magma deformation. Volatiles drive explosive volcanism (e.g., Sparks, 1978), yet initial volatile concentrations in explosive and effusive phases are typically similar (Eichelberger et al., 1986). Effusive behavior therefore requires efficient magma outgassing, with a significantly open degassing system, unlike the predominantly closed degassing system operative during explosive behavior (Newman et al., 1988). Outgassing is favored by slower magma ascent, which provides more time for gas separation via fractures or interconnected bubbles. In addition, a spatially variable ascent rate within an individual conduit may permit simultaneous explosive and effusive activity (Schipper et al., 2013). In recently observed Chilean rhyolitic systems, the high magma flux during the first effusive activity requires rapid, efficient gas separation from rising magma (Pallister et al., 2013; Bertin et al., 2015). However, rhyolitic melts are highly viscous, with viscosities increasing from ~105 to ~1010 Pas upon degassing from 4% to 0.1 wt. % H2O (Giordano et al., 2008), hindering buoyant bubble rise and thus gas escape. Instead, connected permeable channels must be generated within the conduit, either within deforming, coalescing magmatic foams or fracture networks (Stasiuk et al., 1996; Okumura et al., 2010). The latter, which are generated via shear stresses or gas overpressure, are sometimes preserved as particle-clogged tuffisite veins hosted by ballistic bombs, conduit-filling lava or country rock (Heiken et al., 1988; Stasiuk et al., 1996; Gonnermann and Manga, 2003; Tuffen et al., 2003; Cabrera et al., 2011; Holland et al., 2011; Castro et al., 2012, 2014; Berlo et al., 2013).
Our understanding of rhyolitic behavioral transitions remains severely limited by a lack of knowledge of the complex processes operating in shallow conduits. Improved constraints on tuffisite vein formation and mechanisms of gas-magma separation are required to refine conduit flow models and identify the thresholds that control hazardous eruptive behavior. In this paper we present a textural study of a tuffisite vein within a rhyolitic obsidian bomb ejected during the transitional phase of the Chaitén 2008 eruption. Pyroclast textures are deeply related to the dynamic characteristics of eruptions and thus provide useful insights into eruptive processes (e.g., Shea et al., 2010; Giachetti et al., 2011; Rust and Cashman, 2011; Gurioli et al., 2015). Here we apply this approach to pyroclasts trapped within the vein, with the aim of quantifying the poorly-constrained fragmentation, decompression and vesiculation processes that accompany tuffisite vein formation. Key uncertainties include the longevity of veins (permeability lifespan), how successive fracture-healing cycles are superimposed, and how veins interact with magmatic foams (Tuffen et al., 2003; Holland et al., 2011; Castro et al., 2012). In particular, we focus on bubble nucleation and growth within diverse juvenile vein-hosted clasts, to reconstruct a multi-step fragmentation and degassing history that culminated in explosive bomb ejection. Results lead to a new model that helps resolve conduit processes during the transitional phase of the Chaitén 2008–2009 eruption.
Scientific and Geological Context
Tuffisite Veins
Tuffisite veins are clast-filled fractures occurring within volcanic conduits and surrounding country rock. Internal, within-conduit tuffisites are networks of linked angular fractures <1 to >10 cm wide that are filled with juvenile clasts (dense lava and pumice) and lithic fragments. Clast sizes span microns-centimeters, and sedimentary structures in tuffisite vein-filling material indicate their defining feature: particle deposition from a mobile fluid phase (Stasiuk et al., 1996; Tuffen et al., 2003). Glassy clasts may be incipiently sintered to densely welded, with the densest welding destroying all porosity and creating viscously-deformed flow bands in silicic lava (Gonnermann and Manga, 2003; Tuffen et al., 2003). Tuffisites occur in dissected conduits, but also in bombs ejected in Vulcanian explosions and are inferred to feed explosive gas release from silicic vents when they intersect with the surface (Stasiuk et al., 1996; Tuffen and Dingwell, 2005; Cabrera et al., 2011; Castro et al., 2012, 2014; Berlo et al., 2013; Schipper et al., 2013). However, deposition, sintering and compaction of melt-rich particles within veins eventually causes dramatic permeability reduction (Tuffen et al., 2003; Tuffen and Dingwell, 2005; Vasseur et al., 2013; Heap et al., 2015).
The prevalent model for vein generation is shear failure of non-Newtonian magma during shallow ascent in the conduit. Failure is favored by higher strain rates near conduit walls and magma stiffening via degassing and crystallization (e.g., Goto, 1998; Gonnermann and Manga, 2003; Tuffen et al., 2003; Neuberg et al., 2006). When a dense lava plug exists (the lava dome in the case of Chaitén), deeper magma ascent induces shear stresses in the plug, leading to shear failure and plug slip (Neuberg et al., 2006; e.g., Lensky et al., 2008; Holland et al., 2011). Connected fracture networks may briefly allow gas and ash venting at the surface (Schipper et al., 2013), which decreases vein pressure, permitting local degassing at vein walls via diffusion, whereas veins can also receive input of deeper magmatic gas and particles (Cabrera et al., 2011; Castro et al., 2012, 2014; Berlo et al., 2013). Vein wall abrasion may drive further assimilation of host magma particles (Tuffen and Dingwell, 2005).
Clasts within veins present textural evidence, including the presence of truncated flow bands, for repeated fracture-healing cycles. Integrated over time, these cycles permit outgassing and magma densification (Rust et al., 2004; Rust and Cashman, 2007; Cabrera et al., 2011; Castro et al., 2012), potentially assisted by viscous foam collapse and compaction (e.g., Stasiuk et al., 1996). The efficiency of vein-driven outgassing depends on the spatial extent of veins, the timescale over which their permeability is sustained, and the permeability of intercepted magma (Castro et al., 2012; Berlo et al., 2013; Heap et al., 2015). Contrasting clast volatile concentrations within studied tuffisite veins suggest vertical extents exceeding 100 m in shallow conduits (Berlo et al., 2013), whereas H2O diffusion gradients around Chaitén veins indicate diffusive lifetimes of ~15 min to 1 day (103–105 s; Castro et al., 2012). Such inferred timescales are consistent with those of vein closure via welding and viscous compaction (Tuffen et al., 2003). Such brief vein opening only permits local diffusive water depletion around veins (~100–200 μm), rendering outgassing inefficient without either unrealistically closely-spaced veins (<1 mm apart) or intersection with foam domains (Castro et al., 2012).
Geological Context: The Chaitén 2008–2009 eruption
Volcán Chaitén, located at ~42°50's in Chilean Patagonia (Figure 1A), produced an explosive rhyolitic eruption on May 1 2008, following only a brief (~24 h) period of detected precursory seismicity (Castro and Dingwell, 2009). Rapid, dyke-controlled magma ascent is inferred, from a magmatic source at 5–10 km depth (Wicks et al., 2011; Pallister et al., 2013). The initial purely explosive activity (phase 1) lasted 10 days, with a ≤19 km plume, followed by the transitional explosive-effusive phase 2 that lasted ~20 days (ending on May 31 2008). This hybrid phase was characterized by the emplacement of rhyolitic lava domes and coulées (Figure 1B) during a succession of Vulcanian explosions that produced pyroclastic density currents (Alfano et al., 2011, 2012; Castro et al., 2012; Bernstein et al., 2013; Pallister et al., 2013). The ensuing phase 3, with months of exogenous/endogenous lava emplacement, ended in late 2009/early 2010 (Pallister et al., 2013).
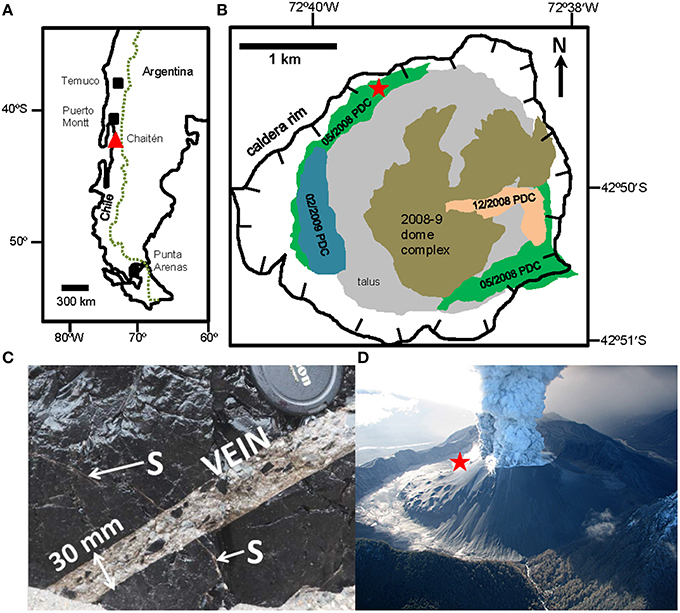
Figure 1. (A) The location of Chaitén volcano in the Southern Volcanic Zone of the Chilean Andes. (B) Simplified map of the 2008-9 deposits within the Chaitén caldera, after Pallister et al. (2013). Distribution and dates of pyroclastic density current (PDC) deposits indicated. Bomb sampling location indicated (star). (C) Part of the studied tuffisite vein, with subsidiary veins indicated (S). (D) The eruptive plume on May 26 2008, during the transitional phase, showing newly-emplaced lava flows (to the left) and sampling location (star). Photograph by J.N. Marso, USGS.
The initial lava effusion rate which occurred at the onset of phase 2, 66 m3s−1, was the highest observed for any silicic eruption (Pallister et al., 2013). It has been since exceeded only by the initial >70 m3s−1 flux at Cordón Caulle in June 2011 (Bertin et al., 2015). This high flux of dense, degassed magma implies that gas separation from magma became highly efficient within, at most, 10 days of the onset of the eruption (Castro et al., 2012). Such high lava fluxes reflect the relatively low viscosity of nearly-aphyric magma (<1 vol % crystals, Castro and Dingwell, 2009), compared with highly-crystalline andesites or dacites, and in total ~0.8 km3 of lava was emitted (Pallister et al., 2013). The synchronicity of pyroclastic and lava emissions during hybrid phase 2 activity indicate that explosive outgassing processes facilitate emission of a high flux of degassed lava (Castro et al., 2014).
Studied Tuffisite Vein
A 30 × 40 × 50 cm dense obsidian bomb (Figure 1C) ejected during the hybrid activity (phase 2) in May 2008 (Figure 1D) was sampled in the north-western part of the Chaitén caldera (42°49′33.66″S, 72°39′27.53″W), ~800 m from the 2008 vent. It is cut by a 3 cm-wide, parallel-walled, rectilinear tuffisite vein that is one of the widest and largest documented to date within any bomb. The main vein (Figures 1C,2) is filled with centimetric clasts of dense black obsidian similar to the host, alongside a variety of paler clast types, all within a fine-grained matrix. A network of far narrower, strikingly planar, intersecting veins (subsidiary veins; tens of microns to ~1 mm wide; Figures 1C,2) occur both sub-parallel to and propagating from the main vein walls into the host obsidian. Similar veins are also found in some of the larger dense obsidian clasts within the vein. Subsidiary veins are filled with very fine-grained, pale clastic material.
Methods
Bulk Rock Analysis and Major Element Compositions
The density and porosity of the main vein and host obsidian were determined following the procedures outlined in Houghton and Wilson (1989), Formenti and Druitt (2003) and Takeuchi et al. (2008) at the Laboratoire Magmas et Volcans (LMV), of Clermont Ferrand, France. The tuffisites and the host obsidian were cut into rectangular prisms (BTB 1-a, BTB 1-b, BTB 1-c; Figure 2A). The porosity was calculated from each fragment using the dense rock equivalent (DRE) measured with the Accupyc 1340 Helium Pycnometer on the same powdered samples (Table 1). Description of the protocol for density and vesicle connectivity measurements is provided in Gurioli et al. (2015), and in the Supplementary Datasheets 1 and 2. The major element composition of the glasses and the mineral phases was characterized using electron probe microanalysis with a CAMECA SX100 system at LMV, using spot sizes between 5 and 20 microns depending on local clast textures.
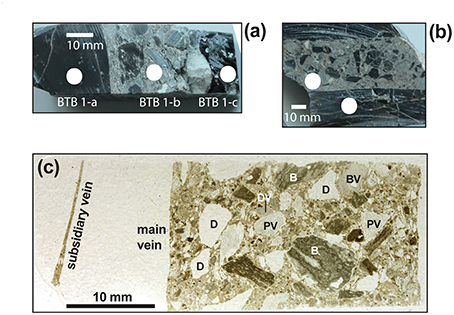
Figure 2. Location of analyses within samples BTB fragment 1 (A) and 2 (B). White dots indicate the location of bulk density and porosity measurements. (C) Scanned image of the analyzed thin section, showing some principal clast types in the main vein (PV, pale vesicular; DV, dark vesicular; BV, borderless vesicular; D, dense; B, banded), and the thinner subsidiary vein.
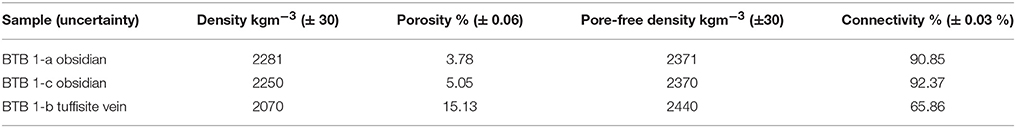
Table 1. Bulk textural parameters for host obsidian and main tuffisite vein (see Figure 2A for measurement locations).
Fourier Transform Infra-Red (FTIR) Spectroscopy
Glass water contents were determined using synchrotron-source infra-red spectroscopy (SFTIR) at the MIRIAM beamline, Diamond Light Source, UK, and globar source infra-red spectroscopy at Lancaster University. The MIRIAM beamline consisted of a Bruker Vertex 80 V FTIR Interferometer, with KBr beamsplitter, coupled to a Hyperion 3000 microscope with a broadband MCT detector and a 10 μm square aperture. Analyses at Lancaster University employed a Thermo Nicolet IR interferometer at Lancaster University, with KBr beamsplitter, coupled to a Continuum Analytical microscope, with an MCT-A detector and 75 μm square aperture. Using the SFTIR system, 128 spectra were collected at 8 cm−1 spectral resolution within the mid-IR range of 4000–1000 cm−1. Using the globar source, 128 spectra were collected at 4 cm−1 resolution between 6000 and 1000 cm−1. Eighteen-point linear baseline corrections were used to quantify absorption peaks at 3550 cm−1 (H2Ot) and 1630 cm−1 (H2Om). These absorption values were next converted to species concentrations using the Beer-Lambert Law, using the measured glass density of 2281 kg m−3 (Table 1). Wafer thicknesses were determined with a Mitutoyo digital micrometer (accuracy of ±3 μm) or reflection fringe widths, depending on sample thickness (von Aulock et al., 2014). Respective absorption coefficients are 80 and 55 l mol−1 cm−1 for the 3550 and 1630 cm−1 peaks (Newman et al., 1986; Leschik et al., 2004). We calculated the uncertainty for our IR data using errors in thickness measurement, uncertainties in absorption coefficient, peak height measurement and sample density, and found the combined uncertainty to be less than 10% for all measurements. Thus, we use 10% as a conservative estimate for all FTIR error, as suggested by previous authors (e.g., von Aulock et al., 2014). Analytical results and details of error quantification are provided in Supplementary Datasheet 3.
2D and 3D Textural Imaging
Quantitative textural analysis was applied to the vein to provide the componentry, morphology, and size distribution of the different clasts within the tuffisites (Figures 2–4) as well as to quantify their internal vesicularity and vesicle size distribution. Overviews of sawn sample surfaces and a thin section (12 images) were gathered using a high-resolution digital scanner (5 and 10 μm pixel size, respectively). Higher resolution 1600 × 1200 pixel images were captured using a scanning electron microscope in backscatter mode on polished sections, with 0.13 μm pixel size at the highest resolution, and using petrological microscopy. Images were collected over a range of magnifications (25–150 ×) to obtain a representative particle size range, and processed used Adobe Photoshop, with grayscale thresholds selected to distinguish between clast types. Clasts were separately reconstructed, with edges hand-drawn. Vesicles were hand-drawn where they overlap in vesicular clasts, but automatically isolated within vesicle-poor clasts, using grayscale thresholds, and then manually reconstructed.
Thresholded grayscale images were analyzed using FOAMS (Shea et al., 2010, 2011). Exploiting the multi-scale functionality of FOAMS, we quantified the number, size and shape of particles (elongation, regularity, eccentricity, and aspect ratio) within the main and subsidiary tuffisite veins (Table 2), as well as the internal 2D vesicle size distributions and number densities. The smallest objects detected were 5 pixels in diameter. Binning for equivalent diameter of clasts and bubbles were calculated from the minimum diameter detected divided by the bin factor (100.1). Prior to using FOAMS, clastic componentry within veins was quantified from overview images using ImageJ. Finally, the widths of vesicular clast dense borders were quantified in Photoshop. To quantify shape difference between clast types, we used two shape parameters calculated with FOAMS: clast elongation and regularity. The elongation comes from the equation ε = (a − b)/(a + b), where a and b are best-fit ellipse semi-long and semi-short axes respectively (Shea et al., 2010). The regularity is calculated from r = A/πab, where A is the clast area, with a perfect circle having a regularity of 1 and an elongation of 0 (Shea et al., 2010).
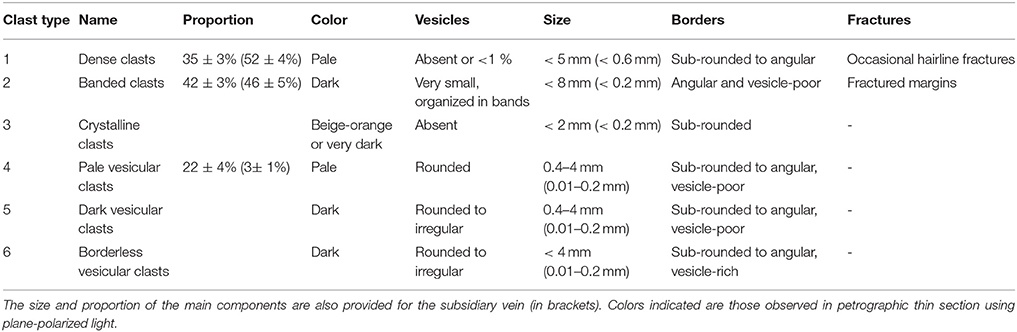
Table 2. Detailed clast classification within the main tuffisite vein.
Overall vein morphology was qualitatively examined in 3D using synchrotron source X-ray microtomography (μ-cT) performed in hutch 3B of the Australian Synchrotron (Clayton, Victoria), using their Ruby detector with X-ray energy of 45 kV. A 3D reconstruction video of the vein is provided (Supplementary Video 1).
Uncertainties and Errors in Textural and Bulk Analyses
Uncertainties related to quantitative textural analysis include user subjectivity, together with sample variability and possible non-representativeness (see discussion in Gurioli et al., 2015). Grayscale thresholding around vesicles and clasts includes intrinsic errors related to threshold position and manual drawing, which are greatest (~10%) for small vesicles and when lower-resolution images are used (e.g., 5 μm rather than 0.13 μm pixel size), and exacerbated by small-scale spatial heterogeneities (Baker et al., 2011). When converting 2-D data to a 3-D projection, however, the error depends on the stereological model used and is thus harder to estimate (i.e., particle shapes have to be assumed, Cashman, 1988). Absolute sampling errors related to non-representativeness were calculated for FOAMS and ImageJ analyses (Table 2) using population-sample size relations (Van der Plas and Tobi, 1965). Error on equivalent diameter of clasts and vesicles is 5%, associated with “misrepresentation of 1 pixel in area” within a particle (Sahagian and Proussevitch, 1998; Shea et al., 2010). Analytical precisions and accuracies are 0.01–0.03 and 0.03 g cm−3 respectively for density determination (Barker et al., 2012), and 0.02 and 0.03 % respectively for connectivity measurements (Formenti and Druitt, 2003).
Results
Clast Classification
Componentry analyses permitted classification of six tuffisite clast categories (Table 2, Figure 3): (A) dense, (B) banded, (C) crystalline, (D) pale vesicular, (E) dark vesicular, and (F) borderless vesicular. For simplicity, these six categories were combined into three main types: dense clasts (A), vesicular clasts (D, E, and F), and banded clasts (B and C). Crystalline clasts are grouped with banded clasts because these could not be differentiated in low-resolution overview images; however, the crystalline clasts comprise <0.5 vol. % of the total vein, and thus make a negligible contribution to population statistics.
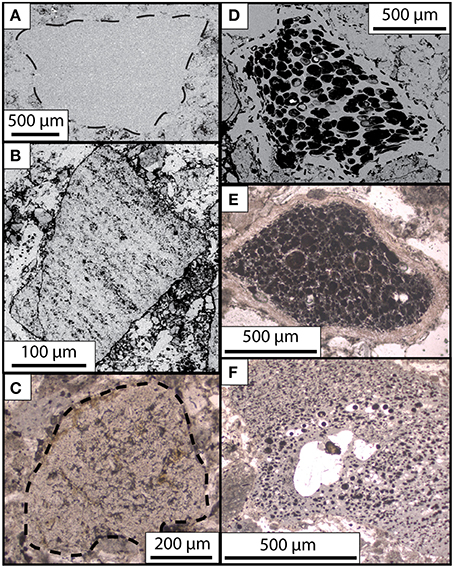
Figure 3. Typical examples of different clast types displayed as optical photomicrographs (in reflected light—A,B,D, and transmitted light—C,E,F). (A) Dense clast with angular form; (B) angular banded clast; (C) sub-rounded crystalline lithic clast; (D) pale vesicular clast with prominent dense margin; (E) dark vesicular clast with prominent dense margin; (F) borderless vesicular clast.
Bulk Rock Textural Parameters
The density of the host obsidian slightly exceeds that of the bulk tuffisite vein (2281 vs. 2070 kgm−3), because of its lower porosity (0.04 vs. 0.15), although the pore-free tuffisite vein density is marginally higher (Table 1). In the analyzed samples, host obsidian void space is far more connected (>90%) than in the tuffisite (66%), being dominated by a high degree of micro-fractures with negligible isolated pores. In contrast, a significant part of the porosity in tuffisite veins is isolated, as vesicular clast interiors are enclosed by continuous dense glass borders. These results reflect the final, quenched state of the bomb, whereas porosity values will have been distinctly different earlier in the tuffisite vein evolution (e.g., prior to particle deposition, and vesiculation and sintering of clasts). The measured characteristics are therefore endmember data.
Clast Shape and Componentry
Clast type proportions were calculated from the weighted average of ImageJ results (Table 2). Componentry in the vein matrix (particles <15 μm) and larger particles appear largely similar, but the former cannot be reliably quantified with the available image resolution. However, the proportions of the three types of clasts were determined from higher-resolution images of the subsidiary vein, and these results, which may provide a reasonable proxy of the main vein matrix (Table 2), reveal a strong decrease in vesicular clast abundance with decreasing clast size. Indeed, vesicular clasts in the main vein are usually >60 μm in diameter, with a very small proportion approaching the lower size limit (20 μm). Within the subsidiary vein the grain size distribution of the different types of components is unimodal, with the dense clasts being the smallest in size. In contrast, within the main vein the distributions are polymodal, because of the additional presence of medium and large clasts, of which the banded clasts are the largest (Figure 4; see Table 2 for clast size nomenclature). Banded clasts are the most abundant (42.2 ± 3%), followed by dense clasts (35.4 ± 2.5%) and vesicular clasts (22.4 ± 4%) within the main vein, whereas the dense clasts are dominant within the subsidiary vein and probably in the matrix as well.
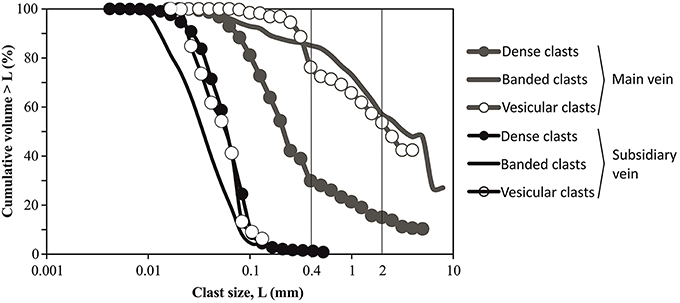
Figure 4. Clast size distributions of the different clast types within the main tuffisite vein and the subsidiary vein. All components are considerably coarser in the main vein than the subsidiary vein.
Vesicular clasts (0.02–5 mm, Figure 4) are the least elongate (≤0.56 elongation; 0.75 for dense and 0.74 for banded clasts), and most regular (≥0.72 regularity, vs. 0.37 and 0.45 for dense and banded clasts, respectively). They are therefore the most circular (≤0.95 eccentricity; 0.99 for other clasts) and morphologically homogeneous clast population. Banded clasts have the greatest size range (0.005–8 mm) and most diverse shapes, whereas dense clasts (0.004–5 mm) have the most irregular borders.
Vesicle and Crystal Textures
Vesicular clasts were divided into pale, dark and borderless categories (Figure 3, Table 2), based both on their color in plane-polarized light and whether they display a bubble-free border. Of the 45 vesicular clasts analyzed, 16 were rejected from quantitative analysis because of their insufficiently large populations of resolvable vesicles (<50 vesicles), leaving 29 clasts (21 pale, 5 dark, and 3 borderless). The host obsidian is texturally similar to dense clasts, containing <2% euhedral millimetric plagioclase crystals often surrounded by hairline fractures. Crystals within the dense clasts are predominantly euhedral, ≤5 mm plagioclase, with minor clinopyroxenes and biotites, consistent with previous mineralogical vein descriptions for juvenile 2008–2009 magma (Castro and Dingwell, 2009).
Pale vesicular clasts have a similar gray color in plane polarized light to the dense obsidian clasts. The margins of vesicular clasts (60 μm-4 mm diameter) are generally vesicle-free, except for borderless clasts and two pale vesicular clasts whose margins bear smaller, more elongated vesicles than their centers. Mean vesicle-free margin widths are 50–75 μm (calculated from 10 to 40 thickness measurements within each of 11 clasts), but reach 110 μm for the largest clasts (~4 mm), whose margin thickness is more spatially variable. In some vesicular clasts, dense borders are only locally well defined (e.g., Figures 5B,C).
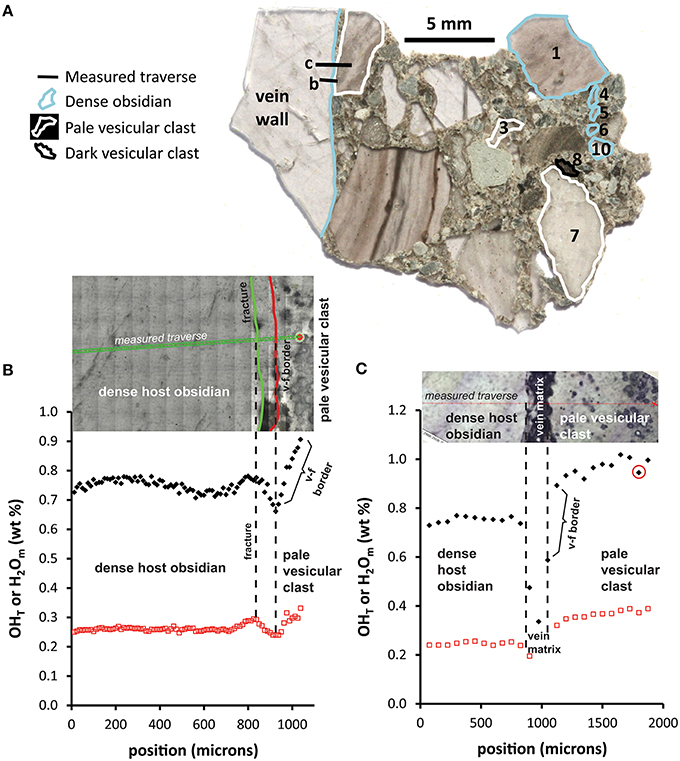
Figure 5. (A) Overview of a large polished wafer (sample BTBcut2A) used in FTIR analysis, indicating the clasts analyzed and the location of the traverses in (B) and (C). (B) Synchrotron FTIR water concentration profile across the junction between the dense obsidian of the vein wall and a pale vesiculation clast, showing strong depletion in the vesicle-free clast border, from >0.9 wt. % to <0.7 wt. % over ~100 microns (sample BTBcut2A). The water-depleted zone corresponds with the vesicle-free zone (indicated). (C) Benchtop FTIR concentration profile from a different part of the same vein wall-pale vesicular clast junction, showing strong depletion into the vein matrix and higher water concentrations of > 1 wt % H2OT toward the clast center. In both cases water speciation is magmatic (high OH−/H2Om ratios, see Supplementary Datasheet 3), and enrichment dominated by OH− increase, indicating diffusion at magmatic temperatures.
Major Element Compositions
Electron probe microanalyses show that dense and vesicular glasses contain 74.6 ± 0.5 wt. % SiO2, with negligible difference between border and core compositions. Banded clasts are heterogeneous, with some glassy bands similar in composition to other clasts (72.3 wt. % ± 5.9 wt. %), whereas other bands are strongly SiO2-enriched (92.8 wt. ± 3.9 wt. %). These SiO2-enriched bands correspond with fractured areas associated with greater crystallinity and porosity, as encountered in the 2011–2012 Cordón Caulle rhyolite lava (Schipper et al., 2015). Other major elements are also heterogeneous in banded clasts, e.g., 6.2–23.2 wt. % Al2O3 and 1.2–8.1 wt. % K2O, even when SiO2-rich bands are excluded. By contrast, dense clasts are far more compositionally homogenous (e.g., 13.7 ± 0.2 wt. % Al2O3 and 3.2 ± 0.3 wt. % K2O). Measured major element concentrations in vesicular clasts are similar to dense clasts, with rather more dispersed values.
Glass H2O Concentrations
Glass H2O concentrations reveal significant heterogeneities within and between clasts (Figure 5, Table 3). The interiors of pale vesicular clasts are significantly more water-rich (0.95 ± 0.05 wt % H2O) than dense obsidian clasts or the vein walls (0.73 ± 0.02 wt %). Low H2Om concentrations for given H2Ot values, consistent with high OH−/H2O ratios, indicate insignificant low-temperature resorption or hydration and total H2O variation appears controlled by variation in OH− concentration rather than H2Om (c.f. Denton et al., 2012; Giachetti and Gonnermann, 2013; McIntosh et al., 2014; Giachetti et al., 2015; see Supplementary Datasheet 3 for speciation data). The high-resolution synchrotron FTIR traverse (Figure 5A) shows a ~100 μm-wide zone of significant H2Ot depletion corresponding to the vesicle-free margin of the clast, consistent with previous data for clasts within Chaitén tuffisites and similarly strong depletion at the dense clast margin (Castro et al., 2012). Additional data for a further five dense clasts and the dense borders of three vesicular clasts (two pale, one dark) are provided in Table 3 and Supplementary Datasheet 3. Notably, the highest H2O values are only intercepted either by the smaller spot size of the synchrotron-source FTIR, or in the unusually wide vesicle-poor border of one vesicular clast (Figures 5B,C).
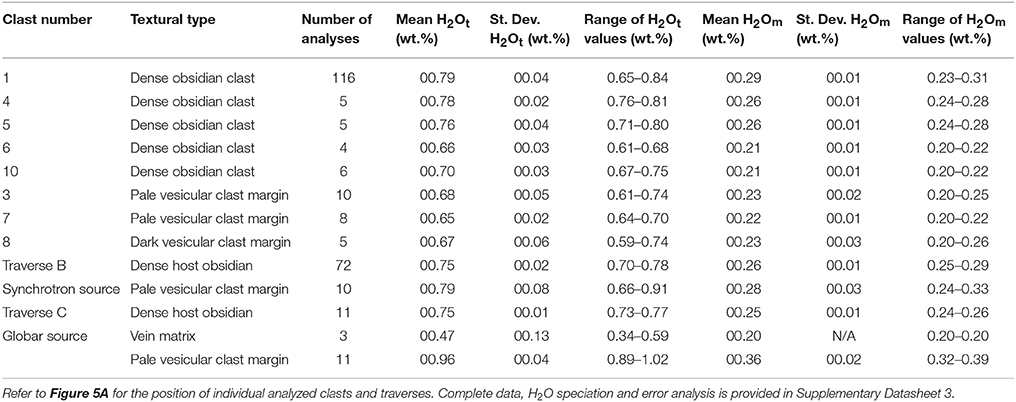
Table 3. Summary of clast H2O concentrations as measured via FTIR.
Vesicle Size Distributions
Vesicle size distributions (VSDs) differ between pale, dark and borderless clasts (Figures 6A–C respectively). In pale clasts, three peaks occur at 25, 50, and 160 μm, whilst two peaks centered at 42 and 67 μm occur in dark clasts and one peak at ~22 μm in borderless clasts. Such contrasting vesicle size distributions reflect differences in the nucleation history of discrete clast types, as described in Sections Vesicular Clast Textural Characteristics—VSD and Three-Step Vesiculation Model. It is noticeable that the peak associated with the largest vesicles only occurs in the pale clasts.
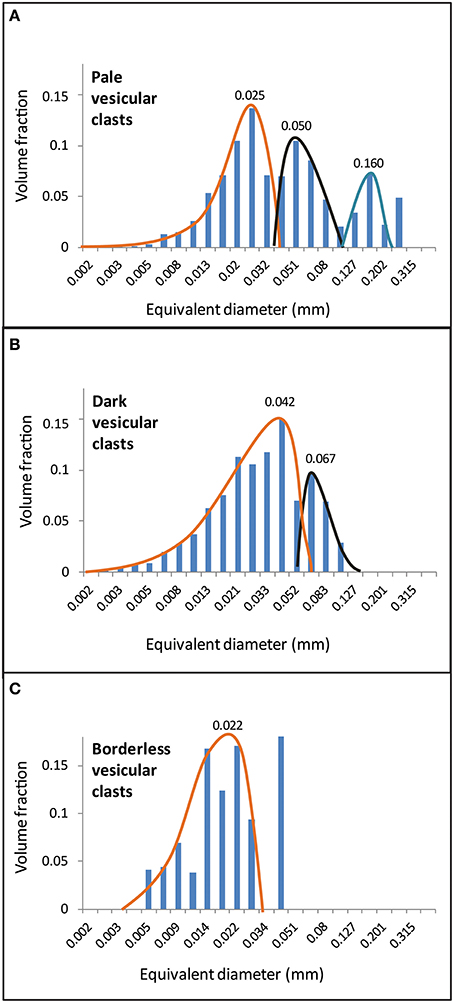
Figure 6. Typical bubble size distributions for each vesicular clast type, as normalized volume fraction. (A) The pale clasts exhibit three distinct peaks centered at 0.025, 0.050, and 0.160 mm, with each parabolic curve corresponding to a bubble subpopulation and a discrete vesiculation event. The last isolated peak on the right results from coalescence. (B) Dark clasts record two vesiculation events, whereas the borderless clasts (C) have evidence of one single vesiculation event with minor coalescence. The largest bubbles, corresponding to the blue curve in (A), relate to the earliest vesiculation event. In all clasts, the negative skew of the orange curve indicates accelerating nucleation and growth in the last vesiculation event. The borderless clast distribution is less smooth because of a smaller total bubble population.
When full VSDs are plotted as ln (n) against equivalent diameter (Figure 7), steeper slopes reflect nucleation dominance, whereas shallower slopes indicate protracted growth (e.g., Shea et al., 2010). Twenty-nine VSD curves, corresponding to individual vesicular clasts, were created (Figure 7A); most can be separated into three segments of distinct slopes (Figure 7B). The slope of each segment was calculated and the average derived for each of the three segments, and plotted on Figure 7C. A simple three-step bubble nucleation-growth model is therefore proposed (Figure 7C), which fits the VSDs of 4 out of 5 dark vesicular clasts, 2 out of 3 borderless vesicular clasts and 9 out of 21 pale vesicular clasts. However, the divergence between the remaining 14 VSDs means that more complex vesiculation histories of individual clasts are both plausible and likely.
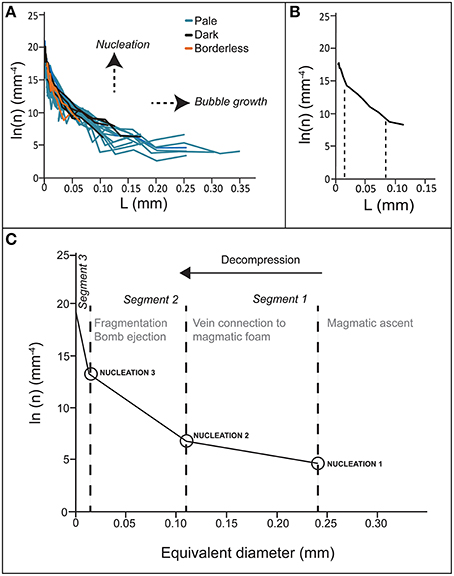
Figure 7. (A) Vesicle size distributions expressed as number n of vesicles within specific size bins present per mm3. Orange curves correspond to borderless clasts, which contain the smallest vesicle population. Black curves represent dark clasts, which contain the two smaller bubble populations, and blue curves correspond to pale clasts. Appearance of smooth pattern is caused by superposition of several-slope curves instead of real smooth curves. (B) A typical example of three-slope VSD pattern, from a dark clast. (C) Model of vesicle population evolution. Final precision on coordinates is ±1 ln(n) and ±0.01 mm in equivalent diameter. Each curve segment represents a single bubble nucleation step.
Bubble number density (BND) is a sensitive decompression rate meter in magmas, although heterogeneous nucleation can influence BND-decompression rate relationships (e.g., Toramaru, 2006; Hamada et al., 2010; Houghton et al., 2010; Shea et al., 2011, 2012; Alfano et al., 2012). BND values are high and broadly similar for all clast types, indicating high decompression rates. Pale vesicular clast BND values of 1012.7–1015 m−3 occur over a range of vesicularities up to 70%. Dark vesicular clast BND values are similar, but over more restricted vesicularities (30–50%), whereas borderless clast BNDs range from 1013.3 to 1014.3 m−3, but vesicularity is strictly <10%.
Discussion
Glass H2O Contents and the Origin of the Different Clast Types
Similar H2O contents at the margins of diverse clast types indicate some local diffusive re-equilibration occurred in these narrow marginal zones (Table 3). However, widely-varying, non-equilibrated H2O concentrations at clast centers (~0.66 to ~1 wt %) indicate sourcing from a broad depth range. The average H2O value for six analyzed dense clasts is 0.74 wt %, very similar to the average H2O content of vein wall obsidian of 0.75 wt %. Using H2O solubility-pressure relations for CO2-free rhyolitic melt at the eruptive temperature of 825 °C (Newman and Lowenstern, 2002; Castro and Dingwell, 2009), vein wall H2O equates to a pressure of 4.6 MPa, corresponding to 210 m depth in a conduit filled with dense vein wall material (2281 kgm−3). This depth estimate is a strict minimum as significantly greater mean porosity is likely in the overlying melt column. The equivalent values for 1 wt % H2O are 8.1 MPa and 360 m depth. Clasts with H2O-rich cores are therefore interpreted to be particles of fragmented, volatile-rich deeper magma that have risen and become trapped within the vein. By contrast, the dense obsidian clasts with similar H2O contents to the host obsidian are likely locally sourced from the vein walls. The clast SiO2 contents broadly coincide with juvenile glass compositions from the 2008–2009 eruption (Amigo et al., 2013; Pallister et al., 2013; 75.3 ± 0.3 wt. % SiO2). Silica-enriched portions of banded clasts are interpreted as zones of local cristobalite precipitation within lava, potentially from an earlier eruptive episode. Banding in these lava clasts probably results from shear deformation (Schipper et al., 2015).
The inferred depth of magma excavation in the vein (≥360 m) likely exceeded the dome height during phase 2, as it only attained 350 m on 30/09/2008, well after Vulcanian activity ceased (Global Volcanism Program, 2008; Bernstein et al., 2013). Therefore banded obsidian is likely non-juvenile material from previous rhyolitic activity within the caldera, which has become entrained into the vein (e.g., Rust et al., 2004). The color difference between pale/borderless and dark clasts may relate to differing nanocrystal populations and/or varying redox conditions (Castro et al., 2009).
Bulk Rock Textural Parameters
The higher porosity-free density of the tuffisite vein (Table 1) compared with the host obsidian reflects the presence of more mafic non-juvenile clasts that are denser than the 2008 rhyolite, whereas higher porosity gives the vein lower overall density than the host. In the host obsidian porosity is dominated by discrete micro-fractures, e.g., offshoots from the main vein and subsidiary veins, which are almost completely connected, despite the very low overall porosity. These micro-fractures, interpreted as damage in the main vein walls as the tuffisite vein opened, are significantly interconnected on the sample scale investigated by the He pycnometer.
Clast and Vesicle Shapes
Shape factors such as regularity, elongation and eccentricity provide useful comparison of clast and vesicle forms (Shea et al., 2010; Moitra et al., 2013), and reveal that vesicular clasts are more rounded than dense clasts (for the main vein: average regularity 0.94 vs. 0.90, elongation 0.27 vs. 0.31, eccentricity 0.78 vs. 0.81). This reflects clast inflation by vesiculation, despite local embayments forming through impingement by denser neighboring clasts (Figure 3D). By contrast, banded and dense clasts have more diverse, angular forms, with some clast margins bearing fractures associated with initial clast formation. Vesicle shapes are mostly near-circular, with coalescence creating some less regular forms (Figure 3D; Moitra et al., 2013). Coalescence has largely failed to create pervasive connected channels or open porosity because of enclosure by dense clast margins.
Vesicular Clast Textural Characteristics—Dense Borders and H2O Diffusion
Significant textural differences exist between vesicular clast types, especially in their borders. Dense border thicknesses are mostly 50–75 μm in near-spherical pale/dark clasts, reaching 110 μm in the largest clasts (~4 mm), and are locally smaller (20–40 μm) in more inhomogeneous clasts. Some highly texturally heterogeneous vesicular clasts only locally display well-developed dense borders (Figure 5). The minimum diameter of vesicular vein clasts (60 μm) is approximately twice the minimum commonly seen dense border thickness, and a small proportion (~5% volumetric fraction) of vesicular clasts are <200 μm in diameter, corresponding to a radius of <100 μm, close to the maximum measured thickness of well-developed dense borders. We therefore infer that size-dependent clast vesiculation was influenced by the same diffusive degassing process that formed the dense clast borders, supported by this coincidence between H2O-depleted zones and vesicle-free textures (Figure 5B).
In order to estimate the timescale of diffusive water loss from vesicular clasts, we have modeled measured H2O concentration gradients using an error function solution to the one-dimensional diffusion equation
where cx is the H2O concentration at distance x from the surface (m), cb is the bulk (far-field) H2O concentration, c0 is the (lower) surface H2O concentration, D is the H2O diffusivity (m2s−1), and t is time (s). H2Om is assumed to be the sole diffusing species, and values of concentration- and temperature-dependent H2O diffusivity in rhyolitic melt are employed, as defined by Zhang (1999). A magmatic temperature of 825°C is assumed (Castro and Dingwell, 2009), with a fixed melt H2O concentration of 1 wt % at the clast center (the highest value measured in this clast; Figure 5C) and 0.66 wt % at the clast margin, as measured. Using these assumed values, the best-fit diffusion time is 2.1 h (Figure 8), but this is a maximum value, as the orientation of the measured traverse with respect to the clast border is unknown. If it were an oblique cut, then the true diffusion zone width may be significantly smaller. For example, if the measured concentration gradient occurred over a spatial scale of 30 μm, the best-time diffusion time would be 12 min.
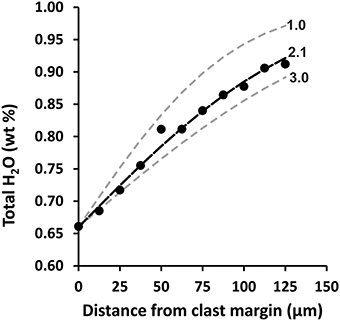
Figure 8. Measured spatial variation in H2O at vesicular clast margin (from Figure 5B traverse), with best fit 1D diffusion model (2.1 h) and model results for 1 and 3 h for comparison. See text for description of model parameters.
As dense border thickness broadly coincides with the zone of diffusive H2O depletion, measured widths of 20–110 μm therefore relate to diffusion timescales of ~10 min to >2 h. However, the zone of suppressed bubble nucleation may not precisely coincide with the width of the diffusively depleted zone, as demonstrated by the unusually heterogeneous vesicular clast analyzed in Figure 5, in which the bubble-poor border width differs greatly (~100 μm to >500 μm) between two measured FTIR traverses at its margin (Figures 5A,B), despite both traverses showing similar depleted zone widths of ~100 μm. This ~10 min to >2 h timescale indicates the total time elapsed from the initial deep fragmentation of the pale vesicular clast, through its residence in the vein, to final bomb quenching.
Vesicular Clast Textural Characteristics—VSD
At a given magmatic temperature, bubble nucleation requires attainment of a critical supersaturation for stable bubble nuclei to persist (e.g., Navon et al., 1998). In a conduit, this can relate to magma decompression driven by ascent, plug slip or edifice failure, as well as an increase in magma temperature (e.g., Sparks, 1978; Alibidirov and Dingwell, 1996; Lensky et al., 2008; Lavallée et al., 2015). The coincidence between dense borders of vesicular clasts and H2O depletion reflects an H2O concentration-dependent nucleation response to a decompression event (Figure 5B; Castro et al., 2012). Only H2O-richer melt zones exceed the supersaturation threshold for bubble nucleation (e.g., Hoblitt and Harmon, 1993; Wright et al., 2007). Therefore, if all clast types experienced a common decompression history with three main decompression events (Figure 7), only the H2O-rich pale vesicular clasts were sufficiently decompression-sensitive to undergo bubble nucleation each time. In the most H2O-poor material (dense clasts and host obsidian) bubbles failed to nucleate, indicating that dense clasts have been “passively” plucked and abraded from vein walls.
Decompression events can trigger bubble nucleation or brittle fragmentation, depending on the decompression rate, magma porosity and volatile concentration (e.g., Spieler et al., 2004; Toramaru, 2006). Individual decompression events can therefore simultaneously induce varied magmatic responses—bubble nucleation, brittle failure, or no response—within different parts of the conduit, and the varied vesiculation histories of tuffisite components documented here reflect such divergent magma response over repeated events. Only one of twenty-nine analyzed clasts displays a smooth ln(n) curve thought to reflect progressively accelerating nucleation and bubble growth (Shea et al., 2010). Other curves comprise a succession of segments separated by breaks in slope. Most of these breaks in slope occur at similar equivalent diameter values, and three segments with similar slopes were identified across a large number of clasts. The average slope value increases from segment 1➔2➔3 (Figure 7C), reflecting increasingly strong bubble nucleation over successive decompression events, and consequently larger pressure drops that culminated in explosive bomb ejection.
Pale vesicular clasts have undergone significantly greater bubble growth than dark or borderless clasts, and higher H2O in clast centers points toward derivation from greater depth in the conduit. The population of larger bubbles may reflect more prolonged bubble growth caused by more protracted ascent from deeper in the conduit, or faster bubble growth related to higher melt diffusivity and lower melt viscosity at higher H2O concentrations (Zhang, 1999; Giordano et al., 2008; Browning et al., in review).
Three-Step Vesiculation Model
Here we integrate textural and volatile data to propose a model of magmatic processes within the Chaitén conduit (Figure 9). The first bubble nucleation event (1) corresponded to magma decompression and foaming at >360 m depth in the conduit (8.1 MPa vapor pressure). Fractures then opened that created a connection with the shallower conduit (~210 m depth, vapor pressure ~4.6 MPa). This opening may have driven fragmentation of deep magmatic foam as it experienced ~3.5 MPa of abrupt decompression, which is sufficient to fragment highly inflated magma (Spieler et al., 2004). Fragments rising into the shallow vein system would have experienced simultaneous decompression-triggered bubble nucleation (2), viscous relaxation, and diffusive degassing from clast and fracture surfaces into the vein. Particles accumulated, blocking the vein, followed by vesiculation and sintering that colluded to compact the fragmented magma and create largely isolated porosity. This created conditions for gas overpressure that led to a final fragmentation event and bomb ejection (3), with accompanying sudden decompression of ~4.5 MPa to atmospheric pressure. This last nucleation step was followed by localized bubble growth during bomb cooling. These three steps are represented in Figure 9, with magmatic processes presented on Figure 7C.
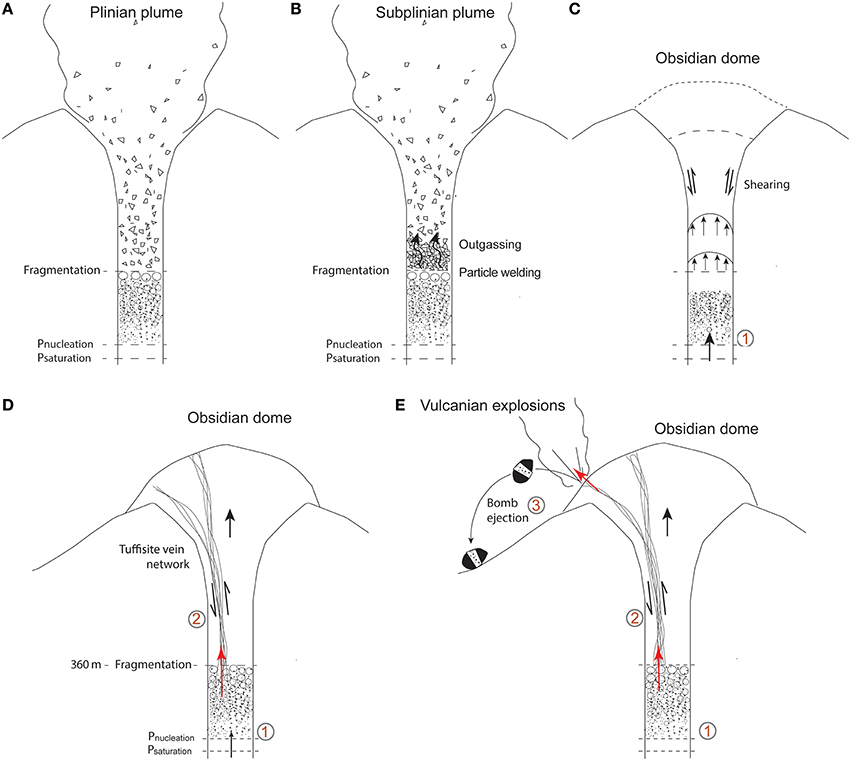
Figure 9. Schematic model of evolving processes in the Chaitén conduit. (A) Initial Plinian eruption, with magmatic foam fragmentation involving a single bubble nucleation step. (B) Progressive particle welding and compaction allow dense plug formation. (C) Magma ascent below the plug still induces a bubble nucleation step (1). The obsidian dome and dense conduit plug is deformed by deeper magma pressure. (D) This leads to plug rupture, with tuffisite veins briefly connecting the deeper and shallower conduit, allowing ascent of deep particles and driving abrupt decompression and bubble nucleation (2). (E) Permeability occlusion drives a final fragmentation event, with bomb ejection and a final decompression-induced nucleation event (3).
The smallest vesicle subpopulation was therefore nucleated during bomb ejection, and the borderless vesicular clasts contain this single bubble population. We attribute intermediate bubble sizes to vesiculation driven by deep magma fragments ascending into the newly-opened vein, and the largest vesicle subpopulation to early, deep degassing prior to vein opening. Vesicle growth timescales following bomb ejection can be estimated from 1 atm vesiculation experiments, and Browning et al. (in review) found growth rates of 0.6 μm s−1 for Chaitén melt with 0.97 wt % H2O. This is appropriate for H2O-rich pale clast centers and will be a slight overestimation for clasts with lower H2O concentrations, or at elevated pressures where the pressure differential driving bubble growth is lower.
The timescale of post-bomb ejection vesicle growth can be roughly estimated from bubble sizes associated with the final nucleation event (20–40 μm) and these experimental bubble growth rates, yielding a minimum time of 0.55–1.1 min for bubble growth. This is significantly shorter than the inferred timescale for earlier diffusive degassing of pale vesicular clasts (~12 min). The dwell time of bordered clasts within the vein prior to final ejection was therefore longer than the final phase of vesicle growth within the bomb (for which realistic quenching times are minutes-tens of minutes, depending upon the exact position within the bomb). In contrast, borderless clasts could have experienced a shorter residence time within the vein, preventing significant diffusive degassing prior to the final vesiculation event.
Magnitudes and Rates of Decompression
As BND values allow estimation of decompression rates in explosive eruptions (e.g., Toramaru, 2006), we compare our results with fast decompression experiments on pure rhyolitic melt (Hamada et al., 2010). The measured BND of vesicular clasts span 1012.7–1015 m−3, which corresponds with the range of BND values in experimental samples decompressed at ~1–10 MPa/s at 800°C. This provides an estimate of the magma decompression rate, although it is an upper estimate, as any heterogeneous nucleation would generate a given BND value at lower decompression rates. Estimated decompression events are 3.5 MPa (upon vein opening from 8.1➔4.6 MPa), and 4.5 MPa (on bomb ejection, from 4.6 MPa saturation pressure to 0.1 MPa). Therefore decompression times were <1–4 s, and thus, ignoring gas compressibility, particle velocities (from 360 m➔210 m depth in the conduit, and 210 m depth to the surface) of the order of tens to >100 ms−1. Such values are plausible, being in broad accordance with observations of the longevity of Vulcanian explosions (seconds) and bomb ejection velocities (~100 ms−1) during similar transitional rhyolitic activity at Cordón Caulle in January 2012 (Schipper et al., 2013). These results also match estimated gas rise velocities of 50 ms−1 within fracture networks in the shallow conduit at the dacitic Santiaguito lava dome, Guatemala (Johnson et al., 2014) and an estimate of the gas velocity in a different tuffisite vein from Chaitén of at least meters per second (Berlo et al., 2013).
Comparison with the First Stage of Chaitén Eruption
The vesicle textures described here, from the transitional phase 2 of the Chaitén 2008 eruption, contrast with those from pyroclasts ejected in the initial sub-Plinian phase 1 (Alfano et al., 2012). The latter clasts have a higher mean vesicularity (69%), unimodal VSD profile with peak at 50–80 μm, and BND of 1.3 × 10¹⁴ m−3. Phase 1 therefore involved a single, rapid homogeneous nucleation event within water-saturated magma during ascent from >5 km depth, whereas up to three vesiculation steps are recorded in phase 2 magma. BND values indicate broadly similar decompression rates (~1–10 MPa/s), which are lower in some phase 2 clasts. Clasts ejected during phase 1 were predominantly non-juvenile fragments (80%), alongside juvenile obsidian fragments (10%) and pumices (10%; Alfano et al., 2011, 2012). Similar particle types occur within phase 2 tuffisite veins, in which the non-juvenile proportion is still large (42%), but with dense obsidian and vesicular glassy fragments more dominant in this phase (35 and 23%). Dissolved H2O concentrations decreased from 1.3 to 2.3 wt. % in phase 1 to ~0.6–1 wt % in phase 2, reflecting shoaling of the magma fragmentation depth during progressive magma stalling and dense plug formation. As the eruption progressed from phase 1 to phase 2, the rapidly-healing plug of dense magma acted as an increasingly effective trap for particles of deeper fragmented magma, despite briefly permitting escape of batches of exsolved gas. By contrast, in phase 1 the entire conduit effectively acted as a single, open tuffisite vein that provided an uninhibited path for delivery of magmatic fragments and gases to the surface. Trapping of particles allowed individual bodies of magma to experience multiple degassing events in phase 2, with the superimposed effect of facilitating efficient outgassing from the deeper conduit via periodically-blocked tuffisite vein networks. Interactions between veins and variably foamed magma domains (Figure 7) boosted the outgassing efficiency, which ultimately drove the complete transition from explosive (phase 1) to effusive (phase 3) activity.
Broader Implications for Shallow Conduit Processes
The data presented in this paper provide new constraints on fluid and pyroclast transport through tuffisite veins, which controls the episodic, explosive gas-magma separation that characterizes transitional rhyolite eruptions (Schipper et al., 2013; Castro et al., 2014). We infer that pressure changes related to vein opening triggered either fragmentation or vesiculation of neighboring magma, depending upon the rate and amount of decompression, and the porosity-controlled fragmentation threshold (Spieler et al., 2004). Magma porosity within the shallow conduit was heterogeneous over short spatial scales, resulting from the integrated effects of strain localization and trapping of volatile-rich deeper magma fragments within tuffisite veins (Schipper et al., 2013; Castro et al., 2014; Cassidy et al., 2015). As a result, individual decompression events could simultaneously elicit fragmentation and vesiculation responses in jutxaposed, decimeter to meter-scale magma domains, with preferential “quarrying” of vesicular domains promoting release of batches of exsolved gas, and boosting the efficiency of gas-magma separation (Castro et al., 2012, 2014). Our inference that individual magma batches can experience multiple vesiculation and fragmentation events, which act to progressively extract exsolved magmatic gas in multiple steps, contrasts with existing models of Vulcanian eruptions in which ejected plug material is sequentially replaced by a fresh batch of low-vesicularity magma (Clarke et al., 2002). At Chaitén magma was neither fully replaced nor homogenized, allowing the textural and degassing signature of earlier decompression events to dictate subsequent magmatic responses.
Models of gas mobility within shallow silicic conduits require estimates of permeability and pressure gradients (e.g., Clarke et al., 2002; Collinson and Neuberg, 2012), which may be time-variant. Our results provide constraints on the evolving gas pressure within one tuffisite vein. However, the permeability will have drastically changed between high values in the initially-open vein to lower values upon clogging by clastic particles, to still lower values as particle sintering destroyed pore space (Heap et al., 2015), aided by partial vesiculation of some clasts. The rate of sintering-driven tuffisite compaction is strongly dependent on the particle size (Vasseur et al., 2013), and as our results reveal significant spatial variations in particle size distribution within a tuffisite vein, defining an appropriate rate of sintering for the entire vein system is far from straightforward, and requires modeling of polydisperse particle populations (Wadsworth et al., 2014). Timescales of compaction and permeability destruction are additionally influenced by strain, which can be highly localized within ascending magma. The range and scale of textures observed in the sampled vein is also controlled by the size of the vein itself, and a linear upscaling of these features is unlikely to yield a comprehensive description of the entire shallow conduit. Adequately accounting for evolving shallow conduit permeability and pressure will therefore require observations across a broad population of glassy and pumiceous tuffisite bombs, ideally coupled to direct observation and sampling of these bombs (as erupted) in the field.
As the parameters that most strongly influence the magnitude and duration of gas flux evolve markedly during tuffisite vein formation, quantification of the permeability and volatile concentration heterogeneities within quenched glassy tuffisite veins may not be the most robust method for determining time-averaged fluxes. Direct measurement of exsolved gas fluxes and ejected particle velocities during silicic eruptions, combined with petrological characterization (Cassidy et al., 2015), and investigation of trace metal and short-lived radionuclides within tuffisites (Berlo et al., 2013) may be better approaches. The glassy tuffisite veins, however, provide rich textural and volatile records that belie a multi-scale evolutionary complexity that cannot be ignored in the description of silicic conduits that are in transitional explosive-effusive activity.
Conclusions
Our study of a bomb-hosted rhyolitic tuffisite vein ejected from Chaitén in 2008 provides new insights into the enigmatic mechanisms of gas-magma separation that control silicic eruption dynamics. Vein-filling clasts are magma fragments that ascended transient fracture networks cutting the shallow conduit during transitional explosive-effusive activity. Diverse clast textures indicate that multiple phases of magma fragmentation and vesiculation occurred beneath and within a dense lava plug. Varied clast water concentrations indicate that fracture networks were vertically extensive, with clasts derived from a wide range of depths within the conduit.
We envisage that three vesiculation steps occurred, progressing toward a final Vulcanian bomb-ejecting explosion. First, magma decompression within the deep conduit (~360 m), triggered an early bubble nucleation event. Vein opening then connected the shallow conduit (~210 m) to deeper magma (~360 m), triggering decompression of deep-derived melt fragments as they rose within the vein. These volatile-rich clasts diffusively lost H2O into the vein, creating relatively degassed, dense selvages tens of microns in thickness. Blockage of the vein by vesiculating, sintering clasts may have then drastically reduced its permeability, allowing an increase in gas pressure. Pressurization ultimately triggered bomb ejection from a depth of ~210 m in a Vulcanian explosion. This induced decompression of ~4.5 MPa and a final bubble nucleation event in the deep-derived magma clasts, but not the degassed clast selvages or shallower vein host magma. An H2O diffusion gradient at a vesicular clast margin indicates that up to ~2 h elapsed between the initial fragmentation and ascent of deeper magma within the vein, and the final quenching of the ejected bomb. Bubble number densities of 1012.7–1015 m−3 indicate decompression rates of ~1–10 MPa s−1, implying decompression timescales of ~seconds and so particle velocities of tens to 100 ms−1 occur in the tuffisite vein system.
Together, our results provide a uniquely detailed reconstruction of degassing processes within a shallow silicic conduit. Repeated, abrupt pressure changes involved the opening of vertically pervasive tuffisite vein systems, whose permeable lifespan was then severely limited by the accumulation and rapid sintering of clasts. The contrast with the simpler vesiculation history of clasts from the initial purely explosive phase reflects the formation of a dense magma plug during transitional activity. This plug trapped ascending clasts, introducing considerable textural heterogeneity, and allowed multiple decompression events to effectively outgas magma. Accounting for such extreme spatial and temporal variations in upper conduit permeability will constitute a key challenge for the next generation of eruption models.
Author Contributions
The study was devised by ES, HT, and LG. Sample collection was carried out by HT, JC, and CS. ES and LG carried out imaging, textural analysis, and compositional analysis. HT led H2O analysis, assisted by JO, JC, KB, EM, and KW. All authors contributed to model development and interpretations. Manuscript preparation was led by ES and HT, with contributions from all other authors, and figures drafted by ES and HT.
Conflict of Interest Statement
The authors declare that the research was conducted in the absence of any commercial or financial relationships that could be construed as a potential conflict of interest.
Acknowledgments
We thank Diamond Light Source for access to the MIRIAM beamline B22 (proposal number SM9926) that contributed to the results presented here, Jacob Lowenstern and Valerio Acocella for constructive editorial contributions, and reviewers Kenneth Befus and Luca Caricchi, whose comments greatly improved the manuscript. HT and JO were supported by a Royal Society University Research Fellowship and an AXA Post-doctoral Fellowship respectively. EM was supported by a NERC PhD studentship. KB was supported by the European Research Council under the European Union's Seventh Framework Program (FP/2007-2013), ERC grant agreement number 307356. JC was supported by the VAMOS Research Centre. CS was supported by Victoria University. Australian synchrotron access was granted under proposal 2015/1-M9095 and supported by the New Zealand Synchrotron Group. We thank Nicolas la Penna and Fabian Wadsworth for assistance in the field. This research was financed by the French Government Laboratory of Excellence initiative no ANR-10-LABX-0006, the Région Auvergne and the European Regional Development Fund. This is Laboratory of Excellence ClerVolc contribution number 202.
Supplementary Material
The Supplementary Material for this article can be found online at: https://www.frontiersin.org/article/10.3389/feart.2016.00059
References
Alfano, F., Bonadonna, C., and Gurioli, L. (2012). Insights into eruption dynamics from textural analysis: the case of the May, 2008, Chaitén eruption. Bull. Volcanol. 74, 2095–2108. doi: 10.1007/s00445-012-0648-3
Alfano, F., Bonadonna, C., Volentik, A. C. M., Connor, C. B., Watt, S. F. L., Pyle, D. M., et al. (2011). Tephra stratigraphy and eruptive volume of the May, 2008, Chaitén eruption, Chile. Bull. Volcanol. 73, 613–630. doi: 10.1007/s00445-010-0428-x
Alibidirov, M. A., and Dingwell, D. B. (1996). Magma fragmentation by rapid decompression. Nature 380, 146–148. doi: 10.1038/380146a0
Amigo, A., Lara, L. E., and Smith, V. C. (2013). Holocene record of large explosive eruptions from Chaitén and Michinmahuida Volcanoes, Chile. Andean Geol. 40, 227–248. doi: 10.5027/andgeov40n2-a03
Baker, D. R., Polacci, M., and LaRue, A. (2011). A study on the reproducibility of counting vesicles in volcanic rocks. Geosphere 7, 70–78. doi: 10.1130/GES00553.1
Barker, S., Rotella, M., Wilson, C., Wright, I., and Wysoczanski, R. (2012). Contrasting pyroclast density spectra from subaerial and submarine silicic eruptions in the Kermadec arc: implications for eruption processes and dredge sampling. Bull. Volcanol. 74, 1425–1443. doi: 10.1007/s00445-012-0604-2
Berlo, K., Tuffen, H., Smith, V., Castro, J. M., Pyle, D. M., Mather, T. A., et al. (2013). Element variations in rhyolitic magma resulting from gas transport. Geochim. Cosmochim. Acta 121, 436–451. doi: 10.1016/j.gca.2013.07.032
Bernstein, M., Pavez, A., Varley, N., Whelley, P., and Calder, E. S. (2013). Rhyolite lava dome growth styles at Chaitén Volcano, Chile (2008-2009): Interpretation of thermal imagery. Andean Geol. 40, 295–309. doi: 10.5027/andgeoV40n2-a07
Bertin, D., Lara, L. E., Basualto, D., Amigo, Á., Cardona, C., Franco, L., et al. (2015). High effusion rates of the Cordón Caulle 2011–2012 eruption (Southern Andes) and their relation with the quasi-harmonic tremor. Geophys. Res. Lett., 42, 7054–7063. doi: 10.1002/2015GL064624
Bonadonna, C., Cioni, R., Pistolesi, M., Elissondo, M., and Baumann, V. (2015). Sedimentation of long-lasting wind-affected volcanic plumes: the example of the 2011 rhyolitic Cordón Caulle eruption, Chile. Bull. Volcanol. 77:13. doi: 10.1007/s00445-015-0900-8. Available online at: http://link.springer.com/article/10.1007%2Fs00445-015-0900-8
Cabrera, A., Weinberg, R. F., Wright, H. M. N., Zlotnik, S., and Cas, R. A. F. (2011). Melt fracturing and healing: a mechanism for degassing and origin of silicic obsidian. Geology 39, 4. doi: 10.1130/G31355.1
Cashman, K. V. (1988). Crystallization of Mount St. Helens 1980–1986 dacite: a quantitative textural approach. Bull. Volcanol. 50, 194– 209. doi: 10.1007/BF01079682
Cassidy, M., Cole, P. D., Hicks, K. E., Varley, N. R., Peters, N., and Lerner, A. H. (2015). Rapid and slow: varying magma ascent rates as a mechanism for Vulcanian explosions. Earth Planet. Sci. Lett. 420, 73–84. doi: 10.1016/j.epsl.2015.03.025
Castro, J. M., Bindeman, I. N., Tuffen, H., and Ian Schipper, C. (2014). Explosive origin of silicic lava: textural and –H2O evidence for pyroclastic degassing during rhyolite effusion. Earth Planet. Sci. Lett. 405, 52–61. doi: 10.1016/j.epsl.2014.08.012
Castro, J. M., Cordonnier, B., Tuffen, H., Tobin, M. J., Puskar, L., Martin, M. C., et al. (2012). The role of melt-fracture degassing in defusing explosive rhyolite eruptions at volcán Chaitén. Earth Planet. Sci. Lett. 333–334, 63–69. doi: 10.1016/j.epsl.2012.04.024
Castro, J. M., Cottrell, E., Tuffen, H., and Kelley, K. (2009). Spherulite crystallization buffers Fe-oxidation in silicic melt. Chem. Geol. 268, 272–280. doi: 10.1016/j.chemgeo.2009.09.006
Castro, J. M., and Dingwell, D. B. (2009). Rapid ascent of rhyolitic magma at Chaitén volcano, Chile. Nature 461, 780–783. doi: 10.1038/nature08458
Clarke, A. B., Voight, B., Neri, A., and Macedonio, G. (2002). Transient dynamics of Vulcanian explosions and column collapse. Nature 415, 897–901. doi: 10.1038/415897a
Collinson, A. S. D., and Neuberg, J. W. (2012). Gas storage, transport and pressure changes in an evolving permeable volcanic edifice. J. Volcanol. Geotherm. Res. 243–244, 1–13. doi: 10.1016/j.jvolgeores.2012.06.027
Denton, J. S., Tuffen, H., and Gilbert, J. S. (2012). Variations in hydration within perlitised rhyolitic lavas—evidence from Torfajökull, Iceland. J. Volcanol. Geotherm. Res. 223–224, 64–73. doi: 10.1016/j.jvolgeores.2012.02.005
Eichelberger, J. C., Carrigan, C. R., Westrich, H. R., and Price, R. H. (1986). Non-explosive silicic volcanism. Nature 323, 598–602. doi: 10.1038/323598a0
Formenti, Y., and Druitt, T. H. (2003). Vesicle connectivity in pyroclasts and implications for the fluidisation of fountain-collapse pyroclastic flows, Montserrat (West Indies). Earth Planet. Sci. Lett. 214, 561–574. doi: 10.1016/S0012-821X(03)00386-8
Giachetti, T., Gonnermann, H. M., Gardner, J. E., Shea, T., and Gouldstone, A. (2015). Discriminating secondary from primary water in rhyolitic matrix-glass of volcanic pyroclasts using thermogravimetric analysis. Geochim. Cosmochim. Acta. 148, 457–476. doi: 10.1016/j.gca.2014.10.017
Giachetti, T., and Gonnermann, H. M. (2013). Water in pumices: rehydration or incomplete degassing? Earth Planet. Sci. Lett. 369–370, 317–332. doi: 10.1016/j.epsl.2013.03.041
Giachetti, T., Burgisser, A., Arbaret, L., Druitt, T. H., and Kelfoun, K. (2011). Quantitative textural analysis of Vulcanian pyroclasts (Montserrat) using multi-scale X-ray computed microtomography: comparison with results from 2D image analysis. Bull. Volcanol. 73, 1295–1309. doi: 10.1007/s00445-011-0472-1
Giordano, D., Russel, J. K., and Dingwell, D. B. (2008). Viscosity of magmatic liquids: a model. Earth Planet. Sci. Lett. 271, 123–134. doi: 10.1016/j.epsl.2008.03.038
Global Volcanism Program. (2008). “Report on Chaitén (Chile),” in Weekly Volcanic Activity Report, 10 December-16 December 2008, ed S. K. Sennert (Washington, DC: Smithsonian Institution and US Geological Survey). Available online at: http://volcano.si.edu/showreport.cfm?doi=GVP.WVAR20081210-358041
Gonnermann, H. M., and Manga, M. (2003). Explosive volcanism may not be an inevitable consequence of magma fragmentation. Nature 426, 432–435. doi: 10.1038/nature02138
Gonnerman, H. M., and Manga, M. (2007). The fluid mechanics inside a volcano. Ann. Rev. Fluid Mech. 39, 321–356. doi: 10.1146/annurev.fluid.39.050905.110207
Goto, A. (1998). A new model for volcanic earthquake at Unzen volcano: melt rupture model. Geophys. Res. Lett. 26, 2541–2544. doi: 10.1029/1999GL900569
Gurioli, L., Andronico, D., Bachelery, P., Balcone-Boissard, H., Battaglia, J., Boudon, G., et al. (2015). MeMoVolc consensual document: a review of cross-disciplinary approaches to characterizing small explosive magmatic eruptions. Bull. Volcanol. 77, 1–33. doi: 10.1007/s00445-015-0935-x
Hamada, M., Laporte, D., Cluzel, N., Koga, K. T., and Kawamoto, T. (2010). Simulating bubble number density of rhyolitic pumices from Plinian eruptions: constraints from fast decompression experiments. Bull. Volcanol. 72, 735–746. doi: 10.1007/s00445-010-0353-z
Heap, M. J., Farquharson, J. I., Wadsworth, F. B., Kolzenburg, S., and Russell, J. K. (2015). Timescales for permeability reduction and strength recovery in densifying magma. Earth Planet. Sci. Lett. 429, 223–233. doi: 10.1016/j.epsl.2015.07.053
Heiken, G., Wohletz, K., and Eichelberger, J. C. (1988). Fracture filling and intrusive pyroclasts, Inyo domes, California. J. Geophys. Res. 93, 4335–4350. doi: 10.1029/JB093iB05p04335
Hoblitt, R. P., and Harmon, R. S. (1993). Bimodal distribution of cryptodome dacite from the 1980 eruption of Mount St. Helens, Washington. Bull. Volcanol. 55, 421–437. doi: 10.1007/BF00302002
Holland, A. S. P., Watson, I. M., Phillips, J. C., Caricchi, L., and Dalton, M. P. (2011). Degassing processes during lava dome growth: Insights from Santiaguito lava dome, Guatemala. J. Volcanol. Geotherm. Res. 202, 153–166. doi: 10.1016/j.jvolgeores.2011.02.004
Houghton, B. F., Carey, R., Cashman, K., Wilson, C., Hobden, B., and Hammer, J. (2010). Diverse patterns of ascent, degassing, and eruption of rhyolite magma during the 1.8 ka Taupo eruption. New Zealand: evidence from clast vesicularity. J. Volcanol. Geotherm. Res. 195, 31–47. doi: 10.1016/j.jvolgeores.2010.06.002
Houghton, B. F., and Wilson, C. J. L. (1989). A vesicularity index for pyroclastic deposits. Bull. Volcanol. 51, 451–462. doi: 10.1007/BF01078811
Johnson, J. B., Lyons, J. J., Andrews, B. J., and Lees, J. M. (2014). Explosive dome eruptions modulated by periodic gas-driven inflation. Geophys. Res. Lett. 41, 6689–6697. doi: 10.1002/2014GL061310
Lavallée, Y., Dingwell, D. B., Johnson, J. B., Cimarelli, C., Hornby, A. J., Kendrick, J. E., et al. (2015). Thermal vesiculation during volcanic eruptions. Nature 528, 544–547. doi: 10.1038/nature16153
Lensky, N. G., Sparks, R. S. J., Navon, O., and Lyakhovsky, V. (2008). Cyclic activity at Soufrière Hills Volcano, Montserrat: degassing-induced pressurization and stick-slip extrusion. Spec. Pub. Geol. Soc. Lond. 307, 169–188. doi: 10.1144/SP307.10
Leschik, M., Behrens, H., Wiedenbeck, M., Wagner, N., Heide, K., Geissler, H., et al. (2004). Determination of H2O and D2O contents in rhyolitic glasses using KFT, NRA, EGA, IR spectroscopy, and SIMS. Phys. Chem. Glasses 45, 238–251. Available online at: http://www.ingentaconnect.com/content/sgt/pcg/2004/00000045/00000004/art00003
McIntosh, I. M., Llewellin, E. W., Humphreys, M. C. S., Nichols, A. R. L., Burgisser, A., Schipper, C. I., et al. (2014). Distribution of dissolved water in magmatic glass records growth and resorption of bubbles. Earth Planet. Sci. Lett. 401, 1–11. doi: 10.1016/j.epsl.2014.05.037
Moitra, P., Gonnermann, H. M., Houghton, B. F., and Giachetti, T. (2013). Relating vesicle shapes in pyroclasts to eruption styles. Bull. Volcanol. 75, 1–14. doi: 10.1007/s00445-013-0691-8
Navon, O., Chekhmir, A., and Lyakhovsky, V. (1998). Bubble growth in highly viscous melts: theory, experiments, and autoexplosity of dome lavas. Earth Planet. Sci. Lett. 160, 763–776. doi: 10.1016/S0012-821X(98)00126-5
Neuberg, J. W., Tuffen, H., Collier, L., Green, D., Powell, T., and Dingwell, D. (2006). The trigger mechanism of low-frequency earthquakes on Montserrat. J. Volcanol. Geotherm. Res. 153, 37–50. doi: 10.1016/j.jvolgeores.2005.08.008
Newman, S., Epstein, S., and Stolper, E. (1988). Water, carbon dioxide, and hydrogen isotopes in glasses from the ca. 1340 A.D. eruption of the Mono Craters, California: constraints on degassing phenomena and initial volatile content. J. Volcanol. Geotherm. Res. 35, 75–96. doi: 10.1016/0377-0273(88)90007-8
Newman, S., and Lowenstern, J. B. (2002). VolatileCalc: a silicate melt–H2O–CO2 solution model written in Visual Basic for Excel. Comp. Geosci. 28, 597–604. doi: 10.1016/S0098-3004(01)00081-4
Newman, S., Stolper, E. M., and Epstein, S. (1986). Measurement of water in rhyolitic glasses: calibration of an infrared spectroscopic technique. Am. Mineral. 71, 1527–1541.
Okumura, S., Nakamura, M., Nakano, T., Uesugi, K., and Tsuchiyama, A. (2010). Shear deformation experiments on vesicular rhyolite: implications for brittle fracturing, degassing, and compaction of magmas in volcanic conduits. J. Geophys. Res. 115:B0620. doi: 10.1029/2009jb006904. Available online at: http://onlinelibrary.wiley.com/doi/10.1029/2009JB006904/full
Pallister, J. S., Diefenbach, A. K., Burton, W. C., Muñoz, J., Griswold, J. P., Lara, L. E., et al. (2013). The Chaitén rhyolite lava dome: eruption sequence, lava dome volumes, rapid effusion rates and source of the rhyolite magma. Andean Geol. 40, 277–294. doi: 10.5027/andgeoV40n2-a06
Rust, A., and Cashman, K. (2011). Permeability controls on expansion and size distributions of pyroclasts. J. Geophys. Res. 116:B11202. doi: 10.1029/2011jb008494. Available online at: http://onlinelibrary.wiley.com/doi/10.1029/2011JB008494/full
Rust, A. C., and Cashman, K. (2007). Multiple origins of obsidian pyroclasts and implications for changes in the dynamics of the 1300 B.P eruption of Newberry volcano, USA. Bull. Volcanol. 69, 825–845. doi: 10.1007/s00445-006-0111-4
Rust, A. C., Cashman, K., and Wallace, P. (2004). Magma degassing buffered by vapour flow through brecciated conduit margins. Geology 32, 349–352. doi: 10.1130/G20388.2
Sahagian, D. L., and Proussevitch, A. A. (1998). 3D particle size distributions from 2D observations: stereology for natural applications. J. Volcanol. Geother. Res. 84 173–196. doi: 10.1016/s0377-0273(98)00043-2
Schipper, C. I., Castro, J. M., Tuffen, H., James, M. R., and How, P. (2013). Shallow vent architecture during hybrid explosive–effusive activity at Cordón Caulle (Chile, 2011–12): evidence from direct observations and pyroclast textures. J. Volcanol. Geotherm. Res. 262, 25–37. doi: 10.1016/j.jvolgeores.2013.06.005
Schipper, C. I., Castro, J. M., Tuffen, H., Wadsworth, F. B., Chappell, D., Pantoja, A. E., et al. (2015). Cristobalite in the 2011–2012 Cordón Caulle eruption (Chile). Bull. Volcanol. 77, 34. doi: 10.1007/s00445-015-0925-z
Shea, T., Gurioli, L., and Houghton, B. F. (2012). Transitions between fall phases and pyroclastic density currents during the AD 79 eruption at Vesuvius: building a transient conduit model from the textural and volatile record. Bull. Volcanol. 74, 2363–2381. doi: 10.1007/s00445-012-0668-z
Shea, T., Gurioli, L., Cashman, K., and Cioni, R. (2011). Column collapse and generation of pyroclastic density currents during the A.D. 79 eruption of Vesuvius: the role of pyroclast density. Geology 39, 695–698. doi: 10.1130/G32092.1
Shea, T., Houghton, B. F., Gurioli, L., Cashman, K. V., Hammer, J. E., and Hobden, B. J. (2010). Textural studies of vesicles in volcanic rocks: an integrated methodology. J. Volcanol. Geotherm. Res. 190, 271–289. doi: 10.1016/j.jvolgeores.2009.12.003
Sparks, R. S. J. (1978). The dynamics of bubble formation and growth in magmas: a review and analysis. J. Volcanol. Geotherm. Res. 3, 1–37. doi: 10.1016/0377-0273(78)90002-1
Spieler, O., Dingwell, D. B., and Alidibirov, M. (2004). Magma Fragmentation Speed: an experimental determination. J. Volcanol. Geotherm. Res. 129, 109–112. doi: 10.1016/S0377-0273(03)00235-X
Stasiuk, M. V., Barclay, J., Carroll, M. R., Jaupart, C., Ratté, J. C., Sparks, R. S. J., et al. (1996). Degassing during magma ascent in the Mule Creek vent (USA). Bull. Volcanol. 58, 117–130. doi: 10.1007/s004450050130
Takeuchi, S., Nakashima, S., and Akihiko Tomiya, A. (2008). Permeability measurements of natural and experimental volcanic materials with a simple permeameter: toward an understanding of magmatic degassing processes. J. Volcanol. Geotherm. Res. 177, 329–339. doi: 10.1016/j.jvolgeores.2008.05.010
Toramaru, A. (2006). BND (bubble number density) decompression rate meter for explosive volcanic eruptions. J. Volcanol. Geotherm. Res. 154, 303–316. doi: 10.1016/j.jvolgeores.2006.03.027
Tuffen, H., and Dingwell, D. (2005). Fault textures in volcanic conduits: evidence for seismic trigger mechanisms during silicic eruptions. Bull. Volcanol. 67, 370–387. doi: 10.1007/s00445-004-0383-5
Tuffen, H., Dingwell, D. B., and Pinkerton, H. (2003). Repeated fracture and healing of silicic magma generate flow banding and earthquakes? Geology 31, 1089–1092. doi: 10.1130/G19777.1
Van der Plas, L., and Tobi, A. (1965). A chart for judging the reliability of point counting results. Am. J. Sci. 263, 87–90. doi: 10.2475/ajs.263.1.87
Vasseur, J., Wadsworth, F. B., Lavallée, Y., Hess, K.-U., and Dingwell, D. B. (2013). Volcanic sintering: timescales of viscous densification and strength recovery. Geophys. Res. Lett. 40, 5658–5664. doi: 10.1002/2013GL058105
von Aulock, F. W., Kennedy, B. M., Schipper, C. I., Castro, J. M., Martin, D. E., Oze, C., et al. (2014). Advances in Fourier transform infrared spectroscopy of natural glasses: from sample preparation to data analysis. Lithos 206–207, 52–64. doi: 10.1016/j.lithos.2014.07.017
Wadsworth, F. B., Vasseur, J., von Aulock, F. W., Hess, K.-U., Scheu, B., Lavallée, Y., et al. (2014). Nonisothermal viscous sintering of volcanic ash. J. Geophys. Res. 119, 8792–8804. doi: 10.1002/2014JB011453
Wicks, C., de la Llera, J. C., Lara, L. E., and Lowenstern, J. (2011). The role of dyking and fault control in the rapid onset of eruption at Chaitén volcano, Chile. Nature 478, 374–377. doi: 10.1038/nature10541
Wright, H. M. N., Cashman, K. V., Rosi, M., and Cioni, R. (2007). Breadcrust bombs as indicators of Vulcanian eruption dynamics at Guagua Pichincha volcano. Ecuador. Bull. Volcanol. 69, 281–300. doi: 10.1007/s00445-006-0073-6
Keywords: volcanic eruption, rhyolite, obsidian, degassing, magma, diffusion, vesiculation, Chaitén volcano
Citation: Saubin E, Tuffen H, Gurioli L, Owen J, Castro JM, Berlo K, McGowan EM, Schipper CI and Wehbe K (2016) Conduit Dynamics in Transitional Rhyolitic Activity Recorded by Tuffisite Vein Textures from the 2008–2009 Chaitén Eruption. Front. Earth Sci. 4:59. doi: 10.3389/feart.2016.00059
Received: 10 February 2016; Accepted: 28 April 2016;
Published: 18 May 2016.
Edited by:
Jacob B. Lowenstern, U.S. Geological Survey, USAReviewed by:
Luca Caricchi, University of Geneva, SwitzerlandKenneth Stephen Befus, Baylor University, USA
Copyright © 2016 Saubin, Tuffen, Gurioli, Owen, Castro, Berlo, McGowan, Schipper and Wehbe. This is an open-access article distributed under the terms of the Creative Commons Attribution License (CC BY). The use, distribution or reproduction in other forums is permitted, provided the original author(s) or licensor are credited and that the original publication in this journal is cited, in accordance with accepted academic practice. No use, distribution or reproduction is permitted which does not comply with these terms.
*Correspondence: Hugh Tuffen, h.tuffen@lancaster.ac.uk