A Greigite-Based Magnetostratigraphic Time Frame for the Late Miocene to Recent DSDP Leg 42B Cores from the Black Sea
 Christiaan G. C. van Baak
 Iuliana Vasiliev
 Dan V. Palcu
 Mark J. Dekkers
 Wout Krijgsman
- 1Paleomagnetic Laboratory “Fort Hoofddijk”, Department of Earth Sciences, Utrecht University, Utrecht, Netherlands
- 2Faculty of Geology and Geophysics, Bucharest University, Bucharest, Romania
Throughout the Late Neogene, the Black Sea experienced large paleoenvironmental changes, switching between (anoxic) marine conditions when connected to the Mediterranean Sea and (oxic) freshwater conditions at times of isolation. We create a magnetostratigraphic time frame for three sites drilled during Deep Sea Drilling Project (DSDP) Leg 42B to the Black Sea (drilled in 1975). At the time, magnetostratigraphic dating was impossible because of the presence of the little understood iron sulfide mineral greigite (in sediments a precursor to pyrite) as magnetic carrier. Our rock-magnetic results indicate that only anoxic conditions result in poor magnetic signal, likely as a result of pyrite formation in the water column rather than in the sediment. The magnetostratigraphic results indicate that Hole 379A, drilled in the basin center, has a continuous sedimentary record dating back to 1.3 Ma. Hole 380/380A is subdivided into three consistent intervals, 0–700 mbsf, 700–860 mbsf, and 860–1075 mbsf. The top unit covers the Pleistocene but the magnetostratigraphy is likely compromised by the presence of mass transport deposits. The middle unit spans between 4.3 and 6.1 Ma and records continuous deposition at ~10 cm/kyr. The lower unit lacks the independent age constraints to correlate the obtained magnetostratigraphy. Hole 381 is drilled on the Bosporus slope and as a result, hiatuses are common. A correlation to the nearby Hole 380/380A is proposed, but indicates deposits cannot straightforwardly be traced across the slope. Our improved age model does not support the original interpretation based on these cores of a desiccation of the Black Sea during the Messinian salinity crisis.
Introduction
In 1975, during DSDP Leg 42B in the Black Sea, three holes (379A, 380/380A, and 381) were drilled with a total of 2318 m cored and a recovery of 55% (Figure 1; Ross et al., 1978). While by modern standards this may not be particularly noteworthy, these sites still represent the longest record of sedimentation in the deep, basinal part of the Black Sea. It is therefore unfortunate that during the post-cruise research no consensus was reached on a basic age model to correlate the Black Sea deposits in a global reference frame (Ross, 1978a). As a result, the Black Sea as a paleoclimatic archive beyond the Late Pleistocene remains poorly understood in a global context.
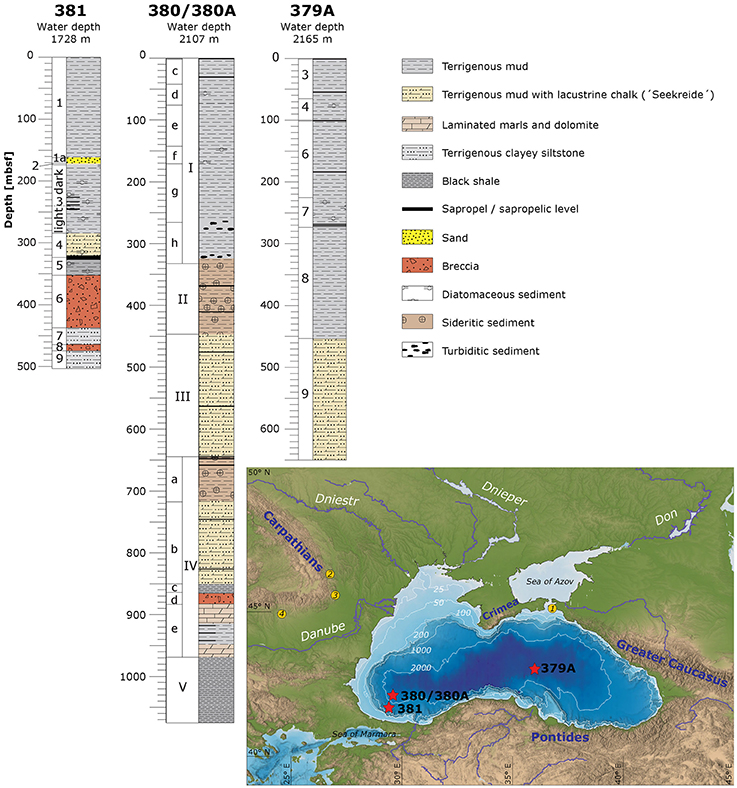
Figure 1. Lithology and lithological units of DSDP leg 42B cores and map of the Black Sea region with DSDP Leg 42B drilling locations (Logs adapted from Ross, 1978b). Numbered locations indicate magnetostratigraphically dated late Miocene, Pliocene, and Pleistocene reference sections. (1) Taman Peninsula, Russia (Krijgsman et al., 2010; Vasiliev et al., 2011), (2) Putna river, and (3) Rimnicu Sarat river (Romania; Vasiliev et al., 2004), (4) Topolog and Badislava sections (Romania; Vasiliev et al., 2005).
One of the main stratigraphic objectives of DSDP Leg 42B was to study the interactions between the Black Sea and Mediterranean Sea. The focus was on glacio-eustatic sea level change, periods of lacustrine sedimentation, and periods of bottom-water anoxia. These were to be put in a chronostratigraphic framework dating back to the Late Miocene. After drilling and core recovery, this appeared to be much more challenging than anticipated beforehand. A reliable, robust timeframe for the recovered sedimentary succession could not be established because diagnostic paleontological age markers were essentially lacking. Reasons involved the (supposedly) relatively short period of geological time covered by the cores and fauna endemic to the Black Sea resulting from the rapidly changing environmental conditions (Ross, 1978a). Also, the frequent lack or poor preservation of fauna and flora and reworking of older forms caused problems.
Magnetostratigraphic dating was set out to solve these chronostratigraphic issues. However, the presence of greigite (Fe3S4) severely complicated establishing a reliable polarity zonation (Giovanoli, 1979). Because its formation is linked to diagenetic processes with an ill-defined timing and duration, greigite was regarded at that time as an unreliable carrier of the natural remanent magnetization (NRM). Since then, our understanding of greigite formation processes has significantly improved: the mineral can, under specific conditions, be a reliable magnetic carrier (Vasiliev et al., 2008; Hüsing et al., 2009; Roberts et al., 2011). Especially in the circum-Black Sea region, several land-based sections of the Late Miocene and the Pliocene have been magnetostratigraphically dated with greigite as the main magnetic carrier (Vasiliev et al., 2004, 2005, 2011; Krijgsman et al., 2010; Van Baak et al., 2013, 2015a).
This finding motivated us to resample holes 380/380A and 381 of DSDP Leg 42B to retrieve a magnetostratigraphy despite 40 years of storage. It is known that wet storage under oxic conditions, i.e., in air, quickly oxidizes greigite but the mineral can survive dry storage. If only part of the original magnetic mineralogy would have been preserved this would offer hope to still extract an original signal. Therefore, we carefully determine rock-magnetic properties to assess the reliability of the paleomagnetic signal. The main focus of the post-cruise magnetostratigraphic work was on Hole 379A, and based on the understanding of the rock-magnetic properties of the other holes, we reinterpret the original paleomagnetic data of Giovanoli (1979). Based on the new paleomagnetic data, we provide an integrated bio-magnetostratigraphic chronostratigraphic framework for all holes, focusing on the Latest Miocene, Pliocene, and Pleistocene. Our age model allows us to identify previously overlooked hiatuses and enables better correlation between the studied sites.
Geological Setting of the Black Sea
The present-day Black Sea is the largest semi-isolated basin in the world and the archetype of a basin with anoxic bottom water conditions. During the Late Miocene to Recent, the connection to and coevolution with the Mediterranean Sea controlled paleoenvironmental conditions in the Black Sea (Krijgsman et al., 2010; Badertscher et al., 2011). Marine water is supplied to the Black Sea at times when Mediterranean sea-level is above the level of the sill in the Aegean/Sea of Marmara/Bosporus region. Salinity in the present-day Black Sea is in the range of 18–22o, with stagnant, anoxic bottom waters resulting from the density difference between the inflowing and outflowing waters (Ross, 1978b).
At a Mediterranean sea-level lower than the Bosporus sill, the Black Sea turns into an isolated, freshwater basin and Black Sea water level will depend on the local hydrological budget (e.g., Major et al., 2002). Major rivers like the Danube, Dniester, Dnieper, and Don, supply fresh water to the Black Sea (Figure 1); together they drain a large part of continental Europe. A positive hydrological budget will keep the Black Sea level at the sill height and cause one-directional flow toward the Mediterranean Sea. A negative hydrological budget will lower the sea-level until the total inflow (precipitation and river influx) equals the evaporation over the Black Sea. In both cases, salinity is expected to be similar to the present-day Caspian Sea distribution between 0–14%0. Establishing the water level at which the Black Sea stabilizes is difficult and will depend on the balance between precipitation, evaporation, and riverine input. On the basin margins, highstands are predominantly recorded and create a discontinuous record separated by erosional unconformities (Zubakov, 1988; Matoshko et al., 2004, 2009; Popov et al., 2010). In the basinal part of the Black Sea deposition should be more continuous. However, modern long-offset seismic reflection data indicates the presence of major allochtonous sequences along the slopes of the Black Sea and especially in the area around holes 380/380A and 381 (Tari et al., 2015).
To be able to correlate deposits, age control is of vital importance. Fauna endemic to the Black Sea is used as the basis for regional stages and typically does not allow for correlation beyond the basin (Nevesskaya et al., 2003). Lithostratigraphic and seismic correlations are also limited to intra-basinal scale and the resolution is too low for bed-to-bed correlations. Therefore, an integrated stratigraphic approach is required to create a first-order age model for intra-basinal changes and link them to external (tectonic or climatic) forcing.
Original DSDP Coring and Hole Description
Hole 379A (43°00.9′N, 36°00.68′E) is located on the abyssal plain of the Black Sea (water depth 2165 m), with a maximum penetration of 624.5 m and a recovery of 61%. The objective of this hole was to obtain a complete Pleistocene (bio)stratigraphic section. This objective was abandoned while drilling because of the unexpectedly high sedimentation rates (Shipboard Scientific Staff, 1978a). The core is divided in nine subunits of terrigenous origin (Figure 1). Sediments are mainly dark greenish-gray to dark gray terrigenous mud, with occasional beds of silt, sandy silt and sand. Graded bedding in the coarse lithologies suggests deposition in turbidity currents (Ross, 1978b). Fauna throughout the core is not age-diagnostic, but does describe paleoenvironmental changes (Shipboard Scientific Staff, 1978a). Palynological studies allow to subdivide the cores into low resolution, paleoclimatic stages (Traverse, 1978). Five marine intervals are identified in the top 300 m based on diatoms, but more may exist at lower levels, where sediment is barren of microfossils (Schrader, 1978).
Hole 380/380A is the composite of two holes at the same location (42°05.94′N, 29°36.82′E), Hole 380 down to a maximum depth of 370.5 mbsf and 380A from 332.5 down to 1073.5 mbsf (total recovery 55%; Shipboard Scientific Staff, 1978b). The site is located some 90 km to the NW of the Bosporus on the basin apron at a water depth of 2107 m. The aim was similar to Hole 379A, and lower sedimentation rates were expected. Five lithological units are distinguished, with units I and IV subdivided into subunits (Figure 1). Unit I (0–332.5 mbsf) comprises terrigenous material similar to Hole 379A and correlations are proposed between subunits (Ross, 1978b). The base of Unit I is placed at the deepest occurrence of turbiditic beds, interpreted to have originated from the Danube shelf (Trimonis et al., 1978). Unit II (332.5–446.5 mbsf) consists of intercalations of lacustrine chalk (Seekreide) in sideritic (FeCO3) and aragonitic (CaCO3) muds. Iron carbonate can only form in the absence of sulfate in the water column and therefore under isolated basin conditions (Hsü and Kelts, 1978). Aragonitic muds are related to periods of marine connection. Localized Braarudosphaera nannoplankton flora indicate salinities up to 22%0 (Percival, 1978). Unit III (446.5–644.5 mbsf) is of a freshwater nature and is characterized by lacustrine chalk (Seekreide) and mud. In the lower part of the unit, slumped masses are common. Unit IV is older than the sediment in Hole 379A (Ross, 1978b). Subunit IVa (644.6–718 mbsf) is again composed of sideritic and diatomaceous sediments. Subunit IVb (718–850 mbsf) no longer shows sideritic intercalations. Clays (terrigenous), calcite (chemical), and diatoms (biogenic) components are dominant lithologies. In subunit IVc (850–864.5 mbsf) the dominant lithology is olive-black diatomaceous shale. Abundant Braarudosphaera nannoflora indicates brackish-marine salinities (~22%0), as do dinoflaggelates and foraminifera (Gheorghian, 1978; Percival, 1978; Grothe et al., 2014). Subunit IVd (864.5–883.5 mbsf) is atypical and consists of coarse clastics and stromatolitic dolomite. This pebbly mudstone/breccia layer was originally taken as proof of the desiccation of the Black Sea during the Messinian salinity crisis (MSC; Hsü and Giovanoli, 1979). The main argument was that the presence of the stromatolitic dolomite should represent a supratidal depositional environment and therefore a dramatic sea-level lowering. Recently, the pebbly mudstone/breccia layer was shown to be older than the MSC based on dinoflaggelate cyst basin-to-margin correlations (Grothe et al., 2014). In addition, an alternative interpretation has been proposed for the genesis of this unit, where it represents the base of a mass transport deposit. Below, subunit IVe (838.5–969 mbsf) is predominantly structureless dark greenish marl with intercalations of aragonitic, calcitic, and dolomitic sediments. Unit V (969–1073.5 mbsf) is mostly black shale with tuffaceous and zeolitic siltstones and sandstones.
Hole 381 (41°40.25′N, 29°24.96′E) is located upslope from Hole 380/380A and because of unconformities, older sediments were expected compared to the previous sites. It was drilled in 1728 m water depth, with 503.5 m section drilled and 269 m core material recovered (53%; Shipboard Scientific Staff, 1978c). Nine units are distinguished, but correlation to the other holes was hampered by multiple unconformities (Ross, 1978b). Unit 1 (0–171 mbsf) is terrigenous mud, similar to the uppermost unit in holes 379A and 380/380A, but bed-to-bed correlation is difficult. Subunit 1A consists of terrigenous silty sands interpreted as beach deposits; it represents the youngest unconformity in Hole 381. Unit 2 (171–173 mbsf) is a thin package of lacustrine chalk, correlated to Unit III of Hole 380/380A (Ross, 1978b). Below, unit 3 (173–285 mbsf) is in the upper part dark greenish-gray diatomaceous sapropelic muds. The lower part of the unit (below 240 mbsf) is lighter gray diatomaceous mud. Unit 4 (285–323 mbsf) is diatom-rich lacustrine chalk. Unit 5 (323–352 mbsf) is aragonitic-rich, diatomaceous, sapropelic mud rich in marine fauna, similar to subunit IVc at Hole 380/380A. Unit 6 (352–437 mbsf) is pebbly mudstone and sand, and is correlated to subunit IVd at Hole 380/380A. Compared to unit IVd at Hole 380/380A it is thicker and consists of sandy rather than dolomitic and stromatolitic deposits. The environment of unit 6 is interpreted as supra-tidal and indicates another hiatus (Ross, 1978b). Below this, unit 7 (437–465 mbsf) is olive-gray to black finely laminated siltstone. Unit 8 (465–475 mbsf) is a breccia and the abundant soft-sediment deformation indicates another potential hiatus. Unit 9 (475–503 mbsf) is similar to unit 7, but with additional intercalations of siderite.
Materials and Methods
All sites of the DSDP Leg 42B expedition are rotary-drilled. Because of this, we can only use the vertical component (inclination) to determine magnetic polarity. From Hole 380/380A 232 discrete, oriented samples were taken, from Hole 381 a total of 86 samples. The top ~200 m of each core tends to contain heavily disturbed sediments. Preservation of the cores varies between lithologies. In general, mud-rich lithologies show little signs of oxidation and the sampled material tends to be in near-pristine state. Hole 379A was not resampled because the original work on this hole comprises 72 samples in 440 m of core and resolution is high enough for basic magnetostratigraphic purposes (Giovanoli, 1979).
Paleomagnetic measurements were performed at Paleomagnetic Laboratory “Fort Hoofddijk,” Utrecht University (The Netherlands). Samples were drilled or cut into (near) standard sized paleomagnetic specimens. We applied both thermal (TH) and alternating field (AF) demagnetization. Thermal demagnetization was performed up to a maximum temperature of 580°C, or lower temperatures when the remanence of the sample was reduced to >10% of the starting NRM or when alteration became evident. All thermal demagnetization results were analyzed using the new interpretation software available at http://paleomagnetism.org (Koymans et al., submitted). An online data file and interpreted directions are available (Supplementary Material), and can be viewed (and reanalyzed) using this website.
We preferred to thermally demagnetize the specimens rather than use alternating field demagnetization, because greigite-bearing samples are prone to acquire a gyro-remanent magnetization (GRM); the demagnetization trajectory is biased by this GRM acquisition from 30–40 mT upward (e.g., Vasiliev et al., 2007, 2008; Roberts et al., 2011). GRM can become stronger than the starting NRM. To minimize the GRM during AF demagnetization, we followed the protocol of Dankers and Zijderveld (1981). The samples are statically AF demagnetized along three orthogonal axes at a certain AF level and only the component parallel to the last demagnetization axis is used to calculate the NRM vector. This implies that the other two components require a second time AF demagnetization for a meaningful determination (see also Stephenson, 1993). We measured a subset of samples using stepwise AF demagnetization both with and without the per component protocol to assess the original Hole 379A results which were all measured without the per component protocol in steps of 5 mT up to a maximum of 25 mT.
Thermomagnetic runs were performed in air on a modified horizontal translation type Curie balance (noise level 5 × 10⁻⁹ Am2). Samples of 40–80 mg were heated in a series of runs to increasingly higher temperatures with a maximum of 700°C. Magnetic susceptibility measurements of specimens with a known mass were acquired on an AGICO MFK1-FA instrument at field strength of 200 A/m and a frequency of 976 Hz. For these settings, the machine has a sensitivity of 2 × 10⁻⁸ SI units for a nominal volume of 10 cc. Both AF demagnetization and acquisition curves of the Isothermal Remanent Magnetization (IRM) were performed on an in-house built, robotized sample handler attached to a horizontal 2G Enterprises DC SQUID magnetometer (noise level 2–3 × 10⁻¹² Am2) with in-line AF demagnetization, ARM (anhysteretic remanent magnetization) and IRM facilities. IRM acquisition curves were acquired starting from the three-axial static AF demagnetized state at 300 mT with the final AF demagnetization axis parallel to the IRM acquisition field, obtained in a laboratory-built AF coil. This minimizes effects of magnetic interaction and thermal activation and makes subsequent IRM acquisition curves behaving largely according to a cumulative log-Gaussian curve (Heslop et al., 2004). IRM acquisition curves can be meaningfully separated into coercivity components using the curve fitting approach of Kruiver et al. (2001). Components were characterized by their saturation IRM (SIRM), the field strength necessary for half of the SIRM (B1∕2) and the dispersion parameter (DP), representing the width of each component. The fitted curves are mathematically non-unique, and to reduce non-uniqueness the thermal properties of the samples are studied in tandem. Curve fits are made by first fitting the dominant component(s), followed by a skewed-to-the-left low coercivity component without physical meaning and finally (where present) a high coercivity component to represent a high-coercivity mineral. To further assess the magnetic domain state and the effects of magnetic interactions, next to the magnetic mineralogy, first-order-reversal-curve (FORC) diagrams were measured at room temperature using an alternating gradient magnetometer (AGM; Princeton Measurements Corporation, MicroMag Model 2900 with 2T magnet, noise level 2 × 10⁻⁹Am2). Sample mass was between 20 and 40 mg. Signal-to-noise ratios were sufficient to enable use of a maximum smoothing factor (SF) of 5 (Pike et al., 1999); for one sample however, we used SF = 10. FORC diagrams are composed of 400 curves and the field step is 0.566 mT, each data point has a 150 ms averaging time.
Results
Rock Magnetic Parameters
To better understand the magnetostratigraphic results, we study the rock-magnetic properties and assess the acquisition mechanism of the magnetic signal. Based on the identifications of different temperature components coupled to the behavior during the thermal and alternating field rock-magnetic measurements we divided the samples into six types (Figures 2, 3).
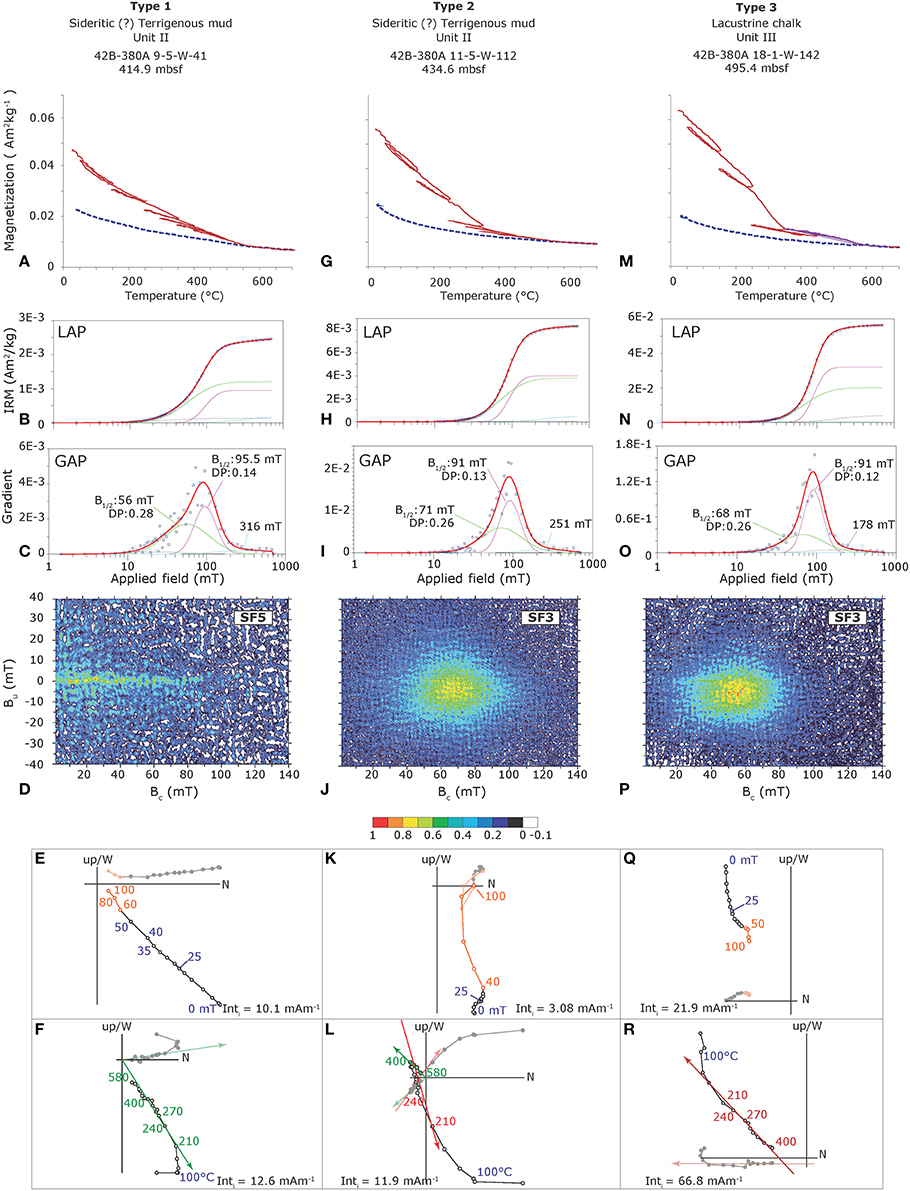
Figure 2. Rock-magnetic properties and demagnetization diagrams for Types 1–3. From top to bottom: Lithology, lithological unit, core (expedition-site-core-section-half (W = working)-interval), depth in meters below sea floor (mbsf). (A,G,M) thermomagnetic runs up to 700°C, in red heating to increasingly higher temperatures, in blue (dashed) cooling back to 20°C. Purple colors (where present) indicate an increase in magnetization related to the conversion of (non-magnetic) pyrite into magnetite at temperatures above 400°C. (B,H,N) IRM component analysis; Linear Acquisition Plot (LAP), with fitted coercivity components; open squares indicate measured data points. (C,I,O) IRM component analysis; Gradient Acquisition Plot (GAP), coercivity of the components are characterized by the B1∕2 (mT) value and the dispersion parameter (DP) (log mT). (D,J,P) First-Order-Reversal-Curve (FORC) diagrams. Color scale indicates FORC density scaled between 0 and 1 (negative values indicating measurement noise are put to −0.1). Smoothing Factor (SF) indicated per sample. (E,K,Q) Alternating field (AF) demagnetization diagrams; open (closed) circles represent inclination (declination), in orange gyroremanent behavior. (F,L,R) Thermal (TH) demagnetization plots, symbols similar to AF diagrams; Green/red/blue symbols indicate components up to a maximum temperature of 580°C (HT)/400°C (MT)/200°C (LT). IntI, Intensity at room temperature.
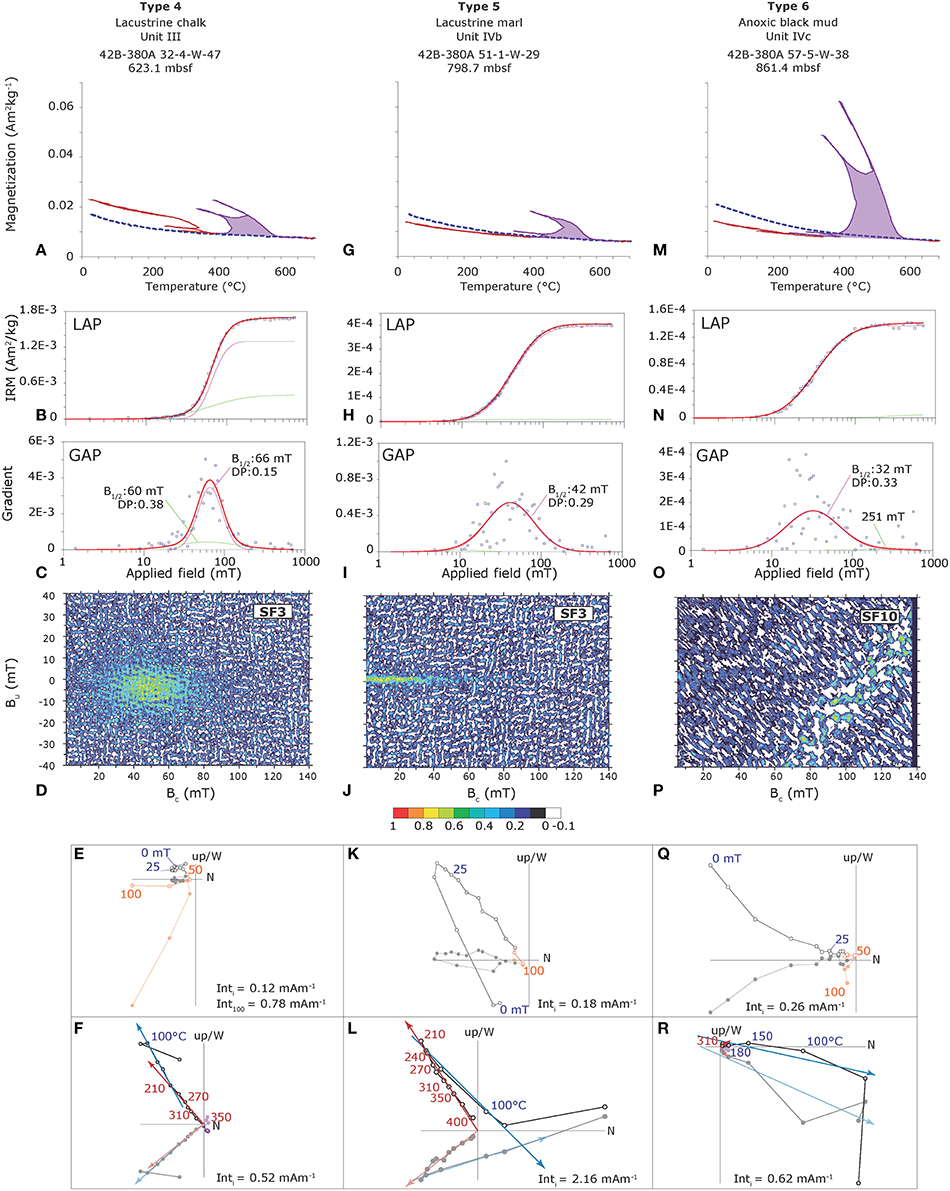
Figure 3. Rock-magnetic properties and demagnetization diagrams for Types 4–6. Panels are similar to Figure 2.
Properties of Type 1 samples are illustrated in Figure 2. Type 1 samples are restricted to the top 450 m of Hole 380/380A and are typical of terrigenous and sideritic (FeCO3) muds. The detrital material was sourced from turbidites supplied by the Danube river (Ross, 1978b). Sideritic muds may form under anoxic conditions with low sulfate concentrations (Hsü and Kelts, 1978). The sulfate-poor conditions indicate a likely absence of sulfate-rich, marine waters at the time. Thermomagnetic runs decrease up to 580°C, the Curie temperature of magnetite (Figure 2A). An irreversible decrease in magnetization between 200 and 350°C is observed hinting at the presence of a magnetic sulfide. Two components for Type 1 are isolated with the IRM component analysis: (1) a component with a forward acquisition field (B1∕2) around 50–56 mT and a dispersion parameter (DP) of ~0.28 (log units; Figures 2B,C) which is interpreted as (detrital) magnetite and (2) a component with B1∕2 ranging between 60–95 mT and a narrow DP of ~0.14 which is interpreted as close to single domain greigite (Vasiliev et al., 2008). The relative contribution in terms of SIRM of both components is similar, both representing between 40 and 50% of the total IRM. The remainder (< 10%) of the signal is accounted for by a high-end tail, representing a high-coercivity mineral, potentially hematite. The FORC diagram indicates a first domain with larger horizontal spread (along Bc) axis than its vertical spread (along Bu) axis (Figure 2D), a signature comparable to a “central ridge” (Egli et al., 2010). Based on the IRM fit with two components, we interpret this FORC diagram with two domains. The second domain is represented by the (poorly resolved) density becoming increasingly narrow along the vertical axis up to a Bc of 40 mT. The GRM observed in the AF demagnetization (Figure 2E), is in line with this observation and indicates the presence of greigite. Upon thermal demagnetization, a linear decay toward the origin characterizes the diagrams between 200 and 580°C (Figure 2F).
Lithologically, Type 2 samples are similar to Type 1. In thermomagnetic runs, a distinct change in slope is observed at ~350–400°C, after which only a small fraction of the starting magnetization is decreasing further up to a temperature of 580°C (Figure 2G). Similar to the type 1 samples, this behavior points to greigite and magnetite. The IRM component analysis for Type 2 allows the isolation of two components (Figures 2H,I). The component with B1∕2 around 70 mT and a DP of ~0.26 has a contribution of ~15%. Despite the relatively high B1∕2, the median DP of ~0.26 and demagnetization to 580°C is favoring magnetite as its interpretation. The component with B1∕2 ~95 mT and a narrow DP of ~0.13 is typical for greigite (Chang et al., 2014). The amount of magnetic interaction and the domain state in these samples, emerges from FORC diagrams that have contours centering around a single domain (SD) peak at Bc ~70 mT (Figure 2J). The FORC diagrams are similar to those previously reported for greigite (Roberts et al., 2000; Sagnotti et al., 2004). The central peak has considerable vertical spread and is centered slightly below Bu = 0, which indicates relatively strong magnetic interaction among particles (Pike et al., 1999; Newell, 2005). In addition, there is a minor central ridge contribution spread along the Bc axis, indicating a component with negligible magnetic interaction(Egli et al., 2010; Chang et al., 2014). This is most likely related to (near-)SD behavior of small particles. The prominent GRM acquisition during AF demagnetization (Figure 2K) indicates the presence of large amounts of greigite in the samples. Type 2 samples show decreasing intensities during thermal demagnetization up to a maximum temperature of 580°C. Two components of opposite polarity can be present (Figure 2L).
Type 3 is typical for lacustrine (freshwater) chalks or “Seekreide” (unit 9 in 379A, units III and IVb in 380/380A and unit 2 of 381). Chalk can only be a major sediment-forming component in the absence of a significant detrital contribution (Hsü and Kelts, 1978). Type 3 magnetic carriers argue for a detrital contribution indicating Type 3 is best interpreted as less pure chalk. The main difference with Type 2 is observed in the thermomagnetic runs in air where a steeper decreasing slope is observed at ~350–400°C and an (small) increase in magnetization is observed at temperatures higher than 400°C, indicating the formation of a new magnetic phase obscuring the original composition (Figure 2M). The increasing magnetization upon heating above 400°C is typically the result of (non-magnetic) pyrite oxidizing to form (magnetic) magnetite. The IRM component analysis reveals the contribution of another magnetic mineral next to greigite, most likely again magnetite (Figures 2N,O). The order of magnitude higher SIRM agrees well with the steeper decay between 200 and 300°C in the thermomagnetic measurement. The FORC diagrams indicate the presence of a highly interacting (pseudo) single domain with an Bc peak at ~60 mT but with a spread up to ~85 mT (Figure 2P). This FORC diagram shows many similarities to diagrams obtained from other greigite-bearing rocks of the Paratethys (Vasiliev et al., 2007; Chang et al., 2014). A more pronounced central ridge and less pronounced GRM are observed in comparison to type 2 (Figure 2Q). Demagnetization diagrams show a linear decay up to 400°C (Figure 2R). Thermal demagnetization is stopped at this temperature, since the formation of the new magnetic phase would no longer allows discrimination of the original inclination at higher temperatures. Therefore, a residual component may be left and samples are not completely demagnetized.
Type 4 is also typical for lacustrine chalks, similar to type 3. These chalks do not contain a detrital component. Compared to type 3, thermomagnetic runs show a smaller greigite contribution and a larger transformation above 400°C (Figure 3A). This indicates smaller amounts of greigite and larger amounts of pyrite transforming into magnetite. Type 4 IRM acquisition curves appear to be saturated or nearly saturated at 700 mT, making a fit with a detrital magnetite component similar to types 1–3 unlikely. Therefore, we propose a fit with two IRM components of approximately equal B1∕2 at ~60–65 mT (Figures 3B,C) implying two overlapping greigite components (see also Vasiliev et al., 2007). FORC diagrams are more noisy for Type 4, which agrees with the lower amounts of greigite (Figure 3D). The highly interacting domain is centered around 50 mT. The GRM acquired is high (Figure 3E) in line with the important contribution of greigite. Thermal demagnetization shows a near linear decrease to the origin up to a maximum temperature of ~350°C, at which the samples are empty (Figure 3F).
Type 5 is typical for unit IVb of Hole 380/380A (700–850 mbsf), units 3 and 4 of Hole 381 and sporadically found in units I-III in Hole 380/380A. The typical lithology is marl, which alternates with lacustrine chalks (Shipboard Scientific Staff, 1978b). Salinities may however be higher than in the complete freshwater type 4, as indicated by dinoflagellate cysts typical for brackish-marine conditions (Grothe et al., 2014). Thermomagnetic runs indicate similar amounts of pyrite oxidizing upon heating above 400°C as for type 4 (Figure 3G). No increased decay between 300 and 400°C is observed. Types 5 are fitted with a single dominant coercivity component with B1∕2 around 40–45 mT and a DP of around 0.3 (Figures 3H,I). The lack of a coercivity component in the range known for greigite (50–95 mT) indicates either that most greigite has transformed into pyrite or the biogeochemical conditions were inhibiting the greigite formation and in turn favored pyrite growth. The FORC diagram shows a narrow peak around Bu = 0 mT with contours centering around 20 mT (Figure 3J). The AF demagnetization behavior for type 5 is different from previous types; it does not acquire a significant GRM but instead shows, similar to the thermal demagnetization diagram, two distinct directional components (Figure 3K). The low temperature component (up to 210°C) has the same polarity directions as the low coercivity component (0–20 mT). The same applies to the medium temperature component that has a concurrent direction as the higher coercivity component. Type 5 has thermal demagnetization diagrams with two distinct directional components, one up to 200°C, and a second to 400°C (Figure 3L).
Type 6 is abundantly found in unit IVc (380/380A) and unit 5 (381) where anoxic conditions with typical olive black shale dominate. Throughout unit I of Hole 380/380A these lithologies form in discrete intervals. The anoxic conditions are related to marine conditions, as indicated by the presence of calcareous nannoplankton (Percival, 1978; Schrader, 1978). The thermomagnetic runs indicate the presence of large amounts of (non-magnetic) pyrite transforming to magnetic phases upon heating at temperatures in excess of 350°C (Figure 3M). The IRM acquisition is noisy but can be fitted with one magnetic component with a B1∕2 below 35 mT and a relatively wide dispersion between 0.3 and 0.35 (Figures 3N,O). The FORC diagrams for type 6 samples are very noisy and impossible to interpret (Figure 3P). A minor GRM is observed above 50 mT (Figure 3Q). Type 6 samples have thermal demagnetization diagrams where the signal is lost before 300°C. The 200°C component becomes dominant, representing 90% of the total signal (Figure 3R). Since this temperature component represents an overprint in type 5, we do not consider these magnetic carriers reliable.
NRM Demagnetization
The paleomagnetic data for Hole 379A were measured as part of the post-cruise research in the 1970's. Samples were demagnetized using alternating fields up to a maximum of 25 mT (Giovanoli, 1979). Demagnetizing at 25 mT is not likely to cause gyroremanent behavior (Figures 2, 3), so the measured samples for Hole 379A should not be influenced by a GRM. In addition, overprints are typically removed at 25 mT (Figures 2, 3). There is however a downside to the AF demagnetization of greigite-bearing samples. Due to the overlapping coercivity spectra it may not be possible to completely separate magnetite and greigite components. In case of bi-directional components (around reversals), this may lead to incorrect determination of the polarity. Because of this, for the Hole 379A results the position of reversals is an approximation at best. Therefore, we prefer thermal demagnetization for discriminating remanence components for holes 380/380A and 381.
Thermal demagnetization with small temperature steps, especially in the interval 210–400°C, allows discriminating multiple directional components. Around 75% of the samples show a near-horizontal component below 100°C. This is likely to be related to the drying out of the material during storage. The near-horizontal direction is the result of the horizontal storage in a steep northern hemisphere ambient magnetic field [storage first in New York (USA), later in Bremen (Germany)] of the vertically drilled core segments. In >10% of the cases, a vertical component is observed in this temperature range, which we interpret to be caused by the drilling process. Besides the components interpreted as storage and drilling related, up to three NRM components are identified in the rocks as: (1) the low temperature (LT; 100–210°C) component, (2) the medium temperature (MT; 210–400°C) component and (3) the high temperature (HT) component (up to 580°C). HT components are limited to units I and II in Hole 380/380A (upper 450 m) and in this interval represent half of the samples. The HT samples may be overprinted by a MT component up to 400°C (Figure 2L). For samples where the MT component is the highest temperature component, the overprint of the LT component may extend up to 270°C.
Thermal demagnetization was successful in removing LT components (Figures 2, 3), interpreted to be of sub-recent origin since its mean direction in geographic coordinates is close to the local geomagnetic inclination direction. Both normal and reversed MT and HT components (the highest temperature components distinguished) are present in the record of DSDP42B 380/380A and 381 suggesting a primary origin of the magnetic components. In the vicinity of a polarity reversal, antipodal magnetization of two different components could be observed in the same specimen (e.g., Figure 2L). In these cases, early diagenetic transformations likely caused delayed NRM acquisition and a (partial) overprint of the original earlier acquired component (Channell et al., 1982; Van Hoof and Langereis, 1991; Vasiliev et al., 2008). The direction of the subsequent, younger polarity interval will overprint the original direction. Therefore, it was important to separate, where possible, the low, medium, and the high temperature components.
Magnetostratigraphic Framework for DSDP Leg 42B
We plot all determined inclinations for the components in histograms between −90° and +90° binned with 5° intervals (Figure 4). The legacy data from Hole 379 shows clear peaks with both positive and negative inclinations straddling the geocentric axial dipole (GAD) inclination for the drill site. Negative inclinations tend to be slightly lower than the (inverted) GAD inclination. Since this is not observed for the positive inclinations, this is most likely related to the incomplete removal of an overprint component of opposite polarity. For Hole 380/380A, the data clearly cluster at the axial dipole values with a gradual decrease toward lower values. Additionally, a cluster with near-horizontal directions is present. This is very similar to the typically shallow direction of overprint at the lowermost temperature step, indicating this may also be a storage-induced overprint. The obtained inclinations from Hole 381 plot rather uniformly across all directions. However, when plotted against depth these directions do represent clear polarity zones.
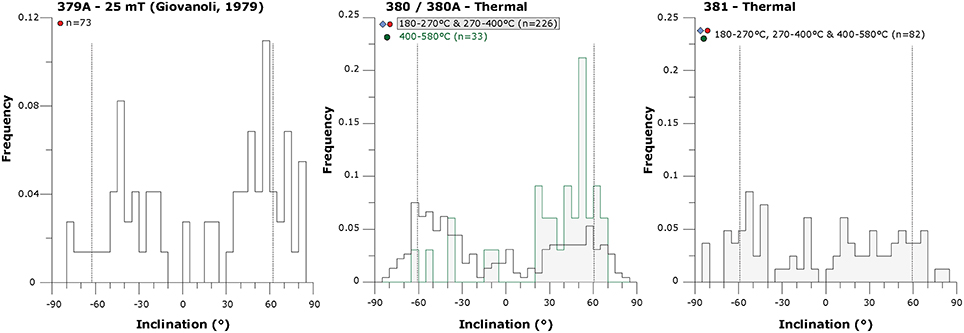
Figure 4. Histograms of inclinations per site, representing the inclination after alternating field demagnetization at 25 mT (Hole 379A) and the best-fit lines of the interpreted temperature components (Hole 380/380A and 381). Vertical bars represent the GAD direction (and inverse) for the sites at time of drilling.
Magnetostratigraphies for the three sites are plotted and correlated in Figures 5–8. Independent (biostratigraphic, radio isotopic) constraints are indicated where present. Additional constraints on the depositional age come from correlations to the regional stage subdivisions of the Black Sea (Jousé and Mukhina, 1978; Kojumdgieva, 1979). Most of this data is not directly age-indicative, but help to fit the cores in the Black Sea stratigraphic framework and sometimes allow for basin-to-margin correlations. For all magnetic reversal ages we use the age in GPTS 2012 (Hilgen et al., 2012). We correlate magnetozones to the GPTS based on the notion that sedimentation was as continuous as possible; further the number of hiatuses should be as small as possible. During the Late Pleistocene, sedimentation rates of terrigenous sediments in the basinal Black Sea may however vary significantly between 5 and 140 cm/kyr (Ryan et al., 1997; Major et al., 2002; Bahr et al., 2005). Long polarity zones may represent significant averaging of the sedimentation rate and will smooth out these large variations.
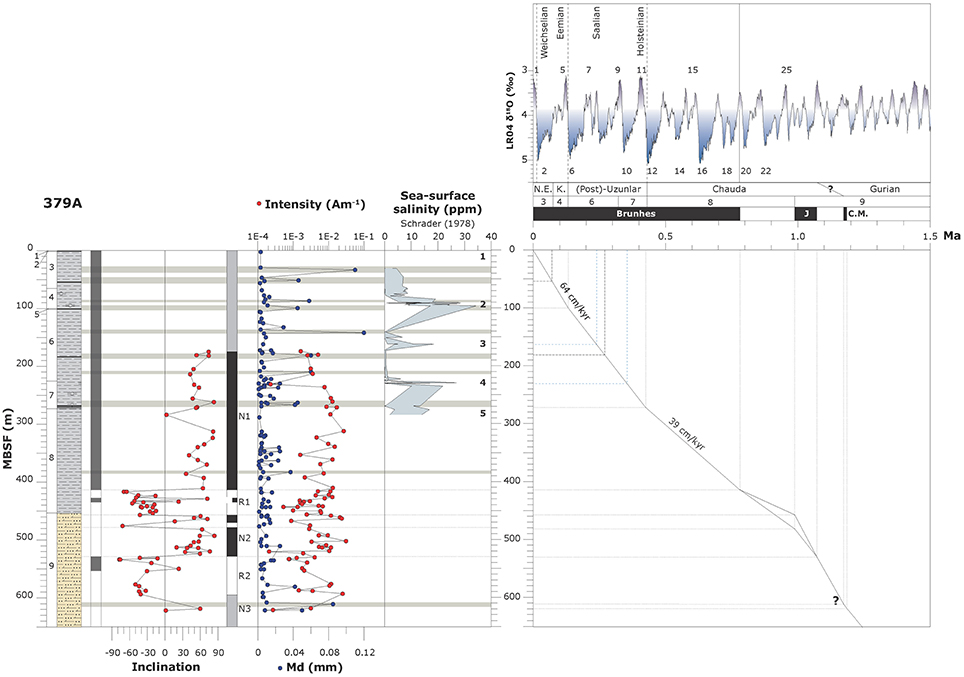
Figure 5. Age-depth plot for Hole 379A. From left to right: Depth-scale; lithological units; lithology (similar to Figure 1); polarity interpretation by Giovanoli (1979), black (white) normal (reversed); Inclination data (Giovanoli, 1979); Our polarity interpretation; Polarity chron label; grain size [mean diameter, MD (mm), Trimonis and Shimkus, 1978] and NRM intensity (Giovanoli, 1979); diatom-based sea-surface salinity (Schrader, 1978), numbers (1–5) indicate marine diatom assemblages. Gray horizontal bands indicate coarse (turbiditic) lithologies and dotted black lines magnetic reversals. From top to bottom: Terrestrial chronostratigraphic units; stacked δ18O record of benthic foraminifera (Lisiecki and Raymo, 2005) with numbered (inter) glacial stages; Black Sea regional stages (N.E. = New Euxinian, K. = Karangat) after Zubakov (1988); Hole 379A lithological units; Geomagnetic Polarity (Hilgen et al., 2012; J = Jaramillo, C.M. = Cobb Mountain); Age (Ma).
Hole 379A
Independent biostratigraphic age constraints are for Hole 379A are based on basin-to-margin correlations. Marine conditions inferred for unit 4 are interpreted to be the equivalent of the Karangat regional stage, related to the Eemian (MIS 5) interglacial (Ross, 1978b; Stoffers et al., 1978). Similarly, lithological unit 7 is linked to the Holsteinian interglacial (MIS 11). With these tie-points and under the assumption of a relatively constant sedimentation rate, the polarity pattern provides a rather straightforward correlation to the GPTS (Figure 5). N1 is the Brunhes (C1n) chron and the Brunhes/Matuyama boundary is at 410 mbsf. Normal magnetozone N2 between 450 and 530 mbsf should then be chron C1r.1n (Jaramillo). Isolated samples of normal polarity between the Brunhes and Jaramillo may be overprinted directions or related to short normal excursions known in the uppermost Matuyama chron (Channell et al., 2002). Two options exist for the top Jaramillo reversal, at 450 and 480 mbsf. The deeper level provides a more constant sedimentation rate. The normal sample at 620 mbsf is potentially subchron C1r.2n (Cobb Mt.), although a higher resolution sampling is required to substantiate this.
In total the cored interval at Hole 379A spans around 1.2 Myr. The average sedimentation rate in the upper part of the Brunhes chron is ~64 cm/kyr. In the lower part the Brunhes chron this is reduced to 39 cm/kyr. Assuming the lower possibility for the top Jaramillo reversal, sedimentation rates are in the same range as for the Brunhes chron.
Hole 380/380A
Hole 380/380A does not allow for a straightforward correlation to the GPTS. We subdivide the core in three parts, 0–700, 700–860, and 860–1075 mbsf. We use the magnetic susceptibility record to define the boundary between the top two parts (Figure 6). The 0–700 mbsf interval is characterized by large fluctuations in susceptibility (average 1.6 × 10⁻⁷ kg/m3), while between 700 and 860 mbsf, susceptibility is stable at an average value of 7.6 × 10⁻⁸ kg/m3 (Figure 6). At 700 mbsf also palynologically a distinct cooling is observed (Popescu et al., 2010), adding to the interpretation of a significant paleoenvironmental change.
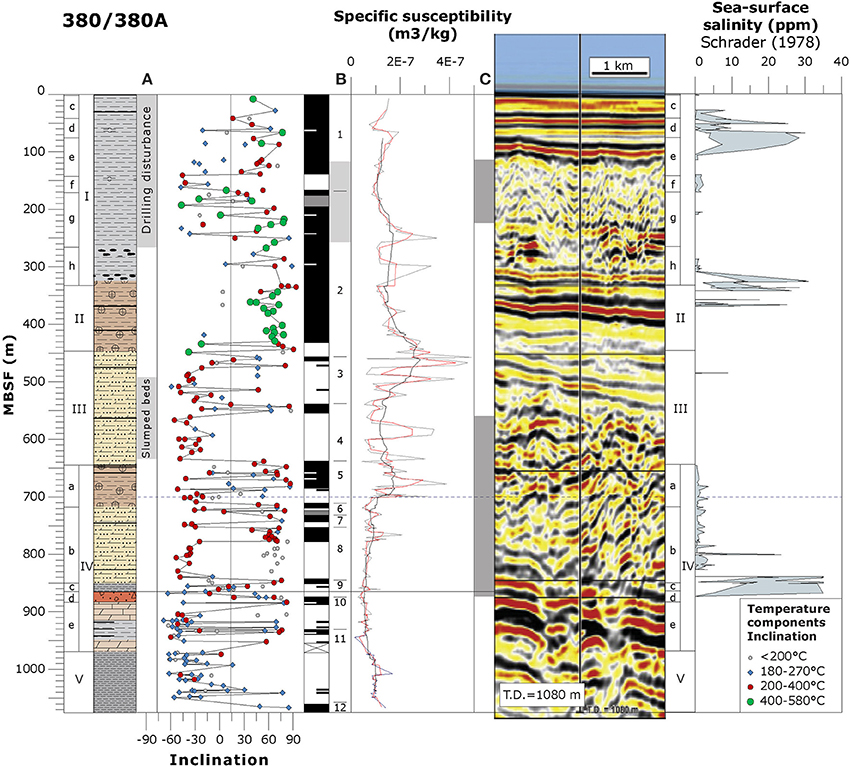
Figure 6. Magnetostratigraphic results for Hole 380/380A compared to previously published datasets. From left to right: Depth-scale; lithological units, unit I is divided in eight subunits (a–h), consisting of (a) nannofossil ooze, (b) sapropel, (c) muds and sandy silts, (d, f) diatomaceous mud, (e, g) muds, and (h) muds and turbidites; lithology (similar to Figure 1); column (A), Interpretation of deformation structures in the core (Shipboard Scientific Staff, 1978b); Measured inclination; Polarity interpretation, in gray column (B), potential disturbance; Polarity zone label; Specific magnetic susceptibility (gray: measured data, red: three point moving average; black: 25 point moving average); column (C) interpretation of mass transport units by Tari et al. (2015); Depth converted seismic transect across the drilling location of Hole 380/380A (Tari et al., 2015); lithological units; diatom-based sea-surface salinity (Schrader, 1978). Horizontal lines indicate the borders of intervals of similar behavior.
In the uppermost 250 m an irregular pattern of both normal and reversed directions is observed. Part of this likely related to the high degree of disturbance in the uppermost part of the core (Shipboard Scientific Staff, 1978b). The base of this interval correlates closely to the base of the upper mass transport complex imaged on seismics (Tari et al., 2015), indicating that part of the variability may also be related to sediment redeposition. In addition, the interval between 260 and 200 mbsf shows a clear convex lowering trend in susceptibility. Similar to Hole 379A, in Hole 380/380A interpreted marine units are identified and correlated in the “terrigenous” part of the core. Unit Id is correlated to units 4 and 5 (379A) and represents the Karangat/Eemian (MIS 5) (Ross, 1978b; Stoffers et al., 1978). Unit If is correlated to unit 7 (379A) and the Uzunlar/Holsteinian (MIS 11).
The middle part of the core (700–860 mbsf) is constrained by an absolute tie-point at 706 mbsf where an interbedded volcanic ash-layer is dated using 40Ar/39Ar at 4.36 ± 0.19 Ma (Van Baak et al., 2015b). This ash-layer is a 2-cm thick dacitic tuff layer with a white to yellowish color (Shipboard Scientific Staff, 1978b). From this a pristine feldspar fraction was isolated and dated.
The age of ~4.4 Ma at 706 mbsf indicates that according to the GPTS, 17 reversals should be located above this level. Only six reversals are observed, indicating a significant hiatus needs to be present above 706 mbsf (Figure 6). Between 450 and 650 mbsf polarity is predominantly reversed, with scattered normal samples. In two cases multiple samples have a normal orientation, between 460 and 470 mbsf and between 545 and 560 mbsf. Below this, between 650 and 685 mbsf a consistent normal interval is present. Between 685 and 700 mbsf samples do not show consistent polarity.
We present multiple options to correlate units I, II, III, and IVa to the GPTS (Figure 7). Distinguishing between options is difficult due to the general lack of independent age constraints in these freshwater sediments. The key to the correlation is the long interval of reverse polarity between 450 and 650 mbsf (R3 and R4). Younger than 4.36 Ma, three options exist for a long reverse chron. Option A assumes continuous deposition from 4.36 Ma onwards, which would mean the reverse directions correlate to chron C2Ar between 4.2 and 3.6 Ma. The overlying normal (zone N2) would then correlated to chron C2An.3n. This implies a large hiatus related to the upper mass transport complex, which would then be overlain in zone N1 by sediments younger than 780 ka (base Brunhes normal chron).
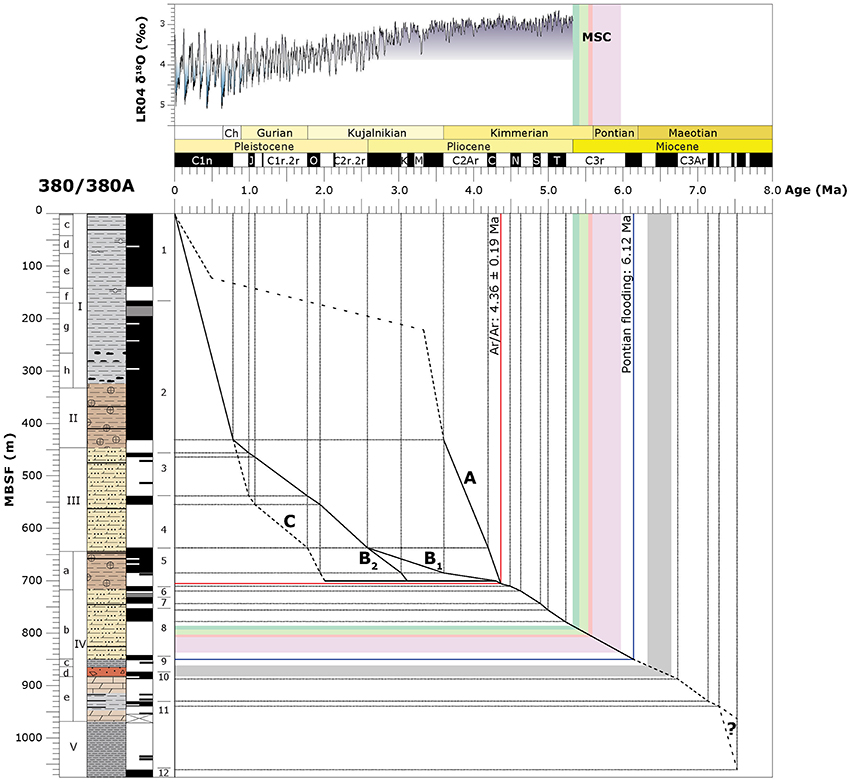
Figure 7. Age depth correlation for Hole 380/380A, indicating three options (A–C) for the upper 700 m. The red line at 706 mbsf indicates the position of the 40Ar/39Ar dated ash-layer of Van Baak et al. (2015b) and the blue line the dinoflaggelates cyst datum of Grothe et al. (2014), in gray the anomalously coarse Unit IVd. From top to bottom: stacked δ18O record of benthic foraminifera (Lisiecki and Raymo, 2005); Black Sea regional stages (Ch = Chaudian) after Zubakov (1988) and Nevesskaya et al. (2003); Hole 380/380A lithological units; Geomagnetic Polarity (Hilgen et al., 2012), colors for the Messinian salinity crisis (MSC) interval represent the individual stages of the MSC [after Roveri et al. (2014)]; Age (Ma).
In Option B the reversal at 640 mbsf correlates to the top of the Gauss chron (2.581 Ma). This allows to correlate the overlying reverse zone to chrons C1r and C2r. In this case, the interval between 640 and 700 mbsf should span the time interval 2.58–4.35 Ma. The first option is correlation using a lower sedimentation rate zone N5 to chron C2An (Gauss) and N6 to C2Ar (Option B1). Alternatively, Option B2 calls for a hiatus at 700 mbsf and correlates N5 to chron C2An.1n (top of the Gauss). For the interval above the hiatus, this would imply a relatively constant sedimentation rate of ~11 cm/kyr, similar to the rate below 700 mbsf. The total duration of the hiatus at 700 mbsf would be ~1.3 Myr.
Option C assumes a longer duration for a hiatus at 700 mbsf and correlates the long reverse zone to just chron C1r. From this follows that zone N4 correlates to chron C1r.1n (Jaramillo), N5 would then be chron C2n (Olduvai). Sedimentation rate in N4, R4 and N5 would not be constant, with N4 at 20 cm/kyr, R4 at 11 cm/kyr, and N5 at 29 cm/kyr. The total duration of a hiatus around 700 mbsf would be 2.2 Myr. This interpretation would imply that some of the normal directions measured between 450 and 520 mbsf may not be of primary origin and represent a secondary overprint.
Biostratigraphic basin-to-margin correlation indicates an age of 6.1 Ma at 850 mbsf (Grothe et al., 2014). Between the ash-layer at 706 mbsf and this point, the magnetostratigraphy provides a straightforward correlation. The three normal intervals correlate to the Lower Pliocene, with N6, N7, and N8 correlating to C3n.2n (Nunivak), C3n.3n (Sidufjall), and C3n.4n (Thvera), respectively. Assuming deposition with a continuous sedimentation rate of ~9 cm/kyr, the long reversed interval between 780 and 850 mbsf correlates to chron C3r.
The third interval is below unit IVd (860–1075 mbsf). Given the age constraint at 850 mbsf, it should be older than 6 Ma and should therefore correlate to the Maeotian and Sarmatian regional stages of the Black Sea (Kojumdgieva, 1983). Typically, Unit IVd is interpreted as a major discontinuity (Hsü and Giovanoli, 1979; Tari et al., 2015), and therefore correlation of magnetic polarities in the interval below requires additional age constraints. We do not have these, but simply extrapolating the sedimentation rate of the overlying interval downwards does suggest a correlation can be made down to the base of unit IVe. This would imply an age around 7.2 Ma for the base of unit IVe. A continuation of the same rate further down through unit V does not allow for a correlation, indicating either sedimentation rate increased at this time, or a hiatus needs to be present (Figure 8). A simple extrapolation downwards would however also imply that Unit IVd is not a major discontinuity. A much higher resolution study would be needed to prove such a claim. Most importantly, we can exclude the possibility of unit IVd being related to climax of the Messinian salinity crisis. The MSC occurred during Chron C3r, which is located in Hole 380/380A between 778 and 845 mbsf (Figure 7).
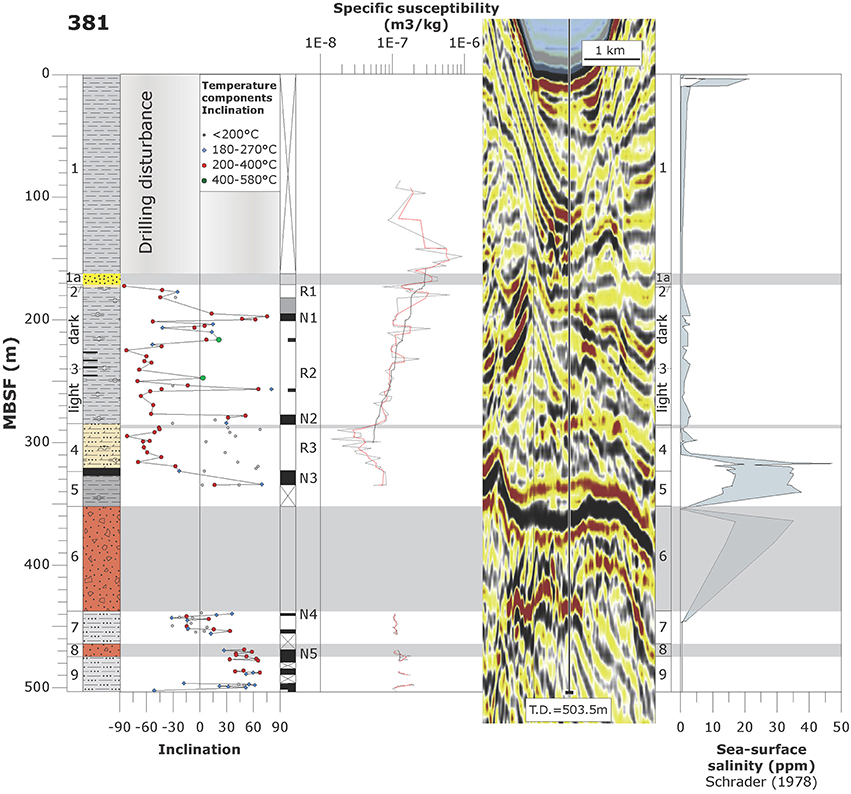
Figure 8. Magnetostratigraphic results for Hole 381 compared to previously published datasets. From left to right: Depth-scale; lithological units; lithology (similar to Figure 1); Measured inclination; Polarity interpretation; Polarity zone label; specific magnetic susceptibility (gray: measured data, red: three point moving average; black: 25 point moving average); Depth converted seismic transect across the drilling location of Hole 380/380A (Tari et al., 2015); lithological units; diatom-based sea-surface salinity (Schrader, 1978). Horizontal gray bars indicate hiatuses in the record.
Hole 381
We focused on the interval of units 2 to 9, between 170 mbsf and the base of the core near 500 mbsf (Figure 8). This interval is bounded at the top by an unconformity and the overlying unit is highly disturbed by drilling (Shipboard Scientific Staff, 1978c). Biostratigraphic correlations indicate that unit 5 at Hole 381 is the equivalent of unit IVc at Hole 380/380A (Schrader, 1978), and should therefore have an age of ~6 Ma. Further correlations to the other sites are based on lithology. The terrigenous muds of unit 1 are correlated to unit I at Hole 380/380A, but specific levels cannot be correlated (Ross, 1978b). Unit 2 at Hole 381 is correlated to unit III at Hole 380/380A. The lacustrine chalk of unit 2 is, however, only two meters thick where at Hole 380/380A it is almost 200 m thick, indicating a large part of this unit needs to be missing in Hole 381.
Five polarity zones are observed. Based on the biostratigraphic correlation to Hole 380/380A (Schrader, 1978) and the age model there, N3 and R3 should represent chron C3An.1n and C3r, respectively. Magnetic susceptibility shows a distinct trend toward lower values between 330 and 290 mbsf. Related to the boundary between units 3 and 4 at 280 mbsf, susceptibility stabilizes at higher values with individual peaks of increasing strength. The change in susceptibility coincides with the introduction of a new diatom assemblage (dominated by Stephanodiscus binderianus a; Schrader, 1978). In Hole 380/380A, this assemblage appears during chron C3n.4n (Thvera), indicating R2 cannot be the upwards continuation of chron C3r (Figure 9). Due to the lack of further age constraints, we can only correlate polarity zones R1, N1, and R2 as younger than chron C3An.4n (Thvera). For units N4, R4, and N5, we do not have independent age constraints, which makes correlation to the GPTS at this stage problematic.
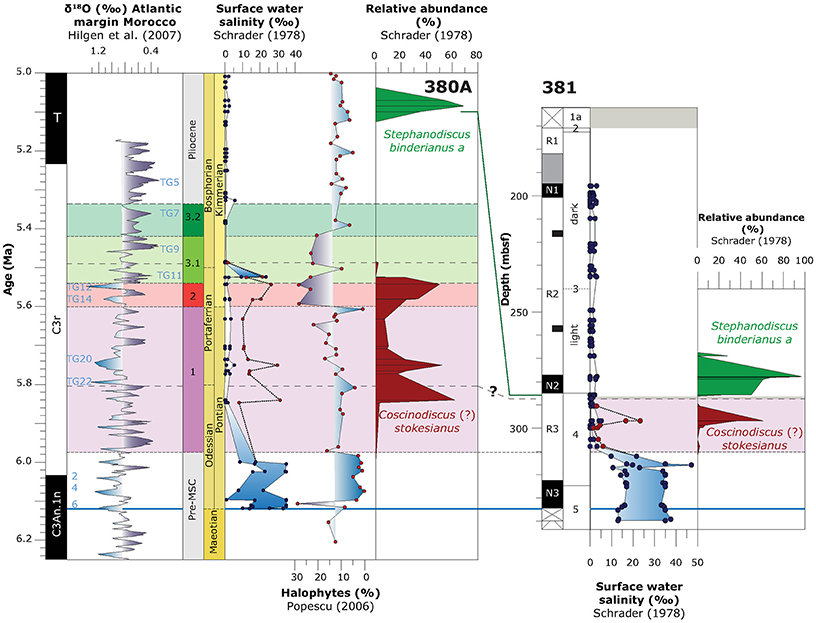
Figure 9. Correlation between Hole 380/380A and Hole 381 for the MSC-related time interval [partly adapted from Van Baak et al. (2015b)]. From left to right for site 380/380A: Age scale; Geomagnetic Polarity (Hilgen et al., 2012); bentic δ18O record of the Atlantic side of Morocco (Hilgen et al., 2007) with (inter) glacial stages indicated; stages of the MSC (Roveri et al., 2014); Paratethyan regional stages (Krijgsman et al., 2010); diatom-based sea-surface salinity at Hole 380/380A (Schrader, 1978), red symbols indicate calculated alternative maximum salinity based on C. (?) Stokesianus; Halophyte pollen record (Popescu, 2006), representative for the proximity of the coastline at site 380/380A; relative abundance of diatom species Stephanodiscus binderianus a and Coscinodiscus (?) stokesianus (Schrader, 1978). From left to right for Hole 381: depth-scale; polarity zones; lithostratigraphic units; diatom-based sea-surface salinity (Schrader, 1978), with in red the alternative maximum salinity based on C. (?) stokesianus; relative abundance of diatom species Stephanodiscus binderianus a and Coscinodiscus (?) stokesianus (Schrader, 1978). Horizontal purple, red, and green bars indicate the separate stages of the MSC, blue line indicates the reconnection between Mediterranean Sea and Paratethys at the base of the Pontian stage (Krijgsman et al., 2010; Chang et al., 2014).
Discussion
Greigite in the DSDP Leg 42B Record
The formation of greigite depends on the balance between organic carbon supply, sulfide production through bacteria and reactive iron concentration (Roberts et al., 2011). The DSDP Leg 42B sediments show the Black Sea has repeatedly switched between freshwater and brackish-marine conditions. Therefore, throughout the record, significant changes in the formation process occurred. Marine conditions in the present-day Black Sea result in a sulfate-rich, anoxic water column where the majority of pyrite is formed above the sediment-water interface (Lyons and Berner, 1992). The main limiting factor on pyrite formation in the water column in the present-day Black Sea is the input of reactive iron in the water column (Wilkin et al., 1997). The formed pyrite is deposited on the sea-floor, where pyrite-growth is dramatically reduced because of the isolation from the reactive iron (Wilkin et al., 1997). This means that in the absence of a process of pyrite formation in the sediment, limited amounts of greigite will be present. This agrees well with the magnetic carriers in Type 6 samples, which represents deposition under anoxic conditions at times of marine connectivity. Type 6 shows the highest amount of pyrite in all studied samples, but no significant greigite contribution is noticed (Figure 3).
Under freshwater conditions, pyrite does not form in the water column, but will grow in the sediment (Wilkin et al., 1997). Water conditions in the Black Sea at times of freshwater conditions may have been similar to the present-day Caspian Sea. Although the Caspian Sea is completely isolated from the world's ocean, it has a salinity in the range of 0–14%0, depending on the proximity to river outlets (Dumont, 1998). Fully freshwater throughout the entire basin would be difficult to achieve, so limited amounts of sulfate will be present to form pyrite in the sediment column.
In the sediment column, pyrite formation typically occurs in the top meters (Kao et al., 2004). Greigite is a precursor of pyrite and over time converts to pyrite through a chain of sulfate reducing reactions (Berner, 1984). The preservation of greigite will therefore depend on the duration of the sediment in the pyritization-window. Since, the sedimentation rate determines the duration in which the material stays in the pyritization-window, it becomes an important factor in greigite preservation relative to pyrite formation (Kao et al., 2004; Aben et al., 2014). A balance between pyrite and greigite is clearly observed in rock-magnetic Types 2–5 (Figures 2, 3). Of these, Type 5 is the richest in pyrite compared to greigite and Type 2 the richest in greigite compared to pyrite. We therefore interpret these observed differences in rock-magnetic properties as largely related to the sedimentation rate during deposition. This fits with the age model for Hole 380/380A, where below 700 mbsf (unit IVb, Type 5), sedimentation rate should be lower than in the upper part (Figure 7).
The (almost complete) lack of pyrite in Types 1–3 indicates burial conditions were not suitable to allow for pyrite growth. These samples are typically found in the upper part of Hole 380/380A (units I, II, III, IVa). For units II, III, and IVa which are deposited under freshwater conditions, it can be argued that the freshwater conditions in combination with the higher sedimentation rate (up to 50 cm/kyr) effectively stopped pyrite formation. Unit I sees the first introduction of enhanced terrigenous material from the Danube (Trimonis et al., 1978). This may have favored the preservation of detrital magnetite over greigite.
Mass Transport Complexes at Hole 380/380A
Seismic studies in the southwestern part of the Black Sea indicate a large amount of mass transport deposits is present in the sedimentary record (Dondurur et al., 2013; Tari et al., 2015). It is therefore important to find out where these may be located in our studied records and at which levels this may compromise a continuous stratigraphy. In the original post-cruise research of Hole 380/380A, the top 260 m of the core was interpreted to suffer from drilling disturbance (Figure 6, column A). Especially in the interval 114–260 mbsf (cores 13–28), mixtures of muds and sandy silt were interpreted as drilling disturbance (Shipboard Scientific Staff, 1978b). This interval coincides very closely to an interval with chaotic magnetization directions and a distinct convex decrease of susceptibility (Figure 6, column B). Comparing with the seismic data across the location of Hole 380A results in the near-perfect overlap of this interval and the uppermost interpreted mass transport complex of (Tari et al., 2015) (Figure 6, column C). We therefore appear to have three independent datasets confirming the presence of a MTC in this part of the core.
A second mass transport complex interpreted by Tari et al. (2015) between 860 and 560 mbsf (Figure 6–column C) is however not straightforwardly recognized in the cores. Only the top of this interval (500–640 mbsf) is characterized by abundant slumped beds (Figure 6–column A). However, the interval 860–560 mbsf is characterized in the paleomagnetic record by periods of stable polarity. In fact, the 860–700 mbsf interval has a good correlation to the global time scale under constant sedimentation rate. Large paleoenvironmental changes occur at 700 mbsf, but this does not appear to coincide with a distinct seismic expression. Unfortunately with the present data we cannot explain this mismatch between datasets.
Correlation between Holes 380/380A and 381
Using our updated age model for holes 380/380A and 381, we try to assess erosional features in this part of the Black Sea and improve previous interpretations. Holes 380/380A and 381 were both on purpose drilled in the southwestern part of the Black Sea, near the Bosporus (Figure 1), hoping that erosion would allow to drill older sediments compared to Hole 379. It is very unfortunate that, based on the interpretation of a single erosional feature represented by unit IVd (380/380A) and unit 6 (381), it has been suggested that the Black Sea experienced a complete desiccation during the Messinian salinity crisis (MSC; Hsü and Giovanoli, 1979). This hypothesis was later substantiated by low-resolution seismic studies indicating a single Messinian erosional surface (MES) links the two holes (Gillet et al., 2007). However, recent integrated studies on land-based sections indicate that a sea-level drop during the MSC did occur, but did not result in the complete desiccation of the Black Sea (Krijgsman et al., 2010). At Hole 380/380A, the erosional surface was shown not to be related to the MSC, but to an (unrelated) older erosional event (Grothe et al., 2014). Recent, seismic studies in this part of the Black Sea even show a complex infill related to channel deposits and erosional surfaces from the present back to the Eocene (Nikishin et al., 2015b). These erosional surfaces are potentially related to a paleo-Bosporus strait, causing subaqueous erosion and sediment transport into the basin (Nikishin et al., 2015a). Furthermore, a large number of mass transport complexes is located along the Black Sea margin (Tari et al., 2015).
Therefore, correlation between Hole 380/380A and 381 is not as straightforward as originally thought and requires a detailed look at the original core material. A correlation for MSC-related events was recently proposed for Hole 380/380A (Van Baak et al., 2015b), indicating deposition was continuous for the during of the MSC (5.97–5.33 Ma). A general trend from high (marine) salinities to lower (fresh) salinities is observed in the MSC time interval (Figure 9). However, interpretation of key intervals are difficult due to a lack of core recovery (Van Baak et al., 2015b). Fortunately, a correlation can be made to Hole 381 and marine units IVc (380/380A) and 5 (381) can be correlated based on lithology and biostratigraphy (Schrader, 1978). Both records show a distinct change in diatom assemblages, with a first lowering of surface water salinities related to the first common occurrence of Coscinodiscus (?) stokesianus (Figure 9). In time this post-dates the normal to reverse polarity reversal at the base of chron C3r of 6.033 Ma. At 381, this interval has near perfect recovery (Shipboard Scientific Staff, 1978c). For events related to the onset of the MSC, it therefore forms a more continuously recovered record than 380/380A. Unfortunately, a hiatus is present at the boundary between units 3 and 4 at 285 mbsf. Abundance peaks of diatom species Coscinodiscus (?) stokesianus and Stephanodiscus binderianus a directly lie on top of each other, while at site 380/380A deposition is continuous and these biostratigraphic markers are separated by ~400 kyr (Figure 9). This does not allow for detailed study of the entire MSC in Hole 381.
Conclusion
We present a greigite-based magnetostratigraphic time frame for the three Holes drilled during DSDP Leg 42B in the Black Sea. Regular changes in depositional conditions have resulted in a wide variety of magnetic properties in the studied cores. However, most of these are deemed reliable for the creation of magnetostratigraphic records. Both holes 379A and 380/380A have long Pleistocene sections deposited under high sedimentation rates. The presence of mass transport deposits compromises a continuous stratigraphic record in part of Hole 380/380A. Hole 381 has many unconformities, hindering the creation of a continuous magnetostratigraphy. The identification of an erosional surface related to the desiccation of the Black Sea during the Messinian salinity crisis (as previously proposed) is not supported by our new age constraints.
Author Contributions
Research was initiated by IV and conducted by CV. DP performed additional measurements. IV, MD, and WK supervised the project. All authors contributed in the writing process.
Conflict of Interest Statement
The authors declare that the research was conducted in the absence of any commercial or financial relationships that could be construed as a potential conflict of interest.
Acknowledgments
Staff at the IODP Bremen Core Repository (BCR) are thanked for their help during sampling. The two reviewers are thanked for their insightful comments. This work was financially supported by the Netherlands Geosciences Foundation (ALW) with support from the Netherlands Organization for Scientific Research (NWO) through the VICI grant of WK and by the Netherlands Research Centre for Integrated Solid Earth Sciences (ISES).
Supplementary Material
The Supplementary Material for this article can be found online at: https://www.frontiersin.org/article/10.3389/feart.2016.00060
References
Aben, F. M., Dekkers, M. J., Bakker, R. R., van Hinsbergen, D. J. J., Zachariasse, W. J., Tate, G. W., et al. (2014). Untangling inconsistent magnetic polarity records through an integrated rock magnetic analysis: a case study on Neogene sections in East Timor. Geochem. Geophys. Geosyst. 15, 2531–2554. doi: 10.1002/2014GC005294
Badertscher, S., Fleitmann, D., Cheng, H., Edwards, R. L., Göktürk, O. M., Zumbühl, A., et al. (2011). Pleistocene water intrusions from the Mediterranean and Caspian seas into the Black Sea. Nat. Geosci. 4, 236–239. doi: 10.1038/ngeo1106
Bahr, A., Lamy, F., Arz, H., Kuhlmann, H., and Wefer, G. (2005). Late glacial to Holocene climate and sedimentation history in the NW Black Sea. Mar. Geol. 214, 309–322. doi: 10.1016/j.margeo.2004.11.013
Berner, R. (1984). Sedimentary pyrite formation: an update. Geochim. Cosmochim. Acta 48, 605–615. doi: 10.1016/0016-7037(84)90089-9
Chang, L., Vasiliev, I., Van Baak, C. G. C., Krijgsman, W., Dekkers, M. J., Roberts, A. P., et al. (2014). Identification and environmental interpretation of diagenetic and biogenic greigite in sediments: a lesson from the Messinian Black Sea. Geochem. Geophys. Geosyst. 15, 3612–3627. doi: 10.1002/2014GC005411
Channell, J. E. T., Freeman, R., Heller, F., and Lowrie, W. (1982). Timing of diagenetic haematite growth in red pelagic limestones from Gubbio (Italy). Earth Planet. Sci. Lett. 58, 189–201. doi: 10.1016/0012-821X(82)90193-5
Channell, J. E. T., Mazaud, A., Sullivan, P., Turner, S., and Raymo, M. E. (2002). Geomagnetic excursions and paleointensities in the Matuyama Chron at Ocean drilling program sites 983 and 984 (Iceland Basin). J. Geophys. Res. 107, EPM 1-1–EPM 1-14. doi: 10.1029/2001JB000491
Dankers, P. H. M., and Zijderveld, J. D. A. (1981). Alternating field demagnetization of rocks, and the problem of gyromagnetic remanence. Earth Planet. Sci. Lett. 53, 89–92. doi: 10.1016/0012-821X(81)90029-7
Dondurur, D., Küçük, H. M., and Çifçi, G. (2013). Quaternary mass wasting on the western Black Sea margin, offshore of Amasra. Glob. Planet. Change 103, 248–260. doi: 10.1016/j.gloplacha.2012.05.009
Dumont, H. J. (1998). The Caspian Lake: history, biota, structure, and function. Limnol. Oceanogr. 43, 44–52. doi: 10.4319/lo.1998.43.1.0044
Egli, R., Chen, A. P., Winklhofer, M., Kodama, K. P., and Horng, C.-S. (2010). Detection of noninteracting single domain particles using first-order reversal curve diagrams. Geochem. Geophys. Geosyst. 11:Q01Z11. doi: 10.1029/2009GC002916
Gheorghian, M. (1978). 40. micropaleontological investigations of sediments from sites 379, 380, and 381 of leg 42B, in Initial Reports of the Deep Sea Drilling Project, eds D. A. Ross and Y. P. Neprochnov (Washington, WA: U.S. Government Printing Office), 783–787.
Gillet, H., Lericolais, G., and Réhault, J.-P. (2007). Messinian event in the black sea: evidence of a Messinian erosional surface. Mar. Geol. 244, 142–165. doi: 10.1016/j.margeo.2007.06.004
Giovanoli, F. (1979). Die Remanente Magnetisierung von Seesedimenten: Mitteilungen aus dem Geologischen Institut der Eidg. Technischen Hochschule und der Universitaet Zuerich, Neue Folge Nr. 230, Geologischen Institut; ETH Zurich.
Grothe, A., Sangiorgi, F., Mulders, Y. R., Vasiliev, I., Reichart, G.-J., Brinkhuis, H., et al. (2014). Black Sea desiccation during the Messinian Salinity Crisis: fact or fiction? Geology 42, 563–566. doi: 10.1016/j.archoralbio.2016.05.005
Heslop, D., McIntosh, G., and Dekkers, M. J. (2004). Using time- and temperature-dependent Preisach models to investigate the limitations of modelling isothermal remanent magnetization acquisition curves with cumulative log Gaussian functions. Geophys. J. Int. 157, 55–63. doi: 10.1111/j.1365-246X.2004.02155.x
Hilgen, F. J., Kuiper, K. F., Krijgsman, W., Snel, E., and Van der Laan, E. (2007). Astronomical tuning as the basis for high resolution chronostratigraphy: the intricate history of the Messinian Salinity Crisis. Stratigraphy 4, 231–238.
Hilgen, F. J., Lourens, L. J., and Van Dam, J. A. (2012). The neogene period, in The Geological Time Scale 2012, eds F. M. Gradstein, J. G. Ogg, M. D. Schmitz, and G. M. Ogg (Amsterdam: Elsevier BV), 947–1002.
Hsü, K. J., and Giovanoli, F. (1979). Messinian event in the Black Sea. Palaeogeogr. Palaeoclimatol. Palaeoecol. 29, 75–93. doi: 10.1016/0031-0182(79)90075-0
Hsü, K. J., and Kelts, K. (1978). Late neogene chemical sedimentation in the Black Sea. Spec. Publs int. Ass. Sediment 2, 129–145.
Hüsing, S. K., Dekkers, M. J., Franke, C., and Krijgsman, W. (2009). The Tortonian reference section at Monte dei Corvi (Italy): evidence for early remanence acquisition in greigite-bearing sediments. Geophys. J. Int. 179, 125–143. doi: 10.1111/j.1365-246X.2009.04301.x
Jousé, A. P., and Mukhina, V. V. (1978). 42. Diatom units and the paleogeography of the Black Sea in the Late Cenozoic (DSDP, Leg 42B), in Initial Reports of the Deep Sea Drilling Project, eds D. A. Ross and Y. P. Neprochnov (Washington, WA: U.S. Government Printing Office), 903–950.
Kao, S.-J., Horng, C.-S., Roberts, A. P., and Liu, K.-K. (2004). Carbon–sulfur–iron relationships in sedimentary rocks from southwestern Taiwan: influence of geochemical environment on greigite and pyrrhotite formation. Chem. Geol. 203, 153–168. doi: 10.1016/j.chemgeo.2003.09.007
Kojumdgieva, E. (1979). Critical notes on the stratigraphy of Black Sea Boreholes (Deep Sea Drilling Project, Leg 42 B). Geologica Balcanica 9, 107–110.
Kojumdgieva, E. (1983). Palaeogeographic environment during the desiccation of the Black Sea. Palaeogeogr. Palaeoclimatol. Palaeoecol. 43, 195–204. doi: 10.1016/0031-0182(83)90011-1
Krijgsman, W., Stoica, M., Vasiliev, I., and Popov, V. V. (2010). Rise and fall of the Paratethys Sea during the Messinian Salinity Crisis. Earth Planet. Sci. Lett. 290, 183–191. doi: 10.1016/j.epsl.2009.12.020
Kruiver, P. P., Dekkers, M. J., and Heslop, D. (2001). Quantification of magnetic coercivity components by the analysis of acquisition curves of isothermal remanent magnetisation. Earth Planet. Sci. Lett. 189, 269–276. doi: 10.1016/S0012-821X(01)00367-3
Lisiecki, L. E., and Raymo, M. E. (2005). Paleomagnetism.org: an online multi-platform open source environment for paleomagnetic data analysis. Paleoceanography 20, PA1003. doi: 10.1029/2004PA001071
Lyons, T. W., and Berner, R. A. (1992). Carbon-sulfur-iron systematics of the uppermost deep-water sediments of the Black Sea. Chem. Geol. 99, 1–27. doi: 10.1016/0009-2541(92)90028-4
Major, C. O., Ryan, W. B. F., Lericolais, G., and Hajdas, I. (2002). Constraints on Black Sea outflow to the Sea of Marmara during the last glacial-interglacial transition. Mar. Geol. 190, 19–34. doi: 10.1016/S0025-3227(02)00340-7
Matoshko, A. V., Gozhik, P. F., and Danukalova, G. (2004). Key Late Cenozoic fluvial archives of eastern Europe: the dniester, dnieper, don and volga. Proc. Geol. Assoc. 115, 141–173. doi: 10.1016/S0016-7878(04)80024-5
Matoshko, A. V., Gozhik, P. F., and Semenenko, V. (2009). Late Cenozoic fluvial development within the Sea of Azov and Black Sea coastal plains. Glob. Planet. Change 68, 270–287. doi: 10.1016/j.gloplacha.2009.03.003
Nevesskaya, L. A., Goncharova, I. A., Ilyina, L. B., Paramonova, N. P., and Khondkarian, S. O. (2003). The Neogene stratigraphic scale of the eastern paratethys. Stratigr. Geol. Correl. 11, 105–127.
Newell, A. J. (2005). A high-precision model of first-order reversal curve (FORC) functions for single-domain ferromagnets with uniaxial anisotropy. Geochem. Geophys. Geosyst. 6:Q05010. doi: 10.1029/2004GC000877
Nikishin, A. M., Okay, A. I., Tüysüz, O., Demirer, A., Amelin, N., and Petrov, E. (2015b). The Black Sea basins structure and history: new model based on new deep penetration regional seismic data. Part 1: basins structure and fill. Mar. Petroleum Geol. 59, 638–655. doi: 10.1016/j.marpetgeo.2014.08.017
Nikishin, A. M., Okay, A., Tüysüz, O., Demirer, A., Wannier, M., Amelin, N., et al. (2015a). The Black Sea basins structure and history: new model based on new deep penetration regional seismic data. Part 2: tectonic history and paleogeography. Mar. Petroleum Geol. 59, 656–670. doi: 10.1016/j.marpetgeo.2014.08.018
Percival, S. F. (1978). 39. Indiginous and reworked coccoliths from the Black Sea, in Initial Reports of the Deep Sea Drilling Project, eds D. A. Ross and Y. P. Neprochnov (Washington, WA: U.S. Government Printing Office), 773–781.
Pike, C. R., Roberts, A. P., and Verosub, K. L. (1999). Characterizing interactions in fine magnetic particle systems using first order reversal curves. J. Appl. Phys. 85, 6660. doi: 10.1063/1.370176
Popescu, S.-M. (2006). Late miocene and early pliocene environments in the southwestern Black Sea region from high-resolution palynology of DSDP Site 380A (Leg 42B). Palaeogeogr. Palaeoclimatol. Palaeoecol. 238, 64–77. doi: 10.1016/j.palaeo.2006.03.018
Popescu, S.-M., Biltekin, D., Winter, H., Suc, J.-P., Melinte-Dobrinescu, M. C., Klotz, S., et al. (2010). Pliocene and lower pleistocene vegetation and climate change at the European scale: long pollen records and climatostratigraphy. Quat. Int. 219, 152–167. doi: 10.1016/j.quaint.2010.03.013
Popov, S. V., Antipov, M. P., Zastrozhnov, A. S., Kurina, E. E., and Pinchuk, T. N. (2010). Sea-level fluctuations on the Northern Shelf of the Eastern Paratethys in the oligocene-neogene. Stratigr. Geol. Correl. 18, 200–224. doi: 10.1134/S0869593810020073
Roberts, A. P., Chang, L., Rowan, C. J., Horng, C. S., and Florindo, F. (2011). Magnetic properties of sedimentary greigite (Fe3S4): an update. Rev. Geophys. 49:RG1002. doi: 10.1029/2010RG000336
Roberts, A. P., Pike, C. R., and Verosub, K. L. (2000). First-order reversal curve diagrams: a new tool for characterizing the magnetic properties of natural samples. J. Geophys. Res. 105, 28461–28475. doi: 10.1029/2000JB900326
Ross, D. A. (1978a). 2. Black Sea stratigraphy, in Initial Reports of the Deep Sea Drilling Project, eds D. A. Ross and Y. P. Neprochnov (Washington, WA: U.S. Government Printing Office), 17–26.
Ross, D. A. (1978b). 57. Summary of results of Black Sea drilling, in Initial Reports of the Deep Sea Drilling Project, eds D. A. Ross and Y. P. Neprochnov (Washington, WA: U.S. Government Printing Office), 1149–1178.
Ross, D. A., Neprochnov, Y. P., Hsü, K. J., Stoffers, P., Supko, P., Trimonis, E. S., et al. (1978). Initial Reports of the Deep Sea Drilling Project, Vol. 42, Part 2. U.S. Government Printing Office, Washington, WA.
Roveri, M., Flecker, R., Krijgsman, W., Lofi, J., Lugli, S., Manzi, V., et al. (2014). The Messinian Salinity Crisis: past and future of a great challenge for marine sciences. Mar. Geol. 352, 25–58. doi: 10.1016/j.margeo.2014.02.002
Ryan, W. B. F., Pitman, W. C., Major, C., Shimkus, K., Moskalenko, V., Jones, G. A., et al. (1997). An abrupt drowning of the Black Sea shelf. Mar. Geol. 138, 119–126. doi: 10.1016/S0025-3227(97)00007-8
Sagnotti, L., Roberts, A. P., Weaver, R., Verosub, K. L., Florindo, F., Pike, C. R., et al. (2004). Apparent magnetic polarity reversals due to remagnetization resulting from late diagenetic growth of greigite from siderite. Geophys. J. Int. 160, 89–100. doi: 10.1111/j.1365-246X.2005.02485.x
Schrader, H.-J. (1978). 41. Quaternary through Neogene history of the Black Sea, deduced from the paleoecology of diatoms, silicoflagellates, ebridians, and chrysomonads, in Initial Reports of the Deep Sea Drilling Project, Vol. 42, Part 2 eds D. A. Ross and Y. P. Neprochnov (Washington, WA: U.S. Government Printing Office), 789–901.
Shipboard Scientific Staff (1978a). 3. Site 379, in Initial Reports of the Deep Sea Drilling Project, Vol. 42, Part 2 eds D. A. Ross and Y. P. Neprochnov (Washington, WA: U.S. Government Printing Office), 29–118.
Shipboard Scientific Staff (1978b). 4. Site 380, in Initial Reports of the Deep Sea Drilling Project, Vol. 42, Part 2 eds D. A. Ross and Y. P. Neprochnov (Washington, WA: U.S. Government Printing Office), 119–291.
Shipboard Scientific Staff (1978c). 5. Site 381, in Initial Reports of the Deep Sea Drilling Project, Vol. 42, Part 2 eds D. A. Ross and Y. P. Neprochnov (Washington, WA: U.S. Government Printing Office), 293–355.
Stephenson, A. (1993). Three-axis static alternating field demagnetization of rocks and the identification of natural remanent magnetization, gyroremanent magnetization, and anisotropy. J. Geophys. Res. 98, 373–381. doi: 10.1029/92JB01849
Stoffers, P., Degens, E. T., and Trimonis, E. S. (1978). 12. Stratigraphy and suggested ages of Black Sea sediments cored during Leg 42B, in Initial Reports of the Deep Sea Drilling Project, Vol. 42, Part 2 eds D. A. Ross and Y. P. Neprochnov (Washington, WA: U.S. Government Printing Office), 483–487.
Tari, G., Fallah, M., Kosi, W., Floodpage, J., Baur, J., Bati, Z., et al. (2015). Is the impact of the Messinian Salinity Crisis in the Black Sea comparable to that of the Mediterranean? Mar. Petroleum Geol. 66, 135–148. doi: 10.1016/j.marpetgeo.2015.03.021
Traverse, A. (1978). 44. Palynological analysis of DSDP Leg 42B (1975) cores from the Black Sea, in Initial Reports of the Deep Sea Drilling Project, Vol. 42, Part 2 eds D. A. Ross and Y. P. Neprochnov (Washington, WA: U.S. Government Printing Office), 993–1015.
Trimonis, E. S., and Shimkus, K. M. (1978). 9. Grain-size of the Black Sea sediments, DSDP Leg 42B, in Initial Reports of the Deep Sea Drilling Project, Vol. 42, Part 2 eds D. A. Ross and Y. P. Neprochnov (Washington, WA: U.S. Government Printing Office), 427–450.
Trimonis, E. S., Shimkus, P. P., and Ross, D. A. (1978). 8. Mineral composition of coarse-silt fraction of the Black Sea Late Cenozoic sediments, in Initial Reports of the Deep Sea Drilling Project, Vol. 42, Part 2 eds D. A. Ross and Y. P. Neprochnov (Washington, WA: U.S. Government Printing Office), 413–426.
Van Baak, C. G. C., Mandic, O., Lazar, I., Stoica, M., and Krijgsman, W. (2015a). The Slanicul de Buzau section, a unit stratotype for the Romanian stage of the Dacian Basin (Plio-Pleistocene, Eastern Paratethys). Palaeogeogr. Palaeoclimatol. Palaeoecol. 440, 594–613. doi: 10.1016/j.palaeo.2015.09.022
Van Baak, C. G. C., Radionova, E. P., Golovina, L. A., Raffi, I., Kuiper, K. F., Vasiliev, I., et al. (2015b). Messinian events in the Black Sea. Terra Nova 27, 433–441. doi: 10.1111/ter.12177
Van Baak, C. G. C., Vasiliev, I., Stoica, M., Kuiper, K. F., Forte, A. M., Aliyeva, E., et al. (2013). A magnetostratigraphic time frame for Plio-Pleistocene transgressions in the South Caspian Basin, Azerbaijan. Glob. Planet. Change 103, 119–134. doi: 10.1016/j.gloplacha.2012.05.004
Van Hoof, A. A. M., and Langereis, C. G. (1991). Reversal records in marine marls and delayed acquisition of remanent magnetization. Nature 351, 223–225. doi: 10.1038/351223a0
Vasiliev, I., Dekkers, M. J., Krijgsman, W., Franke, C., Langereis, C. G., and Mullender, T. A. T. (2007). Early diagenetic greigite as a recorder of the paleomagnetic signal in Miocene-Pliocene sedimentary rocks of the Carpathian foredeep (Romania). Geophys. J. Int. 171, 613–629. doi: 10.1111/j.1365-246X.2007.03560.x
Vasiliev, I., Franke, C., Meeldijk, J. D., Dekkers, M. J., Langereis, C. G., and Krijgsman, W. (2008). Putative greigite magnetofossils from the Pliocene epoch. Nat. Geosci. 11, 782–786. doi: 10.1038/ngeo335
Vasiliev, I., Iosifidi, A. G., Khramov, A. N., Krijgsman, W., Kuiper, K. F., Langereis, C. G., et al. (2011). Magnetostratigraphy and radio-isotope dating of upper Miocene - lower Pliocene sedimentary successions of the Black Sea Basin (Taman Peninsula, Russia). Palaeogeogr. Palaeoclimatol. Palaeoecol. 310, 163–175. doi: 10.1016/j.palaeo.2011.06.022
Vasiliev, I., Krijgsman, W., Langereis, C. G., Panaiotu, C. E., Matenco, L., and Bertotti, G. (2004). Towards an astrochronological framework for the eastern Paratethys Mio-Pliocene sedimentary sequences of the Focsani basin (Romania). Earth Planet. Sci. Lett. 227, 231–247. doi: 10.1016/j.epsl.2004.09.012
Vasiliev, I., Krijgsman, W., Stoica, M., and Langereis, C. G. (2005). Mio-Pliocene magnetostratigraphy in the southern Carpathian foredeep and Mediterranean–Paratethys correlations. Terra Nova 17, 376–384. doi: 10.1111/j.1365-3121.2005.00624.x
Wilkin, R., Arthur, M., and Dean, W. (1997). History of water-column anoxia in the Black Sea indicated by pyrite framboid size distributions. Earth Planet. Sci. Lett. 148, 517–525. doi: 10.1016/S0012-821X(97)00053-8
Keywords: Black Sea, greigite, magnetostratigraphy, DSDP Leg 42B, mass transport deposits, Late Miocene, pliocene, pleistocene
Citation: van Baak CGC, Vasiliev I, Palcu DV, Dekkers MJ and Krijgsman W (2016) A Greigite-Based Magnetostratigraphic Time Frame for the Late Miocene to Recent DSDP Leg 42B Cores from the Black Sea. Front. Earth Sci. 4:60. doi: 10.3389/feart.2016.00060
Received: 09 March 2016; Accepted: 01 May 2016;
Published: 18 May 2016.
Edited by:
Juan Cruz Larrasoaña, Instituto Geológico y Minero de España, SpainReviewed by:
Miguel Garces, Universitat de Barcelona, SpainGabor Csaba Tari, Österreichische Mineralölverwaltung, Austria
Copyright © 2016 van Baak, Vasiliev, Palcu, Dekkers and Krijgsman. This is an open-access article distributed under the terms of the Creative Commons Attribution License (CC BY). The use, distribution or reproduction in other forums is permitted, provided the original author(s) or licensor are credited and that the original publication in this journal is cited, in accordance with accepted academic practice. No use, distribution or reproduction is permitted which does not comply with these terms.
*Correspondence: Christiaan G. C. van Baak, c.g.c.vanbaak@uu.nl