Decadal Region-Wide and Glacier-Wide Mass Balances Derived from Multi-Temporal ASTER Satellite Digital Elevation Models. Validation over the Mont-Blanc Area
 Etienne Berthier
 Vincent Cabot
 Christian Vincent2,3
 - 1Laboratoire d'Etudes en Géophysique et Océanographie Spatiales, Université de Toulouse, CNES, Centre National de la Recherche Scientifique, IRD, UPS, Toulouse, France
- 2Centre National de la Recherche Scientifique, LGGE, Grenoble, France
- 3Université Grenoble Alpes, LGGE, Grenoble, France
Since 2000, a vast archive of stereo-images has been built by the Advanced Spaceborne Thermal Emission and Reflection (ASTER) satellite. Several studies already extracted glacier mass balances from multi-temporal ASTER digital elevation models (DEMs) but they lacked accurate independent data for validation. Here, we apply a linear regression to a time series of 3D-coregistered ASTER DEMs to estimate the rate of surface elevation changes (dh/dtASTER) and geodetic mass balances of Mont-Blanc glaciers (155 km2) between 2000 and 2014. Validation using field and spaceborne geodetic measurements reveals large errors at the individual pixel level (>1 m a−1) and an accuracy of 0.2–0.3 m a−1 for dh/dtASTER averaged over areas larger than 1 km2. For all Mont-Blanc glaciers, the ASTER region-wide mass balance [–1.05 ± 0.37 m water equivalent (w.e.) a−1] agrees remarkably with the one measured using Spot5 and Pléiades DEMs (–1.06 ± 0.23 m w.e. a−1) over their common 2003–2012 period. This multi-temporal ASTER DEM strategy leads to smaller errors than the simple differencing of two ASTER DEMs. By extrapolating dh/dtASTER to mid-February 2000, we infer a mean penetration depth of about 9 ± 3 m for the C-band Shuttle Radar Topographic Mission (SRTM) radar signal, with a strong altitudinal dependency (range 0–12 m). This methodology thus reveals the regional pattern of glacier surface elevation changes and improves our knowledge of the penetration of the radar signal into snow and ice.
Introduction
In response to global warming, glaciers are losing mass nearly everywhere on Earth and significantly contribute to sea level rise (Vaughan and Comiso, 2013). The global glacier mass loss is relatively well-constrained during 2003–2009 thanks to the combined availability of field measurements, spaceborne laser altimetry (ICESat), and gravimetry (GRACE) data (e.g., Gardner et al., 2013). However, outside of this short 6-year time window, our knowledge of global and region-wide glacier mass balances is more uncertain. Glaciological field measurements can span several decades but are restricted to a few tenth of glaciers not necessarily representative of the rest (Gardner et al., 2013; Zemp et al., 2015). GRACE is not able to resolve the mass balance of individual glaciers and of small glaciated regions (Jacob et al., 2012). ICESat stopped operating in 2009 and the launch of its successor, ICESat2, is scheduled for 2017. Further, satellite laser altimetry provides a sparse spatial sampling and is appropriate for sufficiently large regions only (e.g., Kääb et al., 2015). The geodetic method, based on the differencing of digital elevation models (DEMs) derived from historical maps and satellite data, is one of the alternatives to the above-mentioned techniques of mass balance measurements, in particular for regional assessment of geodetic glacier mass balances (e.g., Gardner et al., 2012; Gardelle et al., 2013; Pieczonka and Bolch, 2015).
To date the geodetic method has most often been applied to pairs of DEMs. One limitation of this strategy is the need to obtain two DEMs sufficiently precise to detect significant changes in glacier surface elevation. Recently, this limitation has partly been overcome by processing less precise but numerous DEMs derived from optical stereo-imagery acquired by the Advanced Spaceborne Thermal Emission and Reflection (ASTER) sensor onboard the TERRA satellite. This multi-temporal ASTER DEM strategy has been pioneered over the Everest area (Nuimura et al., 2012) and the Northern Patagonian Icefield (Willis et al., 2012a), and later applied to the Southern Patagonian and Cordillera Darwin icefields (Willis et al., 2012b; Melkonian et al., 2013), to the Juneau Icefield in Alaska (Melkonian et al., 2014) and to two glaciers in New-Zealand (Wang and Kääb, 2015). Among these studies, only Nuimura et al. (2012) had some reference Global Navigation Satellite System (GNSS) data to evaluate the accuracy of their elevation change measurements on glaciers. However, Nuimura et al.'s validation was restricted to four locations on the debris-covered area of Khumbu Glacier (Everest), a highly textured surface rather favorable for DEM generation from medium resolution optical stereo-images. Further, the time spans covered by the GNSS measurements (1995–2004) and the DEMs (1992–2008) slightly differed. Thus, to our knowledge, no evaluation of this method has yet been performed in the debris free and accumulation areas of glaciers and at regional scale.
The goal of the present study is to describe and evaluate a methodology to map the decadal rate of glacier surface elevation change (dh/dt) from multi-temporal ASTER DEMs. Our processing strategy presents some slight differences with previous similar efforts described above. The main added value of our contribution is that dh/dt and region-wide geodetic mass balances are carefully validated thanks to accurate independent spaceborne and field measurements. As a side (yet important) product, our study also provides an estimate for the depth of the scattering phase center into snow, firn, and ice (referred to, for simplicity, as the penetration depth in the rest of the article) of the Shuttle Radar Topographic Mission (SRTM) C-Band radar signal into Alpine glaciers (Rignot et al., 2001; Berthier et al., 2006; Fischer et al., 2015).
Our study site is the Mont-Blanc area and includes about ~155 km2 of glaciers (Figure 1). Glaciological field measurements are performed routinely on several glaciers including the Mer de Glace and Argentière Glacier (Vincent et al., 2009, 2014; Six and Vincent, 2014). In the past, this massif has proved to be appropriate to evaluate new remote sensing techniques of glacier monitoring (Berthier et al., 2004, 2005, 2014). The recent wastage of several glaciers in the Mont-Blanc area has been described in different studies (e.g., Diolaiuti et al., 2012; Fischer et al., 2014, 2015; Gardent et al., 2014; Smiraglia et al., 2015).
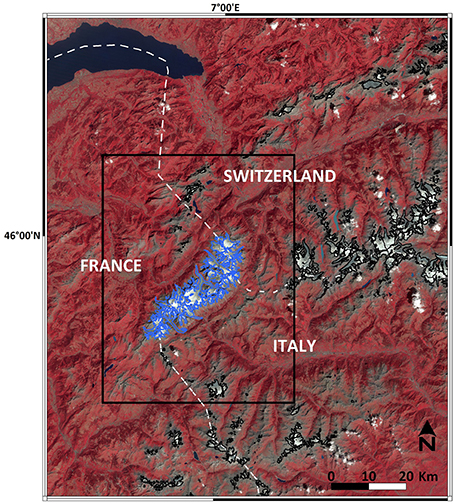
Figure 1. The Mont-Blanc study area. The blue polygons correspond to our own inventory of Mont-Blanc glaciers, whereas the black polygons correspond to the Paul et al. (2011)'s inventory. The black box frames the area shown in Figure 4. The background image was acquired by Landsat5-TM on 13 August 2013.
Data
ASTER DEMs
Since December 1999, numerous stereo-images have been acquired by the ASTER sensor onboard the TERRA satellite platform. The Global Land Ice Measurement from Space (GLIMS) project has been coordinating the data acquisition requests from the glaciological community and has been suggesting the best acquisition parameters for ASTER images acquired over glaciated regions. Fine tuning the gain of the optical sensor is crucial to avoid saturation of images over bright snow-covered areas (Raup et al., 2000; Korona et al., 2009). As a result of these efforts, a vast archive of ASTER stereo-images spanning over 16 years is available, with typically tens up to hundreds of images over a given site.
We used the AST14DMO products available through the ECHO/REVERB website (http://reverb.echo.nasa.gov/). For each ASTER scene covering 60 km by 60 km, this product includes an orthorectified image for each spectral band and a DEM with a horizontal posting of 30 m. This product has been derived from the raw ASTER images by the Land Processes Distributed Active Archive Centre (LPDAAC) using the orbital ancillary data, without ground control points (GCPs).
We downloaded 64 DEMs intersecting a polygon drawn around the Mont-Blanc area. They were derived from images acquired between 2000 and 2014 with a cloud cover lower than 40% and intersecting at least 5% of the Mont-Blanc glacier area. By screening the image quick-looks in the online catalog, this percentage was chosen as an appropriate upper limit for the relative cloud coverage. It limited the number of images to be processed while retaining the most useful scenes.
Our processing strategy was applied to two temporal subsets: the 64 “all-season” DEMs and the 31 “summer” DEMs. Following standard glaciological practices and to match the dates of our validation data, it would be preferable to process only late summer DEMs, i.e., between 15 August and 15 October. However, for several years no ASTER DEM was acquired during these 2 months. Thus, ASTER DEMs acquired in June and July were also included in our selection of 31 “summer” DEMs (Supplementary Table 1).
Reference DEMs: SRTM DEM and ASTER GDEMv2
Our method is based on the 3D coregistration of each ASTER DEM to a reference DEM off-glacier. We compared the results obtained using two reference DEMs available at a horizontal posting of 1 arc-second, about 30 m. Given its higher precision and well-defined timestamp, our main reference DEM was the one derived from C-Band images acquired during the SRTM flown in February 2000 (Farr et al., 2007). We used a version of the SRTM DEM for which the data gaps have not been interpolated nor filled using an external DEM. It was downloaded from the United State Geophysical Survey (USGS) website. We also tested our methodology using the second version of the ASTER Global DEM, GDEMv2, which was built by stacking all ASTER DEMs acquired between 2000 and ~2010. The timestamp of GDEMv2 is not known (Frey and Paul, 2012; Kargel et al., 2014) but this should not be problematic for the global 3D coregistration using the off-glacier, mostly stable terrain.
Validation Data: Spot5 and Pléiades DEMs and Field Measurements
The rates of surface elevation changes derived from ASTER DEMs (referred to as dh/dtASTER in the following) during 2003–2012 over the entire Mont-Blanc area were validated with respect to the rates of surface elevation changes obtained by differencing a Pléiades DEM (21 August 2012) from a Spot5 DEM (19 August 2003). A description of the generation of these two 10-m DEMs and their relative adjustment is available in Berthier et al. (2014). The uncertainty in this dh/dtPléiades−Spot5 map (± 0.14 m a−1) was determined on the Mer de Glace and Argentière Glacier at eight transverse profiles surveyed using GNSS measurements in early September 2003 and 2012. Accurate annual elevation measurements at these eight profiles (Vincent et al., 2009, 2014) were also available over the entire study period (2000–2014). The glacier-wide geodetic mass balances derived from dh/dtASTER were also validated using the glaciological mass balances measured on Argentière Glacier and Mer de Glace with an uncertainty of 0.4 m w.e. a−1 (Thibert et al., 2008; Six and Vincent, 2014).
Outlines of Glaciers and Lakes
3D coregistration of the DEMs should be performed on stable terrain and over regions where the DEMs are least error-prone (Paul et al., 2015). Thus, glaciers and lakes need to be excluded. Detailed recent glacier inventories were published separately for the French, Italian, and Swiss parts of the Mont-Blanc massif (Fischer et al., 2014; Gardent et al., 2014; Smiraglia et al., 2015). However, merging these diachronic national glacial inventories would be a difficult task. Thus for the sake of homogeneity, we used our own outlines, drawn manually on a Spot5 2.5 m ortho-image acquired 23 August 2003 (Berthier et al., 2014). Our outlines are preferred to the Randolph Glacier Inventory ones (RGI, Pfeffer et al., 2014) because of their higher resolution. Outlines of the few glaciers outside of the Mont-Blanc massif itself, but inside our study region (Figure 1), were obtained from the RGI and were extracted from Landsat images also acquired in summer 2003 (Paul et al., 2011). Lake outlines were drawn manually on ASTER ortho-images.
Cloud Masks
Our processing chain includes several steps to exclude gross outliers and our initial hypothesis was that anomalous elevations in the ASTER DEMs due to clouds would be automatically detected and excluded. To verify this assumption, we derived dh/dtASTER with and without cloud masks applied to the 2003–2012 summer ASTER DEMs. Clouds were contoured manually on each ASTER ortho-image and refined by overlaying the initial cloud polygon on the corresponding ASTER DEM.
Method
Our methodology was based on the 3D coregistration of multi-temporal ASTER DEMs off-glacier to a reference DEM (Nuimura et al., 2012; Willis et al., 2012a) before calculating a linear fit through the elevation time series to infer dh/dtASTER. Contrary to Wang and Kääb (2015), our methodology did not aim at capturing short-term (i.e., seasonal or inter-annual) variations. An originality of our processing was that the exclusion of outliers was based on a linear fit to the elevation time series (section Correction of Vertical Biases) and did not require choosing an a priori threshold on the maximum accepted rates of thinning/thickening in the ablation/accumulation areas. The main steps of our methodology were summarized in a flowchart (Figure 2).
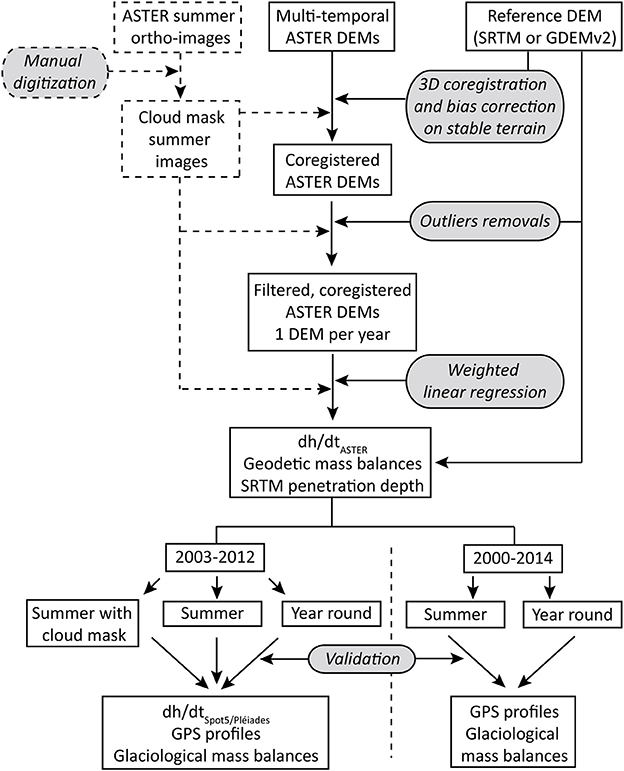
Figure 2. Flowchart of the methodology followed to measure the rate of surface elevation changes (dh/dtASTER) from multi-temporal ASTER DEMs. The dashed lines (arrows and boxes) correspond to the optional masking of clouds only tested on summer ASTER images.
Horizontal Coregistration to the Reference DEM
Horizontal coregistration of individual ASTER DEMs was performed by minimizing the standard deviation of the elevation differences with the reference DEM on stable terrain with slopes smaller than 45° (Rodriguez et al., 2006; Berthier et al., 2007) because DEMs derived from optical stereo-images are less precise over steep terrain (Toutin, 2002). The upper limit for slope (45°) was arbitrary but supported by the fact that 95% of the glaciated surfaces of the Mont-Blanc area exhibited slopes lower than 45°. Pixels over nearly flat terrain (i.e., slopes lower than 4°) were also excluded as they did not constrain the retrieval of the mean horizontal shift between two DEMs. Large outliers, i.e., DEM pixels for which the elevation differences with the reference DEM are larger than 100 m, were excluded. Values of the horizontal shift and statistics before and after the horizontal coregistration are listed in Supplementary Table 1 for the summer ASTER DEMs only (for the sake of concision), even though the horizontal coregistration was applied to the entire archive.
Correction of Vertical Biases
Next, different types of vertical biases potentially affecting the ASTER DEMs were corrected (Nuth and Kääb, 2011; Gardelle et al., 2013). These vertical biases were assessed using all reliable measurements of elevation difference (typically 3 000 000 pixels) over stable terrain. We excluded glaciers, lakes, steep terrain (over 45°) and pixels for which the absolute elevation differences between each ASTER DEM and the reference DEM were larger than 50 m, a value corresponding roughly to three times the standard deviation of the elevation differences off-glacier (Supplementary Table 1). We first corrected for biases along and across the satellite track. Then, the biases due to difference in resolution of the DEMs were modeled using the terrain curvature. See Gardelle et al. (2013) for a more detailed description of these corrections.
Exclusion of Outliers
DEMs derived from medium resolution satellite optical images with a limited radiometric depth (images coded over eight bits, i.e., 256 digital numbers) are known to include numerous outliers, especially over steep terrain and over poorly contrasted snow-covered areas (e.g., Kääb, 2002; Toutin, 2002; Wang and Kääb, 2015). These outliers need to be excluded if one wish to extract reliable dh/dt from times series of ASTER DEMs. This was done in three steps:
(1) We excluded all DEM pixels for which the elevations were outside of the known elevation range of our study area (400 m a.s.l. to 5000 m a.s.l.).
(2) We excluded all DEM pixels for which the elevation difference with the median of all available DEMs (the reference DEM and all ASTER DEMs) at this pixel is outside of an acceptable range. The known maximum absolute dh/dt over Mont-Blanc glaciers during 2003–2012 was 10 m a−1 (Berthier et al., 2014). Taking into account the 14-year time interval covered by the ASTER DEMs (2000–2014), the maximum absolute elevation change was 140 m i.e., approximately ± 70 m around 2007, the mean date of our DEMs series. To avoid excluding real glacier elevation changes, the range of acceptable values was augmented by ± 30 m and thus fixed at ± 100 m.
(3) Then, for each pixel, a linear regression was fitted to the elevation time series. All elevations that fell outside of the 99% confidence interval of the fit were excluded (Figures 3A,C,E).
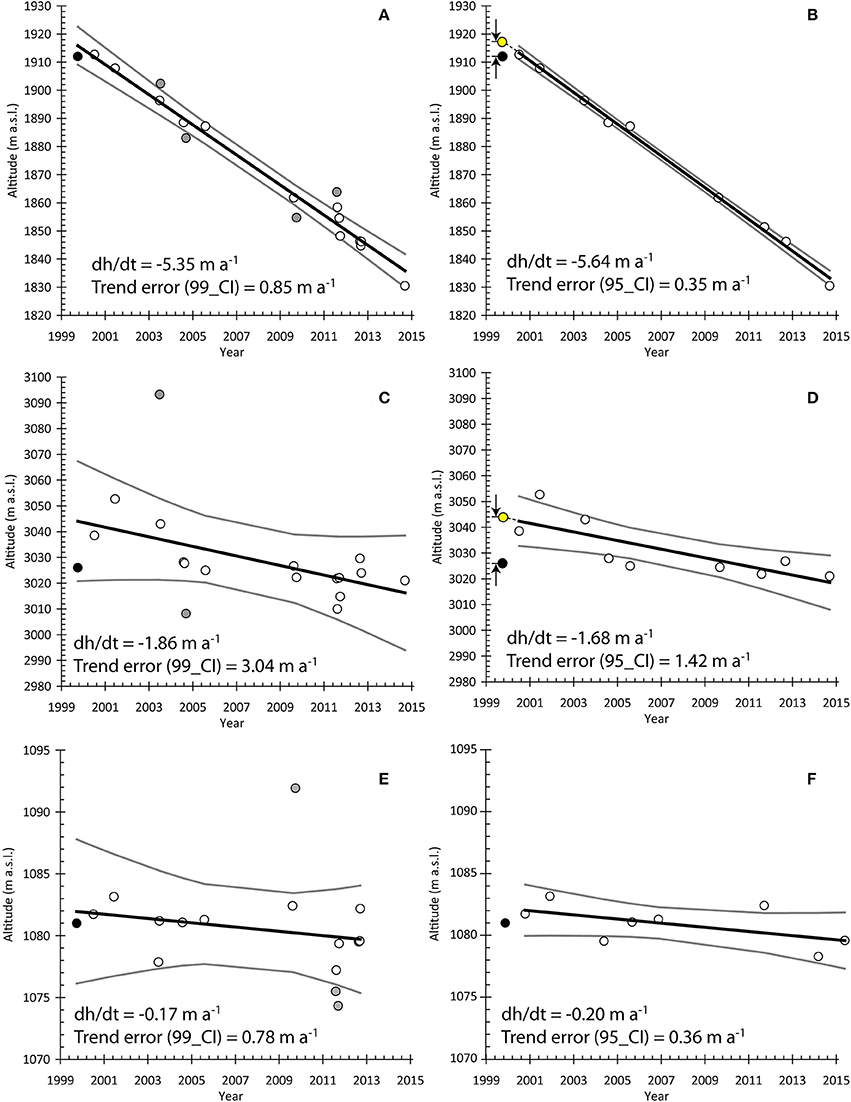
Figure 3. 2000–2014 elevation time series (m a.s.l.) from summer ASTER DEMs (white and gray dots) at three pixels located in Figure 5 and chosen to illustrate different behaviors and noise levels in the DEM time series: in the lower part (panels A and B) and just above the equilibrium line altitude (panels C and D) of the Mer de Glace, and a pixel off-glacier in the Chamonix Valley (panels E and F). Black dots represent SRTM elevations. The left panels (A,C,E) show the result of a first linear regression through ASTER and SRTM elevations. The gray dots, lying outside the 99% confidence interval (gray lines), are excluded from subsequent analysis. The right panels (B,D,F) show the weighted linear regressions (dh/dtASTER) after exclusion of outliers and their 95% (2-sigma) confidence intervals (gray lines). Panels (B) and (D) also illustrate how the SRTM C-Band penetration depth into snow and ice is inferred by extrapolating the 2000–2014 dh∕dtASTER to mid-February 2000, the acquisition date of the SRTM DEM (yellow dot).
Extraction of dh/dtASTER and Glacier-Wide Geodetic Mass Balance
The number of ASTER DEMs acquired during a given calendar year varied from 1 to 9 over our study area. To avoid putting too much weight on years with more ASTER DEMs, we retained only one elevation per pixel and per calendar year (Wang and Kääb, 2015). If two DEMs were available, the mean elevation and mean date were calculated. If three or more DEMs were available, the median elevation was used and the date of the ASTER DEM corresponding to this median elevation was retained.
Then, for each pixel, a weighted linear regression was fitted to the elevation time series in order to extract dh/dtASTER on glaciers and off-glacier (Figures 3B,D,F). The weight for each ASTER DEM was inversely proportional to the standard deviation of the elevation differences off-glacier with the reference DEM. The reference DEM was not used in this second linear regression. This exclusion was important (1) because the penetration of the C-Band radar signal into snow and ice would biased our estimate of dh/dtASTER (case where the reference DEM was SRTM) or (2) because the ASTER GDEMv2, as a combination of multi-temporal DEMs, has no well-defined timestamp. The 95% confidence interval of the slope of the regression line (95_CI) was computed. It is an indicator of the quality of the linear fit and was used to exclude some of the remaining outliers. The maximum accepted value for 95_CI (3 m a−1) was chosen empirically after visual examination of the dh/dtASTER map in order to exclude areas of obviously anomalous dh/dt corresponding to high values of 95_CI.
From dh/dtASTER, the region-wide and glacier-wide mass balances were computed using the same assumptions as for our recent geodetic mass balance study (Berthier et al., 2014). For each 50-m elevation band, the histogram of dh/dt was computed and the distribution approximated by a Gaussian curve. This permitted the calculation of the mean thickness change as the average of all the values within three standard deviations from the mode of the Gaussian curve (Berthier et al., 2004; Gardner et al., 2012). Where no elevation change was available for a pixel (generally less than 10% of the glacier area), we assigned to it the value of the mean dh/dtASTER of the 50-m elevation band it belonged to, in order to assess the mass balance over the whole glacier area. Geodetic volume changes were converted to mass balances using a density of 850 ± 60 kg m−3 (Huss, 2013).
Estimate of the Penetration Depth of the SRTM Radar Signal
Our method to infer the depth of the SRTM penetration depth is following Wang and Kääb (2015) and illustrated in Figures 3B,D. For each pixel, we linearly extrapolated dh/dtASTER to the acquisition date of the SRTM DEM to reconstruct the glacier topography in mid-February 2000. Then, by subtracting the SRTM DEM from this reconstructed DEM, we generated a map of the penetration depth of the C-Band radar signal over Mont-Blanc glaciers (the total number of pixels is ~170000).
For this estimate of the penetration depth, the ASTER DEMs were processed for the full time period (2000–2014) to minimize uncertainties due to the temporal extrapolation from the earliest ASTER DEM (2 July 2000) to the date of the SRTM DEM (mid-February 2000). Two cases were distinguished in order to illustrate the sensitivity of our estimates of the SRTM penetration depth to different input data. In case one, the SRTM DEM was used as the reference DEM off-glacier and ASTER DEMs acquired during all seasons were used to extract dh/dtASTER. In case two, ASTER GDEMv2 was the reference DEM off-glacier and dh/dtASTER were extracted from summer ASTER DEMs.
Validation of dh/dtASTER and Formal Uncertainties
Validation Off-Glacier and on Glaciers
dh/dtASTER was validated both off-glacier where no elevation change was expected and on glaciers where accurate field and spaceborne measurements were available.
We split the off-glacier terrain around the Mont-Blanc in 4 by 4 tiles. This number of tiles (16) was chosen so that the area included in each tile was similar to the glaciated area in the Mont-Blanc (ca. 150 km2). For each tile, we computed the mean (and median, not shown because very similar to the mean) dh/dtASTER off-glacier. This strategy aimed at visualizing and quantifying spatially-varying biases in dh/dtASTER (Figure 4). Our error off-glacier (Err_off_gla, Table 1) was calculated using the mean absolute difference for these 16 tiles so is representative of an area of about 150 km2.
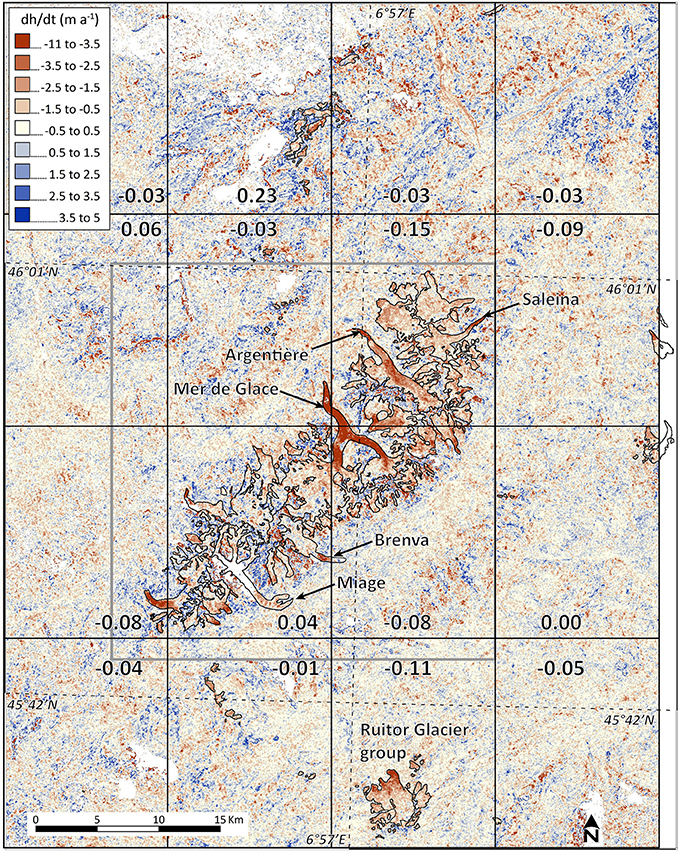
Figure 4. Rate of surface elevation changes on and around the Mont-Blanc area between 2000 and 2014 from summer ASTER DEMs. Data gaps in dh/dtASTER are shown in white. The study area has been divided into 4 by 4 tiles in which the mean dh/dtASTER (m a−1) off-glacier is given. The gray box frames the area shown in Figure 5.
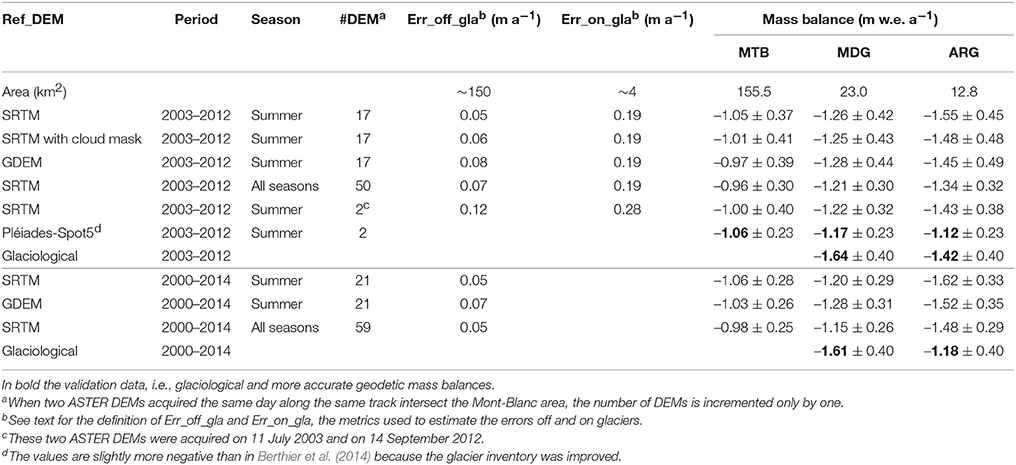
Table 1. dh/dtASTER errors and glacier mass balances for the Mont-Blanc (MTB), Mer de Glace (MDG), and Argentière Glacier (ARG) derived from ASTER DEMs, with different input data and for two periods (2003–2012 and 2000–2014).
Over Mont-Blanc glaciers during 2003–2012, we also validated dh/dtASTER against dh/dtSpot5∕Pléiades (Figure 5). For each 50-m elevation band (69 in total between 1400 m and 4850 m a.s.l.), the absolute difference between these two estimates of dh/dt was computed. The dh/dtASTER error on glacier (Err_on_gla in Table 1) was estimated as the area-weighted average of these absolute elevation differences. Thus, by construction, the averaging area for Err_on_gla was about 4 km2 (the mean area in each 50-m elevation band), thus much smaller than for Err_off_gla (150 km2).
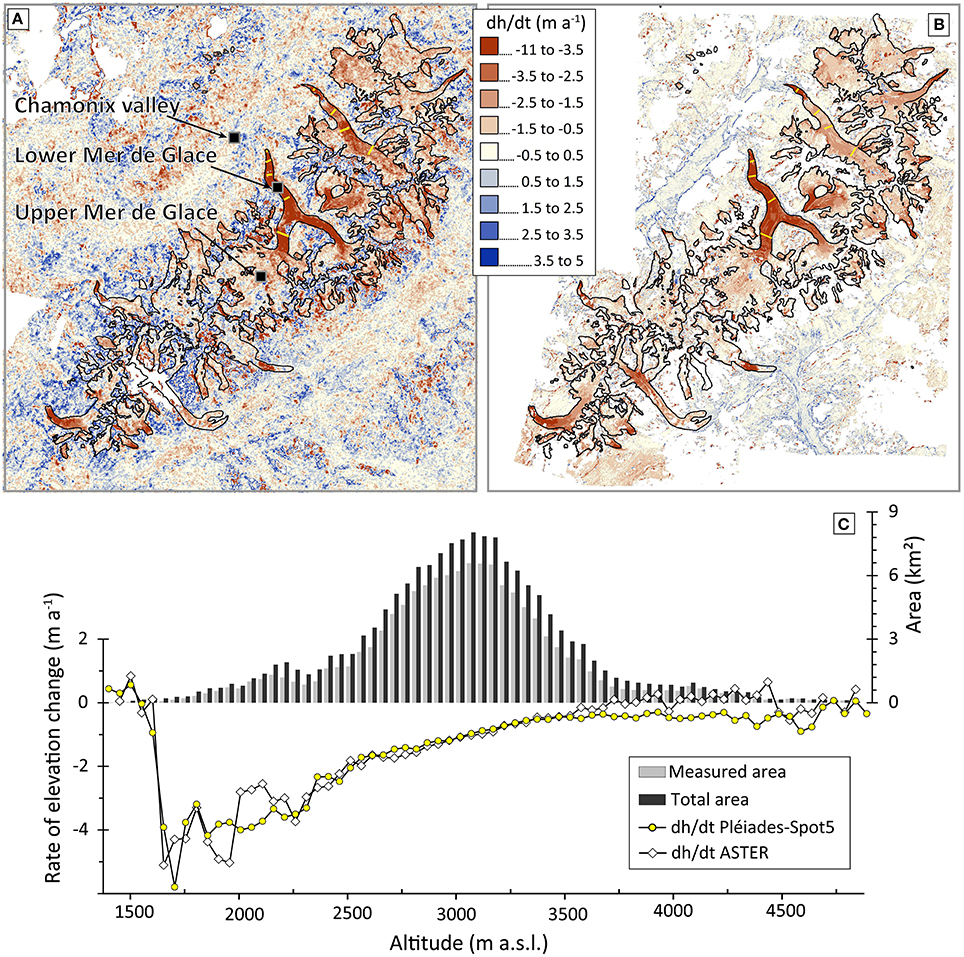
Figure 5. Rate of surface elevation changes on and around the Mont-Blanc area between 2003 and 2012 (A) from multiple summer ASTER DEMs and (B) from Spot5/Pléiades DEM differencing. The three black squares in (A) locate the elevation time series shown in Figure 3 and the thick yellow lines located in (A,B) the GNSS profiles surveyed each year in September. The lowermost profile on the Mer de Glace is now fully deglaciated and not used for the validation. (C) Rate of surface elevation changes as a function of altitude over Mont-Blanc glaciers: yellow dots represent dh/dt from Spot5/Pléiades DEMs, white diamonds dh/dt from ASTER DEMs. The lowermost points (below 1500 m a.s.l.) with reduced elevation changes correspond to the highly debris-covered lower tongue of Brenva Glacier. The upper histograms in panel c show the total glaciated area (black bars) and the area sampled in dh/dtASTER (gray bars) for each 50-m elevation band.
Finally, we validated the geodetic mass balances from dh/dtASTER for all Mont-Blanc (155 km2), Mer de Glace (23 km2), and Argentière (13 km2) glaciers using geodetic mass balances derived from dh/dtSpot5∕Pléiades. Because the same glacier outlines and density assumptions were used in both cases, differences in region-wide and glacier-wide mass balances were assumed to directly reflect errors in dh/dt. The glacier-wide geodetic mass balances are also validated using the cumulative glaciological mass balances for the Mer de Glace and Argentière Glacier during 2003–2012 and 2000–2014.
Uncertainties in dh∕dtASTER
To complement the above-described validation, we calculated a formal uncertainty for dh/dtASTER at the 68% confidence interval (1-sigma) level that could be applied for glaciated areas where no validation data is available. There were three main sources of errors affecting our dh/dt measurements: (1) random and systematic errors in the acquisition and coregistration of the ASTER DEMs; (2) the fact that glacier surface elevation changes may not follow the assumed temporal linear trend; and (3) the errors originating from the irregular sampling of the seasonal cycle of glacier surface elevation changes. We describe below how these three independent sources of errors were estimated.
(1) DEM errors (σDEM). This source of error was quantified off-glacier as described in section Validation Off-glacier and on Glaciers. The number of tiles used to split the off-glacier terrain was chosen so that the area included in each tiles was approximately equal to the whole Mont-Blanc glaciated area (155 km2, 4 by 4 tiles, as for Err_off_gla), Mer de Glace (23 km2, 11 by 11 tiles) and Argentière Glacier (13 km2, 16 by 16 tiles).
(2) Departure from a linear trend (σlinear). This source of error is difficult to quantify at the scale of our entire study region. For the 8 profiles surveyed yearly using GNSS, the dispersion around a linear trend of the 2000–2014 elevation annual time series was on the average 0.1 m a−1. The largest dispersion was measured in the lowermost profile on Argentière Glacier (0.18 m a−1). Conservatively, we assumed that this worse case is representative of the entire Mont-Blanc massif, for which we assumed an error σlinear of 0.2 m a−1.
(3) Irregular sampling of seasonal surface elevation changes (σseason). Glaciers in the European Alps are winter-accumulation type and their surface is expected to exhibit a maximum at the end of the accumulation period (April) and a minimum at the end of the ablation period (October). During the early years of our study period (2000–2004), ASTER stereo-images in our summer selection were mostly acquired in June and July whereas after 2005, they were mainly acquired in August and September. This irregular sampling of the seasonal cycle in surface elevation change could negatively bias our estimates of dh/dtASTER. This seasonal bias should be slightly mitigated by the fact that all ASTER DEMs are vertically adjusted off-glacier. Indeed, if an ASTER DEM was acquired in June after a winter of anomalously high accumulation, more snow would remain off-glacier and this positive elevation bias should be, at least partly, corrected during the vertical DEM adjustment (Wang and Kääb, 2015). To quantify this systematic seasonal bias, we simulated seasonal surface elevation changes using a sinusoid function with amplitude of 3 m, a maximum occurring mid-April and a minimum in mid-October (Figure 6). The 3-m amplitude was a first order estimate based on measured seasonal glaciological mass balances on the Mer de Glace and Argentière Glacier (Vincent, 2002; Six and Vincent, 2014) and also on an unpublished measurement of seasonal surface elevation changes using differencing of several Pléiades DEMs acquired in 2015. This 3-m amplitude was a region-wide average and, given our poor constrains on this value, we neglected its spatial variations. Then, we sampled this seasonal cycle in surface elevation changes at the time of acquisition of the ASTER DEMs and fitted a linear regression to the elevation change time series. The slope of the regression line was our estimate of the systematic error due to the irregular sampling of the seasonal cycle but was not used to correct dh/dtASTER.
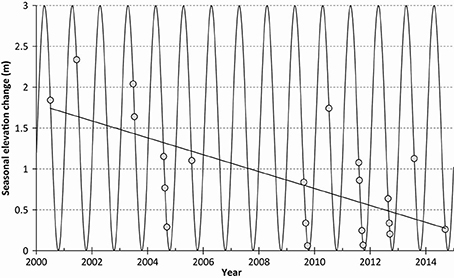
Figure 6. Temporal sampling by our selection of ASTER summer DEMs of a hypothetical seasonal elevation cycle for Mont-Blanc glaciers with an amplitude of 3 m, a maximum in mid-April and a minimum in mid-October. The gray dots are the theoretical elevations at the time of acquisition of the ASTER DEMs. The trend line has a slope of –0.10 m a−1.
We then summed these three different sources of errors quadratically to calculate our formal uncertainty for dh/dtASTER (σdh∕dt):
The above method to estimate σdh∕dt was different from the approach used in several earlier studies. Thus, for the sake of comparison, we also computed the uncertainties for dh/dtASTER using a more conventional approach that takes into account the spatial correlation in the errors (Rolstad et al., 2009; Melkonian et al., 2013). The reader is referred to equations 5 and 6 in Wang and Kääb (2015).
Following Fischer et al. (2015), our uncertainty σdh∕dt was then combined with uncertainties on glacier areas (±5%) and due to the density assumption (±60 kg m−3) to provide an overall uncertainty for the glacier-wide and region-wide geodetic mass balances (Huss, 2013; Berthier et al., 2014).
Errors for the SRTM Penetration Depth
A 68% confidence interval (1-sigma uncertainty) for our region-wide estimate of the SRTM penetration depth was calculated as the quadratic sum of two sources of errors: the elevation error and the seasonal error. (1) The elevation error (σz_Feb2000) corresponds to the error in the reconstruction of the topography in mid-February 2000 from dh/dtASTER. This error was estimated by splitting the off-glacier terrain in 4 by 4 tiles, covering each about 150 km2. For each tile, the mean difference between the reconstructed topography and the SRTM DEM was computed. The elevation error was the mean absolute difference for these 16 tiles and equalled 0.6 m. (2) The seasonal error (σseason_Feb2000) originates from the fact that we ignored the height of the winter snow pack in mid-February 2000. This systematic error was assumed to equal 3 m which, as discussed above, was our first order estimate of seasonal surface elevation changes over Mont-Blanc glaciers. We note that the maximum winter accumulation is expected later than mid-February (around mid-April) so our error is probably conservative. The final uncertainty for the penetration depth (σpenetration) was the square root of the quadratic sum of the elevation and seasonal errors (0.6 and 3 m) and equals 3.1 m.
Results
Accuracy of dh/dtASTER Off-Glacier
Overall, the mean and median dh/dtASTER off-glacier (i.e., the mean/median of all pixels on stable terrain) were very close to 0, typically within ± 0.03 m a−1. This confirmed that the 3D coregistration performed well on the average over the 2500 km2 of non-glaciated terrain. This mean/median dh/dtASTER off-glacier showed little sensitivity to (1) the choice of the reference DEM (SRTM or GDEMv2), (2) the choice of the season for the ASTER DEMs (summer or all-season), and (3) the time interval (2003–2012 or 2000–2014). The standard deviation of dh/dtASTER off-glacier was roughly 1 m a−1. This standard deviation was relatively large and of similar magnitude to the average signal of glacier surface elevation changes. In other words, dh/dtASTER was highly uncertain for a single pixel. However, averaging over an entire glacier (or region) significantly reduced the noise level as illustrated by splitting the off-glacier terrain into 16 tiles (Figure 4). When all-season ASTER DEMs derived from images acquired between 2003 and 2012 were processed, the mean absolute difference of dh/dtASTER for the 16 tiles was 0.07 m a−1. Slightly lower errors were obtained when only summer ASTER DEMs (mean absolute difference of 0.05 m a−1) were considered possibly because the shadows and the snow-covered areas were reduced (Table 1).
The satisfactory vertical adjustment of the ASTER DEMs was confirmed by examining dh/dtASTER off-glacier after averaging in 50-m elevation bands (black squares in Figure 7), noted < dh/dtASTER> in the following. From 650 to 3000 m a.s.l., < dh/dtASTER> all fell within ±0.15 m a−1. Above 3650 m a.s.l., the scatter of < dh/dtASTER> was larger. This was probably a result of the reduced ice-free areas (always smaller than 1 km2 in these 50-m elevation bands), their steeper slopes and possibly the inter-annual variations of snow thickness. Between 3000 and 3650 m a.s.l., there was a tendency toward consistently negative < dh/dtASTER> values, at about −0.2 m a−1. A possible explanation of this negative bias off-glacier is that our glacier mask did not include some of the small ice patches and snow fields that likely thinned during the study period.
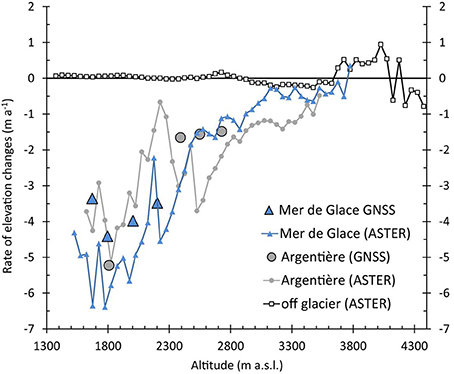
Figure 7. Rate of surface elevation changes with altitude for the Mer de Glace (gray circles) and Argentière Glacier (blue triangles) between 2000 and 2014. dh/dtASTER obtained from summer ASTER DEMs (small symbols) are compared to dh/dt measured at eight transverse profiles using GNSS measurements (large symbols, shown by thick yellow lines in Figures 5A,B) between September 2000 and September 2014. dh/dtASTER off-glacier is shown with small squares.
Accuracy of dh/dtASTER on Glaciers
About 91.7% of the Mont-Blanc glacier area was covered by dh/dt measurements when summer ASTER DEMs acquired during 2000–2014 were used. This percentage increased to 94.4% using all-season ASTER DEMs. This percentage was higher than for dh/dtSpot5∕Pléiades (85.3% coverage). Only Miage Glacier was not well-sampled using multi-temporal ASTER DEMs (Figure 4), probably due to the steep slopes surrounding this glacier, clouds and matching errors during the ASTER DEM generation.
Despite the relatively large noise level observed off-glacier at the individual pixel level, dh/dtASTER during 2003–2012 captured well the pattern of glacier surface elevation changes, derived by Spot5/Pléiades DEM differencing (Figures 5A,B). The rapid thinning of the tongues of major valley glaciers in the Mont-Blanc area (Mer de Glace, Argentière, Brenva, Saleina glaciers) stands out. This general agreement between dh/dtASTER and dh/dtSpot5∕Pléiades was confirmed when examining their distribution with altitude (Figure 5C). For all 50-m elevation bands, the mean absolute difference (area-weighted) was 0.19 m a−1 (Table 1). This value, Err_on_gla, hardly changed depending on the selection of ASTER DEMs (summer or all-season, Table 1). Larger systematic errors (over 1 m a−1) are observed in the 50-m elevation bands containing little glacier area (typically less than 1 km2), i.e., below 2200 m a.s.l. and above 3750 m a.s.l. (Figure 5C). For the highest elevation bands, it might be due to the lack of contrast in the ASTER images leading to systematic errors in the DEMs. For the lowest elevation bands, it is possibly explained by a strong glacier-to-glacier thinning variability combined with a different sampling of these glacier tongues in dh/dtASTER and dh/dtSpot5∕Pléiades. These lowermost and uppermost elevation bands only covered 13.5% of the total Mont-Blanc glacier area.
The comparison of dh/dtASTER averaged in 50-m elevation bands with GNSS measurements at eight transverse profiles on the Mer de Glace and Argentière Glacier during 2000–2014 confirmed that larger errors occurred when dh/dtASTER were averaged over areas smaller than 1 km2 (Figure 7). For the Mer de Glace (respectively, Argentière Glacier), the mean glacier area within the 50-m elevation bands was 0.49 km2 (respectively, 0.33 km2). The larger thinning rates toward the two glacier fronts were captured by dh/dtASTER but absolute differences with GNSS measurements reached up to 2 m a−1 at some profiles.
Accuracy of the Glacier-Wide and Region-Wide Geodetic Mass Balances
Over the entire Mont-Blanc area (155 km2 of glaciers), the 2003–2012 region-wide mass balance from summer ASTER DEMs (−1.05 ± 0.37 m w.e. a−1) was in remarkable agreement with the Spot5/Pléiades mass balance (−1.06 ± 0.23 m w.e. a−1). The region-wide value from all-season ASTER DEMs was slightly less negative (−0.96 ± 0.30 m w.e. a−1) but still in agreement with the Spot5/Pléiades data within the uncertainty range. For the Mer de Glace and Argentière Glacier, the 2003—2012 ASTER glacier-wide mass balances were slightly negatively biased compared to Spot5/Pléiades (Table 1). For Argentière Glacier, the ASTER geodetic mass balances (−1.34 ± 0.32 m w.e. a−1 using all-season images and −1.55 ± 0.45 m w.e. a−1 using summer images) were closer to the glaciological mass balance (−1.42 ± 0.40 m w.e. a−1) than the Spot5/Pléiades value (−1.12 ± 0.16 m w.e. a−1). The glaciological mass balance for the Mer de Glace (−1.64 ± 0.40 m w.e. a−1) was more negative than the ones derived from satellite data. However, these differences are not statistically significant and, thus, we prefer not to speculate about their origins.
Mass balances were also calculated for 2000–2014, the entire time period covered by ASTER data. The region-wide and glacier-wide geodetic mass balances remained mostly unchanged compared to their values during 2003–2012 (Table 1). Again we found a reasonable agreement between the ASTER-derived and glaciological mass balances for Argentière Glacier and Mer de Glace, with differences of 0.3–0.4 m w.e. a−1, within the uncertainty range.
The region-wide geodetic mass balance for the Rutor Glacier group (Aosta Valley, Italy), in the south of our study domain (Figure 4) was also strongly negative during 2000–2014, at -1.32 ± 0.28 m w.e. a−1. The retreat and thinning of Rutor Glacier have already been described (Villa et al., 2007; Smiraglia et al., 2015). Nevertheless, to our knowledge, we present here the first region-wide mass balance for this massif, covering an area of 13 km2. Our value was in good agreement with the glaciological annual mass balances reported during 2004–2013 for others glaciers in Italy, in particular for the nearby Ciardoney (–1.42 m w.e. a−1) and Grand Etrèts (–0.95 m w.e. a−1) glaciers (Giuliano et al., 2013; Carturan et al., 2015). This agreement should be considered with caution because large differences can be expected between the mass balance of individual glaciers and for an entire region (e.g., Fischer et al., 2015; Le Bris and Paul, 2015).
Penetration Depth of the SRTM Radar Signal
The SRTM penetration depth into snow and ice, averaged in 50-m glacier elevation bands, is shown in Figure 8. Again a large scatter was found for the lowest (below 2000 m a.s.l.) and highest (above 3600 m a.s.l.) elevation bands that contained only a modest percentage of the overall Mont-Blanc glaciated area. Between 2000 m and 3600 m a.s.l., the penetration depth was similar (within our error bar of ~3 m) for the two configurations of input data and showed strong spatial variations and an altitudinal increase from almost zero up to about 12 m. On the average, we inferred a mean SRTM penetration depth over Mont-Blanc glaciers of 9.8 ± 3.1 m (case one) and 8.6 ± 3.1 m (case two).
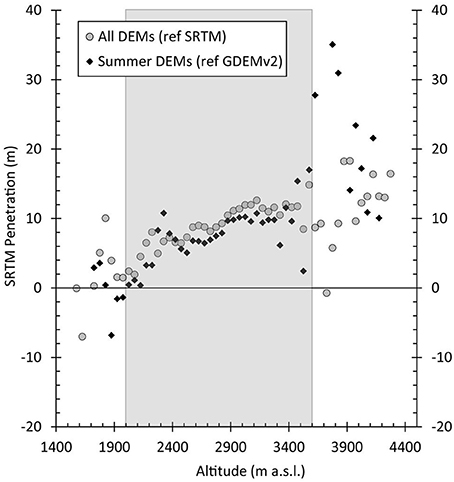
Figure 8. Penetration depth of the SRTM C-Band radar signal as a function of altitude over Mont-Blanc glaciers. Penetration is inferred by temporally extrapolating dh/dtASTER to mid-February 2000, the acquisition date of the SRTM DEM. Two cases are presented to illustrate the sensitivity of the penetration depth to the choice of the reference DEM (ASTER or GDEMv2) and the selection of ASTER DEMs (summer or all-season). Elevation bands where the glaciated area is > 1 km2 are shaded in gray.
Discussion
Influence of the Input Data
Our dh/dtASTER (off-glacier and on glaciers) and geodetic mass balances show little sensitivity to the input data, i.e., the choice of the reference DEM, the availability of a cloud mask and the season of acquisition of the ASTER images (Table 1). Slightly better results are obtained with the SRTM DEM as a reference DEM off-glacier but the glacier-wide and region-wide mass balances obtained with SRTM and GDEMv2 DEMs are similar.
Errors and mass balances are also nearly unaltered if a cloud mask is used or not. This demonstrates that our processing strategy is efficient at eliminating outliers, in particular the erroneous elevations due to the presence of clouds in the ASTER images. This result is encouraging as it indicates that our methodology can be applied to other glaciated regions without the need to manually delimit clouds. Also, it means that partly cloudy ASTER images can be retained when selecting the data.
Nearly identical mass balances are derived using all-season and summer ASTER DEMs. Thus, we cannot draw here any definitive recommendation on the best choice regarding the seasonal selection of ASTER DEMs. For the sake of comparison to other glaciological data and studies, it is probably preferable to restrain the analysis to DEMs acquired in late summer, especially in regions with high mass turnover. However, if only few such ASTER DEMs are available, our results suggest that reliable decadal mass balance estimates can also be deduced using ASTER DEMs acquired during all seasons. A different conclusion may be drawn in regions where accumulation rates are higher than the Alps, for example in more maritime climate where the seasonality error (σseason) could be larger than for the Mont-Blanc area.
Overall, this small sensitivity to the input data is an indication of the robustness of the method as soon as sufficiently large glaciated areas are observed.
Added Value of the Multi-Temporal ASTER DEM Strategy
To quantify the added value of the multi-temporal ASTER DEM strategy in comparison to the standard DEM differencing method, we also computed dh/dt and geodetic mass balances using only two ASTER DEMs. The compared DEMs were acquired on 11 July 2003 and 14 September 2012 and are deduced from nearly cloud free images. These two dates were selected to match as much as possible the dates of the Spot5 and Pléiades DEMs (Table 1). We note that, by coincidence, these two DEMs exhibit standard deviations lower than the average value for the 31 summer ASTER DEMs (Supplementary Table 1). Despite this fortuitous selection of two rather precise DEMs, the errors off-glacier (Err_off_gla) and on glaciers (Err_on_gla) are 50–100% larger than the errors for the multi-temporal ASTER DEM method (Table 1). Still the glacier-wide and region-wide mass balances deduced from these two DEMs agree within uncertainties with the mass balances measured from Spot5/Pléiades and in the field.
Uncertainties
With the exception of Nuimura et al. (2012), earlier studies assessed the uncertainty of their dh/dtASTER off-glacier because of the lack of validation data on glaciers. These studies had to assume that the uncertainties off-glacier are representative for the glaciated areas (e.g., Melkonian et al., 2013; Wang and Kääb, 2015). Here, we could check the relevance of our formal uncertainty estimate off-glacier through a comparison to the errors actually measured on glaciers. Overall during 2003–2012, our validation suggests an error of about 0.2 m a−1 for dh/dtASTER on glaciers (Err_on_gla), when considering the error in 50-m elevation bands. Off-glacier, when the terrain is split in tiles of about 1 km2, our formal uncertainty is 0.33 m a−1, a value slightly larger than the errors on glacier. These results are also in agreement with an earlier validation over Khumbu Glacier (Nepal) where a difference of 0.30 ± 0.21 m a−1 was found between dh/dtASTER and field measurements (Nuimura et al., 2012).
Our metric to compute the formal uncertainty of dh/dtASTER can be compared to the more conventional uncertainty that takes into account the spatial correlation in the errors. The latter was used in earlier studies based on multi-temporal ASTER DEMs in Patagonia (Melkonian et al., 2013) and New Zealand (Wang and Kääb, 2015). By computing the dh/dtASTER semivariogram off-glacier, we found a distance of spatial correlation of about 500 m for our study area. Using this auto-correlation distance, we found 1-sigma uncertainties (i.e., at the 68% confidence level) that are considerably smaller than our own formal uncertainties for all averaging areas (Table 2). The formulation used in these earlier studies strongly underestimate errors probably because it does not properly reflect spatially-varying biases in the DEMs. Similar conclusions were reached by comparing two ASTER and Spot5 DEMs acquired the same day over the Larsen B area of the Antarctic Peninsula (Berthier et al., 2012).
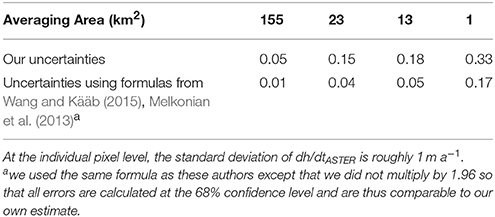
Table 2. Formal uncertainties (m a−1) on the rate of elevation changes off-glacier from our study and estimated as in previous studies by taking into account the spatial correlation in the errors [using equations 5 and 6 from Wang and Kääb (2015)].
Penetration of the SRTM C-Band SAR Signal
The radar signal (C-Band in the case of the version of the SRTM DEM used here) penetrates into snow and ice but the depth of the phase scattering center is still a matter of debate (Barundun et al., 2015; Kääb et al., 2015). For example, in eastern Nyainqêntanglha Shan at the eastern termination of the Himalaya, recent estimates vary from 1.7 m (Gardelle et al., 2013) to 7–10 m (Kääb et al., 2015). This is an issue of high scientific importance because the SRTM DEM is widely-used and any error in the correction of this penetration depth (or even worse not accounting for it) directly leads to systematic errors in dh/dt and ultimately in geodetic glacier mass balances (Berthier et al., 2006; Fischer et al., 2015).
By temporally extrapolating dh/dtASTER to the acquisition date of the SRTM DEM, we infer the SRTM C-Band penetration depth over Mont-Blanc glaciers. This method has two advantages over a similar method applied to ICESat data (Kääb et al., 2012). (1) From the sparse ICESat tracks, only a mean penetration depth over a sufficiently large region (typically thousands km2 of glaciers) can be inferred whereas here values for individual glacier elevation band (typically larger than 1 km2) are calculated. (2) Because ICESat data spanned 2003–2009, Kääb et al. (2012) assumed that dh/dt was identical between 2000–2003 and 2003–2009, an assumption difficult to verify. The ASTER DEMs are available as early as 2000 (July 2000 over the Mont-Blanc area) avoiding the 3 years temporal extrapolation.
Especially in the northern hemisphere, one limitation of this method is that it neglects seasonal surface elevation changes. Due to winter snow accumulation, the real glacier surface in February 2000 in the Mont-Blanc area is probably higher than the one reconstructed here from dh/dtASTER. Thus, we may underestimate the SRTM penetration depth but the magnitude of this underestimation is hard to quantify.
A verification of our backward temporal extrapolation to retrieve the SRTM penetration depth can be performed by temporally extrapolating dh/dtASTER (calculated over 2000–2014) forward to 2 November 2015, the acquisition date of a Pléiades DEM covering the central part of the Mont-Blanc area. This Pléiades DEM is generated using the same parameters and ground control points as in Berthier et al. (2014) and has a vertical accuracy of ±1 m or better. For the entire area covered by the Pléiades DEM (117 km2), the DEM reconstructed from dh/dtASTER is 1.1 m higher than the Pléiades DEM. For the glaciated areas (68.1 km2), the reconstructed DEM is only 0.2 m above the Pléiades DEM. The proximity of the latter value to zero may be partly coincidental. Still, this is an indirect confirmation of the soundness of our strategy to determine SRTM C-Band penetration depths.
Our estimate of the SRTM C-Band mean penetration depth over Mont-Blanc glaciers exhibits a strong altitudinal dependency (range: 0–12 m), consistent with the expected stronger penetration of the C-Band signal in the colder and thicker snowpack and firn at higher altitudes (Gilbert et al., 2014). The mean penetration depth (about 9 ± 3 m) is in remarkable agreement with a value of 8 m estimated independently for all Swiss glaciers (Fischer et al., 2015) and with the 5 to 10 m underestimation of the SRTM elevations already reported over Mont-Blanc glaciers (Berthier et al., 2006). An implication of these large penetration depths is that, contrary to what was done in some earlier studies (e.g., Melkonian et al., 2014), the SRTM DEM should not be used in the linear trend analysis to extract dh/dt from ASTER DEMs. This recommendation applies mostly to the northern hemisphere where SRTM was acquired in the core of winter (February 2000). We stress that our estimate of the penetration depth is only valid for our study area and for February 2000. Considering the strong elevation gradient of the penetration depth, our region-wide average value of about 9 ± 3 m is only valid for the hypsometry of the Mont-Blanc area and should not be applied “as is” to other glaciers, even in the European Alps.
Following Gardelle et al. (2012), several studies assumed no penetration of the SRTM X-Band radar signal and used the difference between the simultaneously acquired SRTM X-Band and C-Band DEMs to estimate the C-Band penetration depth. The SRTM X-Band DEM does not cover the Mont-Blanc area. However, it covers some nearby Swiss glaciers [area of 370 km2 in 2003 according to Paul et al. (2011)] for which we find an elevation difference between the X-Band and C-Band DEMs of 2.9 m on the average. This value, once subtracted from the 9 m mean penetration depth of the SRTM C-Band signal inferred in our study and the 8 m value found in an earlier one (Fischer et al., 2015), suggests that the penetration depth of the SRTM X-Band signal could be, as a glacier-wide average, 5 to 6 m in the European Alps in February 2000 with even larger values in the cold snowpack at the highest elevations. The assumption of no X-band penetration (Gardelle et al., 2012) seems thus inappropriate, at least in winter in the European Alps.
Limits of Our Method and Possible Future Improvements
Our processing strategy implicitly assumes that surface elevation changes vary linearly with time and neglects seasonal and inter-annual variations. For Argentière Glacier and Mer de Glace, the modest influence of inter-annual variations can be partly verified at the 8 transverse profiles where elevations are surveyed annually using GNSS at the beginning of September. In the worst case, a linear trend is able to explain 98% of the variance and the departure from a linear trend is on average 0.1 m a−1. To tolerate departure from the linear trend in the ASTER time series, we excluded elevation values outside of the 99% (3 sigma) confidence interval and not a too strict (i.e., narrower) 95% (2 sigma) confidence interval. Still, our method may not be appropriate if a shift in climate occurred in the middle of the DEM time series or for glaciers experiencing a rapid change in their dynamics (e.g., a surge). Thus, the method should not be blindly applied to areas where a non-linear temporal evolution is suspected.
Our study also shows that a careful examination of the ASTER temporal sampling is necessary. In the Mont-Blanc area, the irregular seasonal sampling could lead to a systematic negative bias on dh/dtASTER of about −0.1 m a−1. In regions where more numerous ASTER DEMs are available, some of the ASTER DEMs could be excluded to ensure a more regular temporal sampling.
Another potential improvement could be the generation of individual ASTER DEMs. Right now, we directly downloaded the DEMs processed by LPDAAC (so-called product AST14DMO). It is likely that a more reliable representation of the glacier topography could be obtained using a processing chain optimized for glacier surface, such as SETSM (Noh and Howat, 2015) or Ames Stereo Pipeline (Shean et al., 2016). An added value of such an optimized DEM generation procedure would be the availability of a mask indicating the quality of the correlation between the stereo images and locating unambiguously the areas interpolated in the DEMs.
Conclusions
In this study, we validated the rate of surface elevation changes and region-wide geodetic mass balances derived from multi-temporal ASTER DEMs over the Mont-Blanc area. Similar processing strategies have been applied to ASTER DEMs over other glaciated areas but these earlier studies lacked or relied on thin validation data. A specificity of our methodology is that the exclusion of outliers in the ASTER DEMs is based on a linear fit to the elevation time series and does not require choosing an a priori threshold on the maximum accepted rates of thinning/thickening in the ablation/accumulation areas.
During 2003–2012, we found a remarkable agreement between the Mont-Blanc-wide geodetic mass balances derived from ASTER DEMs and by differencing Spot5/Pléiades DEMs. Errors on dh/dt inferred from the ASTER DEM time series were 0.2–0.3 m a−1 after averaging over areas of at least 1–2 km2. Larger errors (1 m a−1 or larger) were observed when averaging over smaller areas, limiting the applicability of the method for small ice bodies and for small portions of large glaciers. The robustness of our processing chain was confirmed by its small sensitivity to (1) the reference DEM used off-glacier for coregistration, (2) the temporal (summer or all-season) selection of ASTER DEMs, and (3) the presence of clouds in the ASTER images. The potential of the method to document the mass change of un-surveyed glaciers was demonstrated for the Rutor Glacier group (Italy) where the geodetic mass balance was also strongly negative during 2000–2014 (–1.32 ± 0.28 m w.e. a−1). We also showed that the multi-temporal ASTER DEM analysis resulted in smaller uncertainties than the more standard differencing of two DEMs acquired at the start/end of the study period.
An important side-product of the multi-temporal ASTER DEM analysis is an estimate of the SRTM C-Band radar penetration depth (i.e., the depth of the scattering phase center) into snow and ice in February 2000. An average value of 9 ± 3 m was inferred over Mont-Blanc glaciers with a strong altitudinal dependency (range: 0–12 m). This is in encouraging agreement with an independent study over the Swiss Alps. This result stresses the importance of an appropriate correction of the radar penetration (taking into account altitudinal variations) before reliable surface elevation changes can be derived using the SRTM DEM. This statement also applies to the TanDEM-X individual DEMs, especially if acquired in winter. The multi-temporal ASTER DEM method has thus the potential to map the regional variability of the radar penetration depth in other mountain ranges than the European Alps and for other radar sensors than SRTM. Still it remains a rather indirect method. If available, simultaneously acquired optical and radar DEMs should be differentiated to obtain more direct estimates of the radar penetration depth.
Author Contributions
EB designed the study and led the writing of the paper. VC initiated the development of the method and performed the first validations during his master thesis. CV and DS acquired the field measurements. All four authors discussed the results and contributed to the writing of the paper.
Conflict of Interest Statement
The authors declare that the research was conducted in the absence of any commercial or financial relationships that could be construed as a potential conflict of interest.
Acknowledgments
We thank Fanny Brun for her comments on an earlier version of the manuscript. The constructive suggestions from the Associate Editor (Francisco Navarro) and two reviewers significantly improved the manuscript. Field measurements in the Mont-Blanc area were funded by the GLACIOCLIM (Les GLACiers comme Observatoire du CLIMat) programme. EB acknowledges support from the French Space Agency (CNES) through the TOSCA and ISIS programs and from the Programme National de Télédétection Spatiale (PNTS, http://www.insu.cnrs.fr/pnts), grant PNTS-2016-01 and the Agence Nationale de la Recherche (ANR) Grant ANR-12-BS06-0018 (SUMER). This work could not have been performed without the GLIMS project that allowed populating a vast archive of ASTER stereo images over glaciers. The ASTER GDEMv2 is a product of MITI and NASA, SRTM is a product of NASA.
Supplementary Material
The Supplementary Material for this article can be found online at: https://www.frontiersin.org/article/10.3389/feart.2016.00063
References
Barundun, M., Huss, M., Sold, L., Farinotti, D., Azisov, E., Salzmann, N., et al. (2015). Re-analysis of seasonal mass balance at Abramov glacier 1968–2014. J. Glaciol. 61, 1103–1117. doi: 10.3189/2015JoG14J239
Berthier, E., Arnaud, Y., Baratoux, D., Vincent, C., and Remy, F. (2004). Recent rapid thinning of the “Mer de Glace” glacier derived from satellite optical images. Geophys. Res. Lett. 31, L17401. doi: 10.1029/2004gl020706
Berthier, E., Arnaud, Y., Kumar, R., Ahmad, S., Wagnon, P., and Chevallier, P. (2007). Remote sensing estimates of glacier mass balances in the Himachal Pradesh (Western Himalaya, India). Remote Sens. Environ. 108, 327–338. doi: 10.1016/j.rse.2006.11.017
Berthier, E., Arnaud, Y., Vincent, C., and Remy, F. (2006). Biases of SRTM in high-mountain areas: Implications for the monitoring of glacier volume changes. Geophys. Res. Lett. 33, L08502. doi: 10.1029/2006gl025862
Berthier, E., Scambos, T. A., and Shuman, C. A. (2012). Mass loss of Larsen B tributary glaciers (Antarctic Peninsula) unabated since 2002. Geophys. Res. Lett. 39:L13501. doi: 10.1029/2012gl051755
Berthier, E., Vadon, H., Baratoux, D., Arnaud, Y., Vincent, C., Feigl, K. L., et al. (2005). Surface motion of mountain glaciers derived from satellite optical imagery. Remote Sens. Environ. 95, 14–28. doi: 10.1016/j.rse.2004.11.005
Berthier, E., Vincent, C., Magnússon, E., Gunnlaugsson, Á. p, Pitte, P., Le Meur, E., et al. (2014). Glacier topography and elevation changes derived from Pléiades sub-meter stereo images. Cryosphere 8, 2275–2291. doi: 10.5194/tc-8-2275-2014
Carturan, L., Baroni, C., Brunetti, M., Carton, A., Dalla Fontana, G., Salvatore, M. C., et al. (2015). Analysis of the mass balance time series of glaciers in the Italian Alps. Cryosphere Discuss 9, 5849–5883. doi: 10.5194/tcd-9-5849-2015
Diolaiuti, G. A., Bocchiola, D., Vagliasindi, M., D'Agata, C., and Smiraglia, C. (2012). The 1975–2005 glacier changes in Aosta Valley (Italy) and the relations with climate evolution. Prog. Phys. Geogr. 36, 764–785. doi: 10.1177/0309133312456413
Farr, T. G., Rosen, P. A., Caro, E., Crippen, R., Duren, R., Hensley, S., et al. (2007). The shuttle radar topography mission. Rev. Geophys. 45, RG2004. doi: 10.1029/2005RG000183
Fischer, M., Huss, M., Barboux, C., and Hoelzle, M. (2014). The new Swiss Glacier Inventory SGI2010: relevance of using high-resolution source data in areas dominated by very small glaciers. Arct. Antarct. Alp. Res. 46, 933–945. doi: 10.1657/1938-4246-46.4.933
Fischer, M., Huss, M., and Hoelzle, M. (2015). Surface elevation and mass changes of all Swiss glaciers 1980–2010. Cryosphere 9, 525–540. doi: 10.5194/tc-9-525-2015
Frey, H., and Paul, F. (2012). On the suitability of the SRTM DEM and ASTER GDEM for the compilation of topographic parameters in glacier inventories. Int. J. Appl. Earth Obs. Geoinformation 18, 480–490. doi: 10.1016/j.jag.2011.09.020
Gardelle, J., Berthier, E., and Arnaud, Y. (2012). Impact of resolution and radar penetration on glacier elevation changes computed from multi-temporal DEMs. J. Glaciol. 58, 419–422. doi: 10.3189/2012JoG11J175
Gardelle, J., Berthier, E., Arnaud, Y., and Kääb, A. (2013). Region-wide glacier mass balances over the Pamir-Karakoram-Himalaya during 1999–2011. Cryosphere 7, 1263–1286. doi: 10.5194/tc-7-1263-2013
Gardent, M., Rabatel, A., Dedieu, J.-P., and Deline, P. (2014). Multitemporal glacier inventory of the French Alps from the late 1960s to the late 2000s. Glob. Planet. Change 120, 24–37. doi: 10.1016/j.gloplacha.2014.05.004
Gardner, A. S., Moholdt, G., Arendt, A. A., and Wouters, B. (2012). Accelerated contributions of Canada's Baffin and Bylot Island glaciers to sea level rise over the past half century. Cryosphere 6, 1103–1125. doi: 10.5194/tc-6-1103-2012
Gardner, A. S., Moholdt, G., Cogley, J. G., Wouters, B., Arendt, A. A., Wahr, J., et al. (2013). A reconciled estimate of glacier contributions to sea level rise: 2003 to 2009. Science 340, 852–857. doi: 10.1126/science.1234532
Gilbert, A., Gagliardini, O., Vincent, C., and Wagnon, P. (2014). A 3-D thermal regime model suitable for cold accumulation zones of polythermal mountain glaciers. J. Geophys. Res. Earth Surf. 119, 1876–1893. doi: 10.1002/2014JF003199
Giuliano, M., Mortara, G., Chiarle, M., and Bertotto, S. (2013). Schede glaciologiche di alcuni apparati delle Alpi occidentali. Ghiacciaio Ciardoney (Val Soana). Nimbus 69–70, 44–45.
Huss, M. (2013). Density assumptions for converting geodetic glacier volume change to mass change. Cryosphere 7, 877–887. doi: 10.5194/tc-7-877-2013
Jacob, T., Wahr, J., Pfeffer, W. T., and Swenson, S. (2012). Recent contributions of glaciers and ice caps to sea level rise. Nature 482, 514–518. doi: 10.1038/nature10847
Kääb, A. (2002). Monitoring high-mountain terrain deformation from repeated air- and spaceborne optical data: examples using digital aerial imagery and ASTER data. ISPRS J. Photogramm. Remote Sens. 57, 39–52. doi: 10.1016/S0924-2716(02)00114-4
Kääb, A., Berthier, E., Nuth, C., Gardelle, J., and Arnaud, Y. (2012). Contrasting patterns of early 21st century glacier mass change in the Himalaya. Nature 488, 495–498. doi: 10.1038/nature11324
Kääb, A., Treichler, D., Nuth, C., and Berthier, E. (2015). Contending estimates of 2003–2008 glacier mass balance over the Pamir–Karakoram–Himalaya. Cryosphere 9, 557–564. doi: 10.5194/tc-9-557-2015
Kargel, J. S., Leonard, G. L., Wheate, R., and Edwards, B. (2014). ASTER and DEM change assessment of glaciers near Hoodoo Mountain, British Columbia, Canada, in Global Land Ice Measurements from Space, eds J. S. Kargel, G. J. Leonard, M. P. Bishop, A. Kääb, and B. Raup (Berlin; Heidelberg: Springer), 353–373. Available online at: http://www.springer.com/us/book/9783540798170
Korona, J., Berthier, E., Bernard, M., Remy, F., and Thouvenot, E. (2009). SPIRIT. SPOT 5 stereoscopic survey of Polar Ice: Reference Images and Topographies during the fourth International Polar Year (2007-2009). ISPRS J. Photogramm. Remote Sens. 64, 204–212. doi: 10.1016/j.isprsjprs.2008.10.005
Le Bris, R., and Paul, F. (2015). Glacier-specific elevation changes in parts of western Alaska. Ann. Glaciol. 56, 184–192. doi: 10.3189/2015AoG70A227
Melkonian, A. K., Willis, M. J., and Pritchard, M. E. (2014). Satellite-derived volume loss rates and glacier speeds for the Juneau Icefield, Alaska. J. Glaciol. 60, 743–760. doi: 10.3189/2014JoG13J181
Melkonian, A. K., Willis, M. J., Pritchard, M. E., Rivera, A., Bown, F., and Bernstein, S. A. (2013). Satellite-derived volume loss rates and glacier speeds for the Cordillera Darwin Icefield, Chile. Cryosphere 7, 823–839. doi: 10.5194/tc-7-823-2013
Noh, M.-J., and Howat, I. M. (2015). Automated stereo-photogrammetric DEM generation at high latitudes: surface extraction with TIN-based Search-space Minimization (SETSM) validation and demonstration over glaciated regions. GIScience Remote Sens. 52, 198–217. doi: 10.1080/15481603.2015.1008621
Nuimura, T., Fujita, K., Yamaguchi, S., and Sharma, R. R. (2012). Elevation changes of glaciers revealed by multitemporal digital elevation models calibrated by GPS survey in the Khumbu region, Nepal Himalaya, 1992–2008. J. Glaciol. 58, 648–656. doi: 10.3189/2012JoG11J061
Nuth, C., and Kääb, A. (2011). Co-registration and bias corrections of satellite elevation data sets for quantifying glacier thickness change. Cryosphere 5, 271–290. doi: 10.5194/tc-5-271-2011
Paul, F., Bolch, T., Kääb, A., Nagler, T., Nuth, C., Scharrer, K., et al. (2015). The glaciers climate change initiative: methods for creating glacier area, elevation change and velocity products. Remote Sens. Environ. 162, 408–426. doi: 10.1016/j.rse.2013.07.043
Paul, F., Frey, H., and Le Bris, R. (2011). A new glacier inventory for the European Alps from Landsat TM scenes of 2003: challenges and results. Ann. Glaciol. 52, 144–152. doi: 10.3189/172756411799096295
Pfeffer, W. T., Arendt, A. A., Bliss, A., Bolch, T., Cogley, J. G., Gardner, A. S., et al. (2014). The randolph glacier inventory: a globally complete inventory of glaciers. J. Glaciol. 60, 537–552. doi: 10.3189/2014JoG13J176
Pieczonka, T., and Bolch, T. (2015). Region-wide glacier mass budgets and area changes for the Central Tien Shan between ~1975 and 1999 using Hexagon KH-9 imagery. Glob. Planet. Change 128, 1–13. doi: 10.1016/j.gloplacha.2014.11.014
Raup, B. H., Kieffer, H. H., Hare, T. M., and Kargel, J. S. (2000). Generation of data acquisition requests for the ASTER satellite instrument for monitoring a globally distributed target: glaciers. IEEE Trans. Geosci. Remote Sens. 38, 1105–1112. doi: 10.1109/36.841989
Rignot, E., Echelmeyer, K., and Krabill, W. (2001). Penetration depth of interferometric synthetic-aperture radar signals in snow and ice. Geophys. Res. Lett. 28, 3501–3504. doi: 10.1029/2000GL012484
Rodriguez, E., Morris, C. S., and Belz, J. E. (2006). A global assessment of the SRTM performance. Photogramm. Eng. Remote Sens. 72, 249–260. doi: 10.14358/PERS.72.3.249
Rolstad, C., Haug, T., and Denby, B. (2009). Spatially integrated geodetic glacier mass balance and its uncertainty based on geostatistical analysis: application to the western Svartisen ice cap, Norway. J. Glaciol. 55, 666–680. doi: 10.3189/002214309789470950
Shean, D. E., Alexandrov, O., Moratto, Z. M., Smith, B. E., Joughin, I. R., Porter, C., et al. (2016). An automated, open-source pipeline for mass production of digital elevation models (DEMs) from very-high-resolution commercial stereo satellite imagery. ISPRS J. Photogramm. Remote Sens. 116, 101–117. doi: 10.1016/j.isprsjprs.2016.03.012
Six, D., and Vincent, C. (2014). Sensitivity of mass balance and equilibrium-line altitude to climate change in the French Alps. J. Glaciol. 60, 867–878. doi: 10.3189/2014JoG14J014
Smiraglia, C., Azzoni, R. S., D'Agata, C., Maragno, D., Fugazza, D., and Diolaiuti, G. A. (2015). The evolution of the Italian glaciers from the previous data base to the New Italian Inventory. Preliminary considerations and results. Geogr. Fis. E Din. Quat. 38, 79–87. doi: 10.4461/GFDQ.2015.38.08
Thibert, E., Blanc, R., Vincent, C., and Eckert, N. (2008). Glaciological and volumetric mass-balance measurements: error analysis over 51 years for Glacier de Sarennes, French Alps. J. Glaciol. 54, 522–532. doi: 10.3189/002214308785837093
Toutin, T. (2002). Three-dimensional topographic mapping with ASTER stereo data in rugged topography. IEEE Trans. Geosci. Remote Sens. 40, 2241–2247. doi: 10.1109/TGRS.2002.802878
Vaughan, D. G., and Comiso, J. C. (2013). Observations: cryosphere, in Climate Change 2013: The Physical Science Basis. Contribution of Working Group I to the Fifth Assessment Report of the Intergovernmental Panel on Climate Change (Cambridge, United Kingdom and New York, NY, USA: Cambridge University Press).
Villa, F., De Amicis, M., and Maggi, V. (2007). Gis analysis of Rutor Glacier (Aosta Valley, Italy) volume and terminus variations. Geogr. Fis. E Din. Quat. 30, 87–95.
Vincent, C. (2002). Influence of climate change over the 20th Century on four French glacier mass balances. J. Geophys. Res. 107:4375. doi: 10.1029/2001jd000832
Vincent, C., Harter, M., Gilbert, A., Berthier, E., and Six, D. (2014). Future fluctuations of the Mer de Glace (French Alps) assessed using a parameterized model calibrated with past thickness changes. Ann. Glaciol. 55, 15–24. doi: 10.3189/2014AoG66A050
Vincent, C., Soruco, A., Six, D., and Le Meur, E. (2009). Glacier thickening and decay analysis from 50 years of glaciological observations performed on Glacier d'Argentière, Mont Blanc area, France. Ann. Glaciol. 50, 73–79. doi: 10.3189/172756409787769500
Wang, D., and Kääb, A. (2015). Modeling Glacier Elevation Change from DEM Time Series. Remote Sens. 7:10117. doi: 10.3390/rs70810117
Willis, M. J., Melkonian, A. K., Pritchard, M. E., and Ramage, J. A. (2012a). Ice loss rates at the Northern Patagonian Icefield derived using a decade of satellite remote sensing. Remote Sens. Environ. 117, 184–198. doi: 10.1016/j.rse.2011.09.017
Willis, M. J., Melkonian, A. K., Pritchard, M. E., and Rivera, A. (2012b). Ice loss from the Southern Patagonian Ice Field, South America, between 2000 and 2012. Geophys. Res. Lett. 39, 1–6. doi: 10.1029/2012GL053136
Keywords: glacier mass balance, remote sensing, digital elevation model (DEM), SRTM, remote sensing technology
Citation: Berthier E, Cabot V, Vincent C and Six D (2016) Decadal Region-Wide and Glacier-Wide Mass Balances Derived from Multi-Temporal ASTER Satellite Digital Elevation Models. Validation over the Mont-Blanc Area. Front. Earth Sci. 4:63. doi: 10.3389/feart.2016.00063
Received: 25 February 2016; Accepted: 13 May 2016;
Published: 07 June 2016.
Edited by:
Francisco José Navarro, Universidad Politécnica de Madrid, SpainReviewed by:
Matthias Holger Braun, Friedrich-Alexander-Universität Erlangen-Nürnberg, GermanyMauro Fischer, University of Fribourg, Switzerland
Copyright © 2016 Berthier, Cabot, Vincent and Six. This is an open-access article distributed under the terms of the Creative Commons Attribution License (CC BY). The use, distribution or reproduction in other forums is permitted, provided the original author(s) or licensor are credited and that the original publication in this journal is cited, in accordance with accepted academic practice. No use, distribution or reproduction is permitted which does not comply with these terms.
*Correspondence: Etienne Berthier, etienne.berthier@legos.obs-mip.fr