Understanding Drought Dynamics during Dry Season in Eastern Northeast Brazil
 Denis D. Costa
 Thiago A. da Silva Pereira
 Carlos R. Fragoso Jr.
 Kaveh Madani
 Cintia B. Uvo
- 1Department of Water Resources Engineering, Lund University, Lund, Sweden
- 2Department of Civil Engineering, Federal University of Pernambuco, Recife, Brazil
- 3Center for Technology, Federal University of Alagoas, Maceió, Brazil
- 4Centre for Environmental Policy, Imperial College London, London, UK
Eastern Northeast Brazil (ENEB) generally experiences a high variability in precipitation in the dry season, with amplitudes that can overcome 500 mm. The understanding of this variability can help in mitigating the socio-economic issues related to the planning and management of water resources this region, which is highly vulnerable to drought. This work aims to assess spatio-temporal variability of precipitation during the dry season and investigate the relationships between climate phenomena and drought events in the ENEB, using univariate (Spearman correlation) and multivariate statistical techniques, such as Principal Component Analysis, Cluster Analysis, and Maximum Covariance Analysis. The results indicate that the variability of precipitation in the dry season can be explained mainly (62%) by local physical conditions and climate conditions have a secondary contribution. Further analysis of the larger anomalous events suggests that the state of Atlantic and Pacific oceans can govern the occurrence of those events, and the conditions of Atlantic Ocean can be considered a potential modulator of anomalous phenomena of precipitation in ENEB.
Introduction
Understanding climate variability is essential to the better quantification of processes related to hydrological cycle in order to improve long-term forecasting of extreme events such as droughts (Silverman and Dracup, 2000; Morid et al., 2007; Labat, 2010; Massei and Fournier, 2012; Räsänen and Kummu, 2013). Droughts have potential impacts on society, environment and economy (Krol et al., 2006; Santos et al., 2010; Hastenrath, 2012; Mazdiyasni and AghaKouchak, 2015). Thus, major efforts have been made in the last decade to understand the dynamics of intensity and frequency of droughts, either by using teleconnection concepts to find relations between climate and drought indices (Morid et al., 2007; Ganguli and Reddy, 2014), or by analyzing the variability of drought indices (Santos et al., 2010; AghaKouchak, 2015; Mazdiyasni and AghaKouchak, 2015; Xu et al., 2015).
Northeastern Brazil (NEB) is known for being exposed to major drought events, notably in its semiarid portion, with serious social and economic implications for of over 20 million people (IBGE, 2010). The worst performing economic and social indicators of Brazil can be found in this part of the country (UNPD, 2013; Sena et al., 2014; Cunha et al., 2015) due to the absence of resilient drought planning and management institutions. In general, NEB experiences high intensity of hydrological extreme events and a large interannual variability of precipitation (Giannini et al., 2004). Spatially, precipitation in NEB is heterogeneous, ranging from an annual total of 300 mm in the semiarid region to 2000 mm in the coastal zone (Amorim et al., 2014; Campos, 2015; Cunha et al., 2015).
Different precipitation regimes can be found across the NEB region. For instance, the Northern Northeast Brazil (NNEB) is characterized by a rainy season (between February and May) with a large interannual variability (Uvo and Berndtsson, 1996; Uvo et al., 1998) and no precipitation during the major part of the dry season (October–December). In contrast, the Eastern Northeast Brazil (ENEB) can receive up to 500 mm of precipitation during the dry season. The precipitation in the dry season of the ENEB is essential to socio-economic stability in the region as it provides the required water resources to maintain the local agro-pastoral activities, mainly rain fed agriculture, as well as in the combat of starvation and malnutrition. Irrespective of the level of precipitation in the wet season, the occurrence of below-average precipitation in the dry season, has major impacts on vital drinking and irrigation water. Nevertheless, there remains a limited understanding of the precipitation variability during the dry season in the ENEB.
It is well known that large-scale global climate phenomena such as the El Nino- Southern Oscillation (ENSO) and anomalous patterns of Sea Surface Temperature (SST) in the tropical Atlantic play an important role in the droughts at NNEB during the rainy season (Uvo et al., 1998; Andreoli and Kayano, 2004, 2006; Giannini et al., 2004). Giannini et al. (2004) showed that the influence of ENSO over the NNEB precipitation can be intensified or hindered by the condition of the SST anomalies in the tropical Atlantic, suggesting that there is no univocal relationship between large-scale anomalous SST patterns and droughts in NNEB (Kane, 1997; Andreoli and Kayano, 2006).
Although many studies have shown advances in the understanding of the NEB drought dynamics, these studies mainly focus on the wet season of the NNEB. The precipitation dynamics of the ENEB is poorly understood (Da Silva et al., 2010; Amorim et al., 2014), especially during the dry season. Therefore, this work aims to fill this knowledge gap by investigating the spatio-temporal relationships between climate phenomena and drought events in the ENEB using multivariate statistical techniques. This knowledge is a first step toward long-term drought forecasting in the ENEB to improve water resources planning and management in the region.
Materials and Methods
Study Area
The Paraíba do Meio and Mundaú river basins are located in the ENEB, between 8°30′00″S to 10°00′00″S latitude and 35°30′00″W and 37°00′00″W longitude (Figure 1). The basins cover an area of 7283 km2 approximately (Paraíba do Meio and Mundaú river basins drain areas of 3157 and 4126 km2, respectively).

Figure 1. Paraíba do Meio and Mundaúriver basins located in ENEB.
The basins have similar climate-physiographic properties that vary greatly from the outlets (coastal zone) to the headwaters. The lower part of the basins is characterized by a humid climate with tropical forest, different from the upper part of the basins, which are semiarid. The central part of the basins is characterized by transition climate and vegetation between semiarid and tropical climate. The average annual precipitation in the upper part of the basins is about 800 mm while in the lower part of basins it is about 2000 mm (COTEC Consultoria Técnica Ltd., 1999). The annual precipitation regime is characterized by a wet season (May to July) when 50% of the annual precipitation is concentrated, and a dry season between October and December (Figure 2).
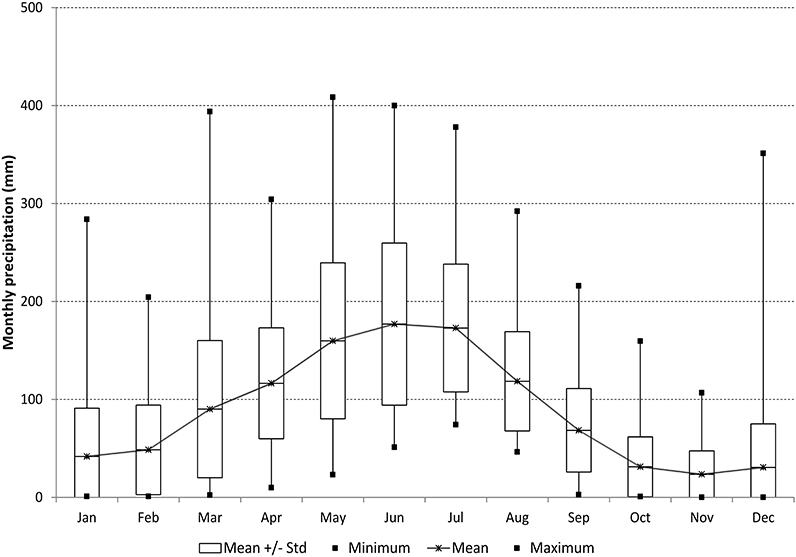
Figure 2. Monthly variability of precipitation in the study area. The three driest months occur from October to December, which presents an amplitude of accumulated precipitation up to 500 mm.
The total population in the Paraíba do Meio and Mundaú river basins is around 800 thousand inhabitants (IBGE, 2010) distributed among 35 municipalities. The livelihoods and economic activities are mainly livestock and rain fed agriculture (sugar cane and subsistence farming), which is highly correlated with variations in the available water resources. Therefore, climate variability and their impacts in water availability are significant for the livelihoods in the basins.
Data
The precipitation data in this study were collected from 18 well-distributed rainfall gauges, 10 belonging to the Brazilian National Water Agency (ANA) and 8 belonging to the Pernambuco Technology Institute (ITEP), on a daily time-scale from 1962 to 2008 (Figure 1). All daily precipitation data were qualitatively checked through consistency tests (Collischonn and Tucci, 2001). In addition, missing data in the individual rainfall gauges with gaps over 5% of the total sample were identified, and these gaps were filled using nearby stations up to 30 km through inverse distance square method (Xia et al., 1999).
From treated daily precipitation data, monthly time series of precipitation were derived, as well as the accumulated precipitation for the three driest months, October to December (OND). The OND precipitation time series were used to estimate 3-months Standardized Precipitation Index (SPI-3OND, according to McKee et al., 1993) in order to determine the intensity of drought at this timescale (Table 1). It is worth pointing out that this index can be also used to determine periods of anomalously wet events, as SPI measures rainfall anomalies.
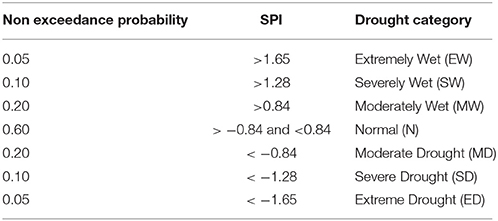
Table 1. Drought categorization according to the SPI values (adapted from Agnew, 2000).
Seven climate indices were used to investigate their possible relationships with drought events. These indices are related to Atlantic and Pacific conditions, such as the Atlantic Meridional Mode (AMM), which is divided into AMM_SST and AMM_Wind, Atlantic Multidecadal Oscillation (AMO), North Atlantic Oscillation (NAO), Pacific Decadal Oscillation (PDO), and El Niño Southern Oscillation (ENSO), which is measured by Southern Oscillation Index (SOI) and Niño 3.4 SST index. The climate indices were obtained at a monthly frequency from the database of the National Center for Atmospheric Research (NCAR) and National Oceanic and Atmospheric Administration (NOAA), using the same period for precipitation data. In addition, El Niño and La Niña events for OND were identified using a classification of cold and warm episodes considering the 3-month running mean by the Climate Prediction Center (CPC-NOOA).
AMM is a dominant source of variability in the tropical Atlantic (Chiang and Vimont, 2004), leading mode of basin-wide coupled ocean-atmosphere interaction between SST and low-level wind (Chiang and Vimont, 2004; Kossin and Vimont, 2007), which is historically known as interhemispheric or Atlantic dipole mode. AMO is a near-global scale mode of natural variability of the SST in the North Atlantic Ocean (Schlesinger and Ramankutty, 1994; Knight et al., 2006). NAO is a measure of the strength of the westerly winds blowing across the North Atlantic Ocean in the 40–60°N latitude belt (Greatbatch, 2000), producing large changes in the heat and moisture transport between Atlantic and the neighboring continents (Hurrell, 1995). PDO is an oceanic-atmospheric phenomenon and could be measured either by the intensity of the SST anomalies in Central North Pacific or a mean zonal Sea Level Pressure (SLP) anomalies over the North Pacific (Mantua et al., 1997). ENSO is considered as the dominant mode of the Pacific climate by an ocean-atmosphere coupled phenomenon associated with near-global climate variations (Rasmusson and Arkin, 1985; Gouirand and Moron, 2003; Räsänen and Kummu, 2013). SOI is the atmospheric component of the ENSO, calculated by the normalized difference between the intensity of the SLP at Darwin, Australia and at Tahiti (Trenberth, 1997; Singh, 2001; Labat, 2010). Niño 3.4 is a region in the central tropical Pacific where ENSO intensity can be measured by the intensity of the SST anomalies (Trenberth, 1997; Paz et al., 2011).
Spatial Patterns of OND Precipitation and Homogeneous Groups
Principal Component Analysis (PCA, e.g., Jackson, 1991) was applied using OND total precipitation (i.e., array with 47 years as rows and 18 rain gauges in the columns). This technique is useful in reducing the information in a large number of variables into a smaller set, and identifying the major part of the overall variance (Muñoz-Díaz and Rodrigo, 2004; Neto et al., 2014). The first and second components of the array of eigenvectors were evaluated to identify spatial patterns of rainfall co-variability. Physical factors that may explain the observed patterns in the first and second components are discussed in the conclusion section.
A cluster analysis was performed using the enough number of modes of the principal components to explain at least 75% of the total variance (Uvo, 2003). For this analysis the method of Ward (Uvo and Berndtsson, 1996; Muñoz-Díaz and Rodrigo, 2004) was used to identify Homogeneous Groups (HG) of rainfall stations with similar precipitation variability in the Paraíba do Meio and Mundaú river basins.
Spatio-Temporal Patterns of Droughts
The Homogeneous Groups (HG) determined by the Cluster Analysis were used to evaluate the temporal evolution and the percentage of the area in each HG affected by drought events considering different drought categories according to the SPI-3OND values. Drought categories are based on Agnew (2000) and shown in Table 1.
Spatio-Temporal Relationships between Climate and Drought Events
A Spearman rank correlation was applied to investigate the relationship between the time series (scores) of the two first modes of the PCA (defined as the projection of the original data onto the new PCA axes) and the average of climate indices from October to December. The rank correlation was considered due to its capacity to measure both linear and non-linear correlations between variables (Paz et al., 2011). The statistical significance of the correlation coefficient was checked by means of t-test and 95% significance was used.
In addition, aiming to assess climate interactions linked to drought phenomena, we carried out a comparison analysis of the state of the climate indices during drought episodes classified as moderate, severe or extreme categories (Table 1). Moreover, a Maximum Covariance Analysis (MCA) was carried out between global sea surface temperature and the spatial average precipitation for the two HG determined by the cluster analysis.
The MCA is a multivariate analysis procedure based on the singular value decomposition of the cross-covariance matrix between fields of two datasets. It allows the isolation of sets of mutually orthogonal pairs of spatial patterns that maximize the squared temporal covariance between the two physical variables. The theory of MCA has been discussed in Bretherton et al. (1992), where it was then named as Singular Value Decomposition, and has been largely applied since (e.g., Uvo et al., 1998; Czaja and Frankignoul, 2002; Rana et al., 2012, among many others). Results from the MCA may be presented as correlation coefficients between the values of each grid point of one field and the expansion coefficients of the other field. For this application, the patterns showed on each mode indicates how well the pattern of the precipitation (SST) anomalies relates to the expansion coefficient of SST (precipitation).
All data were standardized before being used in the MCA with the objective of eliminating possible scale effects (Uvo, 2003; Muñoz-Díaz and Rodrigo, 2004), by means of the equation below:
where xi is the observed value in the year i and rainfall station j, and and σj are the average and the standard deviation, respectively, in each rainfall station j.
All calculations were performed using the software MATLAB®. The outputs maps were produced in ArcGIS® 10.2.
Results
Spatial Patterns of OND Precipitation and Homogeneous Groups
The three first principal components together explain above 75% of the total variance of the OND precipitation. The first and the second principal components were found to be the most significant ones, both statistically and physically, explaining 62.59 and 8.63% of the total variance, respectively. The eigenvectors of the first principal component consist of positive values for the entire domain (Figure 3A), with higher values from outlet to center of the basins. A small reduction of the eigenvectors values in the upper part of the basins is noticed, mainly after a significant topographic barrier located at central eastern portion of Paraíba do Meio and Mundaú river basin. The eigenvector of the second principal component indicated a very clear separation between the upper and lower parts of the basins, consisting of both positive and negative values, respectively (Figure 3B), with a transition region in the central part of the basins. The cluster analysis (Figure 4) indicated two well-defined Homogenous Groups (HG1 and HG2) of OND precipitation, following mostly the spatial pattern found in the second principal component. The classification with three HGs was rejected because the third HG covers a non-distinct area in HG1 composed by only four rainfall gauges.
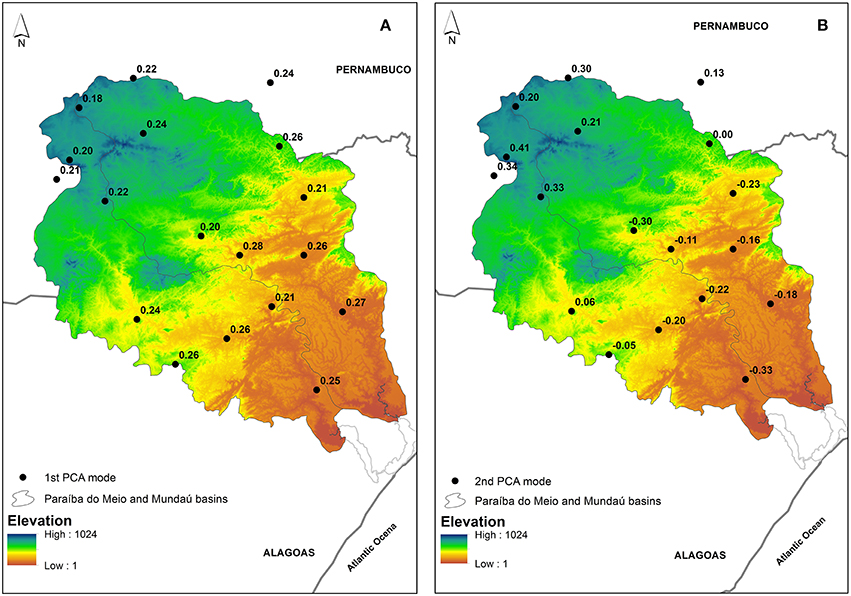
Figure 3. Eigenvectors of the co-variance matrix of the (A) first and (B) second PCA components of OND precipitation.
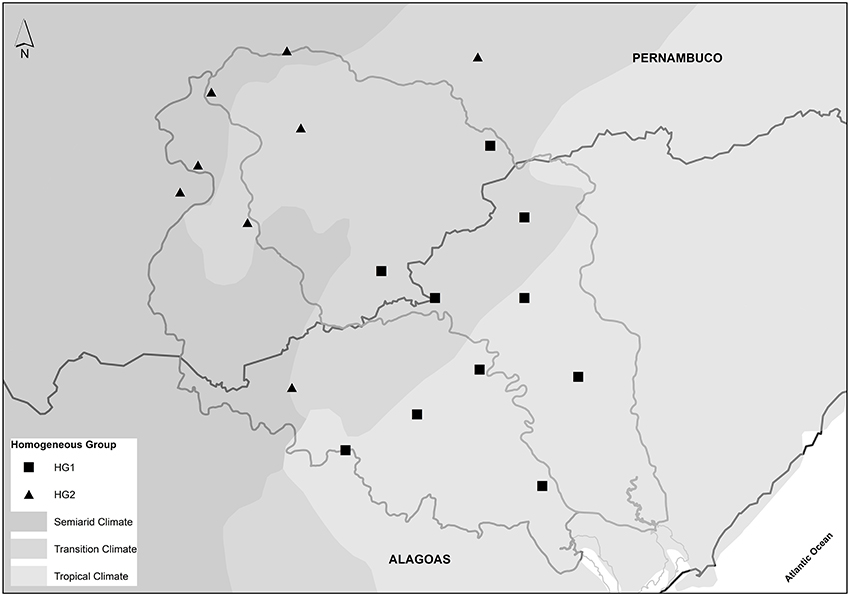
Figure 4. Cluster analysis of the spatial similarity of the OND precipitation (marks) and climatic classification (shades).
Spatio-Temporal Patterns of Droughts
Figure 5 shows a temporal evolution of the percentage of affected areas by different drought categories in the two defined Homogeneous Groups (HG1 and HG2). In general, the frequency of the events is similar in both Homogeneous Groups for drought events of larger spatial extension. For instance, the number of events affecting more than 50% of the area was 6 in HG1 and 8 in HG2. Considering the drought events that affected more than 70% of the area, only four events were observed for both Homogeneous Groups.
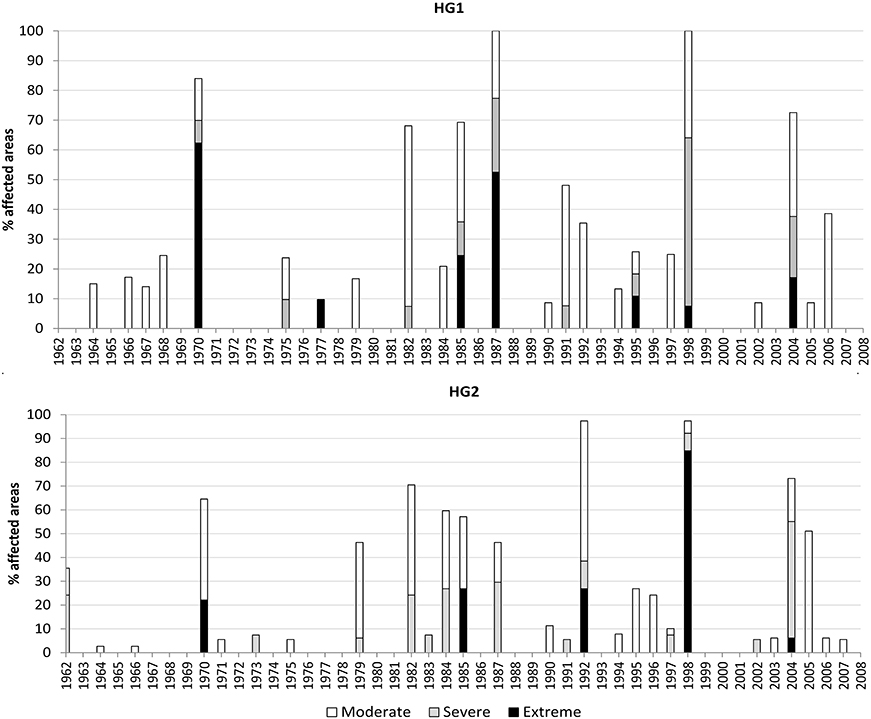
Figure 5. Temporal evolution of the percentage of affected areas by different drought categories of SPI3Oct-Dec, considering the two-defined Homogeneous Groups (HG1 and HG2) of the Cluster Analysis.
One isolated dry event of large spatial extension occurred in the 1970's, with affected area exceeding 65% of the total area. In the 80's, drought events were more frequently observed, with 3-years episodes affecting more than 50% of the HG1 and HG2. The major drought event of this decade took place in 1987, affecting the entire HG1 with 52% of this area classified in the extreme category of drought. The frequency of drought events had a remarkable increase in the 90's. However, in only 2-years isolated drought episodes (1992 and 1998) the affected area exceeded 50%. In 1998, specifically, the drought affected almost the whole study area, covering notably more than 80% of the area in HG2 as extreme category of drought.
Spatio-Temporal Relationships between Climate Indices and Drought Events
The Spearman correlations between the two first PCA modes and climate indices are presented in Table 2. Note that only NAO showed a negative and statistically significant correlation with the second PCA mode. The first PCA mode was better correlated with AMM_Wind, NAO, and AMO, although such negative correlations were not statistically significant. We also found correlation values to be predominately negative between all climate indices and both PCA modes.
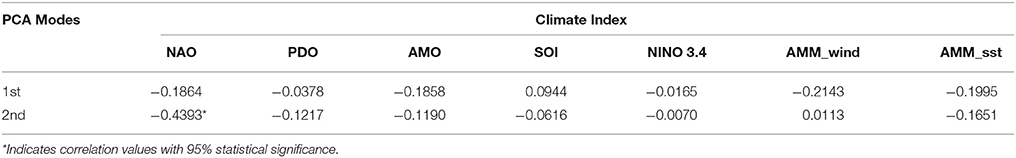
Table 2. Spearman correlation between the two first PCA modes and climate indices.
A general perspective of the state of the most statistically significant climate indices found in the correlation analysis in years with anomalous OND precipitation is shown in Table 3. We have selected only events with large spatial extension in the Homogeneous Groups, since they are more related to large-scale global climate phenomena.
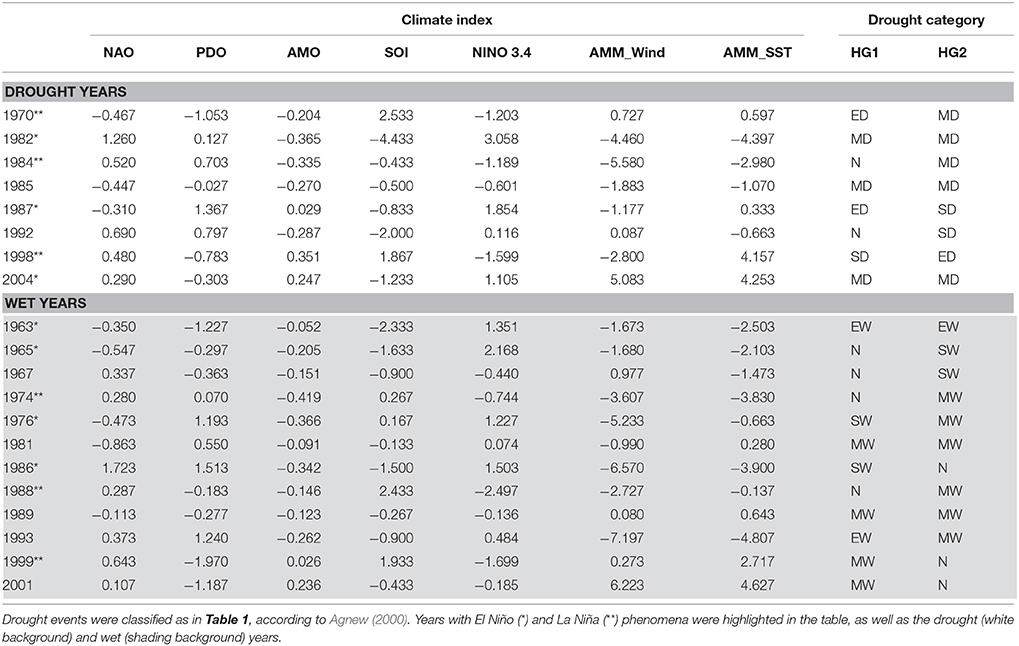
Table 3. State of the climate indices, in terms of anomaly values, for some anomalous episodes of OND precipitation that occurred over the Homogeneous Groups (HG1 and HG2).
Although positive and negative phases of Niño 3.4 are highly related to El Niño and La Niña years, respectively, the most drought and wet events predominantly occur in anomalous state of ENSO phenomena, but these events are not necessarily linked to El Niño or La Niña years. In general, the anomalous events of OND precipitation were predominantly observed during the negative phase of the AMM_Wind, which also showed higher magnitudes in El Niño or La Niña years. In addition, the phases of the Niño 3.4 and AMM_Wind seem to regulate drought category during non-El Niño and non-La Niña conditions. For instance, in these years, drought and wet events occurred when Niño 3.4 and AMM_Wind exhibited the same and different phases, respectively. The driest (e.g., 1970, 1987, and 1998) and wettest (e.g., 1963, 1976, and 1993) episodes in terms of spatial extension and intensity occurred in years with the positive and negative phase of AMM_SST, respectively. However, the states of ENSO and AMM_Wind also can influence those driest and wettest events, mainly for less intense anomalies of AMM_SST (i.e., below to 1.00 in term of absolute values). For instance, in 1987 occurred an El Niño episode that likely favored a driest condition. In 1976, the intense and negative phase of AMM_Wind may have contributed for a wettest condition in the ENEB, overcoming the El Niño effect in this year. There is no well-defined relationship between drought categories and the state of PDO, NAO, and AMO.
Maximum Covariance Analysis
Results from the two first modes of the MCA are presented in Figure 6. The first mode, that has a squared covariance fraction (SCF) of 55.1%, shows that precipitation for the two HG are not correlated with any SST pattern connected to known climate variability phenomena. On the other hand, the SST pattern of the second mode (SCF of 28.1%) is clearly recognizable as ENSO and other climate variability patterns with higher statistically significant correlations along the Tropical Pacific Ocean, east Tropical Atlantic and Indian Ocean.
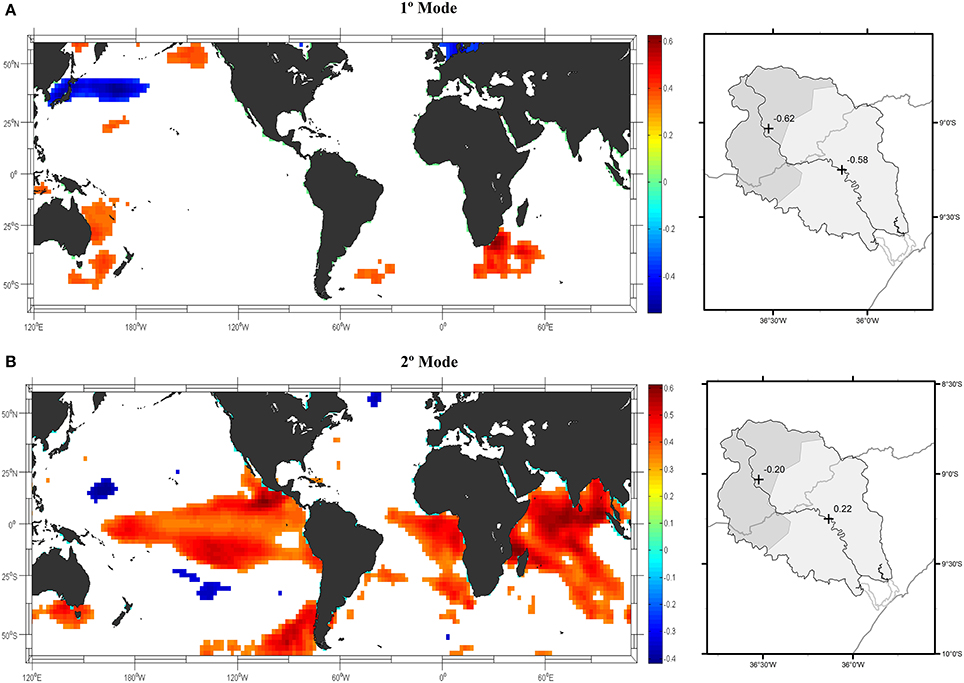
Figure 6. Heterogeneous correlation maps for the first (A) and second (B) modes of the MCA for OND global SST (left panel) and OND precipitation (right panel) for each HG. Only significant correlation at 95% are showed in the SST maps. Positive and negative correlation values are in red and blue colors, respectively.
Discussion
The two Homogeneous Groups defined by Cluster Analysis were closely related to the first and second PCA modes. The spatial structure presented by the eigenvectors of the first PCA mode corresponds closely to the spatial distribution of the physiographic characteristics in the region (topography barriers), suggesting that it represents the OND precipitation co-variability as determined by the influence of the topography on the small and synoptic scales meteorology. In addition, its PCA scores represent the temporal variability of the interaction of local and synoptic scales meteorology with the topography. This interpretation is supported by the lack of significant correlation between the scores and the time series of climatic indices presented in Table 1. The second PCA mode is related to the large-scale climatic conditions over the area. Its eigenvector spatial structure is in agreement with the climatic differences in the region, i.e., semiarid and tropical climate in the upper and lower part of the basins, respectively. Moreover, the temporal variability in this mode is correlated to global climatic phenomena by teleconnections as seen in Table 1. This connection is also supported by the MCA results that clearly shows SST patterns representative of known climate phenomena such as ENSO, correlated to precipitation of the two HG in the second mode, while the first mode does not present any SST recognized pattern.
Although the study area has been sub-divided in two distinct Homogeneous Groups, notably the drought events with larger spatial extension seems to affect both Groups similarly in terms of affected areas and intensity of drought. This suggests that global climate phenomena, which cover large geographic areas, can govern driest events in the study area.
It was also observed that a small area of the basins, located in the upper part of HG2, is frequently more affected by drought events of low spatial extension. This small area is entirely inserted in Brazilian semiarid, which is well known as a very vulnerable region to drought events (Krol et al., 2006; UNICEF, 2006; Mesquita and Bursztyn, 2014; Sena et al., 2014). The vulnerability in that region is mainly due its natural characteristics (i.e., lower rainfall amount in season wet, higher rates of annual evapotranspiration and crystalline substrate) to be prone of droughts (Krol et al., 2006; Campos, 2015). In addition, the underdevelopment conditions of the Brazilian semiarid in social and infrastructure aspects also can intensify the drought effects, especially for the rural population, where the economic activity is basically subsistence agriculture in an extreme poverty environment (Cunha et al., 2015). As an example, the most recent drought (from 2012 to 2013), reaching in economic losses costs of greater than US $4.6 billion due to cattle mortality, crop's damage and insurance claims (Campos, 2015; Cunha et al., 2015). This extreme drought event demanded a significant assistance from the Brazilian government to drought-affected population with drought relief programs and using tank trucks to draw water from reliable sources for public consumption (Campos, 2015). Thus, it is important to highlight that even though this small area of HG2 experiences less intense drought events than in HG1, the socio-economic impacts in this area are certainly more significant.
Larger anomalous episodes of OND precipitation seem to be more related to stronger anomalies of some analyzed climate indexes, suggesting a cause-and-effect relationship between climate aspects and driest/wettest years. Therefore, this understanding can mitigate regional vulnerability in the NEB and avoiding social-economics losses (Andreoli and Kayano, 2006; Amorim et al., 2014; Sena et al., 2014; Campos, 2015).
We showed that NAO might have a secondary role on the interannual variability of OND precipitation, since this index was better correlated to the second PCA mode and this mode only explains a small part of the total variance of OND precipitation in the study area. Although some studies have indicated that state of NAO can influence the conditions in the Tropical Atlantic (Greatbatch, 2000; Mo and Hakkinen, 2001; Czaja et al., 2002; Chiang and Vimont, 2004), for instance through an interhemispheric relationship between North and South Atlantic (Robertson et al., 2000; Mo and Hakkinen, 2001), our results find only a slight effect of North Pacific on OND precipitation in ENEB.
On the other hand, the state of climate indices, such as Niño 3.4, AMM_Wind and AMM_SST, seem to modulate the development of larger anomalous events of OND precipitation in terms of spatial extension and intensity, suggesting that conditions in the Tropical Pacific and Atlantic can play an important role in the occurrence of more extreme events in ENEB, in agreement with results presented by Andreoli and Kayano (2006) for the entire NEB and by Amorim et al. (2014) for ENEB.
Our results showed that the state of the Tropical Atlantic determines the occurrence of the larger anomalous events in ENEB and ENSO can intensify or inhibit the total of the OND precipitation. Indeed, the positive (or negative) phase of AMM_SST is closely related to the reduction (or enhancement) of precipitation over the NEB as expressed by Chiang and Vimont (2004). Thus, the state of AMM seems to be a potential indicator for larger anomalies of the OND precipitation. In addition, it is well known that ENSO strongly influence the variability of precipitation in NEB for the rainy season (Nobre and Shukla, 1996; Uvo et al., 1998; Giannini et al., 2004; Andreoli and Kayano, 2005), since in El Niño years the equatorial convection is displacement eastward, creating a subsidence area over NEB, which can inhibit precipitation in NEB. Our findings suggest an unclear interannual relationship between ENSO and anomalous precipitation events in ENEB during the dry season, as wet episodes may occur during El Niño years and dry ones during La Niña years. Such unexpected association between ENSO and OND precipitation in ENEB may be explained either by the influence of other factors (e.g., Tropical Atlantic SST condition) on OND precipitation anomalies, which may disrupt this interannual relationship (Kane, 2001), or due to the most prominent long-term relationship (Kane, 1999). Indeed, we only could find few years with strong ENSO anomalies (e.g., 1982 and 1999) in which Pacific conditions seem to have overcome the effect of Tropical Atlantic conditions on anomalies of precipitation in ENEB.
Notably, the larger anomalous episodes of OND precipitation were not well related to the state of long-term climate indices, such as PDO and AMO. This suggests deeper investigations are needed to get a better understanding of the relationship between OND precipitation and those indices, such as spectral analysis to track non-linear patterns in different time-frequencies.
Author Contributions
DC, Study conception and design, Acquisition of data, Analysis and interpretation of data, Drafting of manuscript and Critical revision. TS, Study conception and design, Acquisition of data, Analysis and interpretation of data and Drafting of manuscript. CF, Study conception and design, Analysis and interpretation of data, Drafting of manuscript, Critical revision. KM, Analysis and interpretation of data and Critical revision. CU, Study conception and design, Analysis and interpretation of data and Critical revision.
Conflict of Interest Statement
The authors declare that the research was conducted in the absence of any commercial or financial relationships that could be construed as a potential conflict of interest.
Acknowledgments
The first author would like to thank CAPES Foundation, Ministry of Education of Brazil by the scholarship granted in the process n° BEX 13470/13-2. We are also grateful to institutional grants provided by The Swedish Foundation for International Cooperation in Research and Higher Education (STINT) through Research Links Project, which funded the international cooperation between Lund University and Federal University of Alagoas and to the Swedish Research Council (Vetenskapsrådet) that partially finances KM and CU. The authors also would like to thank the anonymous referees, who helped to significantly improve the quality and the clarity of this manuscript.
References
AghaKouchak, A. (2015). A multivariate approach for persistence-based drought prediction: application to the 2010–2011 East Africa drought. J. Hydrol. 526, 127–135. doi: 10.1016/j.jhydrol.2014.09.063
Amorim, A. C. B., Chaves, R. R., and Silva, C. M. S. (2014). Influence of the tropical Atlantic Ocean's sea surface temperature in the eastern northeast Brazil precipitation. Atmos. Clim. Sci. 4, 874–883. doi: 10.4236/acs.2014.45077
Andreoli, R. V., and Kayano, M. T. (2004). Multi-scale variability of the sea surface temperature in the Tropical Atlantic. J. Geophys. Res. 109, 1–12. doi: 10.1029/2003JC002220
Andreoli, R. V., and Kayano, M. T. (2005). ENSO-related rainfall anomalies in South America and associated circulation features during warm and cold Pacific decadal oscillation regimes. Int. J. Climatol. 25, 2017–2030. doi: 10.1002/joc.1222
Andreoli, R. V., and Kayano, M. T. (2006). Tropical Pacific and South Atlantic effects on rainfall variability over Northeast Brazil. Int. J. Climatol. 26, 1895–1912. doi: 10.1002/joc.1341
Bretherton, C. S., Smith, C., and Wallace, J. M. (1992). An intercomparison of methods for finding coupled patterns on climate data. J. Clim. 5, 541–560.
Campos, J. N. B. (2015). Paradigms and public policies on drought in northeast Brazil: a historical perspective. Environ. Manage. 55, 1052–1063. doi: 10.1007/s00267-015-0444-x
Chiang, J. C. H., and Vimont, D. J. (2004). Analogous Pacific and Atlantic meridional modes of tropical atmosphere-ocean variability. J. Clim. 17, 4143–4158. doi: 10.1175/JCLI4953.1
Collischonn, W., and Tucci, C. E. M. (2001). Simulação Hidrológica de Grandes Bacias. RBRH - Rev. Bras. Recur. Hídricos 6, 95–118.
COTEC Consultoria Técnica Ltd. (1999). Plano Diretor de Recursos Hídricos da Bacia do Rio Mundaú. Recife: Governo do Estado de Pernambuco - Secretaria de Recursos Hídricos.
Cunha, A. P. M., Alvalá, R. C., Nobre, C. A., and Carvalho, M. A. (2015). Monitoring vegetative drought dynamics in the Brazilian semiarid region. Agric. For. Meteorol. 214-215, 494–505. doi: 10.1016/j.agrformet.2015.09.010
Czaja, A., and Frankignoul, C. (2002). Observed impact of Atlantic SST anomalies on the North Atlantic oscillation. J. Clim. 15, 606–623. doi: 10.1175/1520-0442(2002)015<0606:OIOASA>2.0.CO;2
Czaja, A., Van der Vaart, P., and Marshall, J. (2002). A diagnostic study of the role of remote forcing in tropical Atlantic variability. J. Clim. 15, 3280–3290. doi: 10.1175/1520-0442(2002)015<3280:ADSOTR>2.0.CO;2
Da Silva, D. F., de Sousa, F. A. S., and Kayano M. T. (2010). Escalas temporais da variabilidade pluviométrica na bacia hidrográfica do rio mundaú. Rev. Br. Meteorol. 25, 324–332. doi: 10.1590/S0102-77862010000300004
Ganguli, P., and Reddy, M. J. (2014). Ensemble prediction of regional droughts using climate inputs and the SVM-copula approach. Hydrol. Process. 5009, 4989–5009. doi: 10.1002/hyp.9966
Giannini, A., Saravanan, R., and Chang, P. (2004). The preconditioning role of tropical Atlantic variability in the development of the ENSO teleconnection: implications for the prediction of Nordeste rainfall. Clim. Dyn. 22, 839–855. doi: 10.1007/s00382-004-0420-2
Gouirand, I., and Moron, V. (2003). Variability of the impact of El Nino -southern oscillation on sea-level pressure anomalies over the North Atlantic in January to March (1874-1996). Int. J. Climatol. 23, 1549–1566. doi: 10.1002/joc.963
Greatbatch, R. J. (2000). The north Atlantic oscillation. Stoch. Environ. Res. Risk Assess. 14, 213–241. doi: 10.1007/s004770000047
Hastenrath, S. (2012). Exploring the climate problems of Brazil's Nordeste: a review. Clim. Change 112, 243–251. doi: 10.1007/s10584-011-0227-1
Hurrell, J. W. (1995). Decadal trends in the North Atlantic Oscillation: regional temperatures and precipitation. Science 269, 676–679. doi: 10.1126/science.269.5224.676
IBGE (2010). Instituto Brasileiro de Geografia e Estatística. Características Gerais da População, Religião e Pessoas Com Deficiência. CENSO DEMOGRÁFICO 2010. Rio de Janeiro: IBGE.
Kane, R. P. (1997). Prediction of droughts in north-east Brazil: role of ENSO and use of periodicities. Int. J. Climatol. 17, 655–665.
Kane, R. P. (1999). Rainfall extremes in some selected parts of central and South America: ENSO and other relationships reexamined. Int. J. Climatol. 19, 423–455.
Kane, R. P. (2001). Interrelationship and ENSO relationship of Fortaleza rainfall in different seasons. Rev. Br. Geofísica 19, 199–214. doi: 10.1590/S0102-261X2001000200008
Knight, J. R., Folland, C. K., and Scaife, A. A. (2006). Climate impacts of the Atlantic Multidecadal Oscillation. Geophys. Res. Lett. 33, L17706. doi: 10.1029/2006GL026242
Kossin, J. P., and Vimont, D. J. (2007). A more general framework for understanding atlantic hurricane variability and trends. Bull. Am. Meteorol. Soc. 88, 1767–1781. doi: 10.1175/BAMS-88-11-1767
Krol, M., Jaeger, A., Bronstert, A., and Güntner, A. (2006). Integrated modelling of climate, water, soil, agricultural and socio-economic processes: a general introduction of the methodology and some exemplary results from the semi-arid north-east of Brazil. J. Hydrol. 328, 417–431. doi: 10.1016/j.jhydrol.2005.12.021
Labat, D. (2010). Cross wavelet analyses of annual continental freshwater discharge and selected climate indices. J. Hydrol. 385, 269–278. doi: 10.1016/j.jhydrol.2010.02.029
Mantua, N. J., Hare, S. R., Zhang, Y., Wallace, J. M., and Francis, R. C. (1997). A pacific interdecadal climate oscillation with impacts on salmon production. Bull. Am. Meteorol. Soc. 78, 1069–1079.
Massei, N., and Fournier, M. (2012). Assessing the expression of large-scale climatic fluctuations in the hydrological variability of daily Seine river flow (France) between 1950 and 2008 using Hilbert-Huang Transform. J. Hydrol. 448–449, 119–128. doi: 10.1016/j.jhydrol.2012.04.052
Mazdiyasni, O., and AghaKouchak, A. (2015). Substantial increase in concurrent droughts and heatwaves in the United States. Proc. Natl. Acad. Sci. U.S.A. 112, 11484–11489. doi: 10.1073/pnas.1422945112
McKee, T. B., Doesken, N. J., and Kleist, J. (1993). “The relationship of drought frequency and duration to time scales,” in AMS 8th Conference of Applied Climatology (Anaheim, CA), 179–184.
Mesquita, P. S., and Bursztyn, M. (2014). “Climate variability in semi-arid brazil?: food insecurity, agricultural production and adjustment to perceived changes,” in International Policy Center for Inclusive Growth (Brasilia: United Nations Development Programme).
Mo, K. C., and Hakkinen, S. (2001). Interannual variability in the tropical Atlantic and linkages to the Pacific. J. Clim. 14, 2740–2762. doi: 10.1175/1520-0442(2001)014<2740:IVITTA>2.0.CO;2
Morid, S., Smakhtin, V., and Bagherzadeh, K. (2007). Drought forecasting using artificial neural networks and time series of drought indices. Int. J. Climatol. 27, 2103–2111. doi: 10.1002/joc.1498
Muñoz-Díaz, D., and Rodrigo, F. S. (2004). Spatio-temporal patterns of seasonal rainfall in Spain (1912-2000) using cluster and principal component analysis: comparison. Ann. Geophys. 22, 1435–1448. doi: 10.5194/angeo-22-1435-2004
Neto, J. L. R., Fragoso, C. R. Jr., Malhado, A. C. M., and Ladle, R. J. (2014). Spatio-temporal variability of chlorophyll-a in the coastal zone of northeastern Brazil. Estuaries Coasts 38, 72–83. doi: 10.1007/s12237-014-9809-2
Nobre, P., and Shukla, J. (1996). Variations of sea surface temperature, wind stress, and rainfall over the tropical Atlantic and South America. J. Clim. 9, 2464–2479.
Paz, A. R., Uvo, B. C., Bravo, J. M., Collischonn, W., and Da Rocha, H. R. (2011). Seasonal “Precipitation forecast based on Artificial neural networks,” Computation Methods for Agricultural Research: Advances and Applications, eds H. A. Prado, H. Chaib Filho, and A. J. B. Luiz (New York, NY: Hershey), Chapter. 16, 326–354.
Rana, A., Uvo, C. B., Bengtsson, L., and Sarthi, P. P. (2012). Trend analysis for rainfall in Delhi and Mumbai, India. Clim. Dyn. 32, 45–56. doi: 10.1007/s00382-011-1083-4
Räsänen, T. A., and Kummu, M. (2013). Spatiotemporal influences of ENSO on precipitation and flood pulse in the Mekong River Basin. J. Hydrol. 476, 154–168. doi: 10.1016/j.jhydrol.2012.10.028
Rasmusson, E. M., and Arkin, P. A. (1985). “Interannual climate variability associated with the El Nino/Southern oscillation,” in Coupled Ocean-Atmosphere Models, ed J. C. J. Nihoul (Amsterdam: Elsevier Science Publishers), 289–302.
Robertson, A. W., Mechoso, C. R., and Kim, Y.-J. (2000). The influence of atlantic sea surface temperature anomalies on the North Atlantic Oscillation. J. Clim. 13, 122–138. doi: 10.1175/1520-0442(2000)013<0122:TIOASS>2.0.CO;2
Santos, J. F., Pulido-Calvo, I., and Portela, M. M. (2010). Spatial and temporal variability of droughts in Portugal. Water Resour. Res. 46, 1–13. doi: 10.1029/2009WR008071
Schlesinger, M. E., and Ramankutty, N. (1994). An oscillation in the global climate system of period 65–70 years. Nature 367, 723–726. doi: 10.1038/367723a0
Sena, A., Barcellos, C., Freitas, C., and Corvalan, C. (2014). Managing the health impacts of drought in Brazil. Int. J. Environ. Res. Public Health 11, 10737–10751. doi: 10.3390/ijerph111010737
Silverman, D., and Dracup, J. A. (2000). Artificial neural networks and long-range precipitation prediction in California. J. Appl. Meteorol. 39, 57–66. doi: 10.1175/1520-0450(2000)039<0057:ANNALR>2.0.CO;2
Singh, O. P. (2001). Multivariate ENSO index and Indian monsoon rainfall: relationships on monthly and subdivisional scales. Meteorol. Atmos. Phys. 78, 1–9. doi: 10.1007/s007030170001
UNICEF (2006). The United Nations Children's Fund. UNICEF in the Brazilian semi-arid. National Pact a World for Children and Adolescents in the Semi-Arid. Brasília: UNICEF.
UNPD (2013). United Nations Development Programme. Índice de Desenvolvimento Humano Municipal Brasileiro. Atlas do Desenvolvimento Humano no Brasil. Brasilia: UNPD.
Uvo, C. B. (2003). Analysis and regionalization of northern European winter precipitation based on its relationship with the North Atlantic oscillation. Int. J. Climatol. 23, 1185–1194. doi: 10.1002/joc.930
Uvo, C. B., Repelli, C. A., Zebiak, S. E., and Kushnir, Y. (1998). The relationships between tropical Pacific and Atlantic SST and northeast Brazil monthly precipitation. J. Clim. 11, 551–562.
Uvo, C. R. B., and Berndtsson, R. (1996). Regionalization and spatial properties of Ceará state rainfall in Northeast Brazil. J. Geophys. Res. 101, 4221–4233. doi: 10.1029/95JD03235
Xia, Y., Fabian, P., Stohl, A., and Winterhalter, M. (1999). Forest climatology: estimation of missing values for Bavaria, Germany. Agric. For. Meteorol. 96, 131–144. doi: 10.1016/S0168-1923(99)00056-8
Keywords: drought, extreme events, climate indices, semiarid, Northeast Brazil
Citation: Costa DD, da Silva Pereira TA, Fragoso Jr. CR, Madani K and Uvo CB (2016) Understanding Drought Dynamics during Dry Season in Eastern Northeast Brazil. Front. Earth Sci. 4:69. doi: 10.3389/feart.2016.00069
Received: 02 February 2016; Accepted: 05 June 2016;
Published: 22 June 2016.
Edited by:
David Lewis Feldman, University of California, Irvine, USAReviewed by:
Eduardo Zorita, Hemlholtz-Zentrum Geesthacht, GermanySally Rangecroft, University of Birmingham, UK
Copyright © 2016 Costa, da Silva Pereira, Fragoso, Madani and Uvo. This is an open-access article distributed under the terms of the Creative Commons Attribution License (CC BY). The use, distribution or reproduction in other forums is permitted, provided the original author(s) or licensor are credited and that the original publication in this journal is cited, in accordance with accepted academic practice. No use, distribution or reproduction is permitted which does not comply with these terms.
*Correspondence: Denis D. Costa, denis.duda_costa@tvrl.lth.se