Seasonal Variations in Ice-Front Position Controlled by Frontal Ablation at Glaciar Perito Moreno, the Southern Patagonia Icefield
 Masahiro Minowa
 Shin Sugiyama
 Daiki Sakakibara1,2,3
 - 1Institute of Low Temperature Science, Hokkaido University, Sapporo, Japan
- 2Graduate School of Environmental Science, Hokkaido University, Sapporo, Japan
- 3Arctic Research Center, Hokkaido University, Sapporo, Japan
- 4Glaciarium - Glacier Interpretive Center, El Calafate, Argentina
The front position of calving glaciers is controlled by ice speed and frontal ablation which consists of the two processes of calving and subaqueous melting. However, the relative importance of these processes in frontal variation is difficult to assess and poorly understood, particularly for freshwater calving glaciers. To better understand the mechanism of seasonal variations involved in the ice front variations of freshwater calving glaciers, we measured front position, ice surface speed, air temperature, and proglacial lakewater temperature of Glaciar Perito Moreno in Patagonia. No substantial fluctuations in front position and ice speed occurred during the 15-year period studied (1999–2013), despite a warming trend in air temperature (0.059°C a−1). Seasonal variations were observed both in the ice-front position (±50 m) and ice speed (±15%). The frontal ablation rate, computed from the frontal displacement rate and the ice speed, varied in a seasonal manner with an amplitude approximately five times greater than that in the ice speed. The frontal ablation correlated well with seasonal lakewater temperature variations (r = 0.96) rather than with air temperature (r = 0.86). Our findings indicate that the seasonal ice front variations of Glaciar Perito Moreno are primarily due to frontal ablation, which is controlled through subaqueous melting by the thermal conditions of the lake.
1. Introduction
The Patagonian icefields form the largest temperate glacier system in the Southern Hemisphere. Recent studies indicate that the icefields are losing ice mass at one of the fastest rates in the world (Rignot et al., 2003; Kaser et al., 2006; Jacob et al., 2012; Gardner et al., 2013). Of 69 major outlet glaciers in the region, 49 flow into lakes and the rest flow into the ocean (Warren and Aniya, 1999). Most of the calving glaciers have been retreating over the last several decades (Aniya et al., 1997; Rignot et al., 2003; Masiokas et al., 2009; Lopez et al., 2010) as a result of warming climate (e.g., Lopez et al., 2010; Schaefer et al., 2015). For example, Glaciar Upsala, a freshwater calving glacier in the Southern Patagonia Icefield (SPI), has been retreating and thinning since 2008, at rates significantly greater than those of other glaciers in Patagonia (Muto and Furuya, 2013; Sakakibara et al., 2013; Sakakibara and Sugiyama, 2014), and mass loss from this glacier accounted for about 15% of the total mass loss from the SPI between 2000 and 2012 (Willis et al., 2012).
Rapid retreat and speed-up have been observed at numerous calving glaciers in Greenland (e.g., Howat et al., 2005; Amundson et al., 2008; Moon et al., 2012, 2015), Alaska (e.g., Meier and Post, 1987; Boyce et al., 2007; McNabb and Hock, 2014) and Patagonia (e.g., Naruse and Skvarca, 2000; Rivera et al., 2012; Sakakibara et al., 2013; Sakakibara and Sugiyama, 2014). The rapid changes take place when a glacier terminus retreats from a bedrock rise into deeper water along a reversed bed slope (e.g., Howat et al., 2005). The initial retreat is often associated with warming air temperature and/or water temperature, but subsequent retreat and acceleration are attributed to dynamic response of the glacier to the change in the force balance near the front (Carr et al., 2014, 2015). Therefore, it is increasingly important to study in detail the changes near the calving front.
The temporal and spatial resolutions of satellite data are improving, which enables us to study seasonal variations in glacier front position. It provides clues to better understand the response of calving glaciers to external forcings. Studies on frontal seasonal variations have been carried out on tidewater glaciers in Greenland (Howat et al., 2010; Joughin et al., 2012; Carr et al., 2013; Schild and Hamilton, 2013; Moon et al., 2015) and Alaska (Ritchie et al., 2008; Bartholomaus et al., 2013; McNabb and Hock, 2014; Stearns et al., 2015). For example, Howat et al. (2010) investigated six large marine-terminating glaciers in West Greenland with a temporal resolution of several weeks. The results suggest that glacier retreat was initiated by a lack of spring re-advance, as well as by longer-lasting summer calving seasons (Howat et al., 2010). Therefore, investigating seasonal variations in front position and their driving mechanisms are important to understand long-term glacier fluctuation. McNabb and Hock (2014) investigated the front positions of 50 tidewater glaciers in Alaska from 1984–2012. They also found that the glacier's rapid retreat coincided with a positive ocean temperature anomaly. The relationship between the retreat and ocean temperature suggests the importance of lakewater temperature on the retreat of freshwater calving glaciers.
Width-averaged displacement rate of the ice front position of a calving glacier (dL/dt) is given by
where um is the ice flow speed at the glacier front, is the calving rate, and is the melting rate in horizontal direction, occurring mostly below the water surface (Cuffey and Paterson, 2010). While the ice-front position and the flow speed are relatively easy to measure using satellite data, calving and melting in water are difficult to observe. An approach commonly taken in previous studies is to define frontal ablation rate, , as the sum of and , and compute the frontal ablation as a residual of dL/dt and um (e.g., Warren et al., 2001; Haresign and Warren, 2005; Luckman et al., 2015; McNabb et al., 2015). Recent studies on tidewater glaciers have shown that calving () and melting under waterline () vary in time under the influence of atmospheric and fjord water conditions (e.g., Benn et al., 2007; Bartholomaus et al., 2013; Luckman et al., 2015; Pȩtlicki et al., 2015). For example, it is hypothesized that crevasses filling with meltwater enhances calving in summer season due to hydrofracture (Benn et al., 2007). Bartholomaus et al. (2013) measured a large seasonal variations in submarine melt rate at tidewater glacier in Alaska. The submarine melt rate was >9 m d−1 as a lower bound, which corresponded to at least 50% of the frontal ablation rate of this glacier (Bartholomaus et al., 2013). The study implied that subaerial calving was likely paced by the rate at which submarine melt undercut the terminus. Similarly large submarine melt rates were reported in West Greenland as well (e.g., Rignot et al., 2016), and their link with ocean circulation is intensively investigated in recent studies (e.g., Straneo et al., 2013). Amundson et al. (2010) proposed the importance of back stress from ice-mélange in front of Jakobshavn Isbræ, a tidewater glacier in west Greenland. Ice-mélange inhibits calving, which resulted in a glacier advance of 5 km over winter. Another process relevant to calving is thermal notch formation on the calving front, which is suspected as a triggering mechanism of calving (e.g., Pȩtlicki et al., 2015). These observations were mostly reported in tidewater glaciers, with very few similar studies of freshwater calving glaciers. Driving mechanisms of the ice front position change are poorly understood in Patagonia, where 70% of the large outlet glaciers terminate in lakes (Aniya et al., 1997).
A limited number of studies on processes near the front of freshwater calving glaciers indicate some similarities and some differences with tidewater glaciers (e.g., Carrivick and Tweed, 2013). Both lake and ocean water influences subglacial hydraulic conditions, which favors fast ice flow of calving glaciers near the front (e.g., Meier and Post, 1987; Tsutaki et al., 2013). The fast flow causes formation of crevasses at the glacier surface, which causes calving. Thermal notch formation at the waterline on the calving cliff is observed at both freshwater and tidewater glaciers, and is considered to be a triggering mechanism of subaerial calving (e.g., Kirkbride and Warren, 1997; Vieli et al., 2002; Röhl, 2006; Pȩtlicki et al., 2015). When a lake is sufficiently deep, ice reaches flotation, as observed in tidewater glacier, which results in an increase in the calving rate and retreat (e.g., Naruse and Skvarca, 2000; Boyce et al., 2007; Tsutaki et al., 2011; Sakakibara et al., 2013). Despite these similarities, the calving rate of freshwater calving glaciers is generally one order of magnitude smaller than tidewater glaciers in similar settings (e.g., Warren et al., 1995; Skvarca et al., 2002). The rate of subaqueous melting is also thought to be smaller than that of tidewater glaciers (Truffer and Motyka, 2016). Previous studies attributed these differences in the rate of frontal ablation in the ocean and lakes to water densities, fjord circulation, frontal ice surface steepening and longitudinal strain rates (Funk and Röthlisberger, 1989; Warren et al., 1995; van der Veen, 2002; Benn et al., 2007). Most importantly, lakewater circulation is expected to be substantially different from fjord circulation due to a lack of density contrast between glacial meltwater and lakewater. Nevertheless, mechanisms connecting these processes with calving and melting are complex, and their relative importance for frontal variations is poorly understood in freshwater calving glaciers.
In this study, we measure the front position and the surface speed of Glaciar Perito Moreno (GPM) in Patagonia to investigate seasonal variations in the ice-front position. Using the front position and ice speed observed with a temporal resolution of several weeks to months, we calculate the frontal ablation rate. These variables were then compared with atmospheric and lakewater temperatures to investigate the driving mechanism behind seasonal variations in the ice-front position. The results of the study provide an insight into the processes controlling the retreating trends observed in freshwater calving glaciers in Patagonia.
2. Study Site
GPM (50.5°S, 73.2°W) is a freshwater calving glacier in the SPI, which stretches ~30 km from Cerro Pietrobelli (2950 m a.s.l.) to Lago Argentino (~177.5 m a.s.l.) (Figure 1A). The glacier covers an area of 259 km2 (De Ángelis, 2014) and flows into the lake (Figure 1B) in Canal de los Témpanos (CT) (Figure 1D) and Brazo Rico (BR) (Figure 1E). These two lake arms are part of Lago Argentino (~1480 km2), a large lake system formed following glacier retreat since the Last Glacial Maximum (20,000 years ago) (Figure 1A) (Hulton et al., 1994). The width and mean depth of the lakes near the calving front are 2.3 km and 105 m in CT, and 2.1 km and 64 m in BR (Stuefer, 1999). Ice flows 50% faster into CT (620 m a−1) than into BR (420 m a−1) (Stuefer, 1999). The height of the ice cliff above the lake surface is between 55–75 m (Naruse and Aniya, 1992), and thus the ice front is expected to be grounded (Naruse and Aniya, 1992; Stuefer, 1999) (Figure 1F). The lower part of the glacier is heavily crevassed and icebergs frequently break off at the calving front. On the ice cliff at water level, thermal notch formation is commonly observed throughout year.
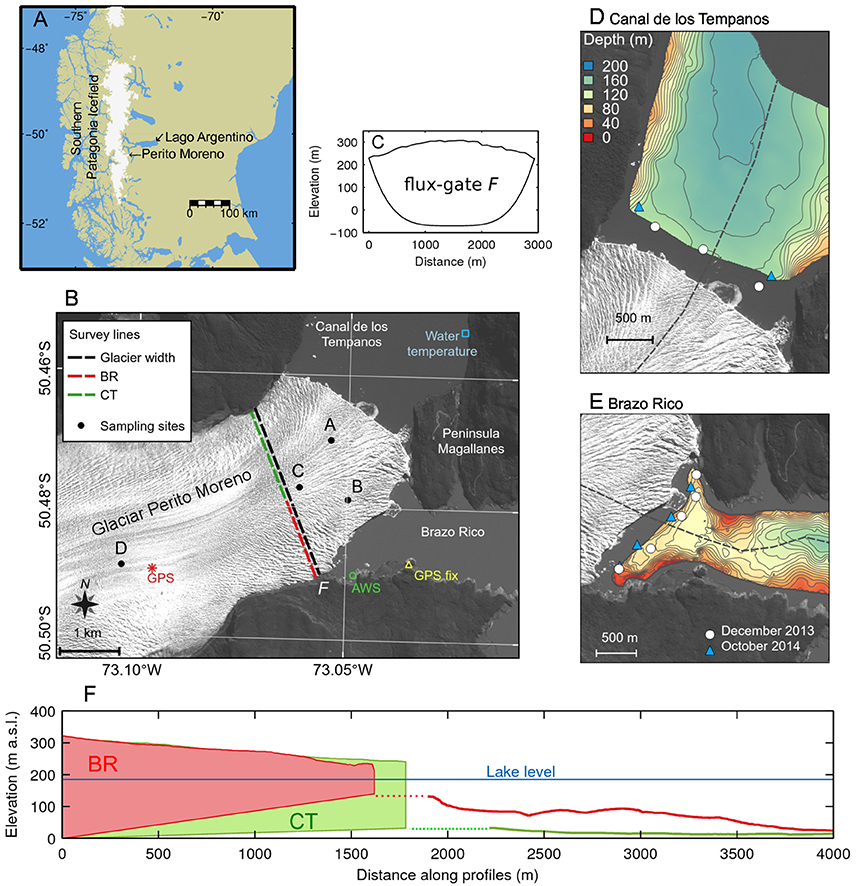
Figure 1. (A) Location of the study site in Patagonia Argentina, South America. (B) Satellite image of GPM, showing the location of the AWS (green circle), lakewater temperature (blue square) and ice speed (red asterisk) measurements, GPS reference station (yellow triangle), and sampling sites of surface speed (black dots). The solid and dashed lines were used to obtain width-averaged surface seed obtained near the glacier front and ice flux into the terminus (flux-gate F), respectively. The satellite image was taken by ALOS/PRISM on 29 March 2008. (C) Glacier cross-section at the flux-gate F. Surface elevation is after SRTM DEM in 2000 and bed elevation was assumed to be a parabola after Stuefer (1999). (D,E) Locations of the CTD cast in October (triangle) and in December (circle). Lake bathymetry (meters below lake level) in front of GPM was obtained in December 2013 survey. (F) The lake and glacier cross-sections for CT (green) and BR (red) along the dashed lines shown in (D,E), respectively.
GPM has shown short-term advances and retreats over the past decade (Minowa et al., 2015), but the mechanisms of the seasonal variation is not understood. These frontal variations were associated with ice-dam formation and its collapse at the glacier front. When the glacier advances, it flows onto the coast of Península Magallanes (Figure 1B), resulting in the formation of an ice-dam between BR and CT. Damming events have been observed repeatedly since the 1930s with intervals of typically 2–4 years until 1988 (Stuefer et al., 2007). Four events are reported between 2003 and 2013: September 2003–March 2004, (Skvarca and Naruse, 2004), August 2005–March 2006 (Stuefer et al., 2007), September 2007–July 2008 (P. Skvarca, personal communication, 2016) and November 2011–March 2012 (Parque Nacional Los Glacires, personal communication, 2016) (Figure 2).
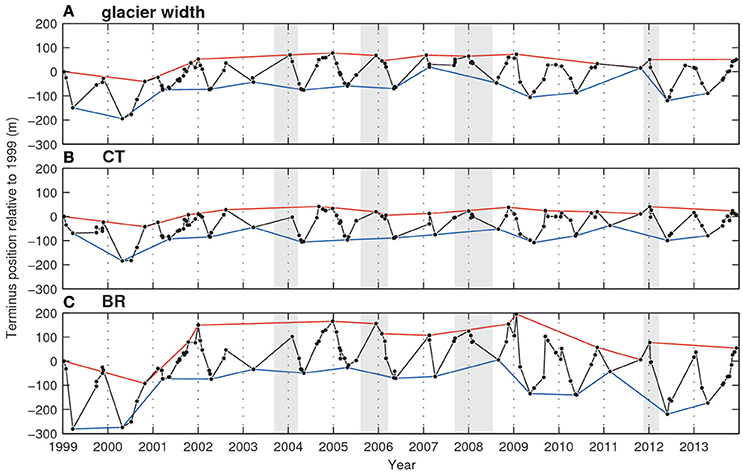
Figure 2. Ice-front position change averaged for (A) the entire ice front and for the fronts in (B) CT and (C) BR. The sections of the ice front are shown in Figure 1B. Gray hatches indicate the periods of reported ice-damming events. Red and blue lines connect most advanced and retreated ice-front position for the years a sufficient amount of data available. The front position change is relative to 1999 and a negative value indicates retreat.
Surface speed of GPM was previously measured by remote sensing techniques as well as in-situ stake surveys, and these measurements reported short-term speed variations (Ciappa et al., 2010; Sugiyama et al., 2011). Summer speed-up was reported in the lower reaches of GPM, where ice flow speed in March was 66% faster than in August (Ciappa et al., 2010). Sugiyama et al. (2011) performed high temporal resolution surface speed and subglacial water pressure measurements at 4.7 km from the terminus. The results showed that substantially large (nearly 40%) speed-up was driven by a few percent change in subglacial water pressure, and the speed and pressure variations correlated with air temperature. These previous observations suggest that the glacier dynamics are influenced by meltwater production on the glacier surface.
3. Methods and Data
3.1. Satellite Image Analysis
3.1.1. Data Sources
Ice-front position and surface speed of GPM were measured by analyzing satellite imagery. We used orthorectified images of Landsat 8 Operational Land Imager (OLI) band 8 (15 m resolution), Landsat 7 Enhanced Thematic Mapper Plus (ETM+) band 8 (15 m resolution) and Landsat 5 Thematic Mapper (TM) band 3 (30 m resolution). These images are fully available from Earth Explorer maintained by U. S. Geological Survey (http://earthexplorer.usgs.gov/), and are in the Universal Transverse Mercator (UTM) coordinate system zones 18N and 19N, and World Geodetic System 1984 (WGS 84) datum.
3.1.2. Ice-Front Positions
We measured changes in the ice front position, by using 109 satellite images, acquired between January 1999 and December 2013. On average, we analyzed 7 images per year. The frontal margin of the glacier was delineated by visual observation on a computer screen, using geographical information system software ArcGIS. The accuracy of the mapping was equivalent to the image resolutions, i.e., 15 m for Landsat 7 and 8 images, and 30 m for Landsat 5 images. Mean displacement of the front position was calculated by dividing the changes in ice surface area by the width of the ice front (Moon and Joughin, 2008). The same analysis was performed separately on the calving fronts in CT and BR. The uncertainty in the measurement was estimated by repeating the procedure on selected images. Standard deviations of ten repeated measurements on OLI, ETM+ and TM+ images were 2.8 m and 3.9 m, respectively.
3.1.3. Ice Surface Velocities
Ice surface flow speed was measured using feature tracking. We applied a code developed by Sakakibara and Sugiyama (2014) to 326 satellite image pairs, acquired between 1999 and 2013. The temporal separation of the image pairs was between 16–160 days. Errors in feature-tracking arise from: (1) co-registration errors; (2) ambiguity in the cross-correlation peak; and (3) false correlations. To minimize (1), we calculated displacements over a bedrock area, next to the glacier, where displacement should be zero. Mean displacement over the bedrock area was then subtracted from the displacement measured over the glacier. We applied a directional median filter to velocity vectors to reduce the errors due to (3), where vectors deviated by >10° from 3-by-3 matrices median value were excluded from the analysis. These procedures are described in detail in Sakakibara and Sugiyama (2014). The sum of these errors range from 0.11 to 0.4 m d−1. Ice speed was sampled at four sampling sites (A—at 0.9 km from CT, B—at 0.9 km from BR, C and D—at 1.8 and 5.2 km from the front as shown in Figure 1B), and interpolated into three survey lines (glacier width, and section for CT and BR in gate F as in Figure 1B) to investigate its temporal variations.
3.1.4. Frontal Ablation
In order to understand the mechanisms controlling the seasonal variations of GPM, we calculated frontal ablation rate based on Equation (1) using the observed width-averaged ice-front positions and ice speed. To compute the mean ice speed at the calving front (um), calving flux from the glacier front (Qm) was calculated from ice flux through a gate F (QF) defined at approximately 1.8 km from the glacier front (Figure 1B) and surface melt over the course of the ice flow from F to the glacier front (Qa).
uF and AF are mean ice speed and the cross sectional area at F, and k and ΣT+ are degree-day factor, sum of the positive-degree days, respectively. S is surface area bounded by F, glacier front and the side margins. We assumed perfect sliding based on observational result (Sugiyama et al., 2011), i.e., ice speed is uniform from the glacier surface to the bottom. AF = 0.85 km2 was calculated with surface elevation provided by the Shuttle Radar Topography Mission (SRTM) 2000 and bed elevation was assumed as a quartic equation with a central elevation of −70 m a.s.l. (Stuefer, 1999) (Figure 1C). SRTM DEM represents the surface elevation in 2000, but suitable for this purpose because no substantial elevation change was observed on GPM during the study period (Willis et al., 2012; Minowa et al., 2015). We took k as 7.7 and 3.7 mm w.e. °C−1 d−1 for periods November–March and April–October, respectively (Stuefer, 1999). ΣT+ was calculated based on the temperature records at the AWS in 2009 and 2010 by assuming a lapse rate of 0.0061°C m−1 (Sugiyama et al., 2011). Assuming a steady state near the terminus, um was calculated
where Am = 0.68 km2 is the cross-sectional area along the glacier front (Stuefer et al., 2007).
Accuracy of the frontal ablation rate calculated from Equation (1) relies on the uncertainties in um and dL/dt. Uncertainty in um arises mainly from error in QF = uFAF because Qa is three orders of magnitude smaller than QF, and Am is relatively well-known from bathymetry measurements (Equations 2 and 3). Our error estimate for individual speed measurements is ±0.3 m d−1, as described in Section 3.1.3. By taking the mean speed along F, accuracy in uF is ±0.06 m d−1, which corresponds to 3% of uF. The accuracy of AF is hard to estimate because ice thickness data is not available at the gate F. However, if we assume 10% error bound in the ice thickness at the center of F, the uncertainty in AF is 12%. Uncertainty in dL/dt was estimated as ±0.12 m d−1 (~15% of dL/dt) from the ice front digitization error and temporal separations of the images. Assuming that each of these uncertainties in uF, AF and dL/dt are independent, accuracy of the calculated frontal ablation rate is 19%.
3.2. Field Measurements
3.2.1. Lakewater Temperature
Lakewater temperature was measured in CT at a depth of 0–2 m from January 2009 to December 2013 at 2 km from the ice-front (50.453°S, 73.023°W) (Figure 1B). Lake temperature and level were automatically recorded every hour with a thermometer within a water pressure logger (Onset, HOBO U20; accuracy: ±0.5°C and ±0.5 cm). The sensor was mounted on a metal pipe which was fixed to bedrock with screws. Water level dropped below the sensor from time to time especially in October, thus we excluded data recorded during these periods.
Lakewater temperature distribution from the surface to the bottom was measured at several locations in CT and BR (Figures 1D,E) by lowering a conductivity-temperature-depth (CTD) profiler (JEF Advantec, ASTD101) from a boat. We repeated the measurement in austral summer (December 2013) and spring (October 2014) to study seasonal temperature variations. The measurements in CT were performed on 19 December 2013 and 4 October 2014, and those in BR on 12 December 2013 and 16 October 2014. Water temperature was recorded every 1 s, while the profiler was lowered to the lake bottom. The accuracy of the temperature and depth were ±0.01°C and ±1.8 m, respectively. Temperature data used in this study are summarized in Table 1.

Table 1. Lakewater temperature measurements used in this study.
3.2.2. Ice Surface Speed
In-situ ice speed measurements were carried out 4.7 km from the ice-front (Figure 1B) for the following periods: 25 February to 2 April 2010; 25 February 22 to 29 August 2012; 7 December 2013 to 2 January 2014; and 5 to 20 October 2014 (Table 2). Data were collected using a dual frequency global positioning system (GPS) (GNSS Technology Inc. GEM-1 and Trimble, 5800), and base station was located on the shore of BR, about 1 km from the glacier terminus (Figure 1B). A GPS antenna was mounted on an aluminum pole drilled into the glacier, and a receiver continuously recoded GPS signals with a sampling rate of 1 s. Three-dimensional coordinates of the pole were obtained by post processing the data with the static positioning technique and daily mean horizontal ice velocities were computed over the survey periods. The accuracy of the static positioning with a baseline of 4.2 km was generally better than 10 mm, which is negligible as compared to the daily ice motion. To validate ice speed derived by the feature tracking technique, the daily mean speeds from the GPS were compared to those derived by satellite images.
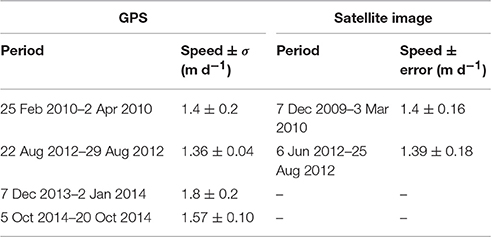
Table 2. Ice speed measured by GPS and satellite imagery analyses.
3.2.3. Air Temperature, Wind Speed, and Wind Direction
Air temperature, wind speed and wind direction were measured with an automatic weather station (AWS), which was installed in November 1995 (Stuefer, 1999) at the shore of BR ~500 m from the glacier front (50.489°S, 73.046°W, 192 m a.s.l.) (Figure 1B). Sensors measuring air temperature (Vaisala, HPM35AC; accuracy: ±0.3°C), wind speed (Vector Instrument, A100R Anemometer; accuracy: ±0.1%) and wind direction (Vector Instrument, W200P Windvane; accuracy: ±0.2%) were mounted on a pole 2, 2.2, and 2.3 m above the ground, respectively. We used hourly air temperature data between January 1999 and December 2013 for this study. Wind speed and wind direction data is not available for 21 March–31 December 2001 and 28 July–31 December 2003. Summer and winter mean temperature was calculated from monthly mean temperature from December to February (DJF) and from June to August (JJA), respectively.
4. Results
4.1. Ice-Front Positions
Figure 2 shows the time series of the ice front displacement, averaged over the entire glacier width and for the sections in CT and BR separately. The glacier slightly advanced from 2000 to 2001 because of lack of seasonal retreat in the summer 2000/2001, but was otherwise fairly stable during the study period (Figure 2). Four ice-dam events were reported during this period (2003/04, 2005/06, 2007/08, and 2011/12), but no significant change was observed in the front position (Figure 2). Although there was no substantial long-term trend, ice front position showed a seasonal advance/retreat pattern. The glacier began to retreat in early summer (typically in December) and then turned to advance in mid autumn (typically in April) (Figure 2). The magnitude of the seasonal frontal variations was up to 200 m, which was greater than the variations in annual mean front position over the study period (120 m).
Figure 3A shows the most advanced and retreated glacier front over the study period, and annual cycles of the ice front variations constructed by stacking the data over the study period. On average, the glacier advanced from June to December (early summer), and retreated from December to April (Figure 3B). The ice front was relatively stable from April to June (Figure 3B). Glacier retreat occurs approximately twice as fast as advance, i.e., the rate of frontal position change from December to April was −0.7 m d−1, whereas the rate from June to December was 0.3 m d−1. The pattern of the seasonal variations was similar at the two ice fronts facing CT and BR, but the amplitude was two times greater in BR (±80 m) than in CT (±40 m) (Figures 3C,D).
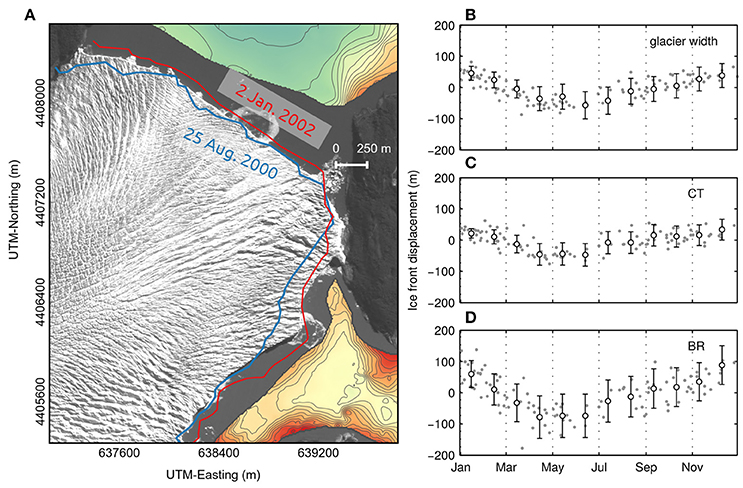
Figure 3. (A) The most advanced and retreated ice front positions over the study period. Annual cycle of the ice-front positions (B) averaged over the glacier front, (C) at the front of CT and (D) BR. The plot was constructed by stacking the data over the study period. Monthly mean front positions are indicated by the open circles with standard deviation.
4.2. Ice Velocities
The maximum speed (~4 m d−1) was measured at around 1200 m a.s.l. (15 km from the front), approximately at the equilibrium line altitude (Figure 4). Surface speed decreased toward the ice front, except for the relatively fast following region within several kilometers near the front. Ice speed at 2 km from the front was 2.5 m d−1 (Figure 4). The mean speed was greater at CT front (1.8 m d−1) than that of BR (1.6 m d−1) (Figure 4), which is consistent with the previous study (Stuefer et al., 2007). The ice surface speed showed no clear long-term trend over the study period (Figure 5). Nonetheless, linear trends of ice speeds were −3, −2.9 and −6.1 m a−2 for the whole glacier, CT and BR, respectively (Figure 5). For the years with a sufficient amount of data (2000, 2001, 2005, 2010, and 2013), summer acceleration followed by deceleration in autumn was observed (Figure 5).
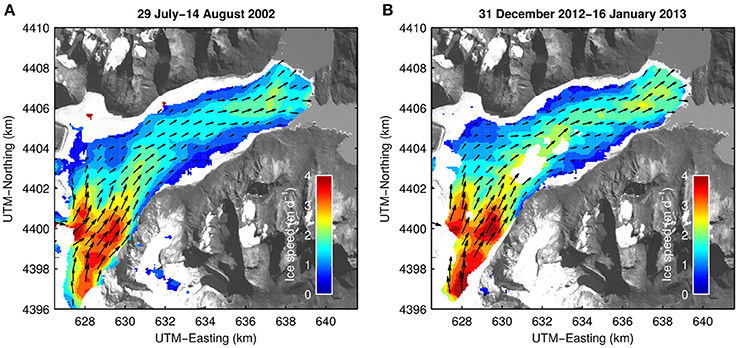
Figure 4. Ice surface velocity field measured for the period (A) between 29 July and 14 August 2002 (austral winter), and (B) between 31 December 2012 and January 2013 (austral summer).
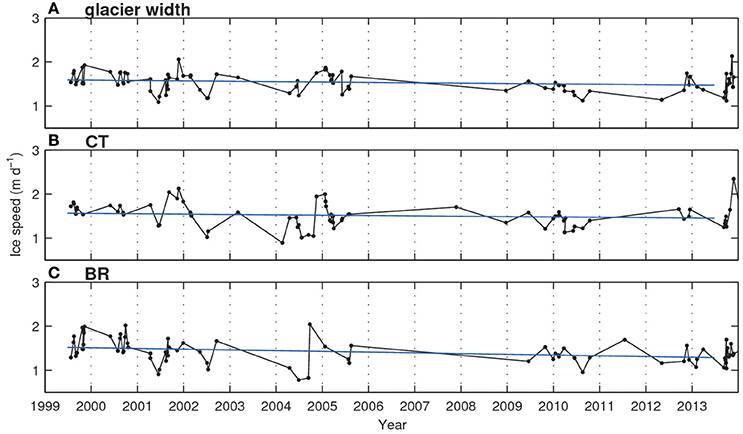
Figure 5. Ice speed averaged for (A) the entire ice front and the sections in (B) CT and (C) BR. Linear trends are indicated by the blue lines. The sections of the ice front are shown in Figure 1B.
Clear seasonal variations in speed were observed in the region studied (Figures 4, 6). For example, the mean summer speed (December–February) 1.8 km from the ice front was 15% greater than the annual mean (Figure 6C). A similar speed-up was observed 0.9 km from CT (5%) (Figure 6A) and BR (11%) (Figure 6B). The seasonal speed variation is observable 5.2 km from the front (Figure 6D), but is unclear further up the glacier. The ice speeds obtained from satellite image analysis agree with those measured using the in-situ GPS survey (Table 2). If the daily mean speeds measured with GPS are then compared with the daily mean speeds from satellite images covering that day of the year (but not necessarily the same year), the root-mean-square error is 0.25 m d−1 (Figure 6).
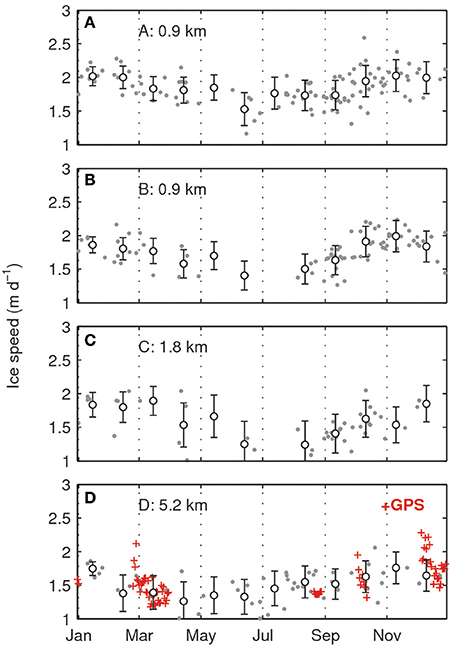
Figure 6. Seasonal ice speed variations at (A) 0.9 km from CT, (B) 0.9 km from BR, (C) 1.8 km and (D) 5.2 km from the center of the glacier front (see Figure 1B for the sampling sites). Also indicated in (D) are also indicated the daily mean surface speed measured by GPS at 4.7 km from the glacier front (cross).
4.3. Frontal Ablation
Figure 7 shows the displacement rate dL/dt, ice speed um, computed monthly frontal ablation rate + , and monthly air and lake temperature. The annual mean frontal ablation rate was 1.3 ± 0.7 m d−1 (± standard deviation). The frontal ablation rate varied from 0.13 ± 0.9 m d−1 in July to 2.5 ± 0.4 m d−1 in February, showing a large seasonal variation (Figure 7C). The monthly mean ice speed varied from 1.0 ± 0.13 m d−1 in May to 1.5 ± 0.16 m d−1 in November (Figure 7B). Therefore, the magnitude of the seasonal variations in the frontal ablation rate was approximately five times greater than that in the ice speed.

Figure 7. Annual variations of (A) frontal displacement rate dL/dt, (B) ice speed at the glacier front um, (C) frontal ablation rate , and (D) air and lakewater temperatures. (A) The displacement rates are averaged over the glacier front and monthly mean values are indicated by the open circles. (B) Ice speed is averaged along the ice-front based on Equations (2) and (3). Monthly mean values are given by the open circles. (C) Frontal ablation rate was calculated from the ice-front displacement rate and the ice speed. The estimated error range is shown by the gray band. (D) Monthly mean air temperature at the AWS (red) was averaged over the period between 1999 and 2013, and lakewater temperature in CT (blue) was averaged over the period between 2009 and 2013.
4.4. Air Temperature, Wind Speed and Wind Direction
Monthly mean air temperature during the study period ranged from −1.9°C to 12°C with mean temperature of 6.6°C over the 15 years (Figure 8A). Linear regression of the annual mean temperature showed a warming trend of 0.059°C a−1 (p < 0.03) over the 15 years (Figure 8B). More rapid warming was observed in winter (JJA) (0.091°C a−1, p < 0.13), and this rate was four times greater than that in sumer (DJF) (0.023°C a−1, p < 0.44) (Figure 8B). These trends are influenced by relatively cold temperatures observed from 2000 to 2002. For example, mean winter (JJA) temperature from 2000 to 2003 was 0.98–1.61°C below the mean over the 15 years. The warmest annual mean temperature was recorded in 2013 (0.49°C above the mean).
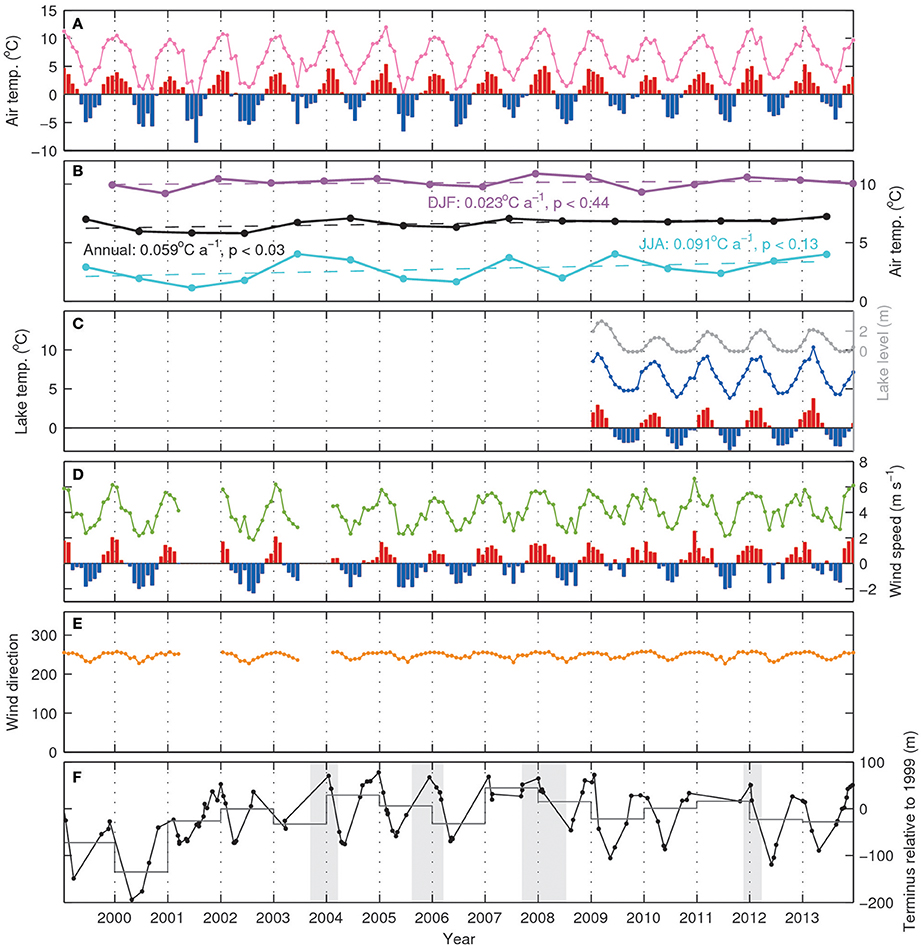
Figure 8. (A) Monthly mean air temperature (magenta) and their anomaly from mean temperature between 1999 and 2013 (blue and red). (B) Annual, summer [December–February (DJF)] and winter [June–August (JJA)] mean air temperatures at the AWS. Dashed line represent the linear trends over the study period. (C) Monthly mean lake temperature (blue), anomaly from the mean temperature between 2009 and 2013 (blue and red), and monthly mean lake level (gray). (D) Monthly mean wind speed (green) and their anomaly from the mean wind speed from 1999 to 2013. (E) Monthly mean wind direction. (F) Ice front position relative to 1999 (as seen in Figure 2A). The dashed line indicates the annual mean front position. Gray hatches indicate the periods of reported ice-damming events.
Wind speed showed a large seasonal variations ranging from 1.8 m s−1 in August to 6.6 m s−1 in December (Figure 8D). Prevailing wind direction was west throughout the year (Figure 8E). Annual mean wind speed and direction from 1999 to 2013 were 4.1 ± 1.1 m s−1 and 248 ± 8°, respectively. These results are in good agreement with previous study (Stuefer, 1999).
4.5. Lakewater Temperature
Near-surface lakewater temperature showed seasonal variations ranging from 3.8°C (August) to 10.3°C (February–March) (Figure 8C). The peaks in the monthly mean lakewater temperature lagged behind the air temperature by 1 month (Figures 8A,C). The water temperature might be influenced by the seasonal lake level variations (Figure 8C). However, the temperature change to be expected by the water level variations (~2 m) was only ~1.3°C in summer and less in winter, according to the vertical temperature profiles shown in Figure 9. Moreover, the temperature sensor was in deeper (i.e., colder) water in the summer, and this effect reduces the amplitude of the seasonal temperature variations. Therefore, the influence of the water level variations on the temperature record is not significant.
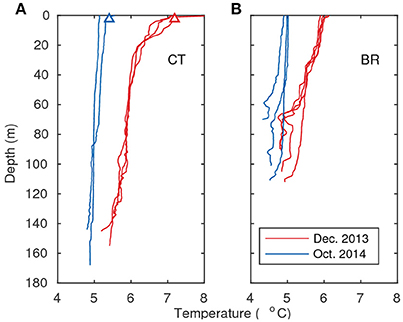
Figure 9. Temperature measured near the glacier front in (A) CT and (B) BR in December (red) and October (blue). Red and blue triangles indicate mean lake surface temperature in CT in October and December observed from 2009 and 2013. Measurement CTD sites are indicated in Figures 1D,E.
Figure 9 shows water temperature profiles obtained within 300 m from the glacier front (Figures 1D,E). Water temperature was higher in summer than in spring from the surface to the bottom. The mean temperature was 6°C in CT and 5.4°C in BR in summer, whereas 5.1°C in CT and 4.8°C in BR in spring (Figure 9). The magnitude of the seasonal temperature variation was slightly larger in CT (0.9°C) than BR (0.6°C). In summer, water temperature decreases from the surface (~8°C) to the bottom (5.5°C) in CT (Figure 9A) and the surface (~6.5°C) to the bottom (~5°C) in BR (Figure 9B). On the other hand, water temperature was more uniformly distributed in spring (Figure 9). This implies that lakewater in summer was more influenced by solar radiation than in spring. The upper 5 m mean temperature in CT (December; 7.1°C, October; 5.3°C) closely agreed with monthly mean near-surface temperature measured at the shore of CT (December; 7.2°C, October; 5.4°C) (Figure 9A). Further, CTD casts at other locations in the lakes showed similar profiles (Figure 9). Thus, it is likely that seasonal variations in the near-surface water temperature (Figure 8C) represent overall seasonal lakewater temperature variations. It should be noted that the water temperature in BR and CT was 2–3°C warmer than that which was measured in front of Glaciar Upsala, a glacier calving into another arm of Lago Argentino at about 70 km north of GPM (Sugiyama et al., 2016). This is because ice and meltwater discharge into the lake is much greater at Glaciar Upsala.
5. Discussion
5.1. Seasonal Variation in the Ice-Front Position
Seasonal variations in ice-front positions have previously been reported on tidewater glaciers in Greenland (e.g., Amundson et al., 2010; Howat et al., 2010; Carr et al., 2013; Moon et al., 2015) and Alaska (e.g., Ritchie et al., 2008; McNabb and Hock, 2014). These previous studies showed glacier advance from winter to early summer, and retreat from mid to late summer or early winter. The advance/retreat cycle observed in GPM was similar to the observations in Greenland and Alaska. GPM advanced from July to December (early summer) and retreated from December to April (mid autumn) (Figures 2, 3).
The magnitude of the seasonal variation in frontal ablation rate was five times greater than that in the ice speed, implying that the seasonal variations observed in the front position of GPM were contributed primarily by the frontal ablation rather than the ice speed (Figure 7). A potential driver of the seasonal variations in the frontal ablation is the air and/or lake temperature because these properties may affect calving and/or subaqueous melting rates. Monthly mean air temperature reaches seasonal maximum in January, whereas the warmest lakewater temperature occurs 2 months later in March (Figure 7D). The frontal ablation rate peaks in February–March (Figure 7C), and its correlation with lake temperature (r = 0.95, p < 10−5) is more significant than with air temperature (r = 0.86, p < 10−3) (Figures 10A,B). Additionally, we compared the frontal ablation with the ice speed, but the correlation is weak (r = 0.48, p < 0.12) (Figure 10C). These observations imply that lakewater temperature primarily controls the calving and/or subaqueous melting. The influence of air temperature cannot be excluded, but here we discuss further a more significant correlation between water temperature and frontal ablation.
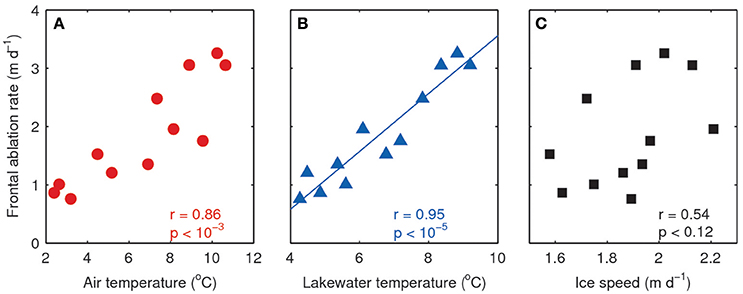
Figure 10. Scatter plots of frontal ablation rate and (A) air temperature (r = 0.86, p < 10−3), (B) lakewater temperature (r = 0.95, p < 10−5) and (C) glacier width averaged ice speed (r = 0.56, p < 0.12). Blue line indicates linear regression line of the data ( = 0.5T − 1.4).
A relationship between frontal ablation and ocean temperature in front of glaciers was reported in Svalbard (Luckman et al., 2015) Based on satellite image analyses and mooring observations of ocean temperature, a linear relationship between the frontal ablation rate and ocean temperature was proposed for Kronebreen and Tunabreen, tidewater glaciers in Svalbard.
T is ocean temperature at a depth between 20 and 60 m, and the coefficient k was 1.015 m d−1 °C−1 for Kronebreen glacier and 0.35 m d−1 °C−1 for Tunabreen. These results were obtained from tidewater glaciers, thus care should be taken when they are compared to our data, which is from a freshwater calving glacier. Nevertheless, Kronebreen and Tunabreen have some similarities with GPM in terms of ice speed (1–4 m d−1), width of the ice front (~4 km) and the frontal ablation rate (0–8 m d−1). Thus, we applied our data to Equation (4) and compared the linear coefficient k. In the case of GPM, k = 0.5 m d−1 °C−1 was obtained from Figure 10B. An important difference from the relationship in Svalbard is that ablation approaches zero at water temperatures above 0°C. For example, frontal ablation rate of GPM is very small (0.14 m d−1) in July when lakewater temperature was 4.9°C, and such a small ablation rate causes advance of the glacier in austral winter.
The linear relationship between the lakewater temperature and frontal ablation suggests that melting at/under waterline strongly influences on the frontal ablation of GPM. A possible mechanism connecting the water temperature and frontal ablation is the formation of thermal notch, an erosional notch on the vertical ice face along the waterline. In GPM, this notch formation is observed to have a depth of ~1–2 m, and is observed throughout the year (Figure 11). Thermal notch formation was proposed as a triggering mechanism of calving, and supporting evidence was reported in freshwater calving glaciers in New Zealand (Kirkbride and Warren, 1997; Röhl, 2006), and Patagonia (Haresign and Warren, 2005). Röhl (2006) observed the notch formation at the front of Tasman Glacier, and concluded that the rate of erosion was controlled by water temperature and circulation, cliff geometry, debris supply and water-level fluctuation. In front of GPM, the warmest water was observed at the lake surface (~8°C) (Figure 9). Presumably, seasonal temperature variations of the near-surface water control the rate of notch formation at the front of GPM, which results in seasonal changes in the calving rate. Furthermore, Patagonia is characterized by consistently strong westerly winds and the wind speed is enhanced particularly in summer (Stuefer, 1999; Lenaerts et al., 2014). This is consistent with our AWS data (Figures 8D,E). High waves due to the strong wind and the relatively warm lake surface may enhance waterline melting.

Figure 11. (A) Calving front of GPM in BR on January 5, 2013. (B) Close-up view of the region indicated by the box in (A).
Another process linking the lake temperature with frontal ablation is subaqueous melting. Recent studies report that the subaqueous melt rate at the front of tidewater glaciers is substantially larger than previously assumed (e.g., Motyka et al., 2003; Bartholomaus et al., 2013). Our CTD data show that seasonal water temperature change occurs not only near the surface, but extends to the bottom of the lakes (Figure 9). Therefore, the water temperature variations have a potential to cause the frontal ablation rate variation by changing subaqueous melt rate. Subaqueous melting of icebergs in the ocean has been studied using laboratory experiments (Weeks and Campbell, 1973; Neshyba and Josberger, 1980; Russel-Head, 1980). These studies proposed equations for subaqueous melting by considering water temperature as the most important variable. In front of GPM, depth averaged temperature varies from 5.1°C in CT and 4.8°C in BR in October to 6.0°C in CT and 5.4°C in BR in December (Figure 9). According to the previously proposed equations by Weeks and Campbell (1973), Neshyba and Josberger (1980), and Russel-Head (1980), the observed seasonal temperature difference cause ~10–30% changes in subaqueous melt rate.
In addition to the relationship with lakewater temperature, the frontal ablation also correlates with air temperature, suggesting a possible influence of surface melting on frontal ablation (Figure 10A). In tidewater glaciers, subaqueous melting is enhanced by subglacial meltwater discharge because meltwater plume entrains warm water and supplies heat for ice melting. However, unlike in seawater, glacier meltwater is not buoyant in lakewater, and thus upwelling of subglacial discharge and entrainment of warm bottom water is not likely in GPM. Possibly, meltwater input into cracks and crevasses reduces the fracture strength of ice (Liu and Miller, 1979) and enhances subaerial calving (Benn et al., 2007). Since glacier surface is heavily crevassed near the front of GPM, weakening of ice in summer is one of the likely mechanism of seasonal variations in frontal ablation rate.
Interestingly, the amplitude of the seasonal frontal variation was greater in BR (±80 m) than in CT (±40 m) (Figure 3). Since the amplitude of the ice speed variation is similar in BR and CT, the more significant frontal variations in BR was presumably due to the variations in the frontal ablation (Figure 6). Because the magnitude of the seasonal lakewater temperature variation is greater in CT (0.9°C between October and December) than in BR (0.6°C) (Figure 9), water temperature cannot explain the difference. A possible interpretation of more significant seasonal variations of frontal ablation in BR is more heavily crevassed surface condition. Because of the divergent ice flow regime in the vicinity of BR (Figure 4), large and deep crevasses are formed near the calving front in BR (Figure 3A). Our hypothesis is that frontal ablation in BR is more sensitive to the waterline melting and surface meltwater production because of the heavily fractured ice structure near the front. Another interpretation is the influence of bed geometry on the ice front position. Frontal variations of BR are the most significant near the center of the calving front and our bathymetry data shows that the lake bottom is elevated in this region (Figure 3A). This elevated bed geometry may enhance seasonal advance of the ice front, causing the frontal variation to have a greater magnitude.
5.2. Long-Term Variations in Ice-Front Position
The frontal position of GPM has been stable since 1920, unlike most other calving glaciers in Patagonia (Skvarca and Naruse, 1997). Previous studies attributed the stability of GPM to the large up-glacier ice flux due to relatively large accumulation area (e.g., Stuefer et al., 2007; Minowa et al., 2015) and elevated bedrock topography near the glacier front (e.g., Aniya and Skvarca, 1992; Skvarca and Naruse, 1997). Although our data show a generally stable front position since 1999, the glacier showed advance from 2000 to 2004 and small retreat after 2008 (Figure 2). These fluctuations were related with an annual temperature anomaly (Figure 7). In summer 2000/2001, the glacier retreated only a little and began to advance already in February 2001, which resulted in an advanced front position in the following (2001/2002) summer season (Figure 8F). The small summer retreat in 2000/2001 coincided with the cold winter (JJA), with temperature −1.6°C below the 15-year mean winter temperature (Figure 8B). The low temperature condition continued until the following winter in 2001 (Figure 8B). Presumably, the calving and subaqueous melt were reduced under the influence of cold air and lakewater conditions. In summer 2008/2009, the ice front in BR retreated at a greater rate than in other years, and this led to a relatively retreated front positions after 2009 (Figure 2C). The large retreat coincided with a relatively warm air and lake temperatures in summer 2008/2009 and winter 2009 (Figures 8B,D). According to these observations, the ongoing and future atmospheric and lakewater warming should affect the frontal position change. The GPM air temperature record shows a warming trend of 0.059°C a−1 from 1999 and 2013 (Figures 8A,B). This trend is consistent with the previously reported observations in Patagonia. Ibarzábal y Donángelo et al. (1996) found a warming of 0.3°C from 1940–1990 (0.006°C a−1) recorded at a weather station in El Calafate (50°30′S; 72°26′W), located ~70 km east to the GPM. Reanalysis data at the grid point of 50°S and 75°W showed warming of 0.5°C between 1960 and 1999 (0.013°C a−1) at 850 hPa (Rasmussen et al., 2007). Moreover, O'Reilly et al. (2015) reported rapid warming of global lake surface temperature in summer (global mean 0.34°C a−1) between 1985 and 2009. Lakewater and atmosphere warming have the potential to increase the frontal ablation rate as demonstrated in this study (Figure 10). If frontal ablation increases and the ice front retreats from the current position, constrained by bed geometry, GPM would change rapidly as has been observed in other calving glaciers in Patagonia. As well as the atmospheric warming, it is crucial to monitor the change in lakewater temperature to understand the future evolution of calving glaciers in Patagonia.
6. Conclusions
We studied variations in the ice-front position, ice speed and frontal ablation in GPM, a freshwater calving glacier in SPI, from 1999 to 2013. Our data showed seasonal variations in the ice-front position (±50 m) and the ice speed (±15%). The frontal ablation computed from these front positions and velocities showed seasonal variations, and its magnitude was substantially greater than that in the ice speed. These results imply that frontal ablation contribute primarily to the seasonal ice front variation rather than the ice speed change.
The seasonal variations in the frontal ablation rate were linearly correlated with the near surface lakewater temperature from 2009 and 2013 (r = 0.96) rather than air temperature (r = 0.86). Seasonal change in the lakewater temperature was also measured by full depth measurements with a CTD profiler in October and December. These observations suggest that melt-related processes largely influence the frontal ablation, e.g., thermal notch formation due to waterline melting and subaqueous melting at the calving face. Our study indicated the importance of the thermal condition of a proglacial lake in the frontal variations of a freshwater calving glacier. Further investigation is needed to quantify the contribution of the these processes at the ice-water interface to the frontal ablation, and the impact of lakewater warming on calving glaciers in Patagonia.
Author Contributions
MM analyzed data and produced figures. MM and SS prepared the manuscript. DS developed feature-tracking methods for deriving surface speed. PS maintained weather station, water temperature sensor and collected the data. All authors contributed to the field work and discussed the results.
Funding
This research was supported by the Japan Society for the Promotion of Science, Grants-in-Aid for Scientific Research JP23403006, JP26550001, and JP16H05734, Grand-in-Aid for JSPS Research Fellow JP16J01860, and by the Japanese Society of Snow and Ice, the Inoue Found for Field Science.
Conflict of Interest Statement
The authors declare that the research was conducted in the absence of any commercial or financial relationships that could be construed as a potential conflict of interest.
Acknowledgments
We thank T. Sawagaki, N. Naito and Y. Ohashi for their help in the field. Hielo y Aventura and Prefectura Naval Lago Argentino for their logistic supports in lake measurements. K. Chikita is acknowledged for variable comments on the lake observation and dataset. The manuscript was improved by comments and suggestions from R. Carr. AWS data until 2003 are available through the joint project between Institute of Meteorology and Geophysics of Innsbruck University, Austria, and Instituto Antártico Argentino, Argentina. Landsat images were downloaded from http://earthexplorer.usgs.gov/.
References
Amundson, J. M., Fahnestock, M., Truffer, M., Brown, J., Lüthi, M. P., and Motyka, R. J. (2010). Ice mélange dynamics and implications for terminus stability, Jakobshavn Isbræ, Greenland. J. Geophys. Res. 115:F01005. doi: 10.1029/2009JF001405
Amundson, J. M., Truffer, M., Lüthi, M. P., Fahnestock, M., West, M., and Motyka, R. J. (2008). Glacier, fjord, and seismic response to recent large calving events, Jakobshavn Isbræ, Greenland. Geophys. Res. Lett. 35, 2–6. doi: 10.1029/2008GL035281
Aniya, M., Sato, H., and Naruse, R. (1997). Recent glacier variations in the Southern Patagonia Icefield, South America. Arctic Alpine Res. 29:1. doi: 10.2307/1551831
Aniya, M., and Skvarca, P. (1992). Characteristics and variations of Upsala and Moreno glaciers, southern Patagonia. Bull. Glacier Res. 10, 39–53.
Bartholomaus, T. C., Larsen, C. F., and O'Neel, S. (2013). Does calving matter? Evidence for significant submarine melt. Earth Planet. Sc. Lett. 380, 21–30. doi: 10.1016/j.epsl.2013.08.014
Benn, D. I., Warren, C. R., and Mottram, R. H. (2007). Calving processes and the dynamics of calving glaciers. Earth Sci. Rev. 82, 143–179. doi: 10.1016/j.earscirev.2007.02.002
Boyce, E. S., Motyka, R. J., and Truffer, M. (2007). Flotation and retreat of a lake-calving terminus, Mendenhall Glacier, southeast Alaska, USA. J. Glaciol. 53, 211–224. doi: 10.3189/172756507782202928
Carr, J., Vieli, A., Stokes, C., Jamieson, S., Palmer, S., Christoffersen, P., et al. (2015). Basal topographic controls on rapid retreat of humboldt glacier, northern greenland. J. Glaciol. 61, 137–150. doi: 10.3189/2015JoG14J128
Carr, J. R., Stokes, C., and Vieli, A. (2014). Recent retreat of major outlet glaciers on novaya zemlya, russian arctic, influenced by fjord geometry and sea-ice conditions. J. Glaciol. 60, 155–170. doi: 10.3189/2014JoG13J122
Carr, J. R., Vieli, A., and Stokes, C. (2013). Influence of sea ice decline, atmospheric warming, and glacier width on marine-terminating outlet glacier behavior in northwest greenland at seasonal to interannual timescales. J. Geophys. Res. Earth 118, 1210–1226. doi: 10.1002/jgrf.20088
Carrivick, J. L., and Tweed, F. S. (2013). Proglacial Lakes: character, behaviour and geological importance. Quaternary Sci. Rev. 78, 34–52. doi: 10.1016/j.quascirev.2013.07.028
Ciappa, A., Pietranera, L., and Battazza, F. (2010). Perito Moreno Glacier (Argentina) flow estimation by COSMO SkyMed sequence of high-resolution SAR-X imagery. Remote Sens. Environ. 114, 2088–2096. doi: 10.1016/j.rse.2010.04.014
Cuffey, K. M., and Paterson, W. S. B. (2010). The Physics of Glaciers. Cambridge, MA: Academic Press.
De Ángelis, H. (2014). Hypsometry and sensitivity of the mass balance to changes in equilibrium-line altitude: the case of the Southern Patagonia Icefield. J. Glaciol. 60, 14–28. doi: 10.3189/2014JoG13J127
Funk, M., and Röthlisberger, H. (1989). Forecasting the effects of a planned reservoir which will partially flood the tongue of Unteraargletscher in Switzerland. Ann. Glaciol. 13, 76–81.
Gardner, A. S., Moholdt, G., Cogley, J. G., Wouters, B., Arendt, A. A., Wahr, J., et al. (2013). A reconciled estimate of glacier contributions to sea level rise: 2003 to 2009. Science 340, 852–857. doi: 10.1126/science.1234532
Haresign, E., and Warren, C. R. (2005). Melt rates at calving termini: a study at Glaciar Leon, Chilean Patagonia. Geol. Soc. Lond. Spec. Publ. 242, 99–109. doi: 10.1144/GSL.SP.2005.242.01.09
Howat, I. M., Box, J. E., Ahn, Y., Herrington, A., and McFadden, E. M. (2010). Seasonal variability in the dynamics of marine-terminating outlet glaciers in Greenland. J. Glaciol. 56, 601–613. doi: 10.3189/002214310793146232
Howat, I. M., Joughin, I., Tulaczyk, S., and Gogineni, S. (2005). Rapid retreat and acceleration of Helheim Glacier, east Greenland. Geophys. Res. Lett. 32:L22502. doi: 10.1029/2005gl024737
Hulton, N., Sugden, D., Payne, A., and Clapperton, C. (1994). Glacier modeling and the climate of Patagonia during the Last Glacial Maximum. Quaternary Res. 42, 1–19. doi: 10.1006/qres.1994.1049
Ibarzábal y Donángelo, T., Hoffmann, J., and Naruse, R. (1996). Recent climate changes in southern Patagonia. Bull. Glacier Res. 14, 29–36.
Jacob, T., Wahr, J., Pfeffer, W. T., and Swenson, S. (2012). Recent contributions of glaciers and ice caps to sea level rise. Nature 482, 514–518. doi: 10.1038/nature10847
Joughin, I., Smith, B. E., Howat, I. M., Floricioiu, D., Alley, R. B., Truffer, M., et al. (2012). Seasonal to decadal scale variations in the surface velocity of Jakobshavn Isbrae, Greenland: observation and model-based analysis. J. Geophys. Res. 117:F02030. doi: 10.1029/2011JF002110
Kaser, G., Cogley, J. G., Dyurgerov, M. B., Meier, M. F., and Ohmura, A. (2006). Mass balance of glaciers and ice caps: consensus estimates for 1961-2004. Geophys. Res. Lett. 33, 1–5. doi: 10.1029/2006GL027511
Kirkbride, M., and Warren, C. (1997). Calving processes at a grounded ice cliff. Ann. Glaciol. 24, 116–121.
Lenaerts, J. T., Van Den Broeke, M. R., van Wessem, J. M., van de Berg, W. J., van Meijgaard, E., van Ulft, L. H., et al. (2014). Extreme precipitation and climate gradients in patagonia revealed by high-resolution regional atmospheric climate modeling. J. Climate 27, 4607–4621. doi: 10.1175/JCLI-D-13-00579.1
Lopez, P., Chevallier, P., Favier, V., Pouyaud, B., Ordenes, F., and Oerlemans, J. (2010). A regional view of fluctuations in glacier length in southern South America. Global Planet. Change 71, 85–108. doi: 10.1016/j.gloplacha.2009.12.009
Luckman, A., Benn, D. I., Cottier, F., Bevan, S., Nilsen, F., and Inall, M. (2015). Calving rates at tidewater glaciers vary strongly with ocean temperature. Nat. Commun. 6:8566. doi: 10.1038/ncomms9566
Masiokas, M. H., Rivera, A., Espizua, L. E., Villalba, R., Delgado, S., and Aravena, J. C. (2009). Glacier fluctuations in extratropical South America during the past 1000 years. Palaeogeogr. Palaeocl. 281, 242–268. doi: 10.1016/j.palaeo.2009.08.006
McNabb, R. W., and Hock, R. (2014). Alaska tidewater glacier terminus positions, 1948–2012. J. Geophys. Res. Earth 119, 153–167. doi: 10.1002/2013jf002915
McNabb, R. W., Hock, R., and Huss, M. (2015). Variations in Alaska tidewater glacier frontal ablation, 1985–2013. J. Geophys. Res.-Earth 120, 120–136. doi: 10.1002/2014JF003276
Meier, M. F., and Post, A. (1987). Fast tidewater glaciers. J. Geophys. Res. 92:9051. doi: 10.1029/JB092iB09p09051
Minowa, M., Sugiyama, S., Sakakibara, D., and Sawagaki, T. (2015). Contrasting glacier variations of Glaciar Perito Moreno and Glaciar Ameghino, Southern Patagonia Icefield. Ann. Glaciol. 56, 26–32. doi: 10.3189/2015AoG70A020
Moon, T., and Joughin, I. (2008). Changes in ice front position on Greenland's outlet glaciers from 1992 to 2007. J. Geophys. Res. 113, 1–10. doi: 10.1029/2007JF000927
Moon, T., Joughin, I., and Smith, B. (2015). Seasonal to multiyear variability of glacier surface velocity, terminus position, and sea ice/ice mélange in northwest greenland. J. Geophys. Res. Earth 120, 818–833. doi: 10.1002/2015JF003494
Moon, T., Joughin, I., Smith, B., and Howat, I. (2012). 21st-century evolution of greenland outlet glacier velocities. Science 336, 576–578. doi: 10.1126/science.1219985
Motyka, R. J., Hunter, L., Echelmeyer, K. A., and Connor, C. (2003). Submarine melting at the terminus of a temperate tidewater glacier, LeConte Glacier, Alaska, USA. Ann. Glaciol. 36, 57–65. doi: 10.3189/172756403781816374
Muto, M., and Furuya, M. (2013). Surface velocities and ice-front positions of eight major glaciers in the Southern Patagonian Ice Field, South America, from 2002 to 2011. Remote Sens. Environ. 139, 50–59. doi: 10.1016/j.rse.2013.07.034
Naruse, R., and Aniya, M. (1992). Outline of Glacier research project in Patagonia, 1990. Bull. Glacier Res. 10, 31–38.
Naruse, R., and Skvarca, P. (2000). Dynamic features of thinning and retreating Glaciar Upsala, a lacustrine calving glacier in southern Patagonia. Arct. Antarct. Alp. Res. 32, 485–491. doi: 10.2307/1552398
Neshyba, S., and Josberger, E. (1980). On the estimation of Antarctic iceberg melt rate. J. Phys. Oceanogr. 10, 1681–1685. doi: 10.1175/1520-0485(1980)010<1681:oteoai>2.0.co;2
O'Reilly, C. M., Sharma, S., Gray, D. K., Hampton, S. E., Read, J. S., Rowley, R. J., et al. (2015). Rapid and highly variable warming of lake surface waters around the globe. Geophys. Res. Lett. 42, 10773–10781. doi: 10.1002/2015gl066235
Pȩtlicki, M., Ciepły, M., Jania, J. A., Promińska, A., and Kinnard, C. (2015). Calving of a tidewater glacier driven by melting at the waterline. J. Glaciol. 61, 851–863. doi: 10.3189/2015JoG15J062
Rasmussen, L., Conway, H., and Raymond, C. (2007). Influence of upper air conditions on the Patagonia icefields. Global Planet. Change 59, 203–216. doi: 10.1016/j.gloplacha.2006.11.025
Rignot, E., Rivera, A., and Casassa, G. (2003). Contribution of the Patagonia Icefields of South America to sea level rise. Science (New York, N.Y.) 302, 434–437. doi: 10.1126/science.1087393
Rignot, E., Xu, Y., Menemenlis, D., Mouginot, J., Scheuchl, B., Li, X., et al. (2016). Modeling of ocean-induced ice melt rates of five west greenland glaciers over the past two decades. Geophy. Res. Lett. 43, 6374–6382. doi: 10.1002/2016GL068784
Ritchie, J. B., Lingle, C. S., Motyka, R. J., and Truffer, M. (2008). Seasonal fluctuations in the advance of a tidewater glacier and potential causes: Hubbard Glacier, Alaska, USA. J. Glaciol. 54, 401–411. doi: 10.3189/002214308785836977
Rivera, A., Koppes, M., Bravo, C., and Aravena, J. C. (2012). Little Ice Age advance and retreat of Glaciar Jorge Montt, Chilean Patagonia. Clim. Past 8, 403–414. doi: 10.5194/cp-8-403-2012
Röhl, K. (2006). Thermo-erosional notch development at fresh-water-calving Tasman Glacier, New Zealand. J. Glaciol. 52, 203–213. doi: 10.3189/172756506781828773
Sakakibara, D., and Sugiyama, S. (2014). Ice-front variations and speed changes of calving glaciers in the Southern Patagonia Icefield from 1984 to 2011. J. Geophys. Res. Earth 119, 2541–2554. doi: 10.1002/2014JF003148
Sakakibara, D., Sugiyama, S., Sawagaki, T., Marinsek, S., and Skvarca, P. (2013). Rapid retreat, acceleration and thinning of Glaciar Upsala, Southern Patagonia Icefield, initiated in 2008. Ann. Glaciol. 54, 131–138. doi: 10.3189/2013AoG63A236
Schaefer, M., Machguth, H., Falvey, M., Casassa, G., and Rignot, E. (2015). Quantifying mass balance processes on the Southern Patagonia Icefield. Cryosphere 9, 25–35. doi: 10.5194/tc-9-25-2015
Schild, K. M., and Hamilton, G. S. (2013). Seasonal variations of outlet glacier terminus position in Greenland. J. Glaciol. 59, 759–770. doi: 10.3189/2013JoG12J238
Skvarca, P., De Ángelis, H., Naruse, R., Warren, C., and Aniya, M. (2002). Calving rates in fresh water : new data from southern Patagonia. Ann. Glaciol. 34, 379–384. doi: 10.3189/172756402781817806
Skvarca, P., and Naruse, R. (1997). Dynamic behavior of Glaciar Perito Moreno, southern Patagonia. Ann. Glaciol. 24, 268–271.
Skvarca, P., and Naruse, R. (2004). Overview of the ice-dam formation and collapse of Glaciar Perito Moreno, southern Patagonia, in 2003/04. J. Glaciol. 52, 476–478. doi: 10.3189/172756506781828539
Stearns, L. A., Hamilton, G. S., Van Der Veen, C. J., Finnegan, D. C., O'Neel, S., Scheick, J. B., et al. (2015). Glaciological and marine geological controls on terminus dynamics of Hubbard Glacier, southeast Alaska. J. Geophys. Res. Earth 120, 1065–1081. doi: 10.1002/2014JF003341
Straneo, F., Heimbach, P., Sergienko, O., Hamilton, G., Catania, G., Griffies, S., et al. (2013). Challenges to understanding the dynamic response of greenland's marine terminating glaciers to oceanic and atmospheric forcing. Bull. Amer. Meteo. Soc. 94, 1131–1144. doi: 10.1175/BAMS-D-12-00100.1
Stuefer, M. (1999). “Investigations on Mass Balance and Dynamics of Moreno Glacier based on Field Measurements and Satellite Imagery,” Unpublished Ph.D. dissertation, Universität Innsbruck.
Stuefer, M., Rott, H., and Skvarca, P. (2007). Glaciar Perito Moreno, Patagonia: climate sensitivities and glacier characteristics preceding the 2003/04 and 2005/06 damming events. J. Glaciol. 53, 3–16. doi: 10.3189/172756507781833848
Sugiyama, S., Minowa, M., Sakakibara, D., Skvarca, P., Sawagaki, T., Ohashi, Y., et al. (2016). Thermal structure of proglacial lakes in patagonia. J. Geophys. Res. Earth 121, 2270–2286. doi: 10.1002/2016jf004084
Sugiyama, S., Skvarca, P., Naito, N., Enomoto, H., Tsutaki, S., Tone, K., et al. (2011). Ice speed of a calving glacier modulated by small fluctuations in basal water pressure. Nat. Geosci. 4, 597–600. doi: 10.1038/ngeo1218
Truffer, M., and Motyka, R. (2016). Where glaciers meet water: subaqueous melt and its relevance to glaciers in various settings. Rev. Geophys. 54, 220–239. doi: 10.1002/2015RG000494
Tsutaki, S., Nishimura, D., Yoshizawa, T., and Sugiyama, S. (2011). Changes in glacier dynamics under the influence of proglacial lake formation in Rhonegletscher, Switzerland. Ann. Glaciol. 52, 31–36. doi: 10.3189/172756411797252194
Tsutaki, S., Sugiyama, S., Nishimura, D., and Funk, M. (2013). Acceleration and flotation of a glacier terminus during formation of a proglacial lake in Rhonegletscher, Switzerland. J. Glaciol. 59, 559–570. doi: 10.3189/2013JoG12J107
van der Veen, C. (2002). Calving glaciers. Prog. Phys. Geo. 26, 96–122. doi: 10.1191/0309133302pp327ra
Vieli, A., Jania, J., and Kolondra, L. (2002). The retreat of a tidewater glacier: observations and model calculations on Hansbreen, Spitsbergen. J. Glaciol. 48, 592–600. doi: 10.3189/172756502781831089
Warren, C., and Aniya, M. (1999). The calving glaciers of southern South America. Global Planet. Change 22, 59–77. doi: 10.1016/S0921-8181(99)00026-0
Warren, C., Benn, D., Winchester, V., and Harrison, S. (2001). Buoyancy-driven lacustrine calving, Glaciar Nef, Chilean Patagonia. J. Glaciol. 47, 135–146. doi: 10.3189/172756501781832403
Warren, C. R., Glasser, N. F., Harrison, S., Winchester, V., Kerr, A. R., and Rivera, A. (1995). Characteristics of tide-water calving at Glaciar San-Rafael, Chile. J. Glaciol. 41, 273–289.
Weeks, W., and Campbell, W. (1973). Icebergs as a fresh water source: an appraisal. J. Glaciol. 12, 207–233.
Keywords: freshwater calving glacier, ice front position, ice speed, calving, subaqueous melting, frontal ablation, Patagonia
Citation: Minowa M, Sugiyama S, Sakakibara D and Skvarca P (2017) Seasonal Variations in Ice-Front Position Controlled by Frontal Ablation at Glaciar Perito Moreno, the Southern Patagonia Icefield. Front. Earth Sci. 5:1. doi: 10.3389/feart.2017.00001
Received: 07 October 2016; Accepted: 09 January 2017;
Published: 24 January 2017.
Edited by:
Thomas Vikhamar Schuler, University of Oslo, NorwayReviewed by:
Christoph Schneider, Humboldt University of Berlin, GermanyAndreas Vieli, University of Zurich, Switzerland
Copyright © 2017 Minowa, Sugiyama, Sakakibara and Skvarca. This is an open-access article distributed under the terms of the Creative Commons Attribution License (CC BY). The use, distribution or reproduction in other forums is permitted, provided the original author(s) or licensor are credited and that the original publication in this journal is cited, in accordance with accepted academic practice. No use, distribution or reproduction is permitted which does not comply with these terms.
*Correspondence: Masahiro Minowa, minowa.masahiro@gmail.com