Diurnal Cycles of Meltwater Percolation, Refreezing, and Drainage in the Supraglacial Snowpack of Haig Glacier, Canadian Rocky Mountains
 Samira Samimi*
  Shawn J. Marshall
- Department of Geography, University of Calgary, Calgary, AB, Canada
Meltwater refreezing and storage in the supraglacial snowpack can reduce and delay meltwater runoff from glaciers. These are well-established processes in polar environments, but the importance of meltwater refreezing and the efficiency of meltwater drainage are uncertain on temperate alpine glaciers. To examine these processes and quantify their importance on a mid-latitude mountain glacier, we measured the temperature and meltwater content in the upper 50 cm of the supraglacial snowpack of Haig Glacier in the Canadian Rocky Mountains. Thermistors and Time Domain Reflectometry (TDR) probes were installed at 10-cm intervals at two sites in the glacier accumulation area from May to September, 2015. A Denoth meter was used to make point measurements for comparison with the TDR inferences of snowpack dielectric properties. These data are supplemented by automatic weather station data, used to calculate surface melt rates and drive a model of subsurface temperature, refreezing, and drainage. We observed a strong diurnal cycle in snow water content throughout the summer melt season, but subsurface refreezing was only significant in May; after this, overnight refreezing was restricted to a thin surface layer of the snowpack. Overnight decreases in water content after May are associated with meltwater percolation and drainage. There was negligible meltwater retention in the snow on a daily basis, but the refrozen water does represent an “energy sink,” with 10–15% of the available melt energy diverted to melting refrozen meltwater. This reduces the total meltwater runoff from the site, even though no meltwater is retained in the system.
Introduction
Glacier meltwater represents a significant water resource in many of the world's mountain regions (e.g., Huss, 2011; Jost et al., 2012; Mark et al., 2015; Soruco et al., 2015). Mountain glaciers act as short- and long-term water reservoirs, retaining snow cover throughout the year and storing this as firn and ice on timescales of decades to centuries. This storage reservoir can be tapped in warm, dry periods, when the seasonal snowpack is depleted and water supplied by rainfall and snow melt may not be available to provide a vital source of water for mountain rivers, maintaining minimum flows (Fountain and Tangborn, 1985; Jansson et al., 2003) and regulating stream temperatures (Moore et al., 2009).
Estimates of glacier contributions to streamflow commonly assume that 100% of surface melt runs off of the glacier, contributing to river flows with minimal delays (e.g., Huss, 2011; Marshall et al., 2011). In some situations, it may be valid to assume that glacier melt contributes to downstream flow with negligible storage or losses, such that total monthly melt can be compared with the monthly runoff. However, meltwater runoff is subject to delays and storage within the subglacial, englacial, and supraglacial systems, particularly during the early melt season (Willis et al., 2002) when meltwater is stored in the pore space of seasonal snow and firn (Fountain, 1996; Fountain and Walder, 1998; Schneider, 2000). Meltwater can also be stored as a layer of slush on top of the impermeable ice (e.g., Koenig et al., 2014).
The importance of these processes in temperate mountain glaciers is uncertain. Temperate mountain glaciers are commonly steep and are efficiently drained from mid- to late-summer, with well-developed channel systems that deliver meltwater to proglacial streams in a matter of hours (e.g., Shea et al., 2005).
The winter snowpack and firn aquifer can store large quantities of water (Östling and Hooke, 1986; Fountain and Walder, 1998; Schneider, 2000; Koenig et al., 2014). For instance, 10 meters of snow and firn with a 5% water content by volume equates to 500 mm of water, which is a significant fraction of summer melt in the accumulation area of most temperate mountain glaciers. If this aquifer is recharged each summer, this can represent a delay in meltwater runoff from the glacier system with a timescale of weeks to months. Hydrological models of glaciers need to include these processes of meltwater refreezing and storage in the snow and firn, to better represent the timing of glacier contributions to streamflow.
With the acknowledged importance of meltwater percolation, storage, and refreezing in glacier mass and energy balance (e.g., Pfeffer et al., 1991; Schneider and Jansson, 2004; Reijmer et al., 2012), extensive recent effort has gone into methods to measure and model these processes in snow and firn. Direct measurements of snow liquid water content are rare in glacier studies, but point measurements have been made using capacitance plates (Denoth, 1994) or other means to infer water content from the dielectric permittivity, such as snow forks (e.g., Pfeffer and Humphrey, 1998), and these methods appear sensitive enough to infer volumetric water content changes of ~1% in snow (Techel and Pielmeier, 2011). Upward-looking radar systems are now being used to continuously monitor meltwater percolation, after successful introduction of this technology in snow avalanche and snow hydrology applications (e.g., Heilig et al., 2009, 2015; Mitterer et al., 2011b; Schmid et al., 2014).
Models of meltwater percolation processes, including preferential flow, are also improving rapidly, particularly within SNOWPACK (Hirashima et al., 2010; Mitterer et al., 2011a,b; Wever et al., 2015). For glacier and ice sheet applications, coupled energy balance and snow/firn hydrology models have also been developed to quantify the effects of meltwater refreezing and retention on glacier mass balance (e.g., Van Pelt et al., 2012; Reijmer et al., 2012). In situ data are still needed to calibrate and evaluate these models, and to address the complexities of preferential flow paths in layered and cold snowpacks (e.g., piping, sills). Drainage and refreezing processes are probably simpler in the case of temperate mountain glaciers, but this has not been thoroughly considered. Our main objective here is to quantify the potential importance of meltwater refreezing and retention for a mid-latitude mountain glacier.
Meltwater refreezing can also be important to the glacier energy and mass balance, with the potential for overnight refreezing to reduce seasonal runoff. When meltwater that is in the surface snow or is pooled on the glacier surface refreezes overnight or due to a cold-weather system, it consumes energy to re-warm and re-melt this ice once the surface energy balance returns to a positive state. Where this happens every night, this can lead to “recycling” of meltwater, with energy being used to melt the same water several times, and projected glacier meltwater production will exceed the actual runoff. This process has been posited to be significant for mountains glaciers (Marshall, 2014), but it is unknown whether it is important to total summer runoff and mass balance.
Here we report on measurements of meltwater percolation, storage, and refreezing in the supraglacial snowpack of Haig Glacier in the Canadian Rocky Mountains. We used Time Domain Reflectometry (TDR) and thermistor probes to measure water content of the upper 50 cm of the surface snowpack at two sites on the upper glacier from May through September, 2015. In conjunction with automatic weather station (AWS) data and a model of surface energy balance and melt, we examine meltwater storage, refreezing and drainage within the snowpack, and the implications for the surface energy balance and glacier runoff.
The paper is organized as follows: Section Methods provides details of the field site, instrumentation, measurement protocols, and a brief review of TDR applications to measure soil and snow water content. We provide some detail because, to our knowledge, automatically-recording TDR probes have not previously been used to monitor snow or firn hydrology on glaciers. Section Results presents our results and Section Discussion discusses the broader implication of our measurements, methods, and findings.
Methods
Field Site
Haig Glacier (50°43′'N, 115°18′'W) is a small mountain glacier located approximately 100 km southwest of Calgary, Alberta in the Canadian Rocky Mountains (Figure 1). It is the main outlet of a small icefield that lies on the continental divide. The central flowline is 2.7 km in length, with an elevation range from 2435 to 2840 m, and the median elevation of the glacier is 2662 m. Glaciological and meteorological studies on Haig Glacier were established in August 2000 and more details on the energy and mass balance regime are given in Marshall (2014).
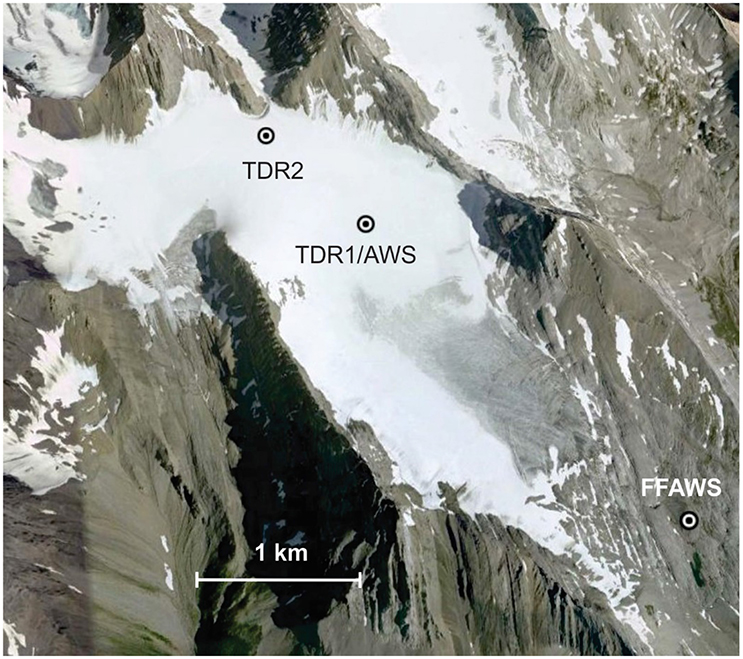
Figure 1. Map of Haig Glacier, Canadian Rocky Mountains, indicating the weather station (AWS), forefield weather station (FFAWS), and TDR sites used in this study. TDR1 is at an elevation of 2700 m and TDR2 is at 2820 m.
The glacier is influenced by a mixture of continental and Pacific climates. The melt season at this site usually runs from May until September, with intermittent snow and freeze-up events throughout the summer. Average winter snow accumulation on the upper glacier was 1700 mm water equivalent (w.e.) from 2002 to 2013, and the average glacier accumulation over this period was 1360 mm w.e. (Marshall, 2014). Summer mass balance averaged −2350 mm w.e. from 2002 to 2013. Of the summer runoff, an average of 42% was derived from firn and ice and 58% comes from seasonal snow melt. Glacier mass balance data reported by Marshall (2014) show net mass balance has been negative every year since the Haig Glacier study was initiated in 2000, with an average value of −960 mm w.e. per year from 2002 to 2013. The glacier accumulation area is shrinking, with complete loss of the winter snowpack on six summers since 2000, but some firn still remains above an elevation of about 2720 m.
TDR Methods
To monitor meltwater retention and refreezing in the supraglacial snowpack, we installed TDR probes on the upper glacier in summer 2015. TDR is a method of measuring water content and electrical conductivity based on relative permittivity (dielectric constant) of water, and is a well-established tool in soil hydrology studies. This method was applied to measure soil water content by Topp et al. (1980). Here we applied TDR to snow with only two modifications: we change the window for collecting the waveforms in the datalogger program, and equations specific to snow are needed to relate dielectric to snow water content.
With TDR probes, electromagnetic charges (EM waves) are sent along a conductive rod with length L. The probe contains three parallel metal rods that are inserted in the snow. The two-way travel time, t, is measured to determine how long it takes for the wave to reflect back from the end of the rod, a distance 2L. Propagation velocity v = 2L/t. Snow is a dielectric medium, which allows no net flow of electric charge but experiences a displacement of charges in response to the imposed electric field. This affects the propagation velocity of the wave in the snow, particularly in the presence of liquid water. Wave speed decreases in proportion to the relative permittivity of the snow surrounding the probe, εs, following v = c/ εs 1/2 (e.g., Topp and Davis, 1985). Here c = 3 × 10⁸ m s−1 is the speed of light, the propagation velocity of electro-magnetic waves in a vacuum.
Snow is a porous medium that is made up of a mixture of ice, air, and liquid water. The dielectric properties of snow vary because the dielectric permittivity of air, ice, and water differ markedly: εa = 1, εi = 3.2, and εw = 80. Hence, the dielectric permittivity of snow increases strongly with liquid water content, making εs a sensitive indicator of snow moisture. For porosity q and volumetric liquid water fraction θw, the bulk density of the snow is
Where ρi is the density of ice crystals in the snow matrix and ρa and ρw are the densities of air and water. The dry density, ρd, is calculated from Equation (1) when θw = 0. When the snow is dry (e.g., on our first field visit in May), ρs = ρd and this can be measured directly. When the snow is wet, an estimate of θw is needed to calculate dry density from field measurements of ρs. Snow density and water content both influence dielectric permittivity because solid and liquid water molecules are polarized in the presence of an electric field, and a greater mass of these molecules creates more polarization and a higher relative permittivity.
Measured dielectric permittivity needs to be converted to water content based on a dielectric mixing model. There are different approaches for this. Empirical equations that relate TDR-derived dielectric permittivity to liquid water content have been developed for soils (e.g., Topp et al., 1980; Ledieu et al., 1986), but these are not appropriate for snow or firn. Tiuri et al. (1984) introduce empirical equations that relate the dielectric permittivity to dry snow density and snow water content. Stein et al. (1997) and Schneebeli et al. (1998) discuss the application of TDR probes in snow. Several studies employ the Looyenga mixing model (Looyenga, 1965) to relate dielectric permittivity to water content in firn and ice (e.g., Macheret et al., 1993; Murray et al., 2000; Van Pelt et al., 2014; Christianson et al., 2015). The Looyenga mixing model estimates water content as a function of the dry density, following:
and
To apply Equation (3), es is measured by the TDR and ed is calculated from Equation (2), using the dry density based on snow density measurements and Equation (1). This requires an estimate of water content in Equation (1); we base this on the coincident field measurements of snow density and the TDR-inferred θw, so the calculation is iterative, but dry density estimates are not strongly sensitive to small variations in θw. Variables εw, εi and ρi are constants.
As an alternative to the Looyenga model, we also consider a linear mixing model that is based on the volume-averaged index of refraction (Birchak et al., 1974), following
Recent snow radar studies (e.g., Heilig et al., 2015) also apply an exponent of 0.5 in the dielectric mixing model. This relation more directly relates to the volume-averaged wave velocity that is measured by the TDR, which is a function of εs 1/2 (Birchak et al., 1974). To evaluate which model works better, we compare the estimates of θw from Equation (3, 4) with measurements from a Denoth meter (Denoth, 1994), a capacitance sensor that is commonly used for snow moisture measurements. This is an analog sensor, so comparisons are limited to point measurements that were done on two site visits in summer 2015. Data from the Denoth meter were collected every 2 h in snow layers beside the TDR sensors.
Field Experiment Design
Four TDR probes were installed in the upper 50 cm of the seasonal snowpack in the accumulation area of the Haig glacier, 10 cm vertically apart from each other to monitor the vertical movement of percolated melt water. Beside each probe we installed a thermistor to monitor the temperature in the snowpack. The study sites are indicated in Figures 1, 2 shows an example of the field setup. TDR pits were filled up with snow once the probes were installed. The data logger recorded the data every 30 min and it was collected every 3–4 weeks. Site visits and details of the TDR installation are given in Table 1. Our first visit was in mid-May, prior to the onset of meltwater runoff. Snow pits were dug to the previous summer surface at sites TDR1 and TDR2 and sampled every 10 cm for density with a 100-cc box-cutter snow sampler. The snowpack was isothermal. Snow depths at sites TDR1 and TDR2 were 302 and 356 cm, respectively, with snow-water equivalents of 1270 and 1450 mm. The average snow density at TDR1 was 420 kg m−3 in May, and 450 kg m−3 in the upper 50 cm. Corresponding May values at site TDR2 were 410 and 460 kg m−3.
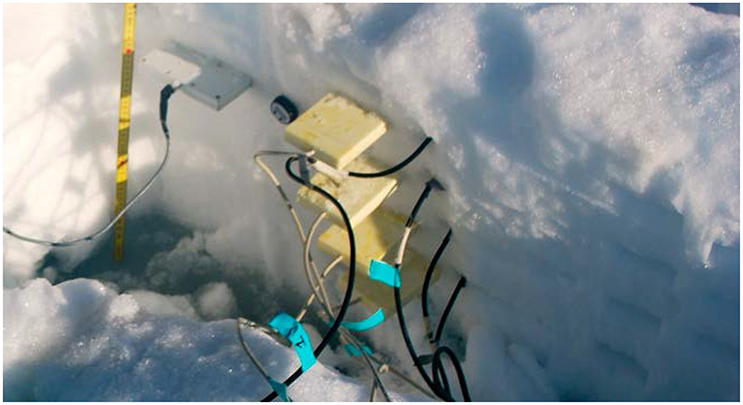
Figure 2. Photograph of the TDR field setup. TDR sensors and thermistors were installed with 10-cm spacing in the upper 50 cm of the snowpack. A Denoth meter was used to make point measurements for comparison with the TDR.
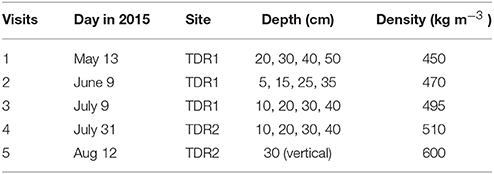
Table 1. Field visits and TDR setup, summer 2015.
The TDR probes and thermistors melted out over a few days after each installation, so the data are only valid for 2–8 days after we left the field, depending on the melt rates. On each visit we dug a new pit, reinstalled the probes, and measured the snow densities in each 10-cm layer. Haig Glacier experienced an extreme melt year in 2015 and lost all of its winter snowpack by the second week of August. The snow at our initial study site, TDR1, was gone on July 21, so in our late-July visit we relocated to site TDR2, where about 60 cm of snow remained. Firn was exposed at site TDR2 at the time of our August visit. We could not dig into the firn, so probes were inserted vertically, all sampling the upper 30-cm of the firn. There were 20 cm of fresh snow at the time of instrument takedown and removal on Sept 21.
An automatic weather station (AWS) was installed at site TDR1 from May 12-September 21. Table 2 lists the instruments mounted on the AWS and in the TDR pits. AWS data are used to monitor the snow-surface height, which indicates the time of melt-out for the sensors, and also as input to a model of surface energy balance. The net energy at the glacier surface is a function of the energy fluxes at the surface-atmosphere interface,
Where QS is the incoming shortwave radiation, α is the surface albedo, and are the incoming and outgoing longwave radiation, QH and QE are the sensible and latent heat fluxes, Qc is the conductive heat flux from the snow/ice to the surface. All energy fluxes have units W m−2. Radiation fluxes are measured directly. The turbulent fluxes are modeled using a bulk aerodynamic approach that uses AWS temperature, humidity, and wind speed (Marshall 2014), and the conductive heat flux is modeled using a multi-layered subsurface snow/firn/ice model to 10-m depth (Ebrahimi and Marshall, 2016). This is the approximate depth of penetration of the annual temperature wave (Cuffey and Paterson, 2010).
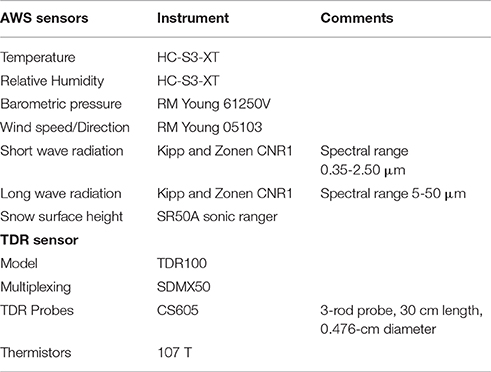
Table 2. Sensors installed on the automatic weather station (AWS) and in the TDR pits in summer 2015.
When QN is positive and the surface temperature is below 0°C, net energy goes to heating the surface layer of the snow/ice, a 10-cm layer within the subsurface model. If the surface is at 0°C, positive net energy goes to melting, following
Where m is the melt rate (m s−1), and Lf is the latent heat of fusion. If net energy is negative, any liquid water that is present will refreeze and then the surface layer will cool.
The surface energy balance is a boundary condition for the subsurface model, which describes the coupled snow thermodynamics and hydrology. Subsurface temperatures are modeled as a function of heat conduction and meltwater refreezing, following
Where ρs, cs, and kt are the density, heat capacity, and thermal conductivity of the subsurface snow, firn, or ice and φt(z) is a local source term that accounts for latent heat of refreezing,
The refreezing rate ṙ has units m s−1, φt has units W m−3, and Δz is the thickness of the layer in which the meltwater refreezes.
Refreezing is calculated within the subsurface thermal model. We track the volumetric liquid water fraction, θw, in the snow/firn pore space, and if conductive energy loss occurs in a subsurface layer where liquid water is present, this energy is diverted to latent enthalpy of freezing, rather than cooling the snow. Temperatures cannot drop below 0°C until θw = 0. Liquid water is converted to ice in the subsurface layer.
The surface energy balance in Equation (5) also gives melt totals every 30 min, which are used in conjunction with the TDR data to examine meltwater drainage and storage in the upper 50 cm of the snowpack. To calculate the meltwater drainage fluxes at each depth, z, we use a simple model of water balance based on the change in measured water content, assuming that the surface meltwater percolates locally. We did not account for rainfall, although this is a potentially important contribution to the snow water content at times. There were no rain events during the data intervals that we analyse here.
For snow layers with thickness Δz and with θw expressed as the fractional water content, the amount of water in a given layer is equal to θw Δz. In our study Δz = 0.1 m and the water content θw Δz can be expressed in meters. Define the meltwater percolation rate to be qw and a local ϑw refreezing rate ṙ, as above, each with units m s−1. The local water balance in each subsurface layer is then:
where, and qwu and qwl refer to the meltwater flux into (upper boundary) and out of (lower boundary) the layer and any water that refreezes is distributed over the layer Δz. We assume that all meltwater flow is vertical (gravitational drainage with no horizontal advection), such that the flux divergence in Equation (9) can be calculated from the vertical derivative.
Meltwater fluxes are estimated by solving Equation (9), given independent estimates of the snow water content (from the TDR measurements) and internal refreezing. The flux into the top layer is equal to the melt rate, modeled from Equation (6). At all layer boundaries below this, qw is calculated from Equation (9), using measured value of dθw/dt and model estimates of ϑw in each layer. Refreezing is calculated within the subsurface model; if there is an energy deficit in a layer, available liquid water will freeze before the subsurface layer can cool below 0°C. This drainage model is used to characterize percolation timescales and the effective hydraulic conductivity of the snowpack.
Results
AWS data for the summer are plotted in Figure 3, to give a quantitative sense of the summer weather. Air temperatures fluctuated around 0°C during mid-May, but mostly stayed above the melting point, even overnight, from June through August (JJA) (Figure 3A). The average JJA temperature was 6.0°C, compared to a normal of 4.7°C at this altitude on the glacier (2002–2014). All JJA days, and 122 out of 131 days for the whole period, had maximum temperatures above 0°C. In contrast, only 20 out of 92 JJA days saw minimum temperatures below 0°C.
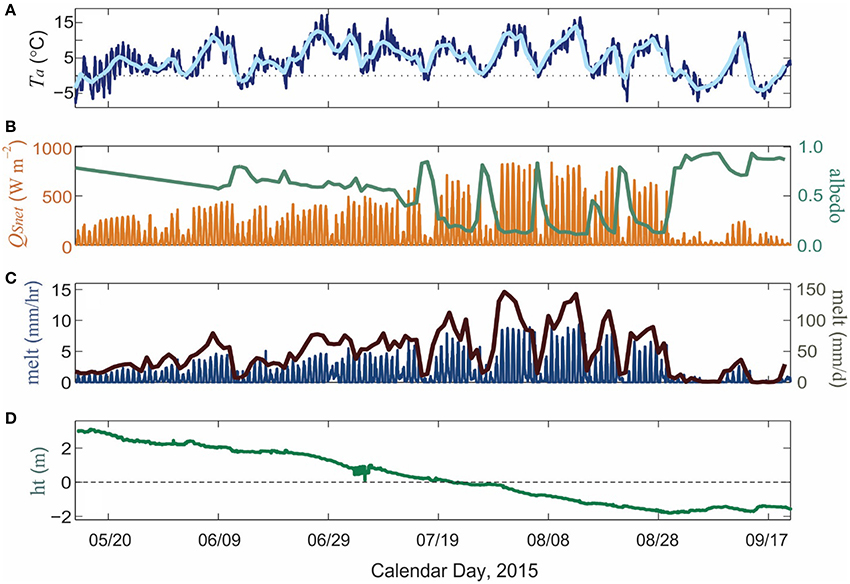
Figure 3. Meteorological observations at the Haig Glacier AWS site, May 13-Sept 21, 2015. (A) Air temperature, 30-min (dark blue) and daily mean (light blue). (B) Net shortwave radiation (orange) and daily mean albedo (green). (C) modeled melt, hourly (dark blue), and daily total (brown). (D) SR50 snow/ice surface height. Negative values indicate glacier ice ablation.
The warm temperatures and sunny conditions (Figure 3B) drove high melt rates, with a positive feedback from a below-normal surface albedo (green line in Figure 3B). Albedo was low due to the early exposure of glacier ice as well as a heavy layer of impurities from forest-fire fallout; the warm, dry weather also made for a strong fire season in British Columbia, upwind of Haig Glacier, and this darkened the glacier surface. The average JJA albedo at site TDR1 was 0.46, and the bare-ice value through late July and August was 0.11. Albedo was temporarily refreshed by intermittent summer snow events through this period, which effectively shut down the melt for 1–2 days (Figure 3C).
The melt season on the upper glacier ended abruptly around August 31, with new snow arriving and persisting in the upper accumulation area. Small amounts of melting continued during warm intervals in September, but restricted to the new snow at the AWS site. Despite this relatively early onset of winter, cumulative ablation at the AWS site was about 5 m (Figure 3D), or 2700 mm w.e. Net mass balance at the site was −1470 mm w.e. and the glacier-wide value for 2014–2015 was about −2200 mm w.e.
The complete loss of snow and the warm conditions in the accumulation area made for an interesting summer, if not ideal for examining meltwater refreezing and storage in the snow. Analysis of our TDR data therefore concentrates on the spring and early summer. On the positive side, the warm summer and high melt rates provide a good example of meltwater drainage and refreezing processes under these conditions.
Denoth-meter data collected on the June and July visits confirms that the TDR is reliably measuring water content, but with uncertainty in the relation between dielectric permittivity and snow water content. Figure 4A plots θw values at 10-cm depth from the Denoth meter and the two TDR mixing models that we apply, Equations (3, 4), for a series of bi-hourly measurements from July 7 to 9. The three methods show the same diurnal cycle, but Equation (4) gives us a closer match to the Denoth meter. The Looyenga mixing model give a 4% higher volumetric water content than the other two methods. The full set of TDR vs. Denoth data is plotted in Figure 4B. There is considerable scatter but the Birchak mixing model, Equation (4), is generally closer to the Denoth-meter readings and gives lower values of θw, more in accord with values reported elsewhere for melting snow (e.g., Kawashima et al., 1993; Niang et al., 2006). Based on this comparison, we use the linear mixing model to estimate θw from the TDR data for our analyses.
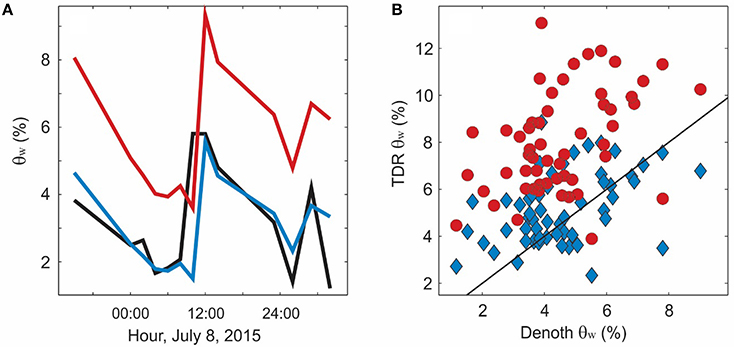
Figure 4. Comparison of volumetric water content, θw, derived from a Denoth meter vs. the TDR probes. Water volume with the TDR probes is calculated from the measured dielectric coefficient using a linear (blue) and Layoonga (red) mixing models. (A) Temporal evolution of snow water content at 10-cm depth below the surface. (B) Available Denoth-meter data vs. TDR-derived θw values from site visits on July 7–8 and July 30–31.
TDR Results
There are strong diurnal cycles in temperature during the early melt season, with overnight temperatures dropping below 0°C (Figure 3A). Figure 5 gives a detailed view of air temperature, net energy (Equation 5), and the subsurface thermistor and TDR data for the period May 16–23. Melt rates were relatively low during this period, up to 20 mm w.e. d−1 (Figure 3C), and sensors were installed from 20 to 50 cm depth, so data remain valid for more than a week before the top sensor melted out. There were clear-sky conditions from May 18 to 23, evident in the shortwave radiation record (Figure 5B), and this drove strong overnight cooling (Figure 5A). Net energy was negative overnight during this period (Figure 5B) and the snowpack refroze to between 30 and 40 cm depth (Figure 5C). The top two thermistors recorded minimum temperatures of about −5 and −3°C overnight, and later in this week the lower two thermistors also registered sub-freezing temperatures. By this point, after May 21, more than 10 cm of ablation had occurred and these two sensors were within 40 cm of the surface.
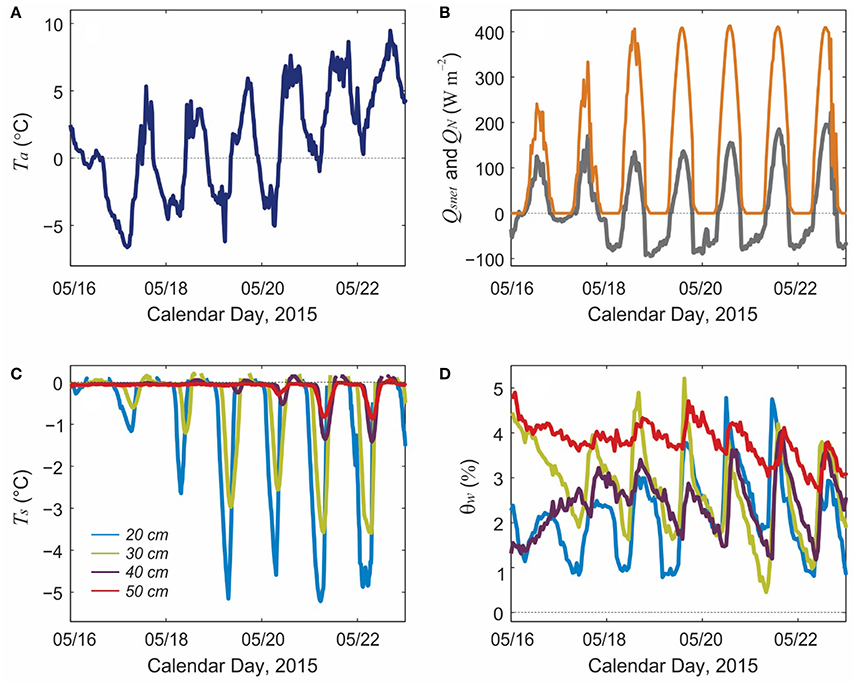
Figure 5. Meteorological and snowpack conditions from May 15-22, 2015. (A) Air temperature, °C. (B) Net shortwave radiation (orange) and net energy (gray), W m−2. (C) Snow temperatures (°C) and (D) TDR-derived water content (%) at 20, 30, 40, and 50 cm depth.
The TDR data (Figure 5D) show diurnal cycles, in good accord with the temperature data and net energy, with water content between 1 and 5%. There are overnight minima and daytime maxima in snow water content, but with some lags relative to the shortwave radiation and net energy. The lowest values of θw are recorded in the early morning, ca. 06:00–09:00, followed by a rapid rise and mid-afternoon peak in θw around 15:00–16:00. This is consistent with overnight refreezing, as indicated by the thermistors, followed by shortwave-driven thawing and surface melting during the day. The overnight phase change in the snowpack has some inertia. Delays in the freezing-front migration to depth are also clear in the thermistor data. The deepest thermistor/TDR pair, at 50 cm, have different behavior through this period, remaining at 0°C for most of this time with only small diurnal cycles in θw. Water content remains near 4%, and only starts to drop below this as the sensor depth shoals over the last 2 days.
TDR-inferred water content does not drop to 0 as should be the case with deep overnight refreezing. We attribute this to errors in the TDR measurements and in our equations that relate water content to the measured dielectric permittivity. Results indicate an uncertainty of ~2% in the measurements, with a positive bias; this bias is about two times higher with the Looyenga mixing model. Similar results are reported by Pfeffer and Humphrey (1998) with snow-fork based snow water content measurements in Greenland: liquid water contents of 2–3% at sub-freezing temperatures. This implies a potential positive bias in the sensor, at least at low water contents. In soil studies, Jones et al. (2002) report an uncertainty of 1–2% in TDR-based water content estimates. In contrast, Schneebeli et al. (1998) document no evidence of a systematic bias in comparisons of TDR results with Denoth meter measurements in snow.
Figure 6 plots comparable data for the full study period, illustrating the seasonal evolution of the net energy, melt rates, and snow water content. The time scale is not continuous, as we have only 2–8 days of valid data following each site visit/station reset. Thermistor data indicate that they rarely drop below 0°C following the May visit; the snowpack remained at the melting point subsequent to May, although a thin refrozen surface crust set up overnight during all of our site visits.
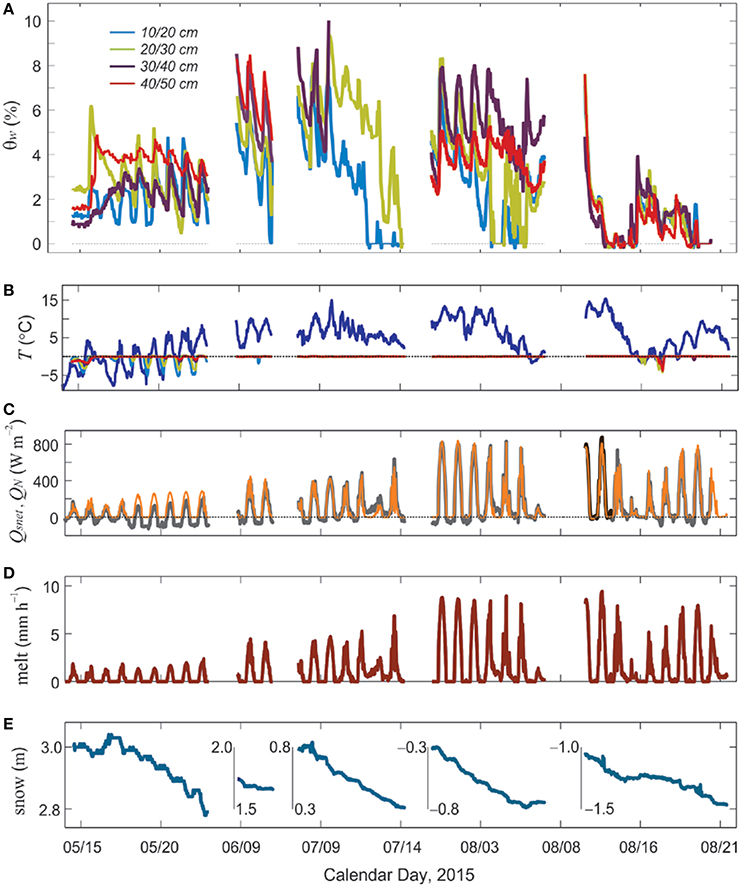
Figure 6. (A) TDR-derived snow water content in the upper 50 cm of the seasonal snow and firn and (B–E) weather conditions over the five study periods, summer 2015. (B) Air (dark blue) and snow temperatures, °C. Thermistor depths and colors are the same as in (A). (C) Net shortwave radiation (orange) and net energy (gray), W m−2. (D) Modelled melt rates, mm h−1. (E) Snow surface height (m). Negative values indicate ice ablation.
Snow water content varies from 0 to 10% in the main summer melt season, June through August, with strong diurnal cycles throughout the record, at all depths. Daytime values are typically in the range of 5–7%. Based on the thermistor data and shallow snow pits that we excavated during our visits, there is no evidence of overnight refreezing through this period. The diurnal cycles are driven instead by strong daytime melting and overnight drainage, once the meltwater is reduced or shut off for the night. The lowest water content tends to be near the surface, with θw increasing with depth, although this is not always the case. The deepest sensor in the August data (40 cm; red line in Figure 6A) records less water content than the sensors at 20–30 cm, but this is an exception in our data. Overnight water content in summer is around 4%. This probably corresponds to irreducible water content being held by capillary forces in snow pack.
During the July visit, only about 50 cm of snow remained at site TDR1 and there was a 10-cm thick layer of water at the base of the snowpack, visible in Figure 2. This water ponded at the ice-snow interface as a result of the impermeable glacier ice and a low slope at our study site, ca. 3°, which limits down glacier supraglacial drainage when there is still snow present. This layer of pure water and the overlying slush caused problems for our lowest TDR sensor, at 40 cm; it reported off-scale and no data are available from this sensor, so it is not plotted in Figure 6A. Our program for the TDR time window and waveform probably did not extend to high enough water contents to allow for useful data. Sensor 3, at 30 cm, also gave off-scale readings after two days. Sensor 1, at 10 cm, drops to 0 on July 12, at which time it has melted out and is lying on the snow surface. Sensor 2 follows suit the next day. The same behavior is seen in the August data.
While the sensors are in place, discharge at each level can be modeled through the local water balance, following Equation (9). Results of this simple drainage calculation are shown in Figure 7 for the periods where all four sensors were operational. Drainage is calculated every 30 min and expressed in units of mm h−1. The plots show both total melt (Equation 6) and the drainage (melt minus refreezing).
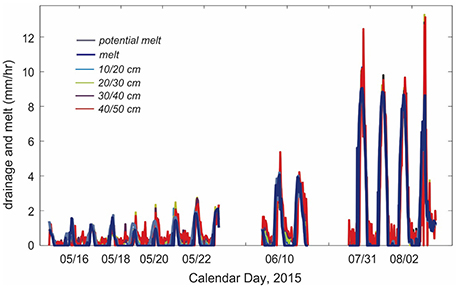
Figure 7. Modelled meltwater production and measured drainage for the TDR study periods in summer 2015.
In May there is a lag between the melt and drainage and drainage is always less than the total melt. This is consistent with the observed refreezing during the night and the partitioning of positive net energy between warming the snowpack and generating meltwater at the surface. When net energy becomes positive in the morning, it takes several hours to warm up and thaw the near-surface ice layers in the snowpack. Drainage peaks several hours after the peak melt, and continues overnight after the surface meltwater shuts off. By mid-summer all the meltwater is draining with little lag, which indicates negligible storage. Drainage in May is about 2 mm h−1, increasing to 10–12 mm h−1 in July and August.
To better quantify the delays in drainage, we calculate the lagged correlation between melt and drainage at each depth. Figure 8 plots the correlation results for lags of up to 8 h in May, June, and August, the time periods shown in Figure 7. In the top two layers (upper 20 cm), the maximum correlation is at a lag of 1 h in each case, which indicates that the meltwater is flushing through quickly. At depths of 30 to 50 cm, the maximum correlation increases to 3–4 h in May. Lags also increase with depth in June and August, but the correlations are stronger and the lag is reduced to 1 h in August. This indicates more rapid drainage and a tight coupling between the melt rates and drainage in the upper 40 cm of the snowpack. Unlike in May, there is negligible storage on hourly time scales.
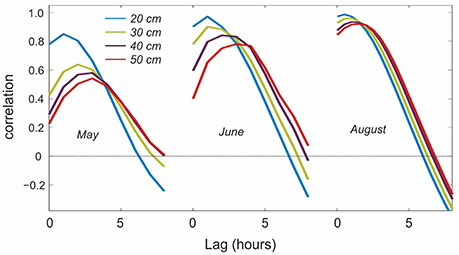
Figure 8. Lag in surface meltwater production vs. drainage at different depths.
Discussion
Uncertainties
There are several sources of uncertainty in the data and the model applied to infer water content from the measured dielectric. The TDR probes need to be well-coupled with the snow for a clean signal, and this may not always be the case, particularly as the snow becomes very wet. Snow density measurements and the associated porosity inferences have some uncertainty, as do all of the meteorological data that drive the melt model. The surface energy balance calculations require assumptions about the turbulent heat transfer (e.g., stability, surface roughness values). We neglect rainfall in this study, but we were at the site during the observation periods (e.g., Figure 6), and are confident that there was no rainfall during these periods. However, a more complete model should include liquid precipitation along with meltwater as a water source at the upper boundary in Equation (9).
The largest source of uncertainty is associated with conversion of the measured dielectric permittivity to θw. The Birchak et al. (1974) mixing model gives better estimates of θw than the Looyenga (1965) model with our data, but we still see θw values of ~2% when the near-surface snow was clearly refrozen, with temperatures of −5°C. This implies an uncertainty of about 2%, but also a potential positive bias in the measurements and/or mixing model. We are not certain about why the Looyenga model gives such high numbers. It has been successfully applied to saturated firn and ice (e.g., Macheret et al., 1993; Murray et al., 2000; Christianson et al., 2015) and snow (Niang et al., 2006). It may be that the geometry of water in the unsaturated pore space is inconsistent with the assumption of spherically-packed inclusions in the Looyenga mixing model.
Our comparisons with the Denoth meter assume no horizontal variations in snow-water content, such that we can compare adjacent measurements. The snow was highly homogeneous during our field work, so this may not be problematic.
Perhaps more critical is the implicit assumption that the TDR measurements are not impacted by excavating the snow pit. The snow pits were filled in after the sensors were installed, but this is still a disrupted environment, potentially favorable to surface water infiltration. The TDR probes are 30 cm long and they were inserted in the shaded wall, so they are sampling undisturbed snow. The overlying snow was also left undisturbed. Because slopes are low at this site, we assume purely vertical percolation of the meltwater (i.e., no horizontal advection), and we also did not witness any surface water flow at the two TDR sites. Meltwater drainage was through local gravitational percolation, with no visible piping, channeling, or preferential pathways. For these reasons, we don't believe that the snow being sampled by the TDR probes was influenced by the snow pit or aberrant hydrological behavior.
Implications for Supraglacial Hydrology and Glacier Mass Balance
The TDR data give an insightful representation of meltwater percolation and drainage in the supraglacial snowpack and its evolution through the summer melt season. Infiltration and drainage through the isothermal snow pack are fast processes, with percolation speeds of order 1–10 mm h−1 (Figure 7). The time lag for the meltwater wave to propagate through the upper 50 cm of the snowpack is up to a 4 h in the early melt season and 1–2 h in July and August (Figure 8). The higher lags in May are associated with overnight refreezing of the meltwater in the upper 40 cm of the snowpack. Over a 24-h timescale, all of the meltwater drains, even in the early melt season. Within the uncertainty of our measurements, we see no evidence of meltwater storage in the upper 50 cm of the snowpack on daily to seasonal timescales, after initial wetting of the snowpack.
We model the meltwater drainage as Darcian flow, with hydraulic conductivity kh and hydraulic head h = z. For gravitational drainage in this case, kh = qw. Our measured drainage rates give effective hydraulic conductivities of 3 × 10⁻⁷ m s−1 in May and 3 × 10⁻⁶ m s−1 July. The snowpack is unsaturated and these are not necessarily limiting values; they are set by the melt rates, and flow rates higher than this could possibly be accommodated. These values are low relative to firn estimates of 1–5 × 10⁻⁵ m s−1 in the review of Fountain and Walder (1998). However, our values are consistent with the saturated permeability value of κS ~2 × 10⁻⁹ m2 reported by Colbeck and Anderson (1982) for snow with a density of 500 kg m −3. This corresponds to a saturated hydraulic conductivity of kS ~10−2 m s−1. Applying the equations of Hirashima et al. (2010) for unsaturated water flow in snow, the corresponding unsaturated hydraulic conductivity is kh ~ 3 × 10⁻⁶ m s−1, in accord with our summer data.
Continuous measurements of snow water content and meltwater percolation in mountain snowpacks over the spring melt season are available from impedance sensors (Mitterer et al., 2011a) and upward-looking radar (Heilig et al., 2015; Wever et al., 2015), supplemented by lysimeter measurements of drainage at the base of the snowpack. These studies offer additional insight into wetting front propagation and drainage timescales, although hydraulic conductivities are not reported. Drainage rates reported by Mitterer et al. (2011a) reach 40 mm d−1 in late May, through a 1–1.5 m snowpack, corresponding to an effective hydraulic conductivity of 5 × 10⁻⁷ m s−1. Similarly, snowpack drainage rates of ~4 mm h−1 in Wever et al. (2015) and up to 60 mm d−1 in Heilig et al. (2015) equate to snowpack-integrated hydraulic conductivities of 10−6 and 7 × 10⁻⁷ m s−1, respectively. These values are consistent with our data and may also be minimum values, reflecting the ability of the ripened summer snowpack to transport all of the meltwater that is generated at the surface.
Our diurnal cycles of snow water content are similar to those in Mitterer et al. (2011a), who record daily θw variations between 4 to 8%. This suggests an irreducible water content of 4%, with daytime increases in pore water and drainage on a timescale of hours, giving complete overnight drainage. In contrast, Heilig et al. (2015) report lower values of θw (typically 2–4%) and more muted diurnal cycles, with an amplitude of 1–2%. Modeling of water drainage with SNOWPACK within these studies considering different formulations for meltwater percolation in mountain snowpacks, such that hydraulic conductivity is a function of numerous variables such as snow grain size and density, with no single value reported. Our results appear to be in accord with these previous observational and modeling studies of isothermal alpine snowpacks.
If we assume the snowpack to be homogeneous, such that percolation processes and the effective hydraulic conductivity are uniform with depth, these values imply that meltwater drains through the full summer snowpack to the firn or ice interface in less than a day. While we do not have deep sensors to confirm this, the summer snowpack, once temperate, has uniform density (constant within measurement uncertainty), with coarse, rounded grains and no layered structure, akin to the summer snowpack conditions reported by Wever et al. (2015). Hence, the upper 50 cm of the snowpack is likely representative. This is untrue in the early melt season, when the snowpack is still cold and there is strong overnight refreezing, but after mid-May during our study the snowpack was wetted, and there was negligible meltwater retention at our site. Meltwater can still be delayed and stored in the firn or in the englacial and subglacial systems, so we cannot make conclusions about meltwater retention in the full glacier hydrological system.
Figure 9 plots the predictions of a meltwater drainage model through the full melt season at the AWS site, based on Darcian drainage with a hydraulic conductivity of 10−6 m s−1. The model includes a subsurface temperature solution and a calculation of meltwater refreezing. During the first ~2 weeks of the study period (Figure 9), the near-surface snow cooled down overnight (Figure 5), much of the daily meltwater refroze, and it took several hours to warm up and thaw the surface layer the following morning. Local drainage did not commence until the afternoon and in the model, the meltwater did not reach the base of the snowpack and begin to drain until May 21 (Figure 9). Following this, drainage kept pace with melting for the rest of the summer. Overnight refreezing took place through most of the summer, until the snowpack was gone in August (Figure 9), but after mid-May the overnight refreezing was primarily associated with the irreducible water content of the snowpack in the near-surface, i.e. the water that is retained by capillary pressure. We assume the irreducible water content to be 3–4% by volume (7% of available pore space, after Colbeck, 1974 and Coléou and Lesaffre, 1998). This water refreezes at night or during cold periods if net energy is negative, but the associated latent heat release keeps the snowpack isothermal in mid-summer.
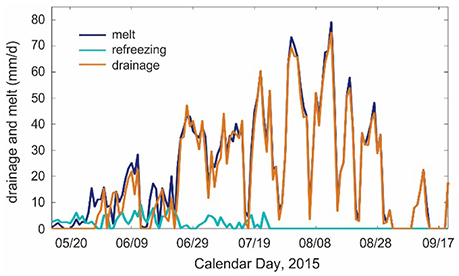
Figure 9. Daily total melt (blue), refreezing (marine), and runoff (orange) calculated from the subsurface drainage model at the Haig Glacier AWS site, summer 2015.
Total summer melt in Figure 9 is equal to 2960 mm w.e., with 2700 mm w.e. of drainage and 260 mm w.e. of refreezing. The deficit in drainage relative to melt is because some of this melt (about 260 mm w.e., or 9%) is “recycled” meltwater. In contrast to polar environments, little or no refrozen water is retained, since this thaws during the day and drains. Some meltwater may be retained in the system in September or October, within the fresh autumn snow that starts to accumulate on the glacier.
Our results depend on the assumed irreducible water content. If this is taken to be 6%, total summer melt, drainage, and refreezing are equal to 2940, 2620, and 320 mm w.e., respectively. For a value of 2%, the corresponding values are 3000, 2820, and 180 mm w.e. Within this range, this amounts to a drainage deficit of 6–11% relative to total summer melt. Drainage increases when there is less refreezing, since more of the available melt energy is committed to fresh surface melt rather than re-melting of the water that has refrozen. Total summer melt also increases slightly because the transition from snow to lower-albedo glacier ice occurs sooner.
Our results imply that meltwater refreezing has a significant (order 10%) impact on the summer surface mass balance on this glacier, even though there is negligible meltwater retention or internal accumulation in the seasonal snow. The refreezing process may be even more important for mountains glaciers at higher altitudes and latitudes. Temperatures and melt rates were also unusually high at our site in summer 2015; it was one of the most negative mass balance years on record in the Canadian Rocky Mountains. Caution is therefore needed in extending our refreezing observations to other summers.
When refreezing did occur at our site, it delayed the meltwater drainage by a few hours and it also consumed some of the available melt energy the subsequent day, reducing the daily drainage. This latter effect is the one that is of greatest interest for mountain glacier mass and energy balance. As an example, we calculate that 51 mm w.e. of meltwater refroze in the period May 16–23. The latent energy required to re-thaw this refrozen meltwater amounts to 17.0 MJ m−2, relative to a total positive net energy of 27.4 MJ m−2 that was available for melt over that period. An additional 8.2 MJ m−2 of the available net energy was consumed to warm up the snowpack to the melting point, leaving only 2.2 MJ m−2 available for “new” surface melt.
Internal snowpack refreezing releases latent heat, so this energy is available and contributes to the net snowpack energy (adding to the surface energy flux in Equation 5). Some of this serves to warm the snowpack, and some of it is dissipated to the atmosphere through conductive heat fluxes to the surface and subsequent radiative and convective cooling. When this occurs at night, under conditions of negative net energy, this energy is essentially lost to the system. The latent energy added to the near-surface snowpack during refreezing often keeps the snow close to or at the melting point, which indirectly adds to the melting the subsequent day.
The numbers from May 16 to 23 are not representative of the entire summer. At this time, the average air and surface snow temperatures were 1.7 and -2.6°C, respectively, conducive to refreezing. The corresponding numbers over the full study period, May 13–Sept 21, were 4.6 and −0.8°C, and the subsurface snowpack was isothermal for most of the summer. The total energy committed to thawing refrozen meltwater over the full period was 99 MJ m−2, 9% of the total available positive energy of 1141 MJ m−2. For the full melt season, the modeled runoff of 2880 mm w.e. corresponds to a latent energy of 965 MJ m−2, or 85% of available positive energy. The remaining 15% of available energy was used to warm the snowpack and thaw “recycled” meltwater. This enthalpy sink is a potentially important effect during cool summers and in colder environments.
Recommendations for Application of TDR in Glacier Hydrology
Conventional TDR probes are able to measure snow water content at the levels seen in the supraglacial snowpack (a few %). As these are easily deployed in combination with a data logger, continuous monitoring is possible, providing insight into diurnal and seasonal cycles of meltwater storage and drainage in the snowpack. Deployment in vertical networks, similar to what is conventionally done in thermistor arrays, allows water fluxes to be estimated, including both vertical drainage and local “source/sink” effects associated with internal refreezing.
To our knowledge, this is the first application of TDR to track meltwater percolation and drainage in the supraglacial snowpack. Continuous measurements have been made in seasonal snowpacks using upward-looking radar (e.g., Heilig et al., 2009, 2015; Mitterer et al., 2011b; Schmid et al., 2014) and impedance cables (Mitterer et al., 2011a), and numerous studies have used point-sampling methods to infer dielectric permittivity, such as Denoth meters or snow forks (e.g., Pfeffer and Humphrey, 1998; Techel and Pielmeier, 2011). TDR offers the possibility to record continuously at multiple levels in the snowpack, but TDR has not been thoroughly explored in snow or glacier hydrology. Schneebeli et al. (1998) note the potential of TDR probes for quantification of snow liquid water content, but the difficulty in calibrating against known water content in the field. This is a challenge, given the sensitivity and uncertainty in the mixing models, but there is a high sensitivity to temporal and spatial variations in snow water content, which should be possible to exploit.
This method holds promise for further study in different glacial environments, but several improvements are possible from our exploratory work at Haig Glacier. Melt-out of the sensors makes it difficult to get continuous data on temperate glaciers, but this will be less of a problem in colder environments, such as polar regions. For work on temperate glaciers, with high summer melt rates, we recommend additional sensors that go deeper into the snowpack, to permit a longer study window for each deployment. The Campbell Scientific setup permits 8 TDR probes per multiplexer, so 8 or 16 probes could be installed at a site. A spacing of 20 cm would be reasonable, to track the meltwater to a depth up of to 3 m. It would be insightful to excavate into the underlying firn, to instrument across the snow-firn transition.
We also suggest that a second pit be instrumented proximal to the first, e.g., 10 m away, to provide a replicate under similar snowpack and meteorological conditions. Horizontal snowpack and hydrological variability are known to be high in polar environments (e.g., Rennermalm et al., 2013), and are also documented in temperate alpine snowpacks (e.g., Techel and Pielmeier, 2011; Heilig et al., 2015). The supraglacial snow at our site is homogeneous in density and grain size in the summer months, with no evidence of preferential flow paths, but it is not clear how representative a single point is with respect to water content and wetting front propagation. Detailed spatial studies such as those of Techel and Pielmeier (2011) would be insightful, and might reveal a seasonal evolution of the spatial structure.
We also recommend a comparison of TDR-derived dielectric permittivity with inferences from high-frequency radar, particularly with upward-looking radar studies (Mitterer et al., 2011b; Schmid et al., 2014; Heilig et al., 2015). The two techniques appear complementary for tracking the wetting front propagation in space and time. This may also help to elucidate the most appropriate mixing model to convert dielectric permittivity to snow water content, which is something that remains unclear. The Looyenga (1965) mixing model is based on the geometry of spherically-packed water inclusions, and the expected bulk dielectric properties vary strongly with the shape of inclusions (Sihvola et al., 1985). The TDR field setup is intrinsically two-dimensional, with axially symmetric (i.e., cylindrical) electromagnetic fields operating over a vertical cross-section of the snow. For spherical water droplets of radius r in cross-section, the response can be expected to vary as 1/r2 rather than 1/r3, which may explain why we find better results with the mixing model of Birchak et al. (1974). The Birchak model can also be thought of as a volumetric average of the complex index of refraction, which relates to the wave speed (proportional to εs −1/2), so this approach seems logical. Nonetheless, the Looyenga mixing model is commonly applied in firn hydrology (e.g., Christianson et al., 2015), and has been recommended over the Birchak model on theoretical grounds (Sihvola et al., 1985) and in previous snow research (Niang et al., 2006). Results are very sensitive to the choice of mixing model, so further study is needed here.
Conclusions
We demonstrate that data-logging TDR instrumentation is able to monitor the temporal evolution of water content in a supraglacial snowpack. This has the potential to be a valuable tool to contribute to the growing interest in understanding and quantifying meltwater retention in glaciers and ice sheets. Vertical TDR arrays provide information about percolation velocities in snow, hydraulic conductivity, and internal refreezing. They can be deployed at multiple verticals, together with thermistor arrays, in a way that mimics numerical models of snow thermal and hydrological evolution (e.g., with 10 or 20-cm layers), providing direct data on snow temperature, water content, and water balance for model calibration and evaluation.
The diurnal cycle, water content, and drainage rates in our data affirm the ability of TDR measurements to capture small amounts of liquid water in snow, but more work is needed with in situ snow or firn sampled to find the best mixing model to convert measured dielectric permittivity to snow water content. Based on our estimates of overnight liquid water content in frozen and well-drained snowpacks, we estimate an uncertainty of about 2% in our estimates of water content, with a positive bias at low values of θw. This is based on the Birchak et al. (1974) mixing model; the Looyenga (1965) mixing model overestimates θw by ~4% in our data, and may not be well-suited to unsaturated snow.
Bearing these caveats on the mixing model in mind, we record liquid water contents from 0 to 12% in the supraglacial snowpack over the course of the summer, increasing from typical values of ~4% in the early melt season to ~10% in July and August. Meltwater refreezing in May occurred to a depth of about 35 cm, but we see no evidence of internal refreezing from June to August. The snowpack remained isothermal, but a thin refrozen surface crust developed on most nights. Liquid water retained in the pore spaces through capillary pressure may have refrozen over night near the snow surface, with the associated latent heat release keeping the snow at 0°C.
There are strong diurnal cycles in snow liquid water content throughout the summer, which we attribute to refreezing in May and efficient overnight drainage for the rest of the melt season. There is negligible meltwater storage on daily timescales; after initial wetting of the snowpack, all meltwater drains to depth. Drainage lags of 3–4 h are evident in the May snowpack over the upper 50 cm, decreasing to ~1 h in July. The effective hydraulic conductivity for the meltwater percolation is of order 10−6 m s−1.
The measurements over five different periods in summer 2015 inform a model of subsurface temperature evolution and meltwater drainage for the full summer. This provides initial estimates of meltwater retention and the importance of internal refreezing for this temperate alpine glacier. We conclude that meltwater retention in the seasonal snow is a negligible process when it comes to the glacier mass balance—no meltwater is retained in the supraglacial system. However, refreezing dose have a significant impact on meltwater runoff and summer mass balance by creating an effective “energy sink”; meltwater that refreezes overnight needs to thaw, such that energy is consumed to melt the same snow/ice more than once. We estimate that 85% of available melt energy was used to generate meltwater runoff (i.e., an efficiency of 85%). The remaining 15% is diverted to warming the snow/ice and thawing the refrozen meltwater. Re-melting accounts for about 9% of the positive net energy and snowpack warming consumes 6%. Models that neglect these processes will overestimate glacier runoff.
Future work is needed on several fronts. Spatial variability, deeper vertical structure, and firn layers need to be examined on mountain glaciers. The same processes need to be examined for colder alpine environments and in cold snow and firn in polar ice masses. The methods that we introduce should work well in these settings, but the importance of refreezing for glacier mass and energy balance can be expected to be much more significant.
Author Contributions
All authors listed, have made substantial, direct and intellectual contribution to the work, and approved it for publication.
Conflict of Interest Statement
The authors declare that the research was conducted in the absence of any commercial or financial relationships that could be construed as a potential conflict of interest.
Acknowledgments
The Haig Glacier study is supported by the Natural Sciences and Engineering Research Council (NSERC) of Canada. This manuscript is a contribution to the NSERC-funded Changing Cold Regions Network. We thank Rick Smith of the University of Calgary Weather Research Station for technical support. Mick Lack and Mike Norton of WinSport Canada kindly assist in our access to the Haig Glacier research site. We thank two reviewers for their insightful comments, which greatly improved this paper.
References
Birchak, J. R., Gardner, C. G., Hipp, J. E., and Victor, J. M. (1974). High dielectric constant microwave probes for sensing soil moisture. Proc. IEEE 62, 93–98. doi: 10.1109/PROC.1974.9388
Christianson, K., Kohler, J., Alley, R. B., Nuth, C., and Pelt, W. J. (2015). Dynamic perennial firn aquifer on an Arctic glacier. Geophys. Res. Lett. 42, 1418–1426. doi: 10.1002/2014GL062806
Colbeck, S. C. (1974). The capillary effects on water percolation in homogeneous snow. J. Glaciol. 13, 85–97.
Colbeck, S. C., and Anderson, E. (1982). The permeability of a melting snow cover. Water Resour. Res. 18, 904–908. doi: 10.1029/WR018i004p00904
Coléou, C., and Lesaffre, B. (1998). Irreducible water saturation in snow: experimental results in a cold laboratory. Ann. Glaciol. 26, 64–68.
Cuffey, K. M., and Paterson, W. S. B. (2010). The Physics of Glaciers, 4th Edn. Burlington, ON: Butterworth-Heinemann/Elsevier.
Denoth, A. (1994). An electronic device for long-term snow wetness recording. Ann. Glaciol. 19, 104–106.
Ebrahimi, S., and Marshall, S. J. (2016). Surface energy balance sensitivity to meteorological variability on Haig Glacier, Canadian Rocky Mountains. Cryosphere 10, 2799–2819. doi: 10.5194/tc-10-2799-2016
Fountain, A. G. (1996). Effect of snow and firn hydrology on the physical and chemical characteristics of glacial runoff. Hydrol. Process. 10, 509–521. doi: 10.1002/(SICI)1099-1085(199604)10:4<509::AID-HYP389>3.0.CO;2-3
Fountain, A. G., and Tangborn, W. V. (1985). The effect of glaciers on streamflow variations. Water Resour. Res. 21, 579–586. doi: 10.1029/WR021i004p00579
Fountain, A. G., and Walder, J. S. (1998). Water flow through temperate glaciers. Rev. Geophys. 36, 299–328. doi: 10.1029/97RG03579
Heilig, A., Mitterer, C., Schmid, L., Wever, N., Schweizer, J., Marshall, H.-P., et al. (2015). Seasonal and diurnal cycles of liquid water in snow—Measurements and modeling. J. Geophys. Res. Earth Surf. 120, 2139–2154. doi: 10.1002/2015jf003593
Heilig, A., Schneebeli, M., and Eisen, O. (2009). Upward-looking ground-penetrating radar for monitoring snowpack stratigraphy. Cold Reg. Sci. Technol. 59, 152–162. doi: 10.1016/j.coldregions.2009.07.008
Hirashima, H., Yamaguchi, S., Sato, A., and Lehning, M. (2010). Numerical modelling of liquid water movement through layered snow based on new measurements of the water retention curve. Cold Reg. Sci. Technol. 64, 94–103. doi: 10.1016/j.coldregions.2010.09.003
Huss, M. (2011). Present and future contribution of glacier storage change to runoff from macroscale drainage basins in Europe. Water Resour. Res. 47:W07511. doi: 10.1029/2010WR010299
Jansson, P., Hock, R., and Schneider, T. (2003). The concept of glacier storage: a review. J. Hydrol. 282, 116–129. doi: 10.1016/S0022-1694(03)00258-0
Jones, S. B., Wraith, J. M., and Or, D. (2002). Time Domain Reflectometry (TDR) measurement principles and applications. Hydrol. Process. 16, 141–153. doi: 10.1002/hyp.513
Jost, G., Moore, R. D., Menounos, B., and Wheate, R. (2012). Quantifying the contribution of glacier runoff to streamflow in the upper Columbia River Basin, Canada. Hydrol. Earth Syst. Sci. 16, 849–860. doi: 10.5194/hess-16-849-2012
Kawashima, K., Yamada, T., and Wakahama, G. (1993). Investigations of internal structure and transformational processes from firn to ice in a perennial snow patch. Ann. Glaciol. 18, 117–122.
Koenig, L. S., Miège, C., Forster, R. R., and Brucker, L. (2014). Initial in situ measurements of perennial meltwater storage in the Greenland firn aquifer. Geophys. Res. Lett. 41, 81–85. doi: 10.1002/2013GL058083
Ledieu, J., De Ridder, P., De Clerck, P., and Dautrebande, S. (1986). A method of measuring soil moisture by time-domain reflectometry. J. Hydrol. 88, 319–328. doi: 10.1016/0022-1694(86)90097-1
Looyenga, H. (1965). Dielectric constants of heterogeneous mixtures. Physica 31, 401–406. doi: 10.1016/0031-8914(65)90045-5
Macheret, Y., Moskalevsky, M. Y., and Vasilenko, E. V. (1993). Velocity of radio waves in glaciers as an indicator of their hydrothermal state, structure and regime. J. Glaciol. 39, 373–384.
Mark, B. G., Baraer, M., Fernandez, A., Immerzeel, W., Moore, R. D., and Weingartner, R. (2015). “Glaciers as water resources,” in The High Mountain Cryosphere, eds C. Huggel et al. (Cambridge: Cambridge University Press), 184–203.
Marshall, S. J. (2014). Meltwater run-off from Haig Glacier, Canadian Rocky Mountains, 2002–2013. Hydrol. Earth Syst. Sci. 18, 5181–5200. doi: 10.5194/hess-18-5181-2014
Marshall, S. J., White, E. C., Demuth, M. N., Bolch, T., Wheate, R., Menounos, B., et al. (2011). Glacier water resources on the eastern slopes of the Canadian Rocky Mountains. Can. Water Resour. J. 36, 109–134. doi: 10.4296/cwrj3602823
Mitterer, C., Heilig, A., Schweizer, J., and Eisen, O. (2011b). Upward-looking ground-penetrating radar for measuring wet-snow properties. Cold Reg. Sci. Technol. 69, 129–138. doi: 10.1016/j.coldregions.2011.06.003
Mitterer, C., Hirashima, H., and Schweizer, J. (2011a). Wet-snow instabilities: comparison of measured and modelled liquid water content and snow stratigraphy. Ann. Glaciol. 52, 201–208. doi: 10.3189/172756411797252077
Östling, M., and Hooke, R. L. (1986). Water storage in Storglaciären, Kebnekaise, Sweden. Geogr. Ann. Ser. A Phys. Geogr. 68, 279–290. doi: 10.2307/521521
Moore, R. D., Fleming, S. W., Menounos, B., Wheate, R., Fountain, A., Stahl, K., et al. (2009). Glacier change in western North America: influences on hydrology, geomorphic hazards and water quality. Hydrol. Process. 23, 42–61. doi: 10.1002/hyp.7162
Murray, T., Stuart, G. W., Fry, M., Gamble, N. H., and Crabtree, M. D. (2000). Englacial water distribution in a temperate glacier from surface and borehole radar velocity analysis. J. Glaciol. 46, 389–398. doi: 10.3189/172756500781833188
Niang, M., Bernier, M., Stacheder, M., Brandelik, A., and Van Bochove, E. (2006). Influence of snow temperature interpolation algorithm and dielectric mixing-model coefficient on density and liquid water content determination in a cold seasonal snow pack. Subsurf. Sensing Technol. Appl. 7, 1–22. doi: 10.1007/s11220-006-0020-9
Pfeffer, W. T., and Humphrey, N. F. (1998). Formation of ice layers by infiltration and refreezing of meltwater. Ann. Glaciol. 26, 83–91.
Pfeffer, W. T., Meier, M. F., and Illangasekare, T. H. (1991). Retention of Greenland runoff by refreezing: implications for projected future sea level change. J. Geophys. Res. 96, 22117–22124. doi: 10.1029/91JC02502
Reijmer, C. H., van den Broeke, M. R., Fettweis, X., Ettema, J., and Stap, L. B. (2012). Refreezing on the Greenland ice sheet: a comparison of parameterizations. Cryosphere 6, 743–762. doi: 10.5194/tc-6-743-2012
Rennermalm, A. K., Moustafa, S. E., Mioduszewski, J., Chu, V. W., Forster, R. R., Hagedorn, B., et al. (2013). Understanding Greenland ice sheet hydrology using an integrated multi-scale approach. Environ. Res. Lett. 8:015017. doi: 10.1088/1748-9326/8/1/015017
Schmid, L., Heilig, A., Mitterer, C., Schweizer, J., Maurer, H., Okorn, R., et al. (2014). Continuous snowpack monitoring using upward-looking ground-penetrating radar technology. J. Glaciol. 60, 509–525. doi: 10.3189/2014JoG13J084
Schneebeli, M., Coléou, C., Touvier, F., and Lesaffre, B. (1998). Measurement of density and wetness in snow using time-domain reflectometry. Ann. Glaciol. 26, 69–72.
Schneider, T. (2000). Hydrological processes in the wet-snow zone of glacier: a review. Z. Gletscherkd. Glazialgeol. 36, 89–105.
Schneider, T., and Jansson, P. (2004). Internal accumulation in firn and its significance for the mass balance of Storglaciären, Sweden. J. Glaciol. 50, 25–34. doi: 10.3189/172756504781830277
Shea, J. M., Anslow, F. S., and Marshall, S. J. (2005). Hydrometeorological relationships on Haig Glacier, Alberta, Canada. Ann. Glaciol. 40, 52–60. doi: 10.3189/172756405781813465
Sihvola, A., Nyfors, E., and Tiuri, M. (1985). Mixing formula and experimental results for the dielectric constant of snow. J. Glaciol. 31, 163–170.
Soruco, A., Vincent, C., Rabatel, A., Francou, B., Thibert, E., Sicart, J. E., et al. (2015). Contribution of glacier runoff to water resources of La Paz city, Bolivia (16 S). Ann. Glaciol. 56, 147–154. doi: 10.3189/2015AoG70A001
Stein, J., Laberge, G., and Lévesque, D. (1997). Monitoring the dry density and the liquid water content of snow using time domain reflectometry (TDR). Cold Reg. Sci. Technol. 25, 123–136. doi: 10.1016/S0165-232X(96)00022-5
Techel, F., and Pielmeier, C. (2011). Point observations of liquid water content in wet snow –investigating methodical, spatial and temporal aspects. Cryosphere 5, 405–418. doi: 10.5194/tc-5-405-2011
Tiuri, M., Sihvola, A., Nyfors, E., and Hallikaiken, M. (1984). The complex dielectric constant of snow at microwave frequencies. IEEE J. Oceanic Eng. 9, 377–382. doi: 10.1109/JOE.1984.1145645
Topp, G. C., and Davis, J. L. (1985). Measurement of soil water content using time-domain reflectometry (TDR): a field evaluation. Soil Sci. Soc. Am. J. 49, 19–24. doi: 10.2136/sssaj1985.03615995004900010003x
Topp, G. C., Davis, J. L., and Annan, A. P. (1980). Electromagnetic determination of soil water content: measurements in coaxial transmission lines. Water Resour. Res. 16, 574–582. doi: 10.1029/WR016i003p00574
Van Pelt, W. J. J., Oerlemans, J., Reijmer, C. H., Pohjola, V. A., Pettersson, R., and van Angelen, J. H. (2012). Simulating melt, runoff and refreezing on Nordenskiöldbreen, Svalbard, using a coupled snow and energy balance model. Cryosphere 6, 641–659. doi: 10.5194/tc-6-641-2012
Van Pelt, W. J. J., Pettersson, R., Pohjola, V. A., Marchenko, S., Claremar, B., and Oerlemans, J. (2014). Inverse estimation of snow accumulation along a radar transect on Nordenskiöldbreen, Svalbard. J. Geophys. Res. Earth Surf. 119, 816–835. doi: 10.1002/2013JF003040
Wever, N., Schmid, L., Heilig, A., Eisen, O., Fierz, C., and Lehning, M. (2015). Verification of the multi-layer SNOWPACK model with different water transport schemes. Cryosphere 9, 2271–2293. doi: 10.5194/tc-9-2271-2015
Keywords: meltwater retention, TDR, temperate glacier, hydraulic conductivity, snow water content, glacier hydrology, canadian rockies, refreezing
Citation: Samimi S and Marshall SJ (2017) Diurnal Cycles of Meltwater Percolation, Refreezing, and Drainage in the Supraglacial Snowpack of Haig Glacier, Canadian Rocky Mountains. Front. Earth Sci. 5:6. doi: 10.3389/feart.2017.00006
Received: 22 September 2016; Accepted: 18 January 2017;
Published: 07 February 2017.
Edited by:
Jason Eric Box, Geological Survey of Denmark and Greenland, DenmarkReviewed by:
Qiao Liu, Institute of Mountain Hazards and Environment (CAS), ChinaWard Van Pelt, Uppsala University, Sweden
Copyright © 2017 Samimi and Marshall. This is an open-access article distributed under the terms of the Creative Commons Attribution License (CC BY). The use, distribution or reproduction in other forums is permitted, provided the original author(s) or licensor are credited and that the original publication in this journal is cited, in accordance with accepted academic practice. No use, distribution or reproduction is permitted which does not comply with these terms.
*Correspondence: Samira Samimi, samira.samimi@ucalgary.ca