Circumpolar Mapping of Ground-Fast Lake Ice
 Annett Bartsch1,2*
  Georg Pointner1,2
  Marina O. Leibman3,4 Yuri A. Dvornikov3 Artem V. Khomutov3,4 Anna M. Trofaier5
- 1Zentralanstalt für Meteorologie und Geodynamik, Vienna, Austria
- 2Department of Geodesy and Geoinformation, Vienna University of Technology, Vienna, Austria
- 3Academic Department of Cryosophy, Earth Cryosphere Institute, Russian Academy of Sciences, Tyumen, Russia
- 4Academic Department of Cryosophy, Tyumen State University, Tyumen, Russia
- 5Svalbard Integrated Arctic Earth Observing System, University Centre in Svalbard, Longyearbyen, Norway
Shallow lakes are common across the entire Arctic. They play an important role as methane sources and wildlife habitats, and they are also associated with thermokarst processes which are characteristic of permafrost environments. Many lakes freeze to the ground along their rims and often over the entire extent during winter time. Knowledge on the spatial patterns of ground-fast and floating ice is important as it relates to methane release, talik formation and hydrological processes, but no circumpolar account of this phenomenon is currently available. Previous studies have shown that ground-fast ice can easily be detected using C-band Synthetic Aperture Radar (SAR) backscatter intensity data acquired from satellites. A major challenge is that backscatter intensity varies across the satellite scenes due to incidence angle effects. Circumpolar application therefore requires the inclusion of incidence angle dependencies into the detection algorithm. An approach using ENVISAT ASAR Wide Swath data (approximately 120 m spatial resolution) has therefore been developed supported by bathymetric measurements for lakes in Siberia. This approach was then further applied across the entire Arctic for late winter 2008. Ground-fast ice fraction has been derived for (1) two million lake objects larger than 0.025 km2 (post-processed GlobeLand30), (2) a 50 × 50 km grid and (3) within certain zones relevant for climate studies (permafrost type, last glacial maximum, Yedoma). Especially lakes smaller than approximately 0.1 km2 may freeze completely to the ground. The proportion of ground-fast ice increases with increasing soil organic carbon content in the proximity of the lakes. This underlines the importance of such lakes for emission studies and the need to map the occurrence of ground-fast lake ice. Clusters of variable fractions of ground-fast ice occur especially in Yedoma regions of Eastern Siberia and Alaska. This reflects the nature of thaw lake dynamics. Analyses of lake depth measurements from several sites suggest that the used method yields the potential to utilize ground-fast lake ice information over larger areas with respect to landscape development, but results need to be treated with care, specifically for larger lakes and along river courses.
Introduction
Shallow lakes are common features across the entire Arctic. They occur for example on the Alaskan North Slope (Jeffries et al., 1994), the Northwest Territories in Canada (Burn, 2002) and across Siberia (Lantuit, 2007; Morgenstern et al., 2013; Dvornikov et al., 2016). They are mostly associated with permafrost and especially thermokarst phenomena (thaw lakes) and develop at time scales of thousands of years growing in width and depth. Shallowness depends on age and ground ice conditions (West and Plug, 2008). Ground-fast ice is associated with shallow water (Grunblatt and Atwood, 2014). Lakes freeze to varying extent to the ground depending on their depth and temperature conditions during winter time. Ice thickness reaches its maximum in April with values of about 1–1.5 m on the Alaskan North Slope, where the mean annual air temperature (MAAT) was between −10° and −11°C in recent years (Surdu et al., 2015). Burn (2005) reported up to 2.1 m near Illisarvik, which has a MAAT of about −11.2°C and less than 1 m near Inuvik with MAAT of about −8.8°C. As a result of recent climate change, changes in lake ice freezing depth have been observed on the Alaskan North Slope over the past decades, where a steady decline in ground-fast ice area is identified (Surdu et al., 2014). This leads to a decrease in ground-fast (or also called bottom-fast) lake ice area. Water depth is also one of the explaining factors for variation in methane fluxes across the Arctic (Wik et al., 2016). It is thus of interest to emission studies. As methane is released during winter from the non-frozen part of the lakes it is important to identify the extent of shallow water areas (Wik et al., 2011). Furthermore, lake ice properties impact hydrological processes. Spring melt-out dynamics differ between ground-fast ice and floating ice lakes (Arp et al., 2015). These differences in ice-out timing result in differences in evaporative losses across the landscape. The presence of unfrozen parts of the lake bottom (taliks) also determines the connection with the subpermafrost groundwater system (Burn, 2005).
Smith et al. (2007) have analyzed the density and fraction of lakes across the Arctic with respect to permafrost types, peatlands and the extent of the last glacial maximum based on the Global Lakes and Wetlands Database (GLWD) by Lehner and Döll (2004). It was found that lake abundance does not appear to decline in lock-step with permafrost fraction. The highest lake density was found in peatlands of the discontinuous and sporadic permafrost zone (Smith et al., 2007). The lake fraction is higher in permafrost peatland areas than in non-peatland areas. Lake occurrence as identified in the GLWD is in general higher in previously glaciated areas, giving an indication of lake history (Smith et al., 2007). An extension of such an analysis to depth properties may provide further insight into their development and relevance with respect to the discussion of Arctic lakes and wetlands under continued climate warming and permafrost thaw. The GLWD, however, only covers lakes larger than 10 ha. This leads to significant underestimation of lakes in the Arctic (Bartsch et al., 2008). Recently, Landsat based products (30 m) have been used instead (Paltan et al., 2015). Soil organic carbon content is also of relevance in this context. Methane emissions are high for thermokarst lakes in areas with carbon rich permafrost (Wik et al., 2016). The Northern Circumpolar Soil Carbon Database (NCSCD, Hugelius et al., 2013) allows for a more detailed investigation of soil properties than a separation between peatland and non-peatland area. The database includes, among many other parameters, estimates of soil organic carbon within the top 3 m of the ground.
A baseline dataset of ground-fast ice for the entire Arctic is needed to identify target areas for the assessment of impacts of climate change. The suitability of satellite data for mapping ground-fast ice has been demonstrated by several studies. While initial studies on mapping ground-fast ice at high latitudes were undertaken with airborne measurements in the 1970s (Surdu et al., 2014), investigations based on satellite data were first enabled with the availability of C-Band ERS (European Remote Sensing satellite) data in the 1990s (e.g., Jeffries et al., 1994; Duguay et al., 2002). Studies have been published for the North Slope of Alaska (Wakabayashi et al., 1993; Jeffries et al., 1994; Arp et al., 2011, 2012; Engram et al., 2013; Surdu et al., 2014; Arp et al., 2015), Seward peninsula in Alaska (Engram et al., 2013), Manitoba (Duguay et al., 2002) and the MacKenzie Delta (Hirose et al., 2008; Yue et al., 2013) in Canada. Furthermore, the application of X- and L-band measurements for the detection of ground-fast ice has also been demonstrated over the North Slope (Engram et al., 2013; Jones et al., 2013).
The mapping principle is based on distinctive scattering behavior of microwave radiation. When ice is grounded, dielectric contrasts are reduced compared to the scattering at the ice water boundary (Duguay et al., 2002). Backscatter intensity is low due to absorption. This leads to a large difference between floating and ground-fast ice. The intensity of the return signal is higher for floating ice. Several studies have investigated the role of bubbles in the signal interaction. It has been postulated that backscatter of floating ice increases with the amount of bubbles in the ice. Scattering at especially vertically oriented, tubular bubbles and then off the ice/water interface, determine the magnitude of the returning signal (Jeffries et al., 2013). Tiny spherical bubbles can also increase backscatter (Duguay et al., 2002). At the same time a decrease in backscatter for increasing incidence angles is apparent for HH (horizontally sent and horizontally received) polarization at C-band. Duguay et al. (2002) suggest that backscatter differences between steep and shallow incidence angles increase as the amount of bubbles decreases. Variations of up to 7 dB for floating ice have been reported in C-band (HH) at comparably high incidence angles of 31°–37° (Walter et al., 2008). Duguay et al. (2002) find that backscatter intensity from floating ice measured at shallower incidence angles can be similar to that observed from ground-fast ice where only small amounts of bubbles are present. This may relate to a smooth ice water boundary taking into account findings of Atwood et al. (2015). Atwood et al. (2015) have used a coherent numerical model to test the impact of bubbles upon the lake ice backscatter. It was shown that the return signal represents roughness of the ice water boundary rather than bubbles within the ice.
Due to the relatively high difference in backscatter between ground-fast and floating ice, samples are commonly selected visually for classification purposes (e.g., Hirose et al., 2008) but bathymetric measurements are considered in support (e.g., Arp et al., 2015). Backscatter intensity in the surrounding of the lakes can be similar to lake ice. It is therefore common to mask them based on lake maps derived from summer acquisitions from optical or Synthetic Aperture Radar (SAR) data before classification (Grunblatt and Atwood, 2014). Landsat provides a relatively high spatial resolution for large area mapping and is suited to account for lakes across the entire Arctic (Paltan et al., 2015).
Backscatter intensity decreases considerably when the surface starts to melt (Mätzler et al., 1984). Mid winter melt events are common in many regions across the Arctic (Bartsch, 2010). Scenes which have been acquired under melting conditions need to therefore be excluded in order to avoid misclassification. Backscatter of floating ice at C-band may also vary across large lakes due to e.g., movements (fracturing at early ice growth stages) and low amount of bubbles (Jeffries et al., 2013). Such lakes need to therefore be excluded as well.
Applications of SAR data have so far been limited to specific regions due to data availability, local to regional interests in this phenomenon as well as technical challenges regarding acquisition geometry and processing demand. The usable acquisition period is rather short. It corresponds to late winter when maximum ice thickness is reached (Duguay et al., 2002). SAR data are not acquired in a consistent manner globally and across the Arctic (Bartsch et al., 2009). ENVISAT Advanced SAR (ASAR) data in Wide Swath (ASAR WS) mode were however acquired over large parts of the Arctic area as there was a high demand for these data by sea ice monitoring services. Scenes often extend to the south, also covering land areas (Bartsch et al., 2012). ASAR WS data therefore provide almost circumpolar coverage of the lake rich regions for some years. These scenes have been acquired in C-band (approximately 5.6 cm wavelength) and HH polarizations. Backscatter intensity varies strongly for floating ice in HH with respect to incidence angle (Atwood et al., 2015). This needs to be considered for large area operational classifications and has not been addressed in previous studies. The common approach is to only consider acquisitions with similar incidence angles over the study site (e.g., Hirose et al., 2008).
In order to get a circumpolar coverage, data from different incidence angles must be combined. A new approach, which takes incidence angle effects into account and is applicable to all acquisitions, therefore needs to be developed. The relationship between incidence angle and backscatter differs by surface type (Henderson and Lewis, 1998). Consequently, a location specific normalization is required, which can be applied when multiple acquisitions from different overlapping orbits, and thus points in time, are used (Wagner et al., 2008). This is, however, constrained by data availability. Only a few places such as the Yamal Peninsula are sufficiently covered by C-band data (Bartsch et al., 2012). An alternative is the normalization over the respective satellite image. Lakes may only cover fractions of such scenes (Bartsch et al., 2008). This means that most of the land surface types used in the normalization may have differing behavior toward incidence angles than lake ice. The scene based approach therefore leads to variations from scene to scene, which results in the need to classify each image separately, as for example carried out by Grunblatt and Atwood (2014) for the Alaskan North Slope. Training data for supervised classification within each image would be required.
An approach that allows for circumpolar mapping by solving the issue of incidence angle variation between and across acquisitions is presented in this study. It is developed over the Yamal Peninsula, Siberia, strengthened by complementing it with bathymetric measurements and by taking into account that bubbling is common for lakes in this area (observation by authors). The method is eventually applied to the entire Arctic and results compared to lake depth data that have been taken from the literature. The purpose of this study is to provide an account for shallow lakes, establishing a baseline dataset for future climate change impact studies across the entire Arctic. This dataset enables the assessment of lake properties and associated characteristics such as methane emission and thermokarst processes. Some basic statistics are calculated, partially resembling the analyses of lake properties by Smith et al. (2007).
Materials and Methods
Satellite Data
The Advanced Synthetic Aperture Radar (ASAR) data serve as source for the ground-fast ice classification. The ASAR instrument was mounted on the ENVISAT satellite platform and was operated by the European Space Agency (ESA) from 2002 until its breakdown in April 2012. The C-band sensor took measurements at a center frequency of 5.331 GHz and could be run in different acquisition modes with varying spatial and temporal resolutions and varying swath widths. In Wide Swath (WS) mode the spatial resolution is approximately 120 m (Closa et al., 2003) and the swath width is 400 km. Incidence angles ranged from 15° to 45°.
Auxiliary data are required to ensure that only frozen conditions are analyzed as the scattering mechanism changes when ice and snow start to melt. This information can also be obtained from C-band data, but requires sufficient temporal sampling (Park et al., 2011). This can only be achieved with coarser resolution scatterometer data. The Advanced Scatterometer (ASCAT) onboard the MetOp-A and MetOp-B satellite platforms is a scatterometer operating at a frequency of 5.255 GHz (C-band). ASCAT data are suitable for detecting freeze/thaw states globally (Naeimi et al., 2012) due to the operational nature of these missions and thus globally continuous records. Datasets of surface status are readily available for the Arctic. The ASCAT Surface State Flag (SSF) product by Paulik et al. (2014) provides freeze/thaw information for the Arctic at a temporal sampling of 1–2 days and 25 km resolution. It is used to constrain the analysis period to frozen surface conditions across the entire Arctic.
Bathymetric Measurements
Bathymetric measurement (surveyed in 2012, 2014, and 2015) are available for several lakes in central Yamal (Dvornikov, 2016; Dvornikov et al., 2016). Seven of these lakes are of sufficient size (with respect to ASAR WS spatial resolution) for comparison with the ASAR WS product. One of the lakes (labeled LK-003, location see Figure 1, area 1.08 km2) is characterized by a very shallow shelf area wider than two pixels of ASAR WS. This lake has been surveyed during summer 2012 in order to produce a detailed map of the lake bottom. The lakes on central Yamal are formed within alluvial-lacustrine-marine plains and terraces (Leibman et al., 2015). Mean Annual Air Temperature (MAAT) at a meteorological station at 100 km distance, located on the coast, is about −8°C. Temporary measurements have indicated the representativeness of this station for the central Yamal study area (Leibman et al., 2015). Freezing index (−3,000 to −3,200 for 2012–2015, average −3,457 since 1966) and thawing index (+850 for 2012–2015, average +646 since 1966) values are similar to those at the Alaskan North Slope (Frauenfeld et al., 2007), resulting in similar freezing depth of the lakes in the order of 1.5 m. Thickness above 2 m was observed in the Canadian Arctic, but at the same time much lower MAAT (−11°C) (Burn, 2002) and lower freezing index (Frauenfeld et al., 2007) were detected. Here, measurements from lake LK-003 are used for assessment of the threshold function for ground-fast ice delineation.
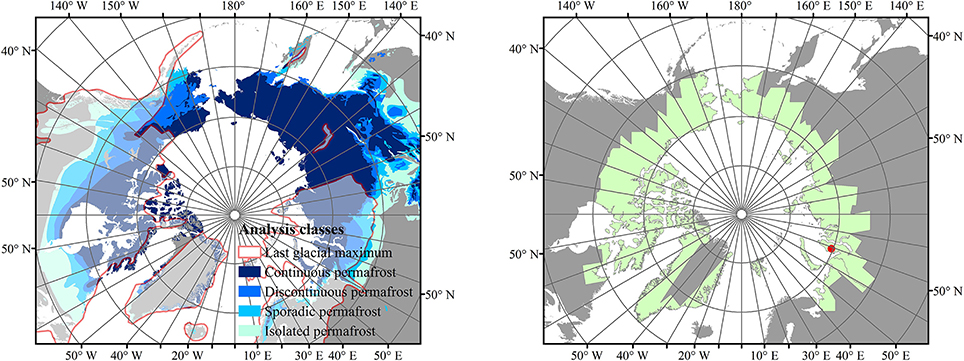
Figure 1. Extent of permafrost classes (Brown et al., 1998) and last glacial maximum (Ray and Adams, 2001) (Left), selected ENVISAT ASAR WS scenes April 2008 and location of lake LK-003 (see Figure 2) (Right).
The results were assessed using lake characteristics (lake depth and surface area) from several sites across the Arctic (see Table 1). Most measurements are available from the Alaskan North Slope (Hinkel, 2010, 2016). Thaw lakes have formed here in ice rich, glacio-marine silty sediments (Arp et al., 2011). This region has been intensively studied for ground-fast ice detection from SAR (Wakabayashi et al., 1993; Jeffries et al., 1994; Arp et al., 2011, 2012, 2015; Engram et al., 2013; Surdu et al., 2014). The lakes are located on the inner and outer coastal plain, representing different ages. A transect of lakes on Richards Island, which is located north of the Mackenzie Delta, has been surveyed by Burn (2002). They are underlain by glacial tills, eolian sands and glaciofluvial gravels. They can also be associated with different physiographic subdivisions. A few measurements are also available from different units (terraces) of the Lena Delta in Siberia (Lantuit, 2007; Morgenstern et al., 2013). The lakes on the central Yamal peninsula have a much larger maximum depth than those in the other regions where records are available. They can be deeper than 15 m with a hole-like feature. The formation of deep holes is different to the common thermokarst processes and their transformation into lakes has recently been reported in this region (Kizyakov et al., 2015).
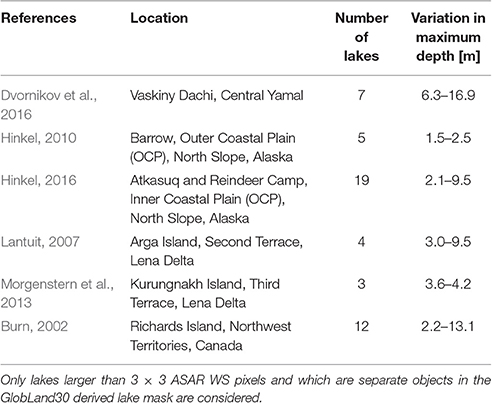
Table 1. Sources and characteristics of bathymetric (maximum lake depth) measurements.
Land Cover
The 30 m Global Land Cover (GlobeLand30) dataset of the National Geomatics Center of China (NGCC) was obtained from http://www.globallandcover.com/GLC30Download/. It constitutes the first global land cover dataset at a spatial resolution of 30 m. The dataset was derived by NGCC applying an advanced classification algorithm on Landsat Thematic Mapper (TM), Landsat Enhanced Thematic Mapper+ (ETM+) and Chinese Environmental Disaster Alleviation Satellite (HJ-1) multispectral images. The satellite data used for the land cover classification were mainly acquired over vegetation growing seasons from 2009 to 2011. According to the product description the overall positional accuracy is 75 m and the classification accuracy of the water body class is 92.09%. It is used for the masking of lakes in this study.
Boundaries of Selected Landscape Units
The Northern Circumpolar Soil Carbon Database (NCSCD) (Hugelius et al., 2013) is a polygon database containing soil information for all permafrost affected areas in the Northern Hemisphere. It was created by combining national and regional soil maps, and linking these soil maps to pedon data from field observations. It provides information on soil organic carbon content (SOCC) for different depth ranges. The SOCC values can range from zero to more than 100 kg m−3. SOCC values are used to analyze ground-fast ice patterns with different SOCC classes.
The results are interpreted considering three different sets of landscape boundaries: The Permafrost extent classification by Brown et al. (1998), the extent of the last glacial maximum (LGM) by Ray and Adams (2001) as used in Smith et al. (2007) (Figure 1), as well as the borders between Yedoma and non-Yedoma regions (Strauss et al., 2016). Yedoma regions are a subcategory of the area outside of the LGM boundary. They were unglaciated during the last glaciation. Soil carbon could therefore accumulate together with ice lenses that form by segregation (Strauss et al., 2013). These ice lenses promote thermokarst processes, which are therefore common phenomena in these areas.
Methodology
The ASAR WS scenes were used to derive the floating and ground-fast ice fraction of lakes with almost circumpolar coverage for the month April, in which the peak of frozen lake ice is assumed (Surdu et al., 2014). In order to achieve the maximum possible extent for mapping the lakes, the total coverage and distribution of ASAR scenes in April of each year during ENVISAT's mission duration (2002–2012) was analyzed. It was established that April 2008 had the highest total number of scenes and also the largest total coverage of all years. This year was therefore chosen for this study.
In order to minimize errors in the classification due to the presence of wet snow on top of the frozen lakes, the ASAR scenes were compared to the ASCAT surface status data and only scenes with no presence of melting snow were used for further analysis. Consequently 51 ASAR scenes for April 2008 with the optimum extent (Figure 1) were selected as main input for the ground-fast lake ice classification.
Subsets (excluding oceans) were taken from these selected 51 ASAR scenes. The subsets have been radiometrically calibrated and orthorectified using the Next ESA SAR Toolbox (NEST). The images were resampled to the commonly used nominal resolution for this mode of 75 m, and the output backscatter coefficient σ0 images were converted into units of decibels (dB). In addition, the projected local incidence angle was computed for each scene for further processing.
Samples were taken across an entire scene over the Yamal peninsula in western Siberia for ground-fast ice and floating ice classes, in order to determine the incidence angle dependent classification threshold. Ground-fast ice and floating ice was discriminated visually, which is a common procedure for this type of study (Atwood et al., 2015).
The bathymetric measurements of lake LK-003 was used to justify the manually selected samples. A Chartplotter Humminbird 788 cxi with internal GPS was used to collect both distances between sonar and lake bottom and position coordinates. The readings were taken along several profiles for the lake and then were filtered with 5 s and converted to ASCII format. In total, 1,652 points were recorded for the lake. A bathymetric map was produced by interpolation of the data (Figure 2). Two regions were separated from Lake LK-003. The first area represents depths smaller than 1 m, where it can be assumed that only ground-fast lake ice is present in April. The second area represents depths larger than 1.5 m, where mostly floating ice is assumed to be present (Figure 2). This leaves a buffer area which is required due to the unknown exact ice depth as well as potential positional inaccuracies in the satellite data (see also discussion on this approach in Grunblatt and Atwood, 2014). From these regions, samples were taken from additional 27 ASAR WS scenes acquired from different but overlapping orbits in April 2008 with their respective incidence angles. Only a limited range of incidence angles is available for a single scene over the lake area, but the 27 images represent the variations across almost the entire swath (ASAR WS incidence angle range). These samples were used to obtain a separate empirical threshold function in order to assess the results from the samples taken manually.
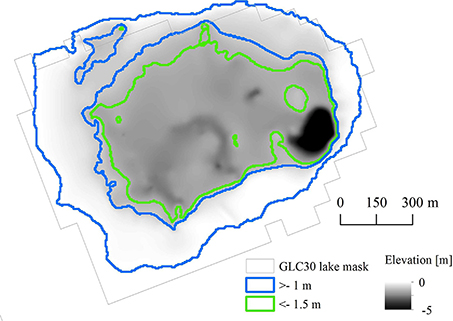
Figure 2. Bathymetric map of lake LK-003 on central Yamal, extent of depth classes and the Landsat based lake extent mask. For location see Figure 1.
The dependency of σ0 on the local projected incidence angle was analyzed for each of the sample classes. A third degree polynomial function was fit to both classes and a common threshold function was determined by averaging the two sample functions to distinguish between ground-fast and floating ice at different incidence angles (Figures 3, 4). This threshold function was then used to classify each pixel as floating or ground-fast ice depending on σ0 and the projected local incidence angle values. A mosaic was produced from the classified scenes, where the topmost scene is the latest (maximum freezing stage).
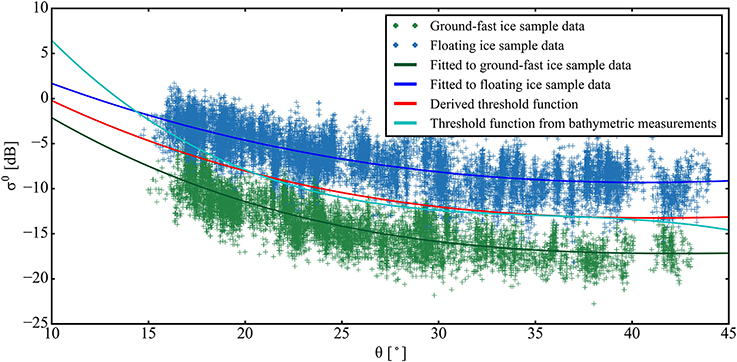
Figure 3. Backscatter intensity σ0 and local incidence angle Θ° for floating and ground-fast lake ice from samples taken from one scene over the Yamal peninsula. Threshold functions determined from the single scene (red) and from 25 scenes over the reference lake (light blue, see also Figure 4) are shown.
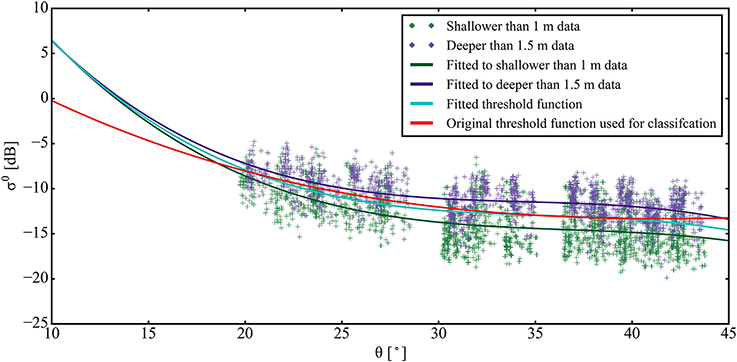
Figure 4. Backscatter intensity σ0 and local incidence angle Θ° for floating and ground-fast lake ice from samples taken from 25 scenes over the reference lake (see Figure 2). Threshold functions determined from the single scene (red, see Figure 3) and from the 25 scenes over the reference lake (light blue) are shown.
The GlobLand30 land cover map was post-processed in order to obtain a lake mask. Reclassification was performed, so that only the water body class was extracted from the GlobeLand30 dataset and converted into vector format. Large rivers and bays were removed manually from the dataset. Large lakes like the Great Slave Lake, Great Bear Lake and lakes located in the proximity of the Putorana Plateau were removed from the dataset as well. Those are reservoirs or glacially formed, comparably deep lakes, which show partially lower backscatter intensity for floating ice than thaw lakes. An example is shown in Figure 5.
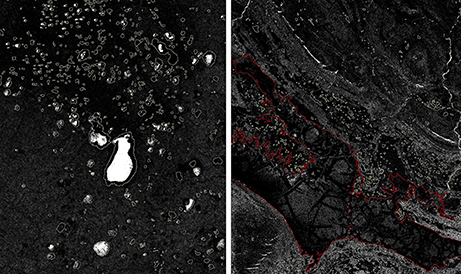
Figure 5. Examples of backscatter intensity images overlain by the applied lake mask (yellow) and excluded lake (red). Left: lakes SW of the Lena Delta, Siberia. Dark rims correspond to ground-fast ice, bright centres to floating ice. Right: Chantaika-reservoir west of the Putorana-Plateau. A pattern of fractioning (bright areas) as well as low backscatter return due to low bubble amount is visible.
In order to consider the positional accuracy of the land cover dataset and resolution of ASAR WS data, lakes with an area smaller than 25,000 m2 were also removed from the lake dataset. The final vector lake polygon dataset represents the lake mask containing all lake features for which the coverage of floating and ground-fast lake ice was classified using the empirically derived threshold function. It contains about two Mio objects covering in total approximately 0.67 Mio km2. Zonal statistics were calculated to obtain the percentage of ground-fast and floating lake ice for each of the lake polygons. A lake is considered as one that partially freezes to the ground when more than one pixel has been mapped as ground-fast, while it is determined as completely frozen when 95% is ground-fast. This accounts for spatial inaccuracies of the lake mask (compare Figure 2). Especially the inclusion of land area in the analyses may increase the floating ice proportion due to the comparably high backscatter of the surroundings.
The results were assessed using lake depth measurements available from the studies listed in Table 1. The fraction of ground-fast ice was then compared to maximum lake depth as well as lake area as available from the GlobLand30 mask. Only lakes which are larger than nine ASAR WS pixels and are distinct objects in the mask were considered.
Statistics were calculated in addition on a raster of 50 × 50 km, in order to visualize the circumpolar classification results and view the total distributions of the two lake ice types over different regions. This grid size also corresponds to a common cell size for regional climate models.
In order to analyse the results for the whole circumpolar region, zonal statistics were calculated for SOC content classes with respect to the different landscape units (Yedoma, LGM, permafrost extent). SOC content values for 0–300 cm depth were extracted from the NCSCD (Hugelius et al., 2013) and assigned to each lake. Different properties, such as number of lakes or average fraction of ground-fast ice area per lake were assessed for these classes. Furthermore, frequency-size distributions of lakes with different fractions of ground-fast ice were analyzed.
Results
The first part of the results section deals with the new retrieval method, which is supported by the analyses of two different ways for sample collection. The second part describes the comparison to in situ measurements in order to evaluate this approach (Yamal bathymetric records) and to provide a basis for evaluating the applicability of the results (comparison to lake depth across several sites in the Arctic). The derived circumpolar dataset of ground-fast lake ice fraction is presented for a defined grid, for single lake objects and within specific landscape units.
Retrieval Function
The obtained threshold functions from the visual sample, which was collected across a scene (Figure 3), and the bathymetric classification using multiple acquisitions (Figure 4) show similar values for incidence angles between 20° and 40°. There are deviations below and above these values due to limited availability of samples from overlapping orbits for lake LK-003. There is little variation of backscatter with incidence angle for values larger than 30°. The backscatter difference between floating and ground-fast lake ice is smaller for low incidence angles. The difference between ground-fast and floating ice is smaller for the LK-003 sample. Values range from 2 to 3 dB compared to 7 to 8 dB from the visual sample. The obtained threshold functions are, however, similar to each other.
Comparison to in situ Records
A certain ground-fast fraction can be recorded for all investigated sites where in situ measurements are available (Figure 6). A frozen fraction of 100% is obtained in two cases, both lakes are very shallow and are located on the Alaskan North slope where complete freeze up is common (e.g., Surdu et al., 2014). Lakes with a maximum depth of more than 10 m have a considerable ground-fast ice fraction with values larger than 20%. Lakes shallower than 4 m have a fraction from 5 to 100%. Different regions have distinct characteristics. Arga Island (Lena Delta second terrace) and Reindeer Camp (North Slope Inner Coastal Plain) have similar ground-fast ice fractions, which are low (mostly less than 20%) compared to the other regions. Barrow and Atkasuq, although on different plains, show similar patterns. There is a tendency that ground-fast ice fraction increases with increasing depth in areas with deep lakes (more than 4 m) such as Richards Island and specifically central Yamal. The samples from the region with the aligned lakes on Richards Island have similar depth but show large differences in ground-fast ice fraction. The “outlier,” the lake with the very high value of more than 90%, is actually located at the border to a different physiographic subdivision, the “Tununuk low hills.” There seems to be no general relationship between lake size and ground-fast ice fraction.
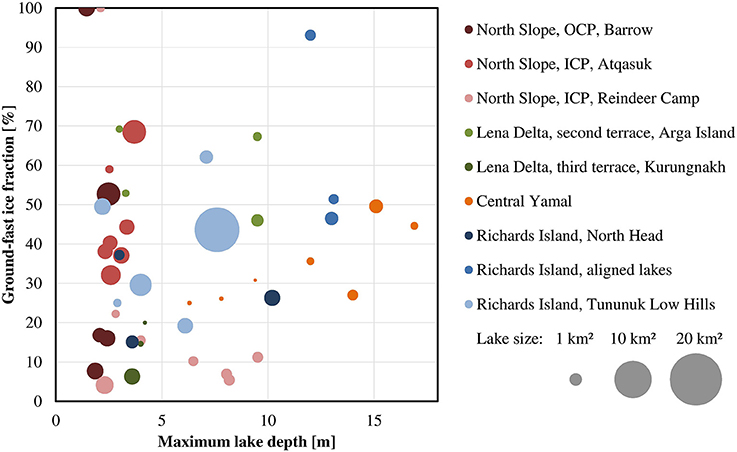
Figure 6. ASAR WS derived ground-fast ice fraction in % vs. maximum lake depth (sources: Burn, 2002; Lantuit, 2007; Hinkel, 2010, 2016; Morgenstern et al., 2013; Dvornikov et al., 2016). Circle size represents lake area of the lake mask from GlobLand30. Maximum is 13.84 km2, a lake on Richards Island which represents at least two merged lakes.
LK-003 on Yamal has about 50% ground-fast ice fraction, 45% of the lake is shallower than 1 m. In general, lakes on Yamal are found to have a ground-fast ice fraction higher than 20% (Figure 7). For three of the seven lakes (including LK-003), the derived fraction agrees (±5%) with the corresponding area where water depth is shallower than 1 m. For the remaining lakes, there is moderately better agreement with the −1.5 m depth area.
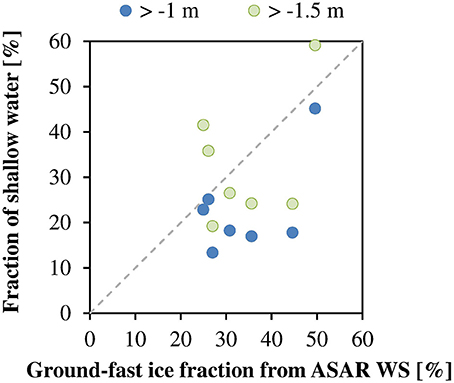
Figure 7. ASAR WS derived ground-fast ice fraction vs. depth class fractions from bathymetric data (less than 1 m depth in blue, less than 1.5 m depth in green) in central Yamal. The gray dashed line represents a 1:1 relationship.
Circumpolar Results
Figure 8 shows the classified total lake area, the distribution of ground-fast and floating lake ice for the 50 km grid. The majority of the lake area lies within Nunavut, the North-West-Territories in Canada, the Alaskan North Slope and the Kolyma region in Siberia. Since total lake coverage in the above mentioned regions is high, the total area of ground-fast and floating lake ice is also considerably higher than in other areas. The fraction of ground-fast lake ice (the percentage of ground-fast lake ice area compared to the overall lake area within the 50 km cell) for each raster cell differs from the total ground-fast area pattern (Figure 8).
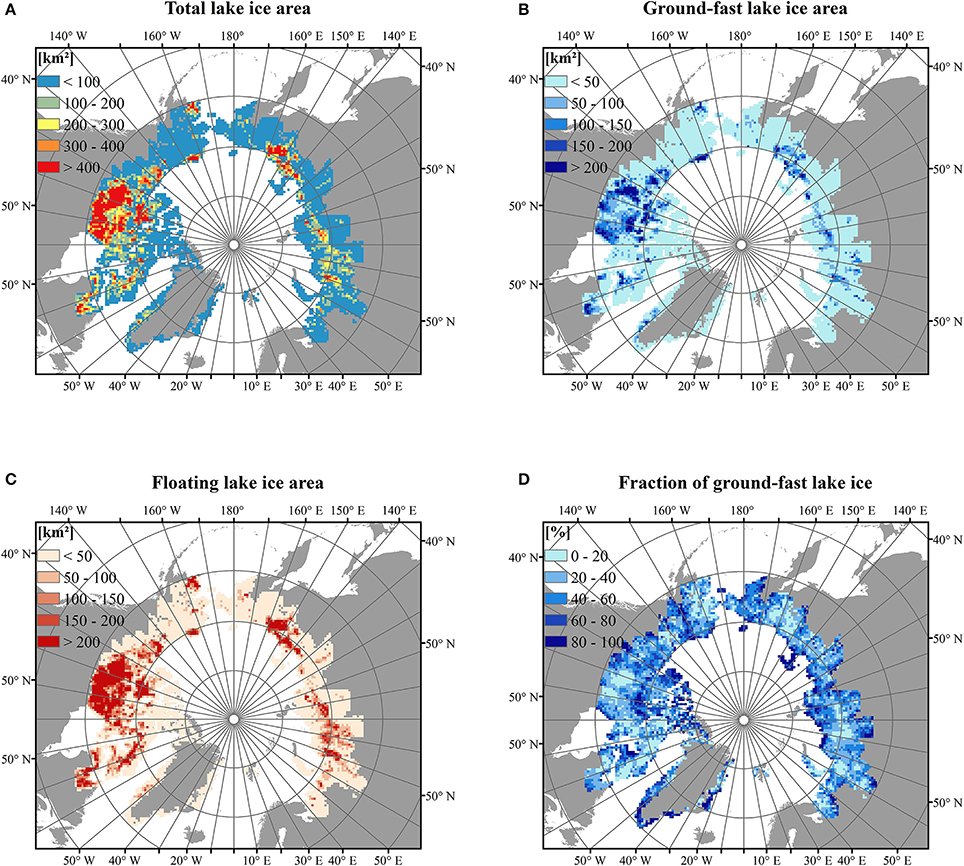
Figure 8. Lake ice properties from ASAR WS and lake area derived from Landsat data (modified from NGCC) for 50 × 50 km grid cells over the analyses extent (see Figure 1): (A) Total lake ice within a grid cell [km2], (B) Total ground-fast lake ice area within a grid cell [km2], (C) Floating lake ice area within a grid cell [km2], and (D) Fraction of ground-fast ice [%] with respect to total lake area within a grid cell.
The developed approach provides a spatially consistent map across the Arctic (Figure 9). Most lake rich areas are characterized by a mixture of lakes with different percentages of ground-fast lake ice, except for locations that are known to have abundant shallow lakes such as the Lena Delta's second terrace in Siberia (Arga island, late Pleistocene to to Early Holocene age, Schwamborn et al., 2002) or areas with (deeper) lakes of glacial origin such as parts of Canada. The Yedoma region in Eastern Siberia (Figure 9A) comprises a high number of lakes with low ground-fast ice fraction, but this area also includes lakes that have a ground-fast ice fraction that is up to 50%. These lakes are found to follow a random-location pattern. Very few lakes have a higher fraction. The region near Barrow on the Alaskan North Slope (Figure 9B) shows distinct regional patterns of ground-fast ice fraction. This has also been described in the literature by Arp et al. (2011). It is common that lakes freeze to the ground almost completely in this area. Higher ground-fast ice fractions are constrained to comparably smaller lakes on central Yamal (Figure 9C) but this area also contains regions which demonstrate a mixed spatial pattern similar to the Alaskan site. A common feature is the proximity to the coast.
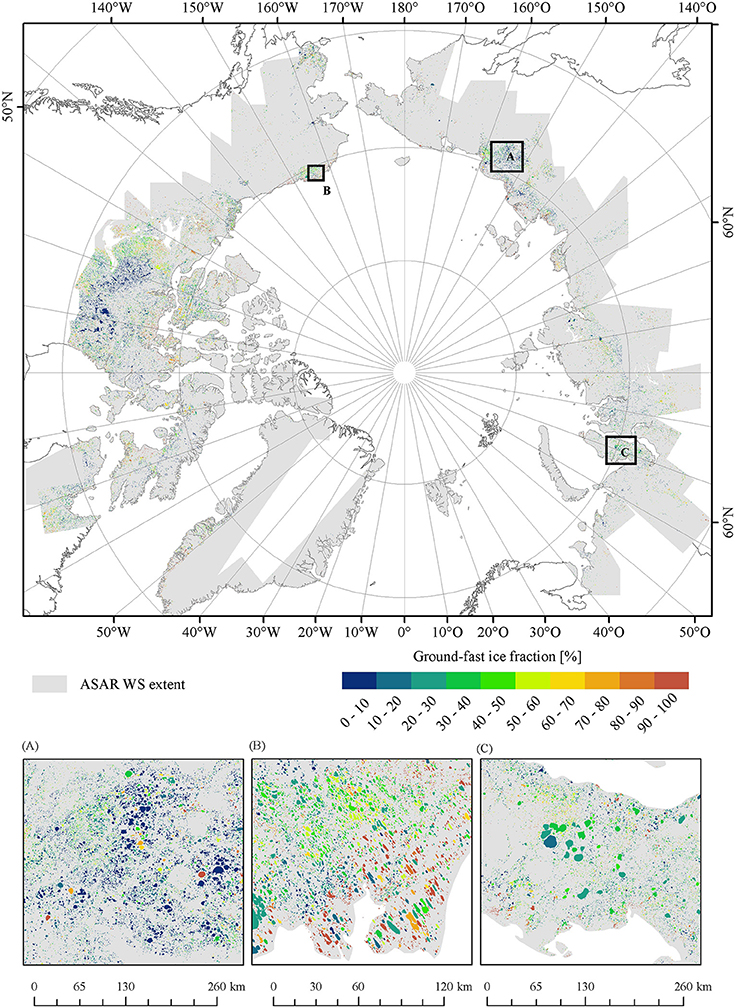
Figure 9. Classification result of ground-fast lake ice fraction by lake. ASAR WS extent is shown in gray. Enlarged subsets: (A) Eastern Siberian Yedoma dominated area, (B) Alaskan North Slope around Barrow, (C) central and southern Yamal Peninsula.
In general, smaller lakes tend to have high ground-fast ice fraction, but there are differences regarding the actual magnitude and number of lakes affected. More than 10% of lakes of sizes between 0.025 and 0.125 km2 freeze almost completely to the ground, where at least 95% of the ice cover is ground-fast (Figure 10 top). The proportion is smaller for larger lakes, with decreasing values for increasing lake size. The total number of lakes with such an extent of ground-fast ice is however very small for larger lakes (Figure 10 middle). About 250,000 lakes (about 12.5% of all considered lakes) fall into the category 0.025–0.125 km2, which corresponds to about three to thirteen ASAR WS pixels. Less than 20% of that amount accounts for sizes between 0.075 and 0.125 km2. This difference can not be observed for all lakes which only partially freeze to the ground (Figure 10 bottom). Here, the number of lakes is similar in both size categories. About 800,000 lakes (about one quarter of all analyzed objects) with sizes between 0.025 and 0.075 km2 have at least one pixel identified as ground fast ice. At least 70% of analyzed lakes froze partially to the ground, while at least 20% froze up almost completely in 2008. The distribution function between lake size and number of lakes differs between the almost completely and the partially ground-fast lakes. The first shows an exponential relationship with most of the lakes within the smallest category (Figure 10 middle). This is less pronounced in the second case (Figure 10 bottom). Figure 11 provides some insight into variations of ground-fast ice for lakes of different sizes. The median of ground-fast ice fraction is 40% for the smallest area class and more than 25% for the large lake class (more than 0.475 km2). This confirms that mostly small lakes freeze-up almost completely, but it also shows that there is more variation in ground-fast ice fraction for smaller lakes. In general, ground-fast ice fraction is more often close to zero.
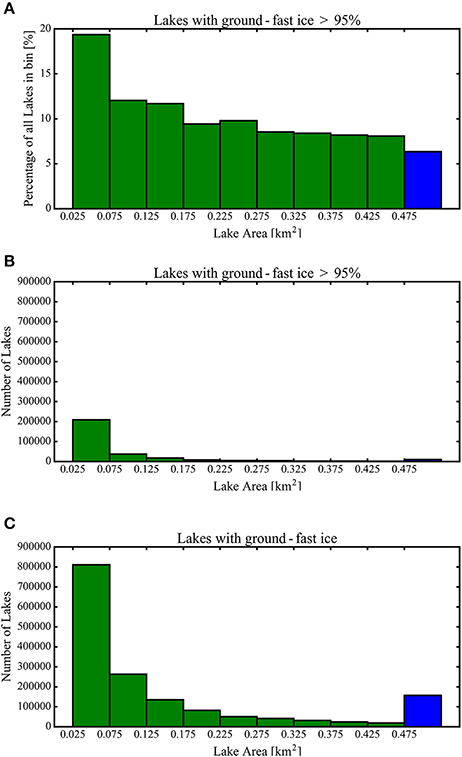
Figure 10. Zonal statistics for lake size classes; minimum lake size is 0.025 km2. Lakes larger than 0.5 km2 are represented as one bin (blue color). (A) Percentage of lakes for more than 95% ground-fast ice fraction; (B) Number of lakes for more than 95% ground-fast ice fraction; (C) Number of lakes with at least one pixel classified as ground-fast ice.
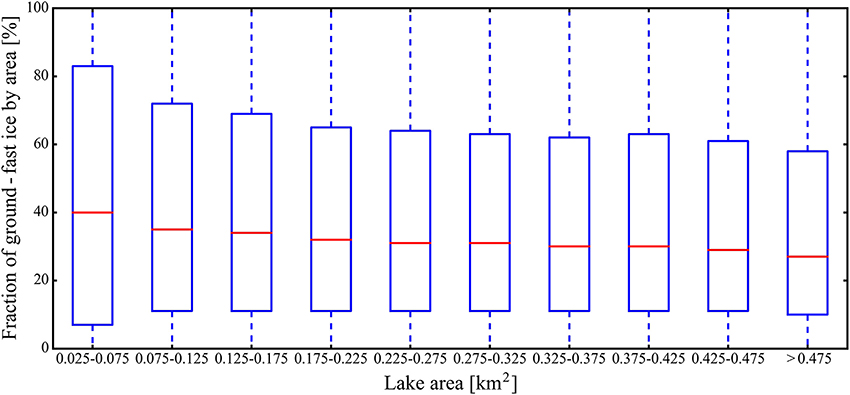
Figure 11. Boxplot for distribution of ground-fast lake ice fraction by lake size class; minimum lake size is 0.025 km2.
The number of lakes, the total ground-fast area and the fraction with respect to the total lake area are shown for ranges of soil organic carbon classes in Figure 12. It accounts for the entire analyzed area (light blue line) as well as for different zones (permafrost types, last glacial maximum) as also discussed in Smith et al. (2007). Yedoma areas are further delineated due to their specific history regarding ground ice and soil development. Most lakes of the continuous permafrost zone can be found in areas with total SOC of 80–90 kg m−3. The bin with the lowest number of lakes is 60–70 kg m−3. Values for the extent of the last glacial maximum are similar to continuous permafrost except for this specific SOC content class. The same applies to the total area of ground-fast ice. The ratio of ground-fast ice to total lake area increases with SOC for continuous permafrost only. Areas with up to 70 kg m−3 are characterized by fractions of 20–30% and up to almost 40% for higher values. The Yedoma area, which mostly overlaps with high SOC content, does not differ from non-Yedoma area with respect to frozen ground fraction.
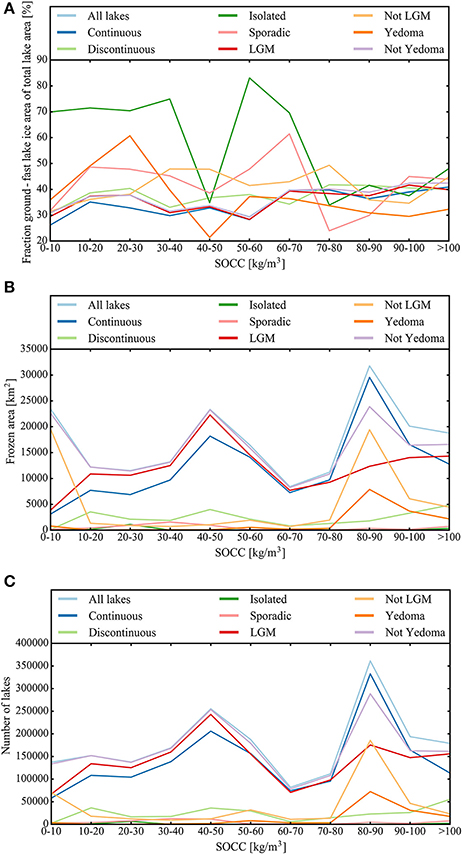
Figure 12. Lake ice properties from ASAR WS with respect to soil organic carbon content (SOCC; Hugelius et al., 2013) in their surroundings. Colored lines represent different types for permafrost zones (Brown et al., 1998), last glacial maximum (LGM; Ray and Adams, 2001) and Yedoma class extent (Strauss et al., 2016). (A) Fraction of ground fast ice area with respect to total lake area; (B) Total ground-fast area, (C) Number of lakes.
Discussion
Methodological Constraints
The developed method enables a first circumpolar account of ground-fast lake ice. Some issues related to the determined function and used auxiliary data do however remain unsolved. Due to a lack of relevant data, the presented approach for mapping of ground-fast ice does not consider potential variations in incidence angle behavior for floating ice caused by the amount of bubbles as described by Duguay et al. (2002). The difference between the two states (ground-fast/floating) is in the order of 7–8 dB for the visual sample. This is similar to values reported from Manitoba by Duguay et al. (2002). The lower values of the LK-003 sample may point to less bubbles in the ice taking into account findings from Walter et al. (2008). Ground-fast ice values are however also closer to the threshold function. The differences between the two sample sets may arise from the fact that the visual sample contains well distinguishable regions, whereas the LK-003 sample is obtained from actual bathymetric data.
No specific effects on the ground-fast ice backscatter are reported in the literature. The obtained threshold function is therefore expected to be applicable to areas with higher bubble content. More critical are lakes without bubbles, as the separability from floating ice is lower at shallow incidence angles (Duguay et al., 2002). The percentage of all lakes that freeze up to at least 95% of their respective lake area (20%), as established here, may actually be too high due to this low incidence angle effect.
The determined relationships between incidence angle and backscatter are close to the same for ground-fast and floating ice for Yamal. Backscatter decreases with similar magnitude for incidence angles of 30° and larger (Figure 3). The separability, however, decreases with decreasing incidence angle for both cases (bathymetric and visual sample). This effect is more pronounced for the LK-003 sample (Figure 4), which may point to comparably low amount of bubbles according to Duguay et al. (2002).
The algorithm is known to not be applicable over larger and deeper lakes where ice properties differ from smaller lakes and floating ice can have comparably low backscatter values. Deeper lakes are in general associated with fewer trapped bubbles in the ice, which leads to rather low backscatter values (Jeffries et al., 2013). Large lakes were therefore manually set to 0% ground-fast ice fraction. The possibility that there are additional lakes with similar properties that are still contained within the datasets remains. This may in particular be the case in the region around the Great Slave Lake in Northern Canada. Furthermore, some of the excluded lakes may actually have ground-fast ice along the margins, which is not accounted for within the dataset. The majority of analyzed lakes is, however, smaller and can be expected to be correctly identified. This is supported by comparable results from the Alaskan North Slope (Figure 6). Jeffries et al. (2013) demonstrate the low backscatter effect for Teshekpuk lake on the North Slope with an acquisition from early winter when ice is forming. Floating ice cannot be detected at this stage due to the low amount of bubbles. Teshekpuk lake has a size of more than 800 km2 and a maximum depth of 6.6 m. Our results show that the effect is reduced in late winter. A ground-fast ice fraction of 25% is obtained with the presented method, which is a likely value for a lake of this depth (compare to Figure 6).
The accuracy of the classification also depends on the lake mask. Small river courses are still partially contained in the datasets since such features have been removed manually. This may lead to the inclusion of false small lakes in some areas. Location accuracy is an issue as well. The used mask does for example not fully agree with the extent of the lakes as can be seen for lake LK-003 in Figure 2. This may also explain the comparably large amount of lakes with low ground-fast ice fraction in the lowest lake size class (Figure 11). This could be an effect of a mismatch between the lake mask and the actual lake extent as well as mixed pixel effects. The small lakes consist of a few pixels only, and therefore the proportion of mixed pixels is comparably large. The backscatter of the surrounding area is usually more similar to floating ice, which leads to an underestimation of ground-fast ice for the lake object.
While the spatial extent of the derived map covers the largest possible land area for 2008, and the territory north of the treeline is well represented, it does however not correspond to specific latitudinal or landscape unit boundaries. Data availability from ENVISAT ASAR WS for April 2008 is comparably good but not all lake rich permafrost regions could be covered. Apart from the above mentioned limitations of the algorithm, these data gaps further restrict a circum-Arctic analysis, and hence not all ground-fast lake ice has been captured by this study. The results can therefore not completely complement accounts such as by Smith et al. (2007). The combination of different years may allow for an estimate of where ground-fast ice occurs, but ground-fast ice fraction can vary from year to year (Surdu et al., 2014). A better coverage could potentially be achieved by consolidating this study with additional satellite data, e.g. Radarsat data. These data are also acquired in the C-band but were not available for the present study. Furthermore, the Sentinel-1 satellites could contribute to future updates, starting from April 2017. With the activation of the second sensor (Sentinel-1B launched in 2016), spatial coverage would be sufficient. The availability of HH polarization data will however be lower than for ASAR WS (Potin et al., 2014). The remaining areas are covered by acquisitions in VV (vertically sent and vertically received), which may require adjusting the parametrization.
Bathymetry vs. Ground-Fast Ice Fraction
The comparison with bathymetric data from Yamal suggests that freezing depth is between 1 to 1.5 m (Figure 7). This is in the same order of magnitude as lake ice thickness measurements from the Alaskan North Slope (Arp et al., 2012; Grunblatt and Atwood, 2014, e.g.,) and implies similar climatic conditions. There are variations between the lakes, which may result from the comparably low separability as discussed above for lake LK-003 as well as the resolution and accuracy of the Landsat lake mask.
The results suggest that lakes at Atkasuq and Barrow are similar, although they are located on coastal plains of different age. The lakes on the Alaskan North Slope represent a more than 100 km long transect perpendicular to the coastline, and thus multiple stages of Cenozoic marine transgressions are present here. Deeper lakes (deeper than 6 m) show a rather low ground-fast ice fraction. They are located at the southern, most inland part of the transect. They are part of the so called Inner Coastal Plain (ICP), but Atkasuq is also located on this plain. Atkasuq lakes have much higher ground-fast ice fractions than the southern lakes near Reindeer Camp. They are also shallower, similar to the Barrow region, which belongs to the Outer Coastal Plain (OCP) (Hinkel et al., 2005). The Barrow area has the largest diversity of ground-fast ice fraction, while at the same time only shallow lakes occur here. This result might be biased due to the limited sample from this region, but lakes are in general very shallow in this area (Arp et al., 2011). The mapped range of ground-fast ice fraction on the OCP agrees with results from previous studies (Arp et al., 2012).
Deeper lakes with a frozen fraction of more than 20% are found on Yamal as well as Richards Island. The lakes on Yamal have usually a deeper (but small) circular part and shallow more or less extensive shelves. A good example of an extensive shelf is lake LK-003 (Figure 2). It has a maximum depth of 15 m and a ground-fast fraction of 50%. A common feature of central Yamal and Richards Island are distinct ridges (Burn, 2002; Leibman et al., 2015). Thaw slumps and erosion along lake shores are a common feature at the Yamal site. Material is deposited in the lakes forming prominent shelves. Erosion rates of lakes in permafrost areas are in general positively correlated with lake depth (Arp et al., 2011). The results from ASAR WS confirm the presence of distinct littoral terraces for the deeper lakes. The ground-fast ice fractions can be expected to represent the littoral terraces in these regions. The fraction could therefore be used to provide an estimate of the average terrace width. This width in relation to the radius of the central pool can be subsequently used to determine talik formation (Burn, 2002). A certain unfrozen lake area is required for penetration of the talik through the permafrost beneath a lake. The actual relationship depends on temperature and the width of the unfrozen central pool. Investigations from Richards Island (Canada), for example, suggest a maximum talik of the order of 150 m for a terrace width of the same size (Burn, 2002). This terrace width is also of the same order of magnitude as the ASAR WS spatial resolution. The talik depth is expected to be higher for smaller terraces. Higher spatial resolution SAR missions such as TerraSAR-X could also be used (Jones et al., 2013; Antonova et al., 2016) to identify these smaller littoral terraces, as well as to identify any subtle changes locally. However, the application of such data over larger regions across the Arctic is not possible due to their limited spatial coverage.
Regional Patterns
The relatively high fraction of ground-fast ice in high SOC content regions points to a larger proportion of shallow lakes. These are also lake-rich regions in which a high density of small lakes are found. This underlines the importance of these lakes for methane flux studies. While winter fluxes might be reduced in such areas due to freeze up, shallow lakes show higher methane fluxes during the ice free season (Wik et al., 2016). However, the present satellite data analysis cannot account for the depth of any unfrozen lake areas. This is made evident by the bathymetric data.
Spatial clusters of different ground-fast ice fraction classes are specifically found in the Yedoma regions of Eastern Siberia and Alaska (Figure 9). The co-occurrence of lakes of different depths is indicative of the nature of thaw lake development, where it is common for lakes at different stages in their development cycle to exist next to each other (West and Plug, 2008). Deeper, older lakes can be found next to shallower and probably younger lakes, or lakes that have developed over different ground material.
The higher fraction of ground-fast lake ice in the 50 km grid in coastal areas could be partially explained by incomplete removal of ocean water surfaces during the lake mask preparation. Some areas located close to coastlines are known to have an abundance of shallow lakes. This abundance, as found on the North Slope and on parts of the Lena Delta, point to comparably young lakes of Pleistocene age (Black, 1969; Schwamborn et al., 2002).
Shallow lakes, which freeze to the ground, cannot be exclusively associated with thaw lake development. Many lakes, such as those on the lower terraces at Yamal, are part of floodplains. Higher ground-fast ice fraction has been identified for water bodies on floodplains of large rivers like the Ob on Yamal. These are located in non-continuous permafrost regions. Areas detected as ground-fast ice outside the continuous zone are therefore not expected to be related to thaw lakes. Due to the lack of ASAR WS data in southern areas, the number of samples within the non-continuous permafrost zones is in general much smaller than those within the continuous permafrost zones. The obtained results for these areas (zonal statistics presented in Figure 12) may thus not be completely representative.
Ground-fast ice fraction information may to some extent support the identification of landscape units, for example areas of adjacent lakes with similar patterns (terraces) or areas with mixed ground-fast fractions that indicate different lake development stages (such as parts of the Yedoma areas). The available validation datasets mostly represent marine and alluvial terraces. Especially samples from more continental lake-rich areas, such as the East Siberian Yedoma region, would be required for a more complete picture. An additional constraint for the interpretation of the results arises from larger lakes, which are not considered. Furthermore, ponds, which are also very common in permafrost regions, are also excluded from the analyses due to the spatial resolution limitation of the satellite datasets. Varying lake size distribution functions have also been reported for thaw ponds in the Arctic (Muster et al., 2013) and are associated with specific landscape types.
Conclusions
Space-borne synthetic aperture radar (SAR) data can be used to determine the fraction of circumpolar ground-fast ice and to create a spatially consistent mosaic, if incidence angle dependencies of the radar data are taken into consideration. Because radar backscatter values vary with incidence angle, and inconsistencies may arise when delineating ice-covered lakes from their surroundings, it is important to only consider the backscatter intensity of the lakes, masking the signal that arises from the surrounding land areas as well as the ocean in coastal regions, where masking inaccuracies need to be addressed separately.
Using this approach, it was established that in general small lakes (approximately 0.1 km2) freeze almost entirely to the ground, while approximately 20% of all the lakes considered in this study (this excludes large lakes such as Great Slave Lake and Great Bear Lake) have ice covers that are ground-fast for at least 95% of their surface extent. No clear relationship between maximum lake depth (from bathymetric data and literature) and ground-fast ice fraction (from SAR data) was found. This result may however not hold locally, where higher spatial resolution data and more extensive bathymetric measurements would provide a more detailed picture.
To improve the understanding of lake formation, lake size distributions have already been analyzed with respect to glaciation history, permafrost zones and peatland areas. The present study's results further demonstrate that ground-ice fraction is related to lake size, where spatial patterns of lakes with ground-fast ice are also linked to certain landscape units. These findings are also supported by lake depth data from several sites across the Arctic. Useful information on the extent of the lithoral terraces of lakes can also be determined using the presented method to establish ground-fast ice cover. Furthermore, preliminary investigation suggests that the proportion of ground-fast ice also increases with SOC content within the ground surrounding these lakes. It is anticipated that SAR derived ground-fast ice fractions, combined with auxiliary data on lake depth, will be beneficial to studies on methane upscaling from lakes, where winter and summer methane fluxes are driven by changes in frozen ground conditions.
Author Contributions
AB has developed the concept for the presented study and wrote the majority of the manuscript. GP conducted all data analyses, contributed to the literature survey, compilation of the figures and writing of the methods part of the manuscript. YD and AK collected and processed the bathymetric data on the Yamal peninsula. ML is the supervising scientist for the Yamal surveys and contributed to the writing of related texts. AT has contributed to the writing of the manuscript, specifically the conclusions.
Funding
This work was supported by the Austrian Science Fund (FWF) under Grant [I 1401] and the Russian Foundation for Basic Research Grant 13-05-91001-ANF-a (Joint Russian–Austrian project COLD–Yamal).
Conflict of Interest Statement
The authors declare that the research was conducted in the absence of any commercial or financial relationships that could be construed as a potential conflict of interest.
Acknowledgments
The 30 m land cover data set is provided by the National Geomatics Center of China. (DOI:10.11769/ GlobeLand30.2000.db; DOI:10.11769/GlobeLand30.2010.db).
References
Antonova, S., Duguay, C. R., Kääb, A., Heim, B., Langer, M., Westermann, S., et al. (2016). Monitoring bedfast ice and ice phenology in lakes of the Lena river delta using TerraSAR-X backscatter and coherence time series. Remote Sens. 8:903. doi: 10.3390/rs8110903
Arp, C. D., Jones, B. M., Liljedahl, A. K., Hinkel, K. M., and Welker, J. A. (2015). Depth, ice thickness, and ice-out timing cause divergent hydrologic responses among Arctic lakes. Water Resour. Res. 51, 9379–9401. doi: 10.1002/2015WR017362
Arp, C. D., Jones, B. M., Lu, Z., and Whitman, M. S. (2012). Shifting balance of thermokarst lake ice regimes across the Arctic Coastal Plain of northern Alaska. Geophys. Res. Lett. 39:L16503. doi: 10.1029/2012GL052518
Arp, C. D., Jones, B. M., Urban, F. E., and Grosse, G. (2011). Hydrogeomorphic processes of thermokarst lakes with grounded-ice and floating-ice regimes on the Arctic coastal plain, Alaska. Hydrol. Processes 25, 2422–2438. doi: 10.1002/hyp.8019
Atwood, D. K., Gunn, G. E., Roussi, C., Wu, J., Duguay, C., and Sarabandi, K. (2015). Microwave Backscatter From Arctic Lake Ice and Polarimetric Implications. Geosci. Remote Sens. IEEE Trans. 53, 5972–5982. doi: 10.1109/TGRS.2015.2429917
Bartsch, A. (2010). Ten Years of SeaWinds on QuikSCAT for Snow Applications. Remote Sens. 2, 1142–1156. doi: 10.3390/rs2041142
Bartsch, A., Pathe, C., Wagner, W., and Scipal, K. (2008). Detection of Permanent Open Water Surfaces in Central Siberia with ENVISAT ASAR Wide Swath Data with Special Emphasis on the Estimation of Methane Fluxes from Tundra Wetlands. Hydrol. Res. 39, 89–100. doi: 10.2166/nh.2008.041
Bartsch, A., Trofaier, A., Hayman, G., Sabel, D., Schlaffer, S., Clark, D., and Blyth, E. (2012). Detection of Open Water Dynamics with ENVISAT ASAR in Support of Land Surface Modelling at High Latitudes. Biogeosciences 9, 703–714. doi: 10.5194/bg-9-703-2012
Bartsch, A., Wagner, W., Scipal, K., Pathe, C., Sabel, D., and Wolski, P. (2009). Global Monitoring of Wetlands - the Value of ENVISAT ASAR Global Mode. J. Environ. Manag. 90, 2226–2233. doi: 10.1016/j.jenvman.2007.06.023
Black, R. (1969). Geology, Especially Geomorphology, of Northern Alaska. Arctic 22, 283–299. doi: 10.14430/arctic3220
Brown, J., Ferrians, O. J. Jr., Heginbottom, J. A., and Melnikov, E. S. (1998). Circum-Arctic Map of Permafrost and Ground-Ice Conditions. Boulder, CO: National Snow and Ice Data Center/World Data Center for Glaciology. Digital Media.
Burn, C. R. (2002). Tundra lakes and permafrost, Richards Island, western Arctic coast, Canada. Can. J. Earth Sci. 39, 1281–1298. doi: 10.1139/e02-035
Burn, C. R. (2005). Lake-bottom thermal regimes, Western Arctic Coast, Canada. Permafrost Periglac. Process 16, 355–367. doi: 10.1002/ppp.542
Closa, J., Rosich, B., and Monti-Guarnieri, A. (2003). “The ASAR Wide Swath Mode products”, in Geoscience and Remote Sensing Symposium, 2003. IGARSS '03. Proceedings. 2003 IEEE International (Toulouse), vol. 2, 1118–1120. doi: 10.1109/IGARSS.2003.1294030
Duguay, C. R., Pultz, T. J., Lafleur, P. M., and Drai, D. (2002). RADARSAT backscatter characteristics of ice growing on shallow sub-Arctic lakes, Churchill, Manitoba, Canada. Hydrol. Process. 16, 1631–1644. doi: 10.1002/hyp.1026
Dvornikov, Y. (2016). The Processes of Thermodenudation in Cryolithozone and the Dissolved Organic Matter as their Indication [In Russian]. PhD thesis, Earth Cryosphere Institute SB RAS.
Dvornikov, Y., Leibmann, M., Heim, B., Bartsch, A., Haas, A., Khomutov, A., et al. (2016). Geodatabase and WebGIS project for long-term permafrost monitoring at the Vaskiny Dachi research station, Yamal, Russia. Polarforschung 85, 107–115. doi: 10.2312/polarforschung.85.2.107
Engram, M., Anthony, K. W., Meyer, F. J., and Grosse, G. (2013). Characterization of L-band synthetic aperture radar (SAR) backscatter from floating and grounded thermokarst lake ice in Arctic Alaska. Cryosphere 7, 1741–1752. doi: 10.5194/tc-7-1741-2013
Frauenfeld, O. W., Zhang, T., and McCreight, J. L. (2007). Northern hemisphere freezing/thawing index variations over the twentieth century. Int. J. Climatol. 27, 47–63. doi: 10.1002/joc.1372
Grunblatt, J., and Atwood, D. (2014). Mapping lakes for winter liquid water availability using SAR on the North Slope of Alaska. Int. J. Appl. Earth Observ. Geoinformat. 27, 63–69. Special Issue on Polar Remote Sensing 2013. doi: 10.1016/j.jag.2013.05.006
Henderson, F. M., and Lewis, A. J. (eds.). (1998). Principles and Applications of Imaging Radar, Vol. 2 of Manual of Remote Sensing, 3 Edn. Hoboken, N. J: John Wiley.
Hinkel, K. (2010). Water Temperature and Bathymetric Depth Soundings for Lakes near Barrow, Version 1.0. Boulder: UCAR/NCAR - Earth Observing Laboratory. (Accessed 19, Aug 2016). doi: 10.5065/D6WW7FS9
Hinkel, K. (2016). Shapefiles - Lake Bathymetry, Watershed Delineation, Lake surface Area, Site Locations (CALON). University of Concinnati; NSF Arctic Data Center. doi: 10.5065/D60P0X57
Hinkel, K. M., Frohn, R. C., Nelson, F. E., Eisner, W. R., and Beck, R. A. (2005). Morphometric and spatial analysis of thaw lakes and drained thaw lake basins in the Western Arctic Coastal Plain, Alaska. Permafrost Periglac. Process. 16, 327–341. doi: 10.1002/ppp.532
Hirose, T., Kapfer, M., Bennett, J., Cott, P., Manson, G., and Solomon, S. (2008). Bottomfast ice mapping and the measurement of ice thickness on tundra lakes using C-Band Synthetic Aperture Radar Remote Sensing. J. Am. Water Res. Assoc. 44, 285–292. doi: 10.1111/j.1752-1688.2007.00161.x
Hugelius, G., Tarnocai, C., Broll, G., Canadell, J. G., Kuhry, P., and Swanson, D. K. (2013). The Northern Circumpolar Soil Carbon Database: spatially distributed datasets of soil coverage and soil carbon storage in the northern permafrost regions. Earth Sys. Sci. Data 5, 3–13. doi: 10.5194/essd-5-3-2013
Jeffries, M. O., Morris, K., and Kozlenko, N. (2013). “Ice characteristics and processes, and remote sensing of frozen rivers and lakes”, in Remote Sensing in Northern Hydrology: Measuring Environmental Change, Number 163 in Geophysical Monograph, eds C. R. Duguay and A. Pietroniero (Washington, DC: American Geophysical Union), 63–90.
Jeffries, M. O., Morris, K., Weeks, W. F., and Wakabayashi, H. (1994). Structural and stratigraphie features and ERS 1 synthetic aperture radar backscatter characteristics of ice growing on shallow lakes in NW Alaska, winter 1991–1992. J. Geophys. Res. Oceans 99, 22459–22471. doi: 10.1029/94JC01479
Jones, B. M., Gusmeroli, A., Arp, C. D., Strozzi, T., Grosse, G., Gaglioti, B. V., et al. (2013). Classification of freshwater ice conditions on the Alaskan Arctic Coastal Plain using ground penetrating radar and TerraSAR-X satellite data. Int. J. Remote Sens. 34, 8267–8279. doi: 10.1080/2150704X.2013.834392
Kizyakov, A. I., Sonyushkin, A. V., Leibman, M. O., Zimin, M. V., and Khomutov, A. V. (2015). Geomorphological conditions of the gas-emission crater and its dynamics in Central Yamal. Earth's Cryosphere XIX, 15–25. Available online at: http://www.izdatgeo.ru/pdf/earth_cryo/2015-2/13_eng.pdf
Lantuit, H. (2007). Geometrical Features of Lakes in the Northern Part of Arga Island. Bremerhaven. doi: 10.1594/PANGAEA.611521
Lehner, B., and Döll, P. (2004). Development and Validation of a Global Database of Lakes, Reservoirs and Wetlands. J. Hydrol. 296, 1–22. doi: 10.1016/j.jhydrol.2004.03.028
Leibman, M., Khomutov, A., Gubarkov, A., Mullanurov, D., and Dvornikov, Y. (2015). The research station Vaskiny Dachi, Central Yamal, West Siberia, Russia - A review of 25 years of permafrost studies. Fennia 193, 3–30. doi: 10.11143/45201
Mätzler, C., Aebischer, H., and Schanda, E. (1984). Microwave dielectric properties of surface snow. IEEE J. Ocean. Eng. OE-9, 366–371. doi: 10.1109/JOE.1984.1145644
Morgenstern, A., Fedorova, I., Roessler, S., and Ivlev, P. (2013): Lake bathymetry, Kurungnakh Island, Lena Delta. doi: 10.1594/PANGAEA.848485. in supplement to: Morgenstern, A., Ulrich, M., Günther, F., Roessler, S., Fedorova, I., Rudaya, N. A., Wetterich, S., Boike, J., et al. (2013): Evolution of thermokarst in East Siberian ice-rich permafrost: a case study. Geomorphology 201, 363–379. doi: 10.1016/j.geomorph.2013.07.011
Muster, S., Heim, B., Abnizova, A., and Boike, J. (2013). Water body distributions across scales: a remote sensing based comparison of three arctic tundra wetlands. Remote Sens. 5, 1498–1523. doi: 10.3390/rs5041498
Naeimi, V., Paulik, C., Bartsch, A., Wagner, W., Kidd, R., Park, S. E., et al. (2012). ASCAT Surface State Flag (SSF): extracting information on surface freeze/thaw conditions from backscatter data using an Empirical Threshold-Analysis Algorithm. IEEE Trans. Geosci. Remote Sens. 50, 2566–2582. doi: 10.1109/TGRS.2011.2177667
Paltan, H., Dash, J., and Edwards, M. (2015). A refined mapping of Arctic lakes using Landsat imagery. Int. J. Remote Sens. 36, 5970–5982. doi: 10.1080/01431161.2015.1110263
Park, S.-E., Bartsch, A., Sabel, D., Wagner, W., Naeimi, V., and Yamaguchi, Y. (2011). Monitoring Freeze/Thaw cycles using ENVISAT ASAR global mode. Remote Sens. Environ. 115, 3457–3467. doi: 10.1016/j.rse.2011.08.009
Paulik, C., Melzer, T., Hahn, S., Bartsch, A., Heim, B., Elger, K., et al. (2014). Circumpolar Surface Soil Moisture and Freeze/Thaw Surface Status Remote Sensing Products (version 4) with Links to Geotiff Images and NetCDF Files (2007-01 to 2013-12). Bremerhaven: Department of Geodesy and Geoinformatics, TU Vienna. doi: 10.1594/PANGAEA.832153
Potin, P., Rosich, B., Roeder, J., and Bargellini, P. (2014). “Sentinel-1 Mission operations concept”, in 2014 IEEE Geoscience and Remote Sensing Symposium (Quebec City, QC), 1465–1468. doi: 10.1109/IGARSS.2014.6946713
Ray, N., and Adams, J. (2001). A GIS-based vegetation map of the world at the Last Glacial Maximum (25,000-15,000 BP). Internet Archaeol 11. doi: 10.11141/ia.11.2
Schwamborn, G., Rachold, V., and Grigoriev, M. N. (2002). Late Quaternary sedimentation history of the Lena Delta. Quat. Int. 89, 119–134. doi: 10.1016/S1040-6182(01)00084-2
Smith, L. C., Sheng, Y., and MacDonald, G. M. (2007). A First Pan-Arctic Assessment of the Influence of Glaciation, Permafrost, Topography and Peatlands on Northern Hemisphere Lake Distribution. Permafrost Periglacial Process. 18, 201–208. doi: 10.1002/ppp.581
Strauss, J., Laboor, S., Fedorov, A. N., Fortier, D., Froese, D., and Fuchs, M. (2016): Database of Ice-Rich Yedoma Permafrost (IRYP), link to FileGDB. doi: 10.1594/PANGAEA.861731. in: Strauss, J., Laboor, S., Fedorov, A. N., Fortier, D., Froese, D., Fuchs, M., et al. (2016): Database of Ice-Rich Yedoma Permafrost (IRYP). doi: 10.1594/PANGAEA.861733
Strauss, J., Schirrmeister, L., Grosse, G., Wetterich, S., Ulrich, M., Herzschuh, U., et al. (2013). The deep permafrost carbon pool of the Yedoma region in Siberia and Alaska. Geophys. Res. Lett. 40, 6165–6170. doi: 10.1002/2013GL058088
Surdu, C. M., Duguay, C. R., Brown, L. C., and Fernández Prieto, D. (2014). Response of ice cover on shallow lakes of the North Slope of Alaska to contemporary climate conditions (1950-2011): radar remote-sensing and numerical modeling data analysis. Cryosphere 8, 167–180. doi: 10.5194/tc-8-167-2014
Surdu, C. M., Duguay, C. R., Pour, H. K., and Brown, L. C. (2015). Ice Freeze-up and Break-up Detection of Shallow Lakes in Northern Alaska with Spaceborne SAR. Remote Sens. 7, 6133–6159. doi: 10.3390/rs70506133
Wagner, W., Pathe, C., Doubkova, M., Sabel, D., Bartsch, A., Hasenauer, S., et al. (2008). Temporal stability of soil moisture and radar backscatter observed by the Advanced Synthetic Aperture Radar (ASAR). Sensors 8, 1174–1197. doi: 10.3390/s80201174
Wakabayashi, H., Weeks, W., and Jeffries, M. (1993). “A C-band backscatter model for lake ice in Alaska”, in Geoscience and Remote Sensing Symposium, 1993. IGARSS '93. Better Understanding of Earth Environment., International, Vol.3 (Tokyo), 1264–1266. doi: 10.1109/IGARSS.1993.322103
Walter, K. M., Engram, M., Duguay, C. R., Jeffries, M. O., and Chapin, F. (2008). The potential use of synthetic aperture radar for estimating Methane Ebullition from Arctic Lakes. J. Am. Water Res. Assoc. 44, 305–315. doi: 10.1111/j.1752-1688.2007.00163.x
West, J. J., and Plug, L. J. (2008). Time-dependent morphology of thaw lakes and taliks in deep and shallow ground ice. J. Geophys. Res. 113:F01009. doi: 10.1029/2006JF000696
Wik, M., Crill, P., Bastviken, D., Danielsson, A., and Norbäck, E. (2011). Bubbles trapped in arctic lake ice: Potential implications for methane emissions. Geophys. Res. Biogeosci. 116:G03044. doi: 10.1029/2011JG001761
Wik, M., Varner, R. K., Anthony, K. W., MacIntyre, S., and Bastviken, D. (2016). Climate-sensitive northern lakes and ponds are critical components of methane release. Nat. Geosci. 9, 99–105. doi: 10.1038/ngeo2578
Keywords: thaw lakes, permafrost, synthetic aperture radar, Arctic, lake depth
Citation: Bartsch A, Pointner G, Leibman MO, Dvornikov YA, Khomutov AV and Trofaier AM (2017) Circumpolar Mapping of Ground-Fast Lake Ice. Front. Earth Sci. 5:12. doi: 10.3389/feart.2017.00012
Received: 21 August 2016; Accepted: 02 February 2017;
Published: 16 February 2017.
Edited by:
Marco Tedesco, Lamont-Doherty Earth Observatory - Columbia University, USAReviewed by:
Lukas Arenson, BGC Engineering Inc., CanadaKlaus D. Joehnk, Commonwealth Scientific and Industrial Research Organisation (CSIRO), Australia
Copyright © 2017 Bartsch, Pointner, Leibman, Dvornikov, Khomutov and Trofaier. This is an open-access article distributed under the terms of the Creative Commons Attribution License (CC BY). The use, distribution or reproduction in other forums is permitted, provided the original author(s) or licensor are credited and that the original publication in this journal is cited, in accordance with accepted academic practice. No use, distribution or reproduction is permitted which does not comply with these terms.
*Correspondence: Annett Bartsch, annett.bartsch@zamg.ac.at