Inferring Firn Permeability from Pneumatic Testing: A Case Study on the Greenland Ice Sheet
 Aleah N. Sommers1*
  Harihar Rajaram1
  Eliezer P. Weber2
  Michael J. MacFerrin3
  William T. Colgan4
  C. Max Stevens5
- 1Department of Civil, Environmental, and Architectural Engineering, University of Colorado at Boulder, Boulder, CO, USA
- 2Apex Companies, LLC, Boulder, CO, USA
- 3Cooperative Institute for Research in Environmental Science, University of Colorado at Boulder, Boulder, CO, USA
- 4Department of Earth and Space Science and Engineering, York University, Toronto, ON, Canada
- 5Department of Earth and Space Sciences, University of Washington, Seattle, WA, USA
Across the accumulation zone of the Greenland ice sheet, summer temperatures can be sufficiently warm to cause widespread melting, as was the case in July 2012 when the entire ice sheet experienced a brief episode of enhanced surface ablation. The resulting meltwater percolates into the firn and refreezes, to create ice lenses, and layers within the firn column. This is an important process to consider when estimating the surface mass balance of the ice sheet. The rate of meltwater percolation depends on the permeability of the firn, a property that is not well constrained in the presence of refrozen ice layers and lenses. We present a novel, inexpensive method for measuring in-situ firn permeability using pneumatic testing, a well-established technique used in environmental engineering and hydrology. To illustrate the capabilities of this method, we estimate both horizontal and vertical permeability from pilot tests at six sites on the Greenland ice sheet: KAN-U, DYE-2, EKT, NASA-SE, Saddle, and EastGRIP. These sites cover a range of conditions from mostly dry firn (EastGRIP), to firn with several ice layers and lenses from refrozen meltwater (Saddle, NASA-SE, EKT), to firn with extensive ice layers (DYE-2 and KAN-U). The estimated permeability in firn without refrozen ice layers at EastGRIP agrees well with the range previously reported using an air permeameter to measure permeability through firn core samples at Summit, Greenland. At sites with ice lenses or layers, we find high degrees of anisotropy, with vertical permeability much lower than horizontal permeability. Pneumatic testing is a promising and low-cost technique for measuring firn permeability, particularly as meltwater production increases in the accumulation zone and ice layers and lenses from refrozen melt layers become more prevalent. In these initial proof-of-concept tests, the estimated permeabilities represent effective permeability at the meter scale. With appropriately higher vacuum pressures and more detailed monitoring, effective permeabilities over a larger scale may be quantified reliably, and multiple measurements during a season and across multiple years could improve understanding of the evolving firn structure and permeability. The technique is also suitable for broad application in Antarctica and other glaciers and ice caps.
Introduction
The Greenland Ice Sheet has been losing mass at an accelerated rate in recent years and is a significant contributor to sea level rise (e.g., Krabill et al., 2004; Velicogna and Wahr, 2006; Rignot et al., 2011; Fettweis et al., 2013). Accurate modeling of the surface mass balance of the ice sheet is essential for predicting its contribution to sea level rise over the next century. Percolation and refreezing of meltwater in firn occurs across much of the ice sheet accumulation area and influences runoff, which is a significant component of the surface mass balance. Accurately modeling percolation and refreezing requires an estimate of firn permeability (e.g., Colbeck, 1975; Ambach et al., 1981; Marsh and Woo, 1985).
Permeability (units of length2) is an intrinsic property of a porous medium that characterizes the connectivity of pore spaces and describes the ability of a fluid (such as air or water) to flow through the material. The hydraulic conductivity (units of length time−1) of a porous medium for flow of water is, in fact, related to the intrinsic permeability as follows (Bear, 1972):
Where K is the hydraulic conductivity, k is the intrinsic permeability of the material, ρ is bulk density of water, g is acceleration due to gravity, and μ is the dynamic viscosity of water. More generally, Equation (1) also provides a relationship for the conductivity to any fluid, including air. In firn, meltwater percolation can change the material structure through melting and refreezing, along with grain metamorphic processes. Firn permeability, then, is a material property that evolves with time, and a measurement of air permeability in firn from a short-duration pneumatic test reflects a snapshot in time of intrinsic permeability of the current material structure (which is useful and necessary for modeling meltwater percolation).
In heterogeneous media, the large-scale effective permeability typically exhibits anisotropy, i.e., direction-dependent permeability that requires a tensorial representation (e.g., Bear, 1972; Colbeck, 1975; Albert et al., 1996; Calonne et al., 2012). Firn is an anisotropic porous medium, particularly due to the presence of solid refrozen ice layers, ice lenses, or distinct wind crust layers (ice layers defined as being continuous on a snow pit scale, ice lenses as discontinuous; Fierz et al., 2009).
Although hydraulic conductivity (K) is most directly relevant to meltwater infiltration and transport models, it can be inferred from intrinsic permeability (k) measurements according to Equation (1). It is common to measure k using air as a fluid. Previous field studies have employed various techniques to measure the air permeability of seasonal snow, as well as firn samples collected in polar regions. Early permeability measurements using progressive compression were conducted by Bader (1939) and Bender (1957). Shimizu (1970) developed a dual-cylinder air permeameter to characterize permeability of snow in Hokkaido, Japan. Sommerfeld and Rocchio (1993) used a permeameter with a conditioning column to measure permeability of seasonal snow in Wyoming, USA. A similar design to the dual-cylinder permeameter of Shimizu (1970) was adopted to measure permeability of snow and firn at different depths at Summit, Greenland (Albert et al., 1996; Albert and Shultz, 2002; Luciano and Albert, 2002; Adolph and Albert, 2014) and in Antarctica (Courville et al., 2007, 2010; Hörhold et al., 2009). Recent studies have included other approaches as well: Courville et al. (2010) compared measured permeability with permeability estimated from microtomography and Lattice-Boltzmann modeling, and Calonne et al. (2012) used three-dimensional images of snow microstructure to estimate the full permeability tensor at the core scale for numerous samples of seasonal snow and Antarctic firn. These studies all measured or estimated permeability of extracted core samples, which would not necessarily accurately represent the field-scale effective permeability in the presence of ice layers and lenses of varying horizontal extent.
Given the implications of increased meltwater percolation in Greenland's firn and to account for ice lenses of varying horizontal extent, it is important to consider in-situ field permeability measurements rather than measurements from isolated core samples, and whether these measurements can resolve anisotropy directly. Most of the aforementioned studies involving Greenland firn considered only vertical permeability, with the exceptions of Albert et al. (1996), in which striking differences between horizontal and vertical permeability were observed in samples from the top 1 m of snow at Summit, and Luciano and Albert (2002), who measured both horizontal and vertical permeability in selected sections of a 13 m core at Summit, with distinct directional differences throughout the depth. Since Summit rarely experiences melt (i.e., refrozen ice lenses do not occur), these studies provide excellent reference datasets for permeability measurements of dry Greenland firn without the influence of refrozen ice lenses. In Vermont, USA, Albert and Perron (2000) found that vertical permeability across ice layers and surface crust was significantly lower than in the rest of the snowpack, and we expect that refrozen ice lenses in Greenland firn would exhibit similar properties.
As meltwater production on the Greenland Ice Sheet increases with warming air temperatures, new ice lenses will likely form at higher elevations, affecting the large-scale effective permeability of Greenland firn. This directly affects its percolation and retention capacity, and accordingly its sea level rise buffering capacity (Pfeffer et al., 1991; Harper et al., 2012). An open question associated with climate change is: How will firn permeability, meltwater percolation, and refreezing rates change with increased meltwater production and more, or thicker, ice lenses, and layers? Extending that line of thought, how much meltwater can be retained in the firn as opposed to draining from the ice sheet? Recent observations have shown that at locations experiencing increased melt, ice lenses can build up to form sufficiently thick layers that become impermeable to further meltwater percolation, yielding surface runoff in areas that could previously absorb the summer meltwater by means of vertical percolation (Charalampidis et al., 2016; Machguth et al., 2016; Mikkelsen et al., 2016). To better infer the consequences of these changes, cost-effective approaches to measuring in-situ field permeability are needed. Multiple measurements within a season and annually will also help to improve understanding of evolving permeability, and will help to constrain refreezing and the formation of ice lenses and layers.
Here we present a relatively simple and inexpensive method for measuring in-situ firn permeability using pneumatic testing. This technique is frequently used to characterize permeability of anisotropic soil, gravel, and rock formations in the design of soil vapor extraction systems for environmental remediation (Weinig, 1992). In April–May 2016, before the onset of the melt season, we conducted a field campaign to test the method at six sites on the Greenland Ice Sheet. The method is described below, followed by an explanation of how the tests were analyzed and permeability values inferred. The results presented here are primarily intended as proof of concept to demonstrate the utility of our method, while also highlighting the potential for more expansive application to explore the spatial and temporal distribution of poorly constrained firn permeability values used in surface mass balance models for Greenland, Antarctica, and other ice caps and alpine glaciers.
Methods
Pneumatic Testing Method and Field Setup
Pneumatic testing is a well-established technique for characterizing the permeability of soil, gravel, and rock, in the context of designing soil vapor extraction systems for environmental remediation (e.g., Johnson et al., 1990; Weinig, 1992). The method involves drilling boreholes, applying suction with a vacuum at known depth below an airtight seal in one borehole, and monitoring the air pressure response below a seal at known depth in another borehole some distance from the applied vacuum. A similar procedure can be customized for application to snow and firn. A schematic of this setup is shown in Figure 1, and a photograph of the field setup is shown in Figure 2.
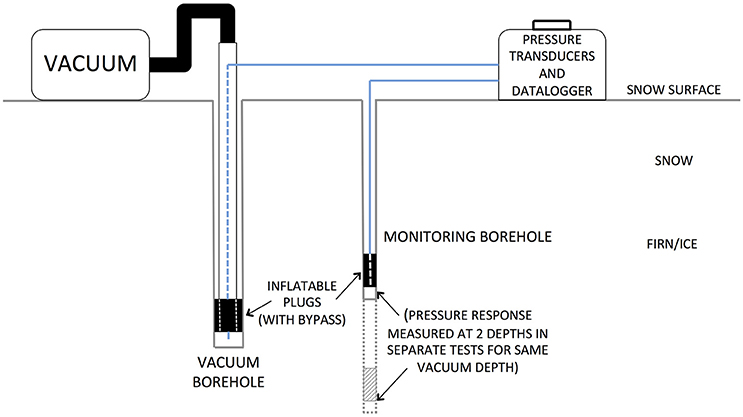
Figure 1. Schematic of pneumatic testing field setup. Vacuum is applied at depth in one borehole below a seal and the resulting pressure response is measured below a seal in another borehole, through tubing connected to a pressure gauge on the surface. For each depth of applied vacuum, pressure responses at two monitoring depths are recorded in separate tests.
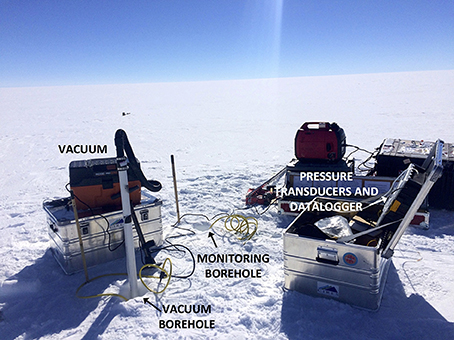
Figure 2. Photograph of pneumatic testing field setup.
We conducted tests at six locations on the Greenland Ice Sheet, with varying prevalence of ice lenses and layers in the stratigraphy, at various vacuum and monitoring point depths down to approximately 4 m depth at each site. The monitoring borehole was drilled at a radial distance of 1 m from the vacuum hole. We drilled boreholes by hand using a Kovacs Mark II coring drill for the vacuum hole and a Kovacs ice auger for the monitoring hole. Inflatable rubber plugs (Cherne Muni-Ball models 262,010 and 262,064) were used to seal the holes at depth. The plugs were inflated through tubes connected to a bicycle pump at the surface. Airflow through the snow and firn was induced using a portable wet/dry vacuum (Ridgid model WD4522) powered by a generator (Honda model EU2000T1A1). The flow rate of air was measured using a thermal anemometer (Dwyer model 471B). Pressure responses were recorded using analog differential pressure gauges (Dwyer Series 2000 Magnehelic) as well as a digital pressure transducer (Dwyer Series 607-3) connected to a Campbell Scientific CR1000 datalogger.
Alternative Setup—Drilling into a Firn Pit Wall
A modified experimental orientation was also employed at DYE-2 in south Greenland. In this case, boreholes were drilled horizontally into a large firn pit wall. A schematic of the vacuum and monitoring borehole orientation is shown in Figure 3, and a photograph is shown in Figure 4. The vacuum was applied 1 m deep into the wall, in a layer of firn bounded above by a 5 cm-thick ice layer and below by a 20 cm-thick ice layer (horizontal extent of the ice layers into the wall is unknown). For these tests, pressure responses were measured in sealed monitoring boreholes drilled 1 m deep into the wall at three locations: 1 m away in the same layer of firn as the vacuum (Monitoring Borehole 1), 20 cm above the upper ice layer (Monitoring Borehole 2), and 20 cm below the thicker, lower ice layer (Monitoring Borehole 3).
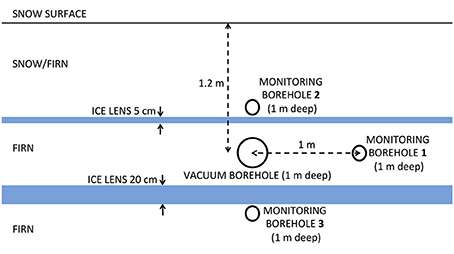
Figure 3. Schematic of alternative pneumatic test setup, drilling boreholes horizontally into a firn pit wall at DYE-2. Vacuum was applied in a sealed borehole drilled 1 m horizontally into a layer of firn bounded above and below by ice layers as observed in the pit wall. Pressure response to the vacuum was measured in sealed boreholes at three locations: (1) in the same layer of firn, (2) above a 5 cm-thick ice layer, and (3) below a 20 cm-thick ice layer. The monitoring point located above the thinner (5 cm) ice layer from the vacuum exhibited a lower pressure response compared to the response in the same layer of firn as the vacuum, and the monitoring point across the thicker (20 cm) ice layer from the vacuum exhibited a negligible response.
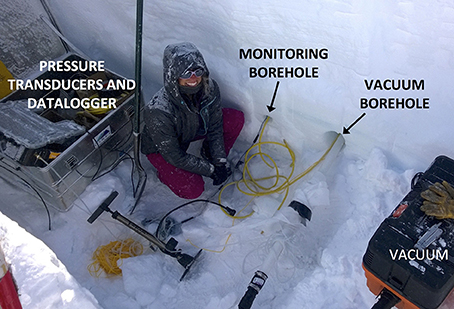
Figure 4. Photograph of alternative pneumatic test setup, drilling boreholes horizontally into a firn pit wall at DYE-2.
Analytical Solution for Air Flow through Firn
Permeability can be inferred from pneumatic field tests by considering analytical solutions for steady-state air flow through a porous, anisotropic medium (e.g., Shan et al., 1992). We treat air flow through snow and firn as Darcian flow of an ideal gas with constant viscosity and composition, and we assume the system to be isothermal. For the pressure solution, it is convenient to define a transformed variable u related to pressure (Collins, 1961):
where Pa is the ambient atmospheric pressure, and P is pressure at a given point in the snow or firn. It can be shown that under steady flow conditions, u satisfies the Laplace equation (Bear, 1972):
where k is the air permeability tensor. The analytical solution for u during our pneumatic tests is obtained from the solution of the three-dimensional Laplace equation with the vacuum treated as a point sink in spherical coordinates. To account for the constant-pressure surface boundary open to the atmosphere, we use the method of images, a well-established technique for the solution of the Laplace equation for flow toward a source/sink in semi-infinite or finite domains (e.g., Jeans, 1908; Milne-Thomson, 1938; Bear, 1972). With the vacuum (a pressure “sink”) applied at depth z0, adding an “image source” at height z0 above the surface forms a line of symmetry to ensure that u = 0 at the surface, where atmospheric pressure acts. Using a rescaled vertical coordinate to transform an anisotropic medium to an equivalent isotropic medium (Bear, 1972; Shan et al., 1992) yields:
where r is radial distance from the vacuum hole, z is depth below the surface, Q is volumetric air flow rate, kr is radial (horizontal) permeability, kz is vertical permeability, and z0 is the depth at which vacuum is applied. Note that this solution assumes a tensorial permeability that is constant (not spatially variable) within the domain, corresponding to an assumed constant heterogeneous firn pack for each test. In reality, firn structure may vary substantially across a depth range of a few meters; tests at multiple depths at each site capture the influence of these variations. Figure 5 presents an example pressure response field and air flow streamlines based on this solution for one of our pneumatic tests. Using two monitoring points for each vacuum depth, horizontal, and vertical permeability values are inferred by fitting the analytical u(r,z) field (Equation 4) to observed differential pressure responses by employing a least-squares optimization scheme (MATLAB nonlinear least-squares solver lsqnonlin). By dividing the equations for these two monitoring points, u1(r1,z1)/u2(r2,z2), it is also possible to directly solve for the anisotropy ratio kr/kz. Comparing the value of kr/kz obtained directly with that inferred from optimization serves as a useful check of the reliability of optimization results.
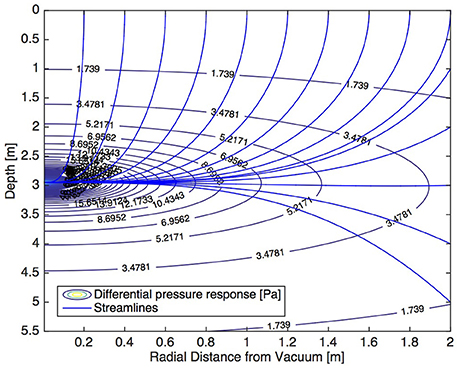
Figure 5. Sample pressure field due to air flow induced by a vacuum in one of our pneumatic tests. In this example, the vacuum is applied at 3 m depth. Snow surface is at the top of the plot. Labeled contour lines show the differential pressure response. Blue lines indicate air flow streamlines.
The solution for u can be modified to incorporate an impermeable layer at some depth rather than treating the domain as semi-infinite below the surface; with multiple boundaries, the method of images becomes more complicated. In this case, we need to apply an image source to account for the constant-pressure surface boundary as before, and also apply an image sink below the impermeable boundary to effectively cancel out the flux at that boundary. But the image source above the surface then creates an unbalanced flux across the lower boundary, and the image sink below the impermeable boundary creates a pressure drop at the surface, violating the boundary conditions, requiring additional images sources/sinks. For each pair of images added, these imbalances persist; the solution by the method of images with two boundaries thus requires an infinite series of images (Bear, 1972; Shan et al., 1992). The resulting series solution is convergent because the later images in the series are increasingly farther away from the finite domain of interest. Designating the impermeable boundary at the depth of the first ice layer with thickness ~20 cm or greater (according to stratigraphy from cores drilled at each site), we found that this had no effect on the pressure solution in our test domain, suggesting that the shallowest extensive ice layer is too deep to influence the pressure response in the overlying firn and thinner refrozen melt layers. The solution for u can also be modified to treat the vacuum as a line sink in the small section of open borehole below the plug, rather than as a point sink (Shan et al., 1992). The permeability values inferred using these modified analyses fell in the same range and exhibited the same anisotropy patterns as those obtained using the simpler solution (Equation 4) for a point-source in a semi-infinite domain.
Results
Inferred Firn Permeability and Anisotropy at Six Sites on the Greenland Ice Sheet with Different Stratigraphy
We pilot tested this method for inferring firn permeability from pneumatic testing in April–May 2016 before the onset of melt at six sites on the Greenland Ice Sheet (Figure 6). Site characteristics and specific test dates are listed in Table 1. Five of the sites (KAN-U, DYE-2, EKT, NASA-SE, and Saddle) are situated in south Greenland, near the Arctic Circle. These sites experience melt in some or most years; ice layers and lenses were observed in the firn cores drilled at each location and in snow pits. Ice layers are particularly abundant at KAN-U, which experiences the most melt of these five sites, and also at DYE-2. The sixth site, EastGRIP, is located farther north than the other sites and very rarely experiences melt, rendering it a useful control site for permeability of dry firn in the absence of refrozen lenses.
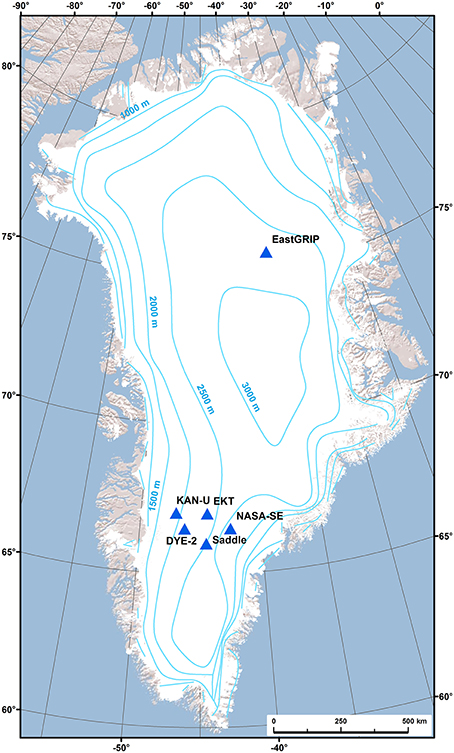
Figure 6. Map of field sites on the Greenland Ice Sheet where pneumatic tests were conducted in spring 2016. Labeled contours indicate ice surface elevation.
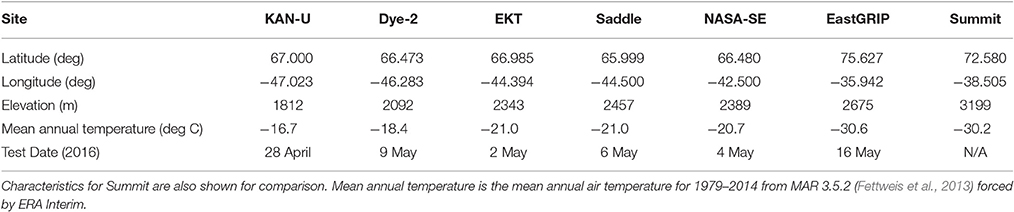
Table 1. Characteristics for sites on the Greenland ice sheet where permeability tests were conducted.
Using the analytical solution for air flow and optimization methods for parameter estimation described in Section Analytical Solution for air Flow through Firn, horizontal and vertical permeability were inferred for each test conducted at the field sites. Figure 7 presents the horizontal (kr, dashed line) and vertical (kz, solid line) permeability profiles for five sites, along with the depth of ice layers and lenses at each site (indicated by horizontal dark blue lines, as recorded from stratigraphy analysis of a firn core drilled near the pneumatic test site at each location). The horizontal extent of ice layers and lenses is not known. Permeability at KAN-U was investigated separately because of the thick ice layer at that site, and will be described below in Section Permeability in a Thick Ice Layer. The colored shading in Figure 7 represents possible ranges of kr and kz due to uncertainty in flow rate measurement. The depth range associated with each permeability estimate (vertical extent of the lines) corresponds to the depths of the two monitoring points where pressure response was measured for a given applied vacuum depth. In most cases, horizontal permeability is greater than vertical permeability. For tests that span several ice layers or lenses, this anisotropy is more pronounced, which intuitively makes sense: it is more difficult for air to flow vertically through ice layers, or around ice lenses, than to flow horizontally through the firn between layers. In some of the tests that span several ice layers or lenses (see the middle test at EKT, the middle and deepest tests at NASA-SE, the deepest test at Saddle, and the deepest test at DYE-2), the vertical permeability is very low (<1 × 10⁻¹⁰ m2). In other tests that span ice layers or lenses, however, the vertical permeability is not quite so low (for example, the top test at DYE-2 and the top and middle tests at Saddle). This distinction may be related to the horizontal extent of individual ice lenses, which was not measured. In contrast to the high anisotropy of tests spanning several ice layers, horizontal and vertical permeability at EastGRIP are more similar in magnitude, with vertical permeability even being slightly higher than horizontal permeability in the deeper tests at that location. It is reasonable to find low anisotropy here, considering that EastGRIP has very few ice lenses; the deeper tests span dry firn without even thin refrozen ice lenses. In the absence of ice lenses, it is possible to have higher vertical permeability than horizontal permeability due to metamorphic processes at the grain scale (Luciano and Albert, 2002; Calonne et al., 2012).
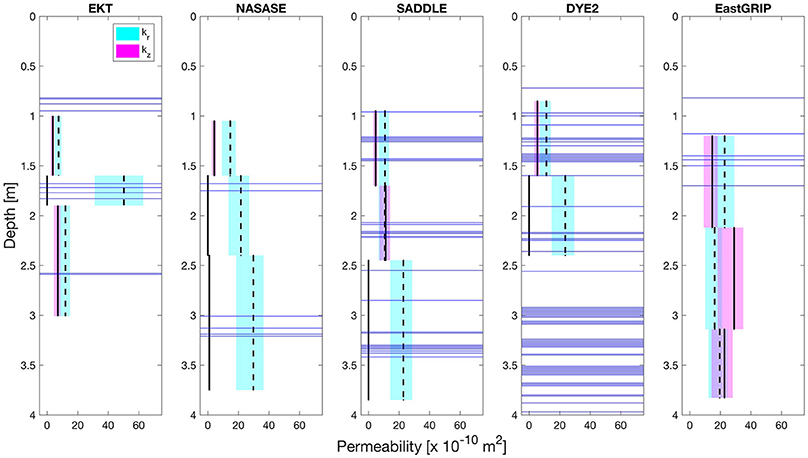
Figure 7. Inferred horizontal (kr) and vertical (kz) firn permeability values at five sites on the Greenland Ice Sheet. The vertical depth range for each estimate corresponds to the depth between the two monitoring point depths where differential pressure was measured for each vacuum depth. Horizontal dark blue lines indicate the depths of ice layers and lenses observed in cores at each site. Cyan and magenta shading represents inferred permeability limits based on the range of airflow rates produced by the vacuum in the field. In some cases that span several ice layers, the inferred vertical permeability is very low (kz < 1 × 10⁻¹⁰ m2, essentially impermeable).
In Table 2, we compare the anisotropy ratio kr/kz inferred from optimization with kr/kz from the direct solution of u1/u2 described in Section Analytical Solution for Air Flow through Firn. The results agree closely, with the exception of four tests that exhibit extremely high anisotropy across ice layers. For these tests that span several ice layers from which we infer very small kz values from optimization (and correspondingly large anisotropy ratios), a direct solution for the anisotropy ratio kr/kz is not found due to its large magnitude (the equations for u1 and u2 each approach 1/∞, so u1/u2 becomes similar to dividing zero by zero). This implies that the inferred values for kr and kz from optimization are more uncertain in these cases, but the overall inference of very low vertical permeability and high anisotropy across ice layers remains valid.
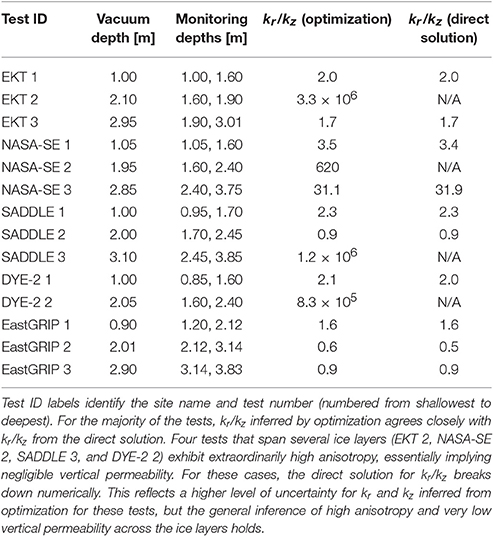
Table 2. Anisotropy ratio (kr/kz) for each test inferred from optimization and by direct solution.
Permeability in a Thick Ice Layer
Our lowest-elevation field site is KAN-U, which experiences the most melt each summer and, as a result, has the most prevalent refrozen ice layers. Firn cores drilled in spring 2016 at this site revealed a continuous solid ice layer from a depth of approximately 1.4–8 m. This configuration provides a unique field setup to illustrate the capabilities of our pneumatic test method for inferring permeability in the presence of thick sections of refrozen ice layers. At this site, differential pressure response was measured in a single borehole at the point of applied vacuum for incremental depths, from 0.2 m down to 2.0 m, shown in Figure 8A. An abrupt transition in the generated suction is apparent when the vacuum is applied in “solid” ice (below 1.4 m). The differential pressure measured at 1.8 m and 2.0 m is equal to that measured with the vacuum hose completely sealed, indicating that: (a) the thick refrozen ice layer is nearly impermeable, and (b) the inflatable plugs achieve a good seal against the borehole walls. Permeability values can be inferred from this test scenario using the analytical solution described in Section Analytical Solution for Air Flow through Firn. In this case, we consider the differential pressure measured just below the vacuum, and treat that pressure as uniform on a small sphere (with radius 5 cm) representing the open space in the vacuum below the borehole. For the two monitoring points needed for the analysis, we select two points on this sphere and employ the optimization methods for parameter estimation as described previously. Figure 8B presents horizontal and vertical permeability values inferred from the field tests at KAN-U. The results support what we might expect in this situation. In the top meter of snow and firn (with a few minor ice layers and lenses), horizontal permeability is greater than vertical permeability, but even the horizontal permeability is relatively low compared to our other sites (<5 × 10⁻¹⁰ m2). Both horizontal and vertical permeability generally decrease further with depth, and both become very small (<0.3 × 10⁻¹⁰ m2) in the thick ice below 1.5 m. This indicates that the meters-thick ice layer significantly decreases the permeability.
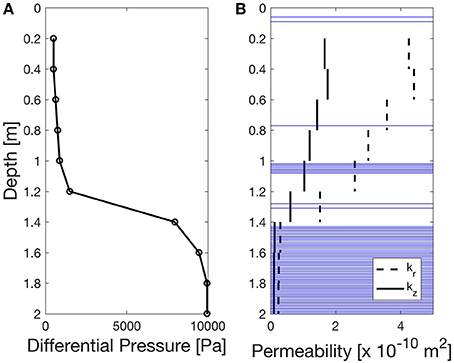
Figure 8. (A) Differential pressure measured in vacuum tests at KAN-U. (B) Inferred horizontal (kr) and vertical (kz) permeability values (depth of refrozen ice layers and lenses shown as blue horizontal lines). In both the differential pressures and permeability values, an abrupt transition is apparent between 1.2 and 1.4 m depth, corresponding to the transition to solid refrozen ice that extends from ~1.4 to 8 m at this site. The differential pressure measured at 1.8 m and 2.0 m is equal to that measured for a nearly perfect vacuum (i.e., sealing the vacuum hose). In the snow and firn above the thick ice, kr is greater than kz, and both generally decrease with depth until the transition to thick ice, where both become very small, reflecting the effective impermeability of the refrozen ice.
Pneumatic Tests into a Firn Pit Wall
We also conducted three additional tests at DYE-2 with the alternative test orientation involving boreholes drilled horizontally into a snow pit wall (shown in Figures 3, 4). First, the pressure response was observed in a borehole sealed 1 m deep, located 1 m radially away from the vacuum borehole, in the same layer of firn bounded by the ice layers (labeled Monitoring Borehole 1 in Figure 3); the measured differential pressure response here was 12.4 Pa. Next, the pressure was monitored in a borehole just above the 5 cm ice layer (Monitoring Borehole 2). In this case the differential pressure was 8.7 Pa, suggesting that this ice layer interferes with air flow but is not completely impermeable (the horizontal extent of the ice layer into the wall is unknown). For the third test (Monitoring Borehole 3), the pressure response was measured below the 20 cm-thick ice layer below the vacuum. The differential pressure response here was 1.2 Pa—a very small response, suggesting that the 20 cm-thick ice layer substantially diminishes vertical permeability.
Discussion
Comparison to Previously Published Values
Permeability measurements for Greenland firn have been previously published for Summit (Albert et al., 1996; Albert and Shultz, 2002; Luciano and Albert, 2002; Adolph and Albert, 2014). We attempted to conduct pneumatic tests at Summit during our field campaign, but suffered equipment failure in the extreme cold during our only opportunity for these tests (−33°C, with freezing fog). Our northern field site at EastGRIP, however, can be reasonably compared to Summit with similar surface temperatures (see Table 1); both sites experience very little melt and so consist of mainly dry firn. When they have occasionally experienced melt in the last several years (for example, in the high melt year 2012), the refrozen melt layers are very thin, on the order of 1–2 mm. Average snow and firn density measured in the top 3 m at Summit and EastGRIP in 2016 indicate densities approximately 21% higher at EastGRIP, owing primarily to lower accumulation rates. Adolph and Albert (2014) found, however, that there was not a direct relationship between permeability and density at Summit (for near-surface firn), so this difference in density does not necessarily undermine a comparison of permeabilities at the two sites.
The vertical permeability values measured for the top 3 m of snow and firn at Summit in 2000 typically fell between 2 and 100 × 10−10 m2 (Albert and Shultz, 2002). Albert et al. (1996) published both horizontal and vertical permeability for the top meter of snow at Summit, with values for both ranging between 2 and 60 × 10−10 m2. Horizontal and vertical permeability values were also reported at Summit by Luciano and Albert (2002), with a range of 10–65 × 10−10 m2. At EastGRIP, we infer vertical permeability (kz) in the range 10–40 × 10−10 m2, and horizontal permeability (kr) of 10–30 × 10−10 m2, which are consistent with the range reported for dry snow and firn at Summit. For our two deeper tests at EastGRIP (below 2 m), we infer vertical permeability to be slightly higher than horizontal permeability (kr/kz of 0.9 and 0.6 for the two depths, respectively); Luciano and Albert (2002) also found slightly higher vertical than horizontal permeability for comparable depths in dry firn at Summit. This anisotropy is likely due to firn microstructure; for example, Calonne et al. (2012) measured higher vertical than horizontal permeability (kr/kz ~0.6) in evolved depth hoar.
Uncertainty in Permeability Estimates
We wish to clearly articulate sources of error and uncertainty in our measurements and analysis. In this section we present confidence intervals associated with optimization for the inferred permeability values, the uncertainty associated with measurement error, and discuss practical difficulties that were encountered during the field tests.
Uncertainty Associated with Optimization
In Section Inferred Firn Permeability and Anisotropy at Six Sites on the Greenland Ice Sheet with Different Stratigraphy, we inferred permeability based on optimal fitting of our measured pressure responses with an analytical solution for air flow through an anisotropic porous medium. From the optimization process (using the MATLAB nonlinear least-squares solver lsqnonlin, https://www.mathworks.com/help/optim/ug/lsqnonlin.html), we obtain 95% confidence intervals associated with each inferred permeability value using the MATLAB function nlparci (https://www.mathworks.com/help/stats/nlparci.html, which uses the optimized parameter estimates, residuals, and Jacobian generated by lsqnonlin). Table 3 presents kr and kz inferred for each pneumatic test along with these confidence intervals. In most cases, the confidence intervals are narrow (<2 × 10⁻¹⁰ m2), indicating a clear optimum solution. In some cases, however, the confidence intervals are relatively large (up to 60 × 10−10 m2), and may even include nonphysical negative permeability values. These nonconforming cases correspond to tests that span several ice layers or lenses within the firn. The broad confidence intervals suggest that the assumption of a semi-infinite effective/equivalent homogeneous medium is not physically representative in these cases, where sets of distinct ice layers may act like impermeable boundaries.
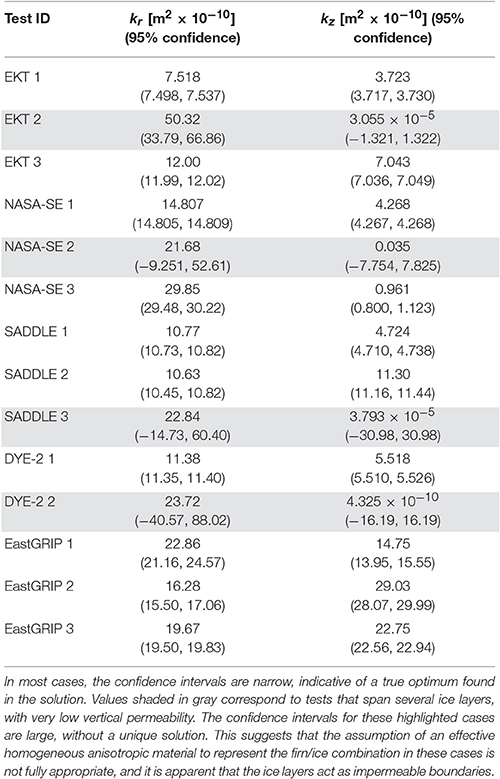
Table 3. Inferred permeability with 95% confidence intervals associated with the optimization method for parameter estimation.
To help confirm the robustness of the kr and kz estimates, sensitivity analysis of the root-mean-squared error (RMSE) between predictions and observations was performed by perturbing each parameter estimate (kr and kz) by ±5% about the optimal estimate. The contours of RMSE in parameter space visualize how well-defined the optima are, and also determine whether there are interactions between the parameter estimates. Figure 9 presents the resulting RMSE contours in measured pressure responses for each perturbation combination. In most cases, a clear optimum is apparent near the center of the contour plot. The RMSE contours are tilted, however, indicating some dependence between the kr and kz estimates (for two independent variables, the contours would appear as circles or ellipses with major and minor axes aligned with the horizontal or vertical axes). In some cases, there is no clear center to the RMSE contours, but rather the contour lines are vertical or near vertical; these cases correspond to those tests that span several ice layers and are essentially impermeable to vertical flow. The shape of the pressure RMSE contours in these cases shows that the RMSE is relatively insensitive to estimates of kz (note that kz is very small in these cases, with correspondingly small perturbations). As discussed previously, the optimized permeability is less well constrained for these cases that span several ice layers.
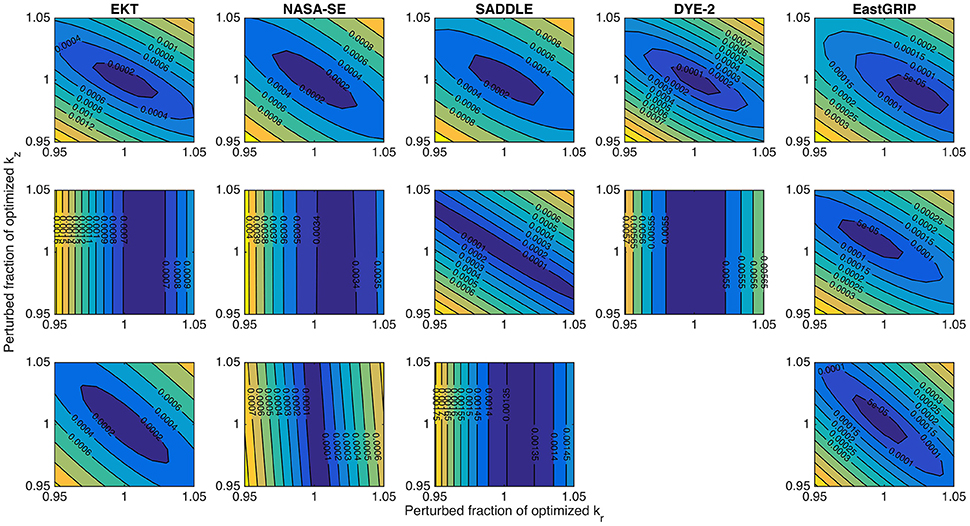
Figure 9. Root-mean-square error (RMSE) in pressure response for each pneumatic test are obtained by perturbing about the optimal estimates of permeabilities. Tests are shown for each site in order of depth. In most cases, a clear optimum is apparent near the center of the plot. The tilt of the RMSE contour lines indicates a dependence in the solution between kr and kz. In several cases (EKT 2, NASA-SE 2, NASA-SE 3, SADDLE 3, DYE-2 2), there is not a clear RMSE optimum. These cases correspond to tests that span several ice layers, with very low vertical permeability. The assumption of an effective homogeneous anisotropic material in these cases does not adequately represent the behavior resulting from distinct impermeable layers and results in higher uncertainties for kr estimates for these tests.
Uncertainty Due to Measurement Error
During our pneumatic tests, steady-state pressure responses were read from analog differential pressure gauges and recorded by hand in a field notebook. Because pressure responses to the vacuum are small (in the range of 1–10 Pa), any fluctuations due to wind or a slight tilt of the gauge box can cause unintended errors. All efforts were made in the field to eliminate these errors. Where possible, manually recorded pressure responses were also verified and confirmed by the digitally recorded pressure responses on the datalogger. Some tests were not recorded digitally due to power supply challenges in cold conditions. A comparison of steady-state differential pressures for all tests with both a digital and manual record reveals close agreement and only minor discrepancies between the two, with a median difference of 0.5 Pa. To estimate the uncertainty in inferred permeability associated with possible measurement error, we assume the error to be normally distributed with standard deviation σ = 0.5 Pa. We perturb the observed pressure responses for each pneumatic test with a random sample of 1,000 errors from this normal distribution and solve for the corresponding optimized kr and kz for each of the perturbations. Figure 10 presents the probability density function (PDF) for kr and kz for each test depth at each site. These distributions fall within the same range as seen before (5–60 × 10−10 m2 for kr, and 0–30 × 10−10 m2 for kz), and support the general patterns discussed above in Section Inferred Firn Permeability and Anisotropy at Six Sites on the Greenland Ice Sheet with Different Stratigraphy. In the presence of ice layers and lenses, kr is typically greater than kz. At EastGRIP, kr and kz are more similar in magnitude. Tests with a wider distribution spread correspond to tests in which the measured pressure response was low, making them more sensitive to pressure measurement error.
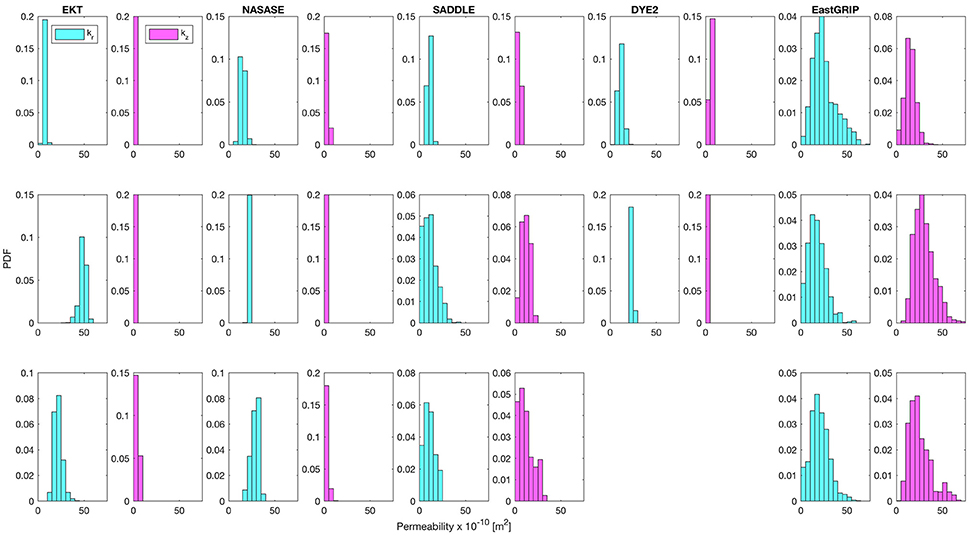
Figure 10. Permeability inferred from pneumatic tests with perturbations of measured pressure responses to account for measurement error. Assuming a normal distribution of measurement error with μ = 0, σ = 0.5 Pa, we applied the optimization solution to find kr and kz for 1,000 randomly sampled errors for each pneumatic test. The resulting probability density function (PDF) of kr and kz for each test at each site is shown. Referencing the ice layer/lens depths shown in Figure 7, these distributions support the finding that in general, kr > kz in the presence of ice layers or lenses. At EastGRIP, kr and kz are more similar in magnitude. Broader PDF distributions correspond to tests in which low pressure responses were observed, making these tests more sensitive to measurement error.
Equipment Challenges and Flow Rate Uncertainty
The thermal anemometer we used for measuring flow rate was damaged and ceased to function partway through the field campaign after exposure to particularly cold conditions (below −24°C). The flow measurements that were recorded successfully prior to its damage, however, correspond to a fairly narrow range of 3.5–7.0 ms−1. Because of this uncertainty (and also the general fluctuating nature of thermal anemometer flow rate measurement), shaded error bars on the inferred permeability values presented in Figure 7 are included to reflect the range in flow rate generated by the portable wet/dry vacuum. Permeability values corresponding to the mean measured flow rate (5.1 ms−1) are indicated as solid (kz) or dashed (kr) black lines on the figure.
The inflatable rubber plugs used to seal the boreholes at depth were inflated through tubes connected to a bicycle pump at the surface. The integrity of the seals against the borehole walls is important. On especially cold days (below −20°C), the tube connections to the pump contracted and required constant vigilance to ensure proper seals were maintained. Only tests in which solid hand-tight seals (tugging on the attached tubing yielded no movement) held in both the vacuum and monitoring boreholes for the duration of a test were recorded and used in the analysis above. If a seal was lost, the plug and equipment noticeably dropped to rest at the bottom of the borehole. In future applications, a portable air compressor could be used to maintain and ensure constant pressure in the plugs, and more expensive custom silicone plugs could be used, with temperature ratings for all connections and equipment down to −40°C. While it is certainly preferable to conduct the pneumatic tests in less extreme cold, logistics in the field do not always allow for such fair-weather flexibility.
Conclusions and Recommendations for Future Work
From these initial tests on the Greenland Ice Sheet, we have found in-situ pneumatic testing to be a promising method that can be used to infer horizontal and vertical firn permeability in the field. Accurate permeability estimates are necessary for meltwater infiltration, transport, and retention models that estimate runoff, a key component of surface mass balance. In general, we find higher anisotropy in firn permeability across refrozen ice layers and lenses than in dry firn. In the presence of ice layers and lenses, vertical permeability ranges from 0–30 × 10−10 m2, with horizontal permeability on the order of 5–60 × 10−10 m2. In dry firn without refrozen lenses or layers, both vertical and horizontal permeability range between approximately 10–30 × 10−10 m2.
Researchers using this method in future campaigns could employ more pressure transducers at various monitoring depths and distances from the vacuum for each test to generate a more complete picture of the permeability structure at a given site. To avoid being limited by temperature conditions during available test opportunities during a field campaign, all equipment should be rated down to −40°C Additionally, a stronger vacuum motor could potentially be used to stimulate measureable pressure responses farther away from the vacuum (taking care not to destroy the firn structure itself). Finally, it would be particularly illuminating to examine in detail the change in permeability over multiple years at locations on the Greenland Ice Sheet with increasing meltwater production. Such a study has the potential to clarify changes accompanying increased ice layer and ice lens formation that results from a warming climate, with ramifications for meltwater percolation and surface mass balance of the entire ice sheet. This technique is also suitable for broad application in Antarctica and other glaciers and ice caps.
Author Contributions
AS designed, built, and tested the equipment, performed field experiments, analyzed data, and wrote the majority of the manuscript. HR provided guidance in the experimental design and various analysis techniques, and assisted in writing the manuscript. EW was involved in the conceptual and technical design, helped build the field setup, conducted preliminary tests in Colorado, and provided valuable insight on soil-vapor-extraction system design. MM offered the opportunity to collaborate in Greenland to conduct the field tests, assisted in manuscript preparation, and provided encouragement and expertise on all firn-related matters. WC and CS assisted in field experiments in Greenland, helped design site-specific tests, and were involved in preparation of the manuscript.
Funding
This work was funded primarily by a Dean's Graduate Student Research Grant from the Graduate School at the University of Colorado. Additional support was provided by an American Geophysical Union Cryosphere Innovation Award for Students, a NASA Earth and Space Sciences Fellowship (NNX14AL24H), and an Innovative Seed Grant from the University of Colorado. Logistical support was provided in collaboration with the FirnCover project (NASA ROSES grant NNX15AC62G).
Conflict of Interest Statement
The authors declare that the research was conducted in the absence of any commercial or financial relationships that could be construed as a potential conflict of interest.
Acknowledgments
Many thanks to the FirnCover 2016 team for support and camaraderie in the field (MM, CS, WC, Darren Hill, Baptiste Vandecrux, Shawn Marshall, Samira Samimi, Achim Heilig, Bastian Gerling, and Leander Gambal), and also to CH2MHill Polar Field Services.
References
Adolph, A. C., and Albert, M. R. (2014). Gas diffusivity and permeability through the firn column at Summit, Greenland: measurements and comparison to microstructural properties. Cryosphere 8, 319–328. doi: 10.5194/tc-8-319-2014
Albert, M. R., Arons, E. M., and Davis, R. E. (1996). “Firn properties affecting gas exchange at Summit, Greenland: ventilation possibilities,” in Chemical Exchange between the Atmosphere and Polar Snow, eds E. W. Wolff and R. C. Bales (Berlin; Heidelberg: Springer), 561–565.
Albert, M. R., and Perron, F. E. (2000). Ice layer and surface crust permeability in a seasonal snow pack. Hydrol. Process. 14, 3207–3214. doi: 10.1002/1099-1085(20001230)14:18%3C3207::AID-HYP196%3E3.3.CO;2-3
Albert, M. R., and Shultz, E. F. (2002). Snow and firn properties and air–snow transport processes at Summit, Greenland. Atmos. Environ. 36, 2789–2797. doi: 10.1016/S1352-2310(02)00119-X
Ambach, W., Blumthaler, M., and Kirchlechner, P. (1981). Application of the gravity flow theory to the percolation of melt water through firn. J. Glaciol. 27, 67–75.
Bader, H. (1939). “Mineralogische und strukturelle Charakterisierung des Schnees und seiner Metamorphose,” in Der Schnee und seine Metamorphose, eds H. Bader, J. Neher, O. Eckel, C. Thams, R. Haefeli (Bern: Kummerly & Frey), 1–61. (Beiträge zur Geologie der Schweiz, Geotechnische Serie Hydrologie 3, Transl. Tienhaven, J. C. V., 1954: Snow and its metamorphism, SIPRE Translations, 14: 1–55).
Bender, J. A. (1957). Air Permeability of Snow. US Army Snow Ice and Permafrost Research Establishment. Wilmette, IL: Corps of Engineers.
Calonne, N., Geindreau, C., Flin, F., Morin, S., Lesaffre, B., Du Roscoat, S. R., et al. (2012). 3-D image-based numerical computations of snow permeability: links to specific surface area, density, and microstructural anisotropy. Cryosphere 6, 939–951. doi: 10.5194/tc-6-939-2012
Charalampidis, C., van As, D., Colgan, W., Fausto, R., MacFerrin, M., and Machguth, H. (2016). Thermal tracing of retained meltwater in the lower accumulation area of the southwestern Greenland ice sheet. Ann. Glaciol. 57, 1–10. doi: 10.1017/aog.2016.2
Colbeck, S. C. (1975). A theory for water flow through a layered snowpack. Water Res. Res. 11, 261–266.
Courville, Z. R., Albert, M. R., Fahnestock, M. A., Cathles, L. M., and Shuman, C. A. (2007). Impacts of an accumulation hiatus on the physical properties of firn at a low-accumulation polar site. J. Geophys. Res. 112. doi: 10.1029/2005JF000429
Courville, Z., Hörhold, M., Hopkins, M., and Albert, M. (2010). Lattice-Boltzmann modeling of the air permeability of polar firn. J. Geophys. Res. 115:F04032. doi: 10.1029/2009JF001549
Fettweis, X., Franco, B., Tedesco, M., van Angelen, J. H., Lenaerts, J. T. M., van den Broeke, M. R., et al. (2013). Estimating the Greenland ice sheet surface mass balance contribution to future sea level rise using the regional atmospheric climate model MAR. Cryosphere 7, 469–489. doi: 10.5194/tc-7-469-2013
Fierz, C., Armstrong, R. L., Durand, Y., Etchevers, P., Greene, E., McClung, D. M., et al. (2009). “The International classification for seasonal snow on the ground,” in IHP-VII Technical Documents in Hydrology N°83, IACS Contribution N°1, UNESCO-IHP (Paris).
Harper, J., Humphrey, N., Pfeffer, W. T., Brown, J., and Fettweis, X. (2012). Greenland ice-sheet contribution to sea-level rise buffered by meltwater storage in firn. Nature 491, 240–243. doi: 10.1038/nature11566
Hörhold, M. W., Albert, M. R., and Freitag, J. (2009). The impact of accumulation rate on anisotropy and air permeability of polar firn at a high-accumulation site. J. Glaciol. 55, 625–630. doi: 10.3189/002214309789471021
Jeans, J. H. (1908). The Mathematical Theory of Electricity and Magnetism. Cambridge: University Press.
Johnson, P. C., Stanley, C. C., Kemblowski, M. W., Byers, D. L., and Colthart, J. D. (1990). A practical approach to the design, operation, and monitoring of in situ soil-venting systems. Groundwater Monit. Remediation 10, 159–178.
Krabill, W., Hanna, E., Huybrechts, P., Abdalati, W., Cappelen, J., Csatho, B., et al. (2004). Greenland ice sheet: increased coastal thinning. Geophys. Res. Lett. 31:L24402. doi: 10.1029/2004GL021533
Luciano, G. L., and Albert, M. R. (2002). Bidirectional permeability measurements of polar firn. Ann. Glaciol. 35, 63–66. doi: 10.3189/172756402781817095
Machguth, H., MacFerrin, M., van As, D., Charalampidis, C., Colgan, W., Fausto, R. S., et al. (2016). Greenland meltwater storage in firn limited by near-surface ice formation. Nat. Clim. Chang. 6, 390–393. doi: 10.1038/nclimate2899
Marsh, P., and Woo, M. K. (1985). Meltwater movement in natural heterogeneous snow covers. Water Resour. Res. 21, 1710–1716.
Mikkelsen, A. B., Hubbard, A., MacFerrin, M., Box, J. E., Doyle, S. H., Fitzpatrick, A., et al. (2016). Extraordinary runoff from the Greenland ice sheet in 2012 amplified by hypsometry and depleted firn retention. Cryosphere 10, 1147–1159. doi: 10.5194/tc-10-1147-2016
Pfeffer, W. T., Meier, M. F., and Illangasekare, T. H. (1991). Retention of Greenland runoff by refreezing: implications for projected future sea level change. J. Geophys. Res. 96, 22117–22124. doi: 10.1029/91JC02502
Rignot, E., Velicogna, I., Van den Broeke, M. R., Monaghan, A., and Lenaerts, J. T. M. (2011). Acceleration of the contribution of the Greenland and Antarctic ice sheets to sea level rise. Geophys. Res. Lett. 38:L05503. doi: 10.1029/2011GL046583
Shan, C., Falta, R. W., and Javandel, I. (1992). Analytical solutions for steady state gas flow to a soil vapor extraction well. Water Resour. Res. 28, 1105–1120. doi: 10.1029/91WR02986
Shimizu, H. (1970). Air permeability of deposited snow. Contrib. Inst. Low Temperature Sci. A 22, 1–32.
Sommerfeld, R. A., and Rocchio, J. E. (1993). Permeability measurements on new and equitemperature snow. Water Res. Res. 29, 2485–2490. doi: 10.1029/93WR01071
Keywords: permeability, firn, snow, Greenland, pneumatic testing, ice lenses, anisotropy
Citation: Sommers AN, Rajaram H, Weber EP, MacFerrin MJ, Colgan WT and Stevens CM (2017) Inferring Firn Permeability from Pneumatic Testing: A Case Study on the Greenland Ice Sheet. Front. Earth Sci. 5:20. doi: 10.3389/feart.2017.00020
Received: 01 September 2016; Accepted: 16 February 2017;
Published: 03 March 2017.
Edited by:
Alun Hubbard, Aberystwyth University, UKReviewed by:
Nander Wever, École Polytechnique Fédérale de Lausanne (EPFL), SwitzerlandStefan Ligtenberg, Utrecht University, Netherlands
Copyright © 2017 Sommers, Rajaram, Weber, MacFerrin, Colgan and Stevens. This is an open-access article distributed under the terms of the Creative Commons Attribution License (CC BY). The use, distribution or reproduction in other forums is permitted, provided the original author(s) or licensor are credited and that the original publication in this journal is cited, in accordance with accepted academic practice. No use, distribution or reproduction is permitted which does not comply with these terms.
*Correspondence: Aleah N. Sommers, aleah.sommers@colorado.edu