Composition and Transformation of Dissolved Organic Matter in the Baltic Sea
 Michael Seidel1*
  Marcus Manecki1,2
  Daniel P. R. Herlemann2
  Barbara Deutsch3† Detlef Schulz-Bull2
  Klaus Jürgens2
  Thorsten Dittmar1
- 1Research Group for Marine Geochemistry (ICBM-MPI Bridging Group), Institute for Chemistry and Biology of the Marine Environment (ICBM), Carl von Ossietzky University of Oldenburg, Oldenburg, Germany
- 2Leibniz Institute for Baltic Sea Research, Warnemünde (IOW), Germany
- 3Baltic Sea Centre, Stockholm University, Stockholm, Sweden
The processing of terrestrial dissolved organic matter (DOM) in coastal shelf seas is an important part of the global carbon cycle, yet, it is still not well understood. One of the largest brackish shelf seas, the Baltic Sea in northern Europe, is characterized by high freshwater input from sub-arctic rivers and limited water exchange with the Atlantic Ocean via the North Sea. We studied the molecular and isotopic composition and turnover of solid-phase extractable (SPE) DOM and its transformation along the salinity and redox continuum of the Baltic Sea during spring and autumn. We applied ultrahigh-resolution mass spectrometry and other geochemical and biological approaches. Our data demonstrate a large influx of terrestrial riverine DOM, especially into the northern part of the Baltic Sea. The DOM composition in the central Baltic Sea changed seasonally and was mainly related to autochthonous production by phytoplankton in spring. Especially in the northern, river-dominated basins, a major fraction of riverine DOM was removed, likely by bio- and photo-degradation. We estimate that the removal rate of terrestrial DOM in the Baltic Sea (Bothnian Bay to the Danish Straits/Kattegat area) is 1.6–1.9 Tg C per year which is 43–51% of the total riverine input. The export of terrestrial DOM from the Danish Straits/Kattegat area toward the North Sea is 1.8–2.1 Tg C per year. Due to the long residence time of terrestrial DOM in the Baltic Sea (total of ca. 12 years), seasonal variations caused by bio- and photo-transformations and riverine discharge are dampened, resulting in a relatively invariant DOM molecular and isotopic signature exported to the North Sea. In the deep stagnant basins of the Baltic Sea, the DOM composition and dissolved organic nitrogen concentrations changed seasonally, likely because of vertical particle transport and subsequent degradation releasing DOM. DOM in the deep anoxic basins was also enriched in sulfur-containing organic molecules, pointing to abiotic sulfurization of DOM under sulfidic conditions.
Introduction
Shelf seas are often strongly influenced by riverine inputs of nutrients and organic matter. Although they represent only a small part of the total ocean, about 20% of the marine organic matter production and 80% of organic matter deposition to ocean sediments occurs there (Borges, 2005). Yet, the carbon cycling in coastal waters is still not well understood, partly because the different carbon sources and sinks are highly complex (Gattuso et al., 1998; Ward et al., 2017).
In coastal shelf seas and estuaries, dissolved organic matter (DOM) is derived from land plants, riverine and autochthonous (marine) primary production (Stedmon et al., 2010; Bauer and Bianchi, 2011; Osburn and Stedmon, 2011; Deutsch et al., 2012). Removal and transformation of terrestrial DOM occurs through processes such as flocculation (Sholkovitz et al., 1978), microbial and photo-degradation (Hernes and Benner, 2003; Obernosterer and Benner, 2004; Gonsior et al., 2009; Spencer et al., 2009; Stubbins et al., 2010). Complete remineralization releases inorganic chemical species that then serve as nutrients for aquatic microbes and phytoplankton (Vähätalo and Zepp, 2005). High concentrations of chromophoric DOM in many estuaries limit primary production due the lower light penetration in the water column (Urtizberea et al., 2013). Studying and untangling these features still poses a major challenge because these processes often occur simultaneously, and because of the dynamic nature of estuarine systems (Bauer and Bianchi, 2011).
The Baltic Sea is a shelf sea with high inputs of nutrients from surrounding rivers that stimulate large phytoplankton blooms from spring to autumn, which effectively take up CO2. At the same time, high primary production of organic matter (OM) stimulates heterotrophic activity, which is further enhanced by the input of terrestrial DOM from rivers. The net uptake or release of atmospheric CO2 differs for the different subbasins of the Baltic Sea (Thomas et al., 2010; Kuliński and Pempkowiak, 2011; Gustafsson et al., 2014; Ylöstalo et al., 2016): the central Baltic Sea is a CO2 sink, while the northern Bothnian Bay is a weak source of CO2 to the atmosphere (Löffler et al., 2012; Schneider et al., 2014).
It is likely that increasing temperature and precipitation will lead to a higher riverine export of terrestrial DOM (Voss et al., 2011; Räike et al., 2016). Understanding the fate of this enhanced input of terrestrial carbon in sub-arctic shelf seas along marine-terrestrial and redox-gradients is therefore important. The Baltic Sea is an ideal system to study the biogeochemical cycling of DOM in terrestrial-to-marine and in oxic-to-anoxic gradients in detail, because of its estuarine character in combination with long water residence times ranging from months to years (Savchuk, 2005). The Baltic Sea in northern Europe is a semi-enclosed, brackish marginal sea. It is characterized by limited water exchange with the Atlantic Ocean via the North Sea and high freshwater input from rivers. The shallowness and infrequent inflow of saline and dense North Sea water causes a permanent stratification in the central Baltic Proper at water depths >60 m (Kuliński and Pempkowiak, 2012). The northern drainage basin is dominated by sub-arctic boreal forests while the southern basin is dominated by agriculture and high population density. Consequently, parts of the southern Baltic Sea are threatened by eutrophication and extension of bottom water anoxia (Thomas et al., 2010). Hypoxic conditions are reached when oxygen concentrations fall below 2 mL L−1 and alternative terminal electron acceptors, such as nitrate and sulfate, are used during heterotrophic degradation of organic matter by microbes (Conley et al., 2009). Microbial sulfate reduction causes sulfidic conditions in the deep anoxic basins of the central Baltic Sea (Savchuk, 2005; Voss et al., 2011).
Previous studies have used molecular biomarkers, isotopes, and optical properties to differentiate marine and terrestrial sources of DOM in the Baltic Sea (Højerslev et al., 1996; Bianchi et al., 1997; Stedmon et al., 2000, 2010; Alling et al., 2008; Osburn and Stedmon, 2011; Deutsch et al., 2012). For example, the concentration of suspended lignin phenols (unique biomarkers for vascular plants, e.g., Hernes and Benner, 2003) decreased from north to the south due to high freshwater inflow into the northern Baltic Sea (Bianchi et al., 1997). Stable carbon isotope ratios of high-molecular weight (HMW) DOM revealed a non-conservative behavior and removal of terrestrial HMW DOM in the Baltic Sea (Alling et al., 2008; Deutsch et al., 2012). Residence times for terrestrial HMW DOM ranged from 2.8 years in the northern to 4.5 years in the southern Baltic Sea, and more than 50% of it was proposed to be removed in the coastal Baltic Sea (Deutsch et al., 2012). Osburn and Stedmon (2011) used optical and chemical DOM properties and estimated that 0.8 Tg yr−1 terrestrial dissolved organic carbon (DOC) was exported from the Baltic to the North Sea. The molecular composition, the transformation and the export of low molecular weight terrestrial DOM, however, remains unexplored.
Ultrahigh-resolution Fourier-transform ion cyclotron resonance mass spectrometry (FT-ICR-MS) is a powerful tool to deepen our understanding of DOM processing in estuarine settings, because it resolves thousands of molecular formulae in the very complex DOM mixtures. Consequently, this technique was used to study the transformation of DOM in a wide range of aquatic systems, including terrestrial-to-marine and oxic-to-anoxic transition zones (Koch et al., 2005; Kim et al., 2006; Sleighter and Hatcher, 2008; Schmidt et al., 2009; Longnecker and Kujawinski, 2011; Lechtenfeld et al., 2013). For example, in the Delaware Estuary (USA), compositional differences at the molecular level were not reflected in changes of DOC concentrations (Osterholz et al., 2016). Several other studies have shown that the transformation of terrestrial and the new production of autochthonous (marine) DOM compounds leave characteristic molecular imprints (Sleighter and Hatcher, 2008; Kujawinski et al., 2009; Medeiros et al., 2015a,b; Seidel et al., 2015b). Aromatic terrestrial DOM compounds generally decrease along salinity gradients while the DOM heteroatom content increases due to autochthonous production (Sleighter and Hatcher, 2008; Osterholz et al., 2016). Likewise, the alteration of DOM under different redox-regimes can leave identifiable molecular imprints such as the relative enrichment of sulfur-containing compounds (Schmidt et al., 2009; Seidel et al., 2014, 2015a; Sleighter et al., 2014; Gomez-Saez et al., 2016).
Here we used ultrahigh-resolution mass spectrometry to determine the DOM molecular composition in the Baltic Sea from the sub-arctic north to the boreal south during spring and autumn sampling and relate it to geochemical and biological tracers. We aimed to answer the following research questions: What is the composition and the fate of DOM from marine and terrestrial sources in the Baltic Sea? How do the anoxic conditions influence the DOM composition and transformations? How do DOM and carbon fluxes to the North Sea vary seasonally?
Materials and Methods
Study Site
The Baltic Sea consists of five major basins, the Bothnian Bay, the Bothnian Sea, the Baltic Proper, the Gulf of Riga, and the Gulf of Finland (Figure 1). The freshwater inflow to the Baltic Sea is ~480 km3 yr−1, of which 200 and 100 km3 yr−1 are received by the Bothnian Bay (e.g., inflow of the Kalix River) and the Gulf of Finland (Neva River), respectively (Voss et al., 2011). Surface salinity ranges from two in the northernmost Bothnian Bay to >20 in the Kattegat and >30 in the Skagerrak. Deep-water salinity is 3–7 in the Bothnian Sea >50 m depth and 10–13 in the central Baltic Sea >60 m depth (Kullenberg and Jacobsen, 1981; Voss et al., 2011). Due to the shallow connection, water exchange between the Baltic Sea and the North Sea is limited. Following a typical estuarine circulation pattern, North Sea water enters through the Skagerrak and Kattegat at the bottom while brackish Baltic Sea water builds an outflow of water on top. The halocline in the central Baltic Sea at about 60 m limits vertical water mixing, and bottom water exchange between the deep basins of the Baltic Sea is further limited by sills. This causes the development of bottom water anoxia in the deep basins such as the Gotland and Landsort Deeps.
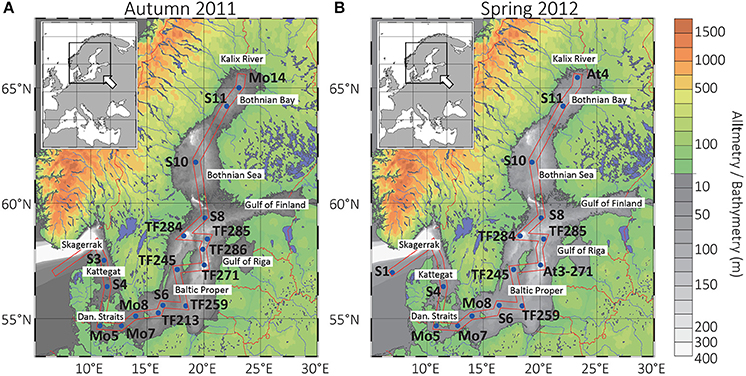
Figure 1. Map of the Baltic Sea with sampling stations. Sampling transects in autumn 2011 (A) and in spring 2012 (B). The Gotland and Landsort Deeps are located at stations TF271 (autumn), At3-271 (spring), and TF284 (autumn and spring), respectively. Dan. Straits, Danish Straits.
Sampling, Chemical, and Biological Analyses
Samples were collected during two cruises with R/V Meteor, in November/December 2011 (leg M86/1, autumn), and in May/June 2012 (leg M87/3, spring; Figure 1). Sampling in 2012 covered the spring flood of sub-arctic rivers draining large permafrost areas in the Northern Baltic region.
Conductivity, temperature, chlorophyll a fluorescence and dissolved oxygen concentrations of the water samples were measured in situ using a conductivity-temperature-depth sensor (Sea-Bird 911 CTD), a fluorometer (Wetlabs ECO FLNTU), and a dissolved oxygen sensor (Sea-Bird SBE43) connected to the sampling rosette.
Dissolved inorganic phosphate, nitrite, nitrate, ammonium, and silicate concentrations were measured in filtered samples following standard photometric methods (Grasshoff et al., 1999), using a continuous-flow analyzer (FLOWSYS, Alliance Instruments). The samples were filtered through pre-combusted Whatman GF/F filters and stored at −20°C until analysis. Ammonium was determined directly after sampling using a UV mini 1,240 photometer (Shimadzu). Precision was <10%, and detection limits were: nitrite 0.05 μM, nitrate 0.125 μM, ammonium 0.5 μM, phosphate 0.125 μM, silicate 0.5 μM. Dissolved organic nitrogen concentrations (DON) were calculated as difference between total dissolved nitrogen (TDN) and nitrate + nitrite + ammonium concentrations.
DOC and TDN were measured in the filtered and acidified (pH 2, HCl, p.a.) water samples by high temperature catalytic oxidation on a Shimadzu TOC-VCPH instrument. Analytical accuracy and precision were tested against the deep-sea reference sample (D. Hansell, University of Miami, USA) and were better than 5%.
DOM was extracted from 250 mL of filtered and acidified (HCl, pH 2, p.a.) water as described by Dittmar et al. (2008) using solid phase extraction (SPE) with cartridges filled with a styrene divinyl benzene polymer (Agilent Bond Elut PPL, 1 g). The methanol extracts were stored frozen in the dark until further analysis. The extraction efficiencies were determined as SPE-DOC divided by bulk DOC concentrations. SPE-DOC was determined by drying an aliquot of the SPE-DOM extract (at 40°C) and re-dissolving it in ultrapure water.
The stable carbon isotope composition was determined on SPE-DOM. Extracts containing ca. 20 μg of DOC were pipetted into Sn caps (IVA, Germany) and subsequently dried at 40°C in an oven. The isotopic composition was analyzed in duplicates on an isotope-ratio-monitoring mass spectrometer (Finnigan MAT 252, Bremen, Germany) via a Conflo II split interface. The stable carbon isotope ratios are reported in δ notation relative to the Vienna Pee Dee Belemnite. Precision and accuracy was <0.5‰ and procedural blanks did not yield detectable amounts of carbon isotope contamination.
For bacterial enumeration, 4 mL samples were fixed for 1 h with 400 μL of 1% (final concentration) paraformaldehyde and 0.5% (final concentration) glutaraldehyde, shock frozen in liquid nitrogen, and stored at −80°C until processed by flow cytometry. Samples were measured on a FacsCalibur bench cytometer (Becton Dickinson) using a modification of the method of Gasol et al. (1999). Briefly, 0.2-μm-filtered SYBR Green solution (2.4 M potassium citrate, 0.2 M dimethyl sulfoxide and 5 μL SYBR Green) was mixed with 300 μL of the sample. The mixture was incubated for 30 min in the dark and measured for 3 min in a flow cytometer at a medium, previously determined flow rate. The diluted bead solution was microscopically evaluated against the measurements received by the flow cytometry. The flow diagrams were evaluated using the software CellQuestPro. Cells with chlorophyll autofluorescence (including cells of Synechococcus, picoeukaryotes, and nanoeukaryotes) were measured without SYBR Green staining based on autofluorescence in the FL2 (phycoerythrin) and FL3 (chlorophyll a) detectors of the FacsCalibur bench cytometer as described by Gasol et al. (1999).
FT-ICR-MS Analysis
The methanol extracts were diluted with ultrapure water and methanol (MS grade) to yield a DOC concentration of 10 mg L−1 in 1:1 methanol:water (v/v) for the analysis with FT-ICR-MS (15 Tesla solariX, Bruker Daltonik). We used electrospray ionization (ESI) in negative mode. Instrument settings and molecular formulae assignments are described in detail in Seidel et al. (2014). The capillary voltage was 4 kV in negative mode. Ions were accumulated in the hexapole for 0.3 s and data were acquired in broadband mode using 4 megaword data sets and a scanning range of 150–2,000 Da with 500 scans accumulated per mass spectrum. Mass spectra were calibrated internally with a list of known compounds in the targeted mass range (achieved mass accuracy <0.1 ppm). Molecular formulae were assigned to peaks with a signal-to-noise ratio >4 applying the criteria described by Koch et al. (2007) with a mass tolerance of <0.5 ppm. The signal intensities of peaks with assigned molecular formulae were normalized to the sum of all peak intensities with identified molecular formulae in each sample, and normalized peak intensities were multiplied by a factor of 10,000. The aromaticity and the degree of unsaturation of compounds were assessed using the modified aromaticity index (AImod; Koch and Dittmar, 2006, 2016). This parameter was developed to identify aromatic and condensed aromatic structures in DOM molecular formulae data acquired by ultrahigh-resolution MS. AImod values >0.5 are indicative for aromatic compounds, AImod values ≥0.67 are unambiguous indicators for condensed aromatic compounds. Intensity-weighted averages of AImod, number of atoms per molecular formula (carbon, C, hydrogen, H, oxygen, O, nitrogen, N, sulfur, S, and phosphorus, P), and molar ratios (hydrogen-to-carbon, H/C and oxygen-to-carbon, O/C) were calculated for each sample by considering the peak intensity of each assigned molecular formula as described in Seidel et al. (2014).
Molecular compound groups were assigned to molecular formulae as described in Seidel et al. (2014): group (1), polycyclic aromatics (PCAs, AImod >0.66), including condensed combustion-derived dissolved black carbon if C > 15 (Dittmar and Koch, 2006), (2) highly aromatic compounds with aliphatic side chains (HACs, Koch and Dittmar, 2006) (0.66 ≥ AImod ≥ 0.50), (3) highly unsaturated compounds (HUCs, AImod < 0.50 and H/C < 1.5), including lignin degradation products (Stenson et al., 2003) and carboxyl-rich alicyclic molecules (CRAM, Hertkorn et al., 2006), (4) unsaturated aliphatic compounds (2.0 ≥ H/C > 1.5, N = 0), (5) saturated compounds, including lipids (H/C > 2.0 and O/C < 0.9), (6) saturated compounds (H/C > 2.0) with O/C > 0.9, including carbohydrate molecular formulae, and (7) unsaturated aliphatic compounds containing N, including peptide molecular formulae (2.0 > H/C ≥ 1.5, N > 0). Further, we separated the molecular formulae according to their heteroatom content, i.e., (8) molecular formulae that contain N, (9) molecular formulae that contain S, (10) molecular formulae that contain P, and (11) molecular formulae that contain N and S. The molecular categorizing using ultrahigh-resolution MS provides information about likely structures behind the identified molecular formulae. The molecular structure assignment for molecular formulae is ambiguous because several different isomers may exist for a single molecular formula. However, the assignment of compound groups based on molecular level information obtained by FT-ICR-MS has been successfully used to identify biogeochemical processing of DOM (e.g., Kim et al., 2003; Schmidt et al., 2009). The proportion of each compound group is reported as the percentage of molecular formulae of a given compound group relative to the total number of molecular formulae detected in the sample.
Statistical Analyses and Terrestrial DOC Flux Calculations
Principal coordinate analysis (PCoA) was performed on a Bray-Curtis dissimilarity matrix of the normalized peak intensities of all detected DOM molecular formulae. DOM molecular endmembers were identified using Ward's hierarchical clustering based on a Bray-Curtis dissimilarity matrix and PCoA. The DOM compound groups and environmental data (including DOC concentrations, stable carbon isotope composition of SPE-DOM, chlorophyll concentrations, concentrations of dissolved nitrogen species, silicate, phosphate, oxygen, salinity, and water temperature) were fitted post-hoc to the PCoA scores using the envfit function of the vegan package (Oksanen et al., 2015) within the R statistical platform (R core team, 2015). The correlation of environmental parameters to the DOM molecular composition (PCoA) was tested with 10,000 permutations and was considered significant if p < 0.1. Pearson correlations were used to assess the linear relationship between DOM compound groups and environmental parameters (α level 0.05). All contour plots and maps were produced using the Ocean Data View software (Schlitzer, 2016).
We determined how the concentrations of the measured nutrients, DOC, the 13C isotopic composition of SPE-DOM and the relative abundance of DOM compound groups deviated from simple linear mixing of marine and terrestrial endmembers by using the correlation and regression analyses described previously by Seidel et al. (2015a). For the present study, we modified this approach by scaling the relative abundances of the molecular compound groups to the DOC concentrations (i.e., by multiplying the relative abundance of each compound group to the DOC concentration of each sample) before normalizing the data to values between 0 (minimum) and 1 (maximum). In short, this analysis gives a relative measure Δmix indicating the percentage that a measured parameter deviates from values expected from simple linear mixing of two endmembers (if significantly correlated to salinity, p ≤ 0.05) or averaged measured values (if endmembers had similar values). High Δmix values (>10%) describe a relatively high variability of the parameter in comparison to values expected from a linear mixing model or in relation to the average measured value along the salinity gradient. It is very important to note that this approach is not intended to describe the Baltic Sea as a simple two-endmember mixing model, i.e., a system where the terrestrial DOM from the northern basin rivers (e.g., Kalix or Neva Rivers) mixes with the marine DOM from the North Sea in the south. As mentioned before, almost two-thirds of the Baltic Sea riverine freshwater inflow occurs in the northern basins but additional terrestrial DOM is supplied to the southern Baltic Sea by rivers such as the Oder, Nemunas, and Vistula Rivers. Our mixing analysis was therefore intended as a first-order approach to assess the dynamics of the DOM composition along the estuarine gradient when considering the two most extreme endmembers (sub-arctic terrestrial vs. marine DOM) of the Baltic Sea. In this analysis, deviations from the mixing of these endmembers can thus be due to removal or production of DOM compounds but also due to enrichment or depletion of the DOM compounds caused by to the input of freshwater with different DOC concentrations compared to the northern rivers along the salinity gradient.
The relative proportion of terrestrial SPE-DOM was calculated using δ13C SPE-DOM under consideration of terrestrial (δ13Cterr) and marine/autochthonous (δ13Cmarine) endmembers:
The terrestrial and marine endmembers were determined by extrapolating the range of δ13C SPE-DOM values and DOC concentrations along the salinity gradient to salinities 0 and 35, respectively. Accordingly, the endmembers used for calculating the relative proportion of terrestrial SPE-DOM were salinity 0, δ13C SPE-DOM −28‰, DOC 400 μM and salinity 35, δ13C SPE-DOM −22‰, DOC 100 μM, respectively.
To extend our simplified mixing analysis, we also calculated the terrestrial DOC fluxes between the basins using a box model approach where we considered the in- and outflow for the basins of the Bothnian Bay, Bothnian Sea, Baltic Proper (including Gulf of Finland and Gulf of Riga), Danish Straits, and Kattegat area. The terrestrial DOC fluxes were calculated using the DOC concentrations (without PPL extraction), the relative proportions of terrestrial SPE-DOC from this study (with PPL extraction), and water flows between basins reported previously by Savchuk (2005). The net terrestrial DOC balance per basin (loss rate) was calculated as the difference of influx and outflux, i.e., the terrestrial DOC input by rivers (Gustafsson et al., 2014) and adjacent basins minus the outflow to adjacent basins. The residence times of terrestrial DOC were calculated for each basin by dividing the total stock of terrestrial DOC in each basin by all inputs of terrestrial DOC into the basin (sum of the inputs from adjacent basins and rivers). The reported values are basin averaged means ± standard deviations (of all concentration and isotope data determined in each basin). We note that for calculating fluxes and residence times of terrestrial DOC, we used the terrestrial SPE-DOC values (calculated percentage of terrestrial DOC using 13C isotopic composition of DOC after PPL extraction) and the overall DOC pool (without PPL extraction). Although, PPL extraction has a poor recovery for very low molecular weight ionic compounds (Raeke et al., 2016), it provides a major fraction of the overall DOM (Green et al., 2014). As in previous studies (Seidel et al., 2015a,b; Osterholz et al., 2016), our extraction efficiencies were not correlated to salinity. We therefore assume that representative fractions of the marine and terrestrial DOM pools were extracted along the salinity gradient and that the terrestrial SPE-DOC values can be applied to infer the contribution of terrestrial DOC to the overall DOC pool.
Results
General Water Characteristics
Temperatures were highest in the seawater entering from the North Sea through the Skagerrak and Kattegat. A steeper temperature gradient developed in spring compared with the temperature gradient in autumn (Figures 2A,B). Surface salinity increased from 2.7 to 26 (autumn) and 35 (spring) from the Kalix River outflow stations (Bothnian Bay) toward the marine water inflow at the Skagerrak and Kattegat. In the Bothnian Bay and Sea, salinity was <6 throughout the water column while in the Gotland Deep and Landsort Deep the water was more saline with salinities between 10 and 12 (Figures 2C,D). Dissolved oxygen concentrations were highest in the surface layers from the Bothnian Bay to the Skagerrak (6–10 mL L−1). Oxygen concentrations were lower in the deep central Baltic Sea with hypoxic conditions (<1.4 mL L−1) >100 m water depth (Gotland and Landsort Deeps). Anoxic conditions prevailed in >120 m (Gotland Deep) and >140 m depth (Landsort Deep), respectively (Figures 2E,F).
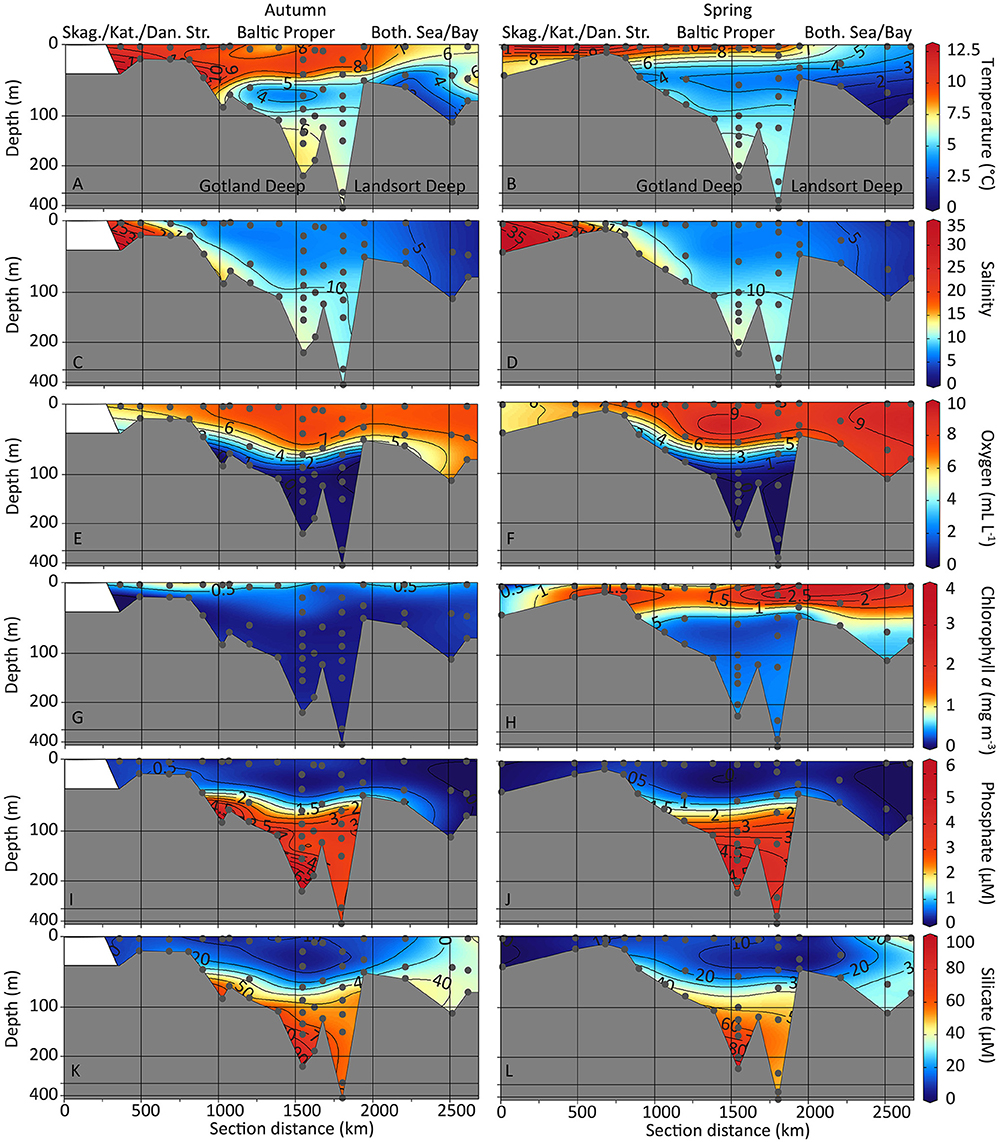
Figure 2. Contour depth plots of the sampling transects. Water temperature (A,B), salinity (C,D), dissolved oxygen concentrations (E,F), concentrations of chlorophyll a (G,H), phosphate (I,J), and silicate (K,L) are shown for autumn (left) and spring (right) sampling. Non-linear depth scale. Skag., Skagerrak; Kat., Kattegat; Dan. Str., Danish Straits; Both. Sea/Bay, Bothnian Sea and Bothnian Bay.
Inorganic Nutrients and Cell Numbers
Chlorophyll a concentrations were highest in the surface water of the Kattegat area and the southern Baltic Proper (stations S4 to TF245, Figure 1) with values between 0.6 and 1 mg m−3 in autumn (Figure 2G). In spring, chlorophyll a concentrations were high in the surface waters of the Bothnian Sea (1.8 mg m−3 at station At4) and the southern Baltic Proper (1.3 mg m−3 at station Mo5) and increased to values of up to 3.5 mg m−3 at the Landsort Deep (station TF284, Figure 1) at 14 m depth (Figure 2H). For the autumn sampling campaign, the number of primary producers was also assessed by enumeration of cells with chlorophyll autofluorescence (including cells of Synechococcus, picoeukaryotes, and nanoeukaryotes, Supplementary Figure 1A). These data matched closely the chlorophyll data that were assessed using the fluorescence detector connected to the sampling rosette, i.e., highest concentrations of primary producers were found in the southern Baltic Proper (Supplementary Figure 1A). In addition, the concentration of prokaryotes was assessed by flow cytometry. Prokaryotic cell numbers were highest in the surface waters of the southern Baltic Proper, in the Bothnian Bay and in the hypoxic/anoxic water masses of the Gotland Deep and Landsort Deep (Supplementary Figure 1B).
Phosphate and silicate concentrations were highest in the anoxic Gotland and Landsort Deeps (Figures 2I–L). Phosphate concentrations in the Landsort Deep were up to 5.1 μM (spring) and 6.5 μM (autumn) and in the Gotland Deep up to 3.9 μM (spring) and 3.5 μM (autumn). Silicate concentrations in the Gotland Deep were up to 97 μM (spring) and 93 μM (autumn) and in the Landsort Deep up to 53 μM (spring) and 60 μM (autumn). Phosphate concentrations were ≤ 0.5 μM (below detection limit) in autumn and spring in the surface samples throughout the Baltic Sea (Figures 2I,J). Silicate concentrations were elevated in the surface waters of the Bothnian Bay (37–40 μM and 35–43 μM in autumn and spring, respectively) but depleted in the surface samples of the Baltic Proper (4.2–13 μM and 0–15 μM in autumn and spring, respectively, Figures 2K,L).
TDN concentrations in autumn were high at the surface in the Bothnian Bay (station Mo14 with 30 μM TDN) while in the Baltic Proper, surface TDN concentrations were lower with 14–18 μM (autumn, Supplementary Figure 2A) and 12–18 μM (spring, Supplementary Figure 2B). TDN concentrations were highest in the bottom water of the Gotland Deep with 55 and 60 μM in spring and autumn, respectively (Supplementary Figures 2A,B). In the bottom water of the Landsort Deep, TDN concentrations were 21 μM (spring) and 22 μM (autumn, Supplementary Figures 2A,B), respectively. Nitrate concentrations were highest in the Bothnian Bay with values of up to 8.2 μM at station S11 in autumn (Figure 3A) and 6.4 μM in spring (Figure 3B). In the Baltic Proper, nitrate concentrations decreased to levels below the detection limit (0.125 μM) in the surface samples (Figure 3B). Nitrite concentrations were generally low (<0.5 μM) with the highest values during autumn (Supplementary Figures 2C,D). Ammonium concentrations were highest in the anoxic waters of the Gotland and Landsort Deeps (Figures 3C,D). The ammonium concentrations positively correlated with silicate and phosphate concentrations in autumn (Supplementary Figure 3) and spring (Supplementary Figure 4). Ammonium concentrations were lower in spring compared to autumn (Landsort Deep 6.4 μM compared to 11 μM, and Gotland Deep 11 μM compared to 31 μM in Figures 3C,D). DON concentrations were high in the Baltic Proper (surface concentrations 15–17 μM and 9.2–17 μM in autumn and spring, respectively, Figures 3E,F). High DON concentrations were also found in the bottom water of the anoxic Gotland (29 μM in autumn and 28 μM in spring) and Landsort Deeps (11 μM in autumn and 15 μM in spring, Figures 3E,F). The TDN concentrations positively correlated to DON concentrations in autumn (Supplementary Figure 3) and spring (Supplementary Figure 4) while DON also positively correlated with ammonium concentrations in spring (Supplementary Figure 4).
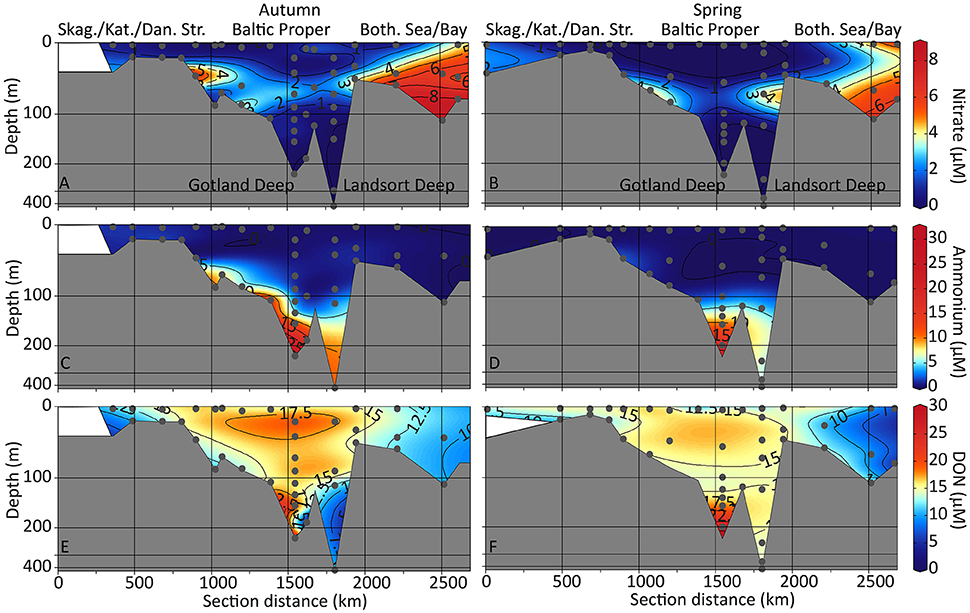
Figure 3. Contour depth plots of the sampling transects. Nitrate (A,B), ammonium (C,D), and dissolved organic nitrogen (DON; E,F) concentrations are shown for autumn (left) and spring (right) sampling. Non-linear depth scale. Skag., Skagerrak; Kat., Kattegat; Dan. Str., Danish Straits; Both. Sea/Bay, Bothnian Sea and Bothnian Bay.
DOC Concentrations and Isotopic Composition
DOC concentrations were highest in the Bothnian Bay and Bothnian Sea close to the Kalix River outflow with 379 μM during the spring flood (Bothnian Bay station At4, surface, Figure 1). During autumn, highest DOC concentrations occurred in the Baltic Proper and the Bothnian Sea (301–341 μM from station Mo7 to S10, surface to 70 m depth) while in the Bothnian Bay, DOC concentrations were 304–308 μM (stations S11 and Mo14, 11–41 m depth, Figures 1, 4A). Toward the Kattegat (station S4), DOC concentrations decreased to 187 μM in autumn (Figure 4A). In spring, DOC concentrations decreased to 118 μM in the Skagerrak (station S1, Figures 1, 4B).
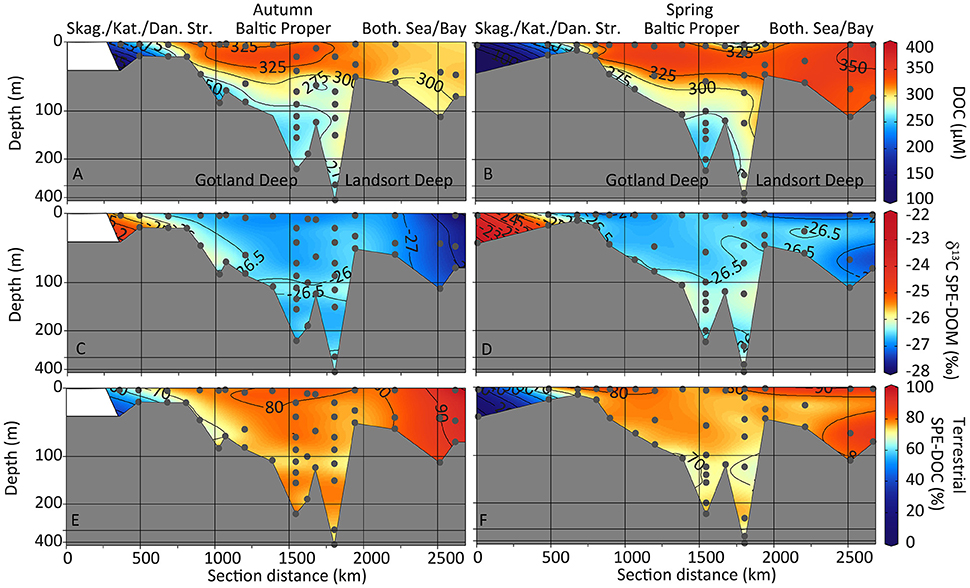
Figure 4. Contour depth plots of the sampling transects. Bulk DOC concentrations (A,B), 13C isotopic SPE-DOM composition (C,D), and the relative abundance of terrestrial SPE-DOC (based on δ13C SPE-DOM; E,F) are shown for autumn (left) and spring (right) sampling. Non-linear depth scale. Skag., Skagerrak; Kat., Kattegat; Dan. Str., Danish Straits; Both. Sea/Bay, Bothnian Sea and Bothnian Bay.
For both sampling campaigns, samples from the Bothnian Bay were characterized by depleted δ13C SPE-DOM signatures (between −27.9 and −27.1‰ in autumn at stations Mo14 and S11, and between −27.4 and −26.7‰ in spring at stations At4 and S11). Samples from the North Sea and Kattegat were more enriched (−25.2‰ in autumn at station S3, and −23.2‰ in spring at station S1, Figures 1, 4C,D). The isotopic composition of samples from the central Baltic Proper were between −27.0 and −25.2‰ (autumn) and −27.3 and −25.3‰ (spring, Figures 4C,D). The relative abundance of terrestrial SPE-DOC ranged from almost 100% close to the Kalix River outflow in the Bothnian Bay and decreased to ca. 75% in the Bothnian Sea (Figures 4E,F). Within the Baltic Proper basin, terrestrial SPE-DOC was uniformly distributed with values between 70 and 75%. A decrease to 53% was found in the Kattegat bottom water (inflowing North Sea water) while the surface water (outflowing Baltic Sea water) contained 69% (autumn) and 78% (spring) terrestrial SPE-DOC, respectively. The most marine station at Skagerrak in the North Sea (station S1 in Figure 1, salinity 34.9 in spring) contained 5.5% terrestrial SPE-DOC in the bottom and 24% terrestrial SPE-DOC in the surface water (Figure 4F).
Distribution of DOM Molecular Compound Groups
SPE-DOM extraction efficiencies were 77 ± 10% (n = 51, whereby few samples with extraction efficiencies above 90 and below 40% were not considered because they were likely erroneous). Extraction efficiencies were not correlated to salinity (p > 0.05, r = −0.27, n = 51). This supports our assumption that there was no preferential extraction of terrestrial over marine compounds from the DOM that is extracted with the PPL method. In total, ca. 6,000 molecular formulae were identified in the SPE-DOM. From the Kalix River outflow toward the Bothnian Sea, most molecular formulae were highly aromatic and highly unsaturated molecular formulae (groups 1–3 were up to 90% of all molecular formulae, Supplementary Figures 5A–F). Condensed and highly aromatic compounds (groups 1 and 2) were most abundant in the Bothnian Bay and Bothnian Sea, decreasing from 7.2% (group 1) and 16% (group 2) to 4.5% (group 1) and 14% (group 2) in the Baltic Proper. In this area, also the highest percentage of aromatic compounds, an indicator for terrestrial DOM, was found (weighted-average AImod in Figures 5A,B). Accordingly, salinity and δ13C SPE-DOM values were negatively correlated to condensed aromatics (group 1, in autumn and spring) or highly aromatic compounds (group 2, in spring only) (Supplementary Figures 3, 4). The relative abundances of highly unsaturated compounds (group 3, Supplementary Figures 5E,F) and unsaturated aliphatics (group 4, Supplementary Figures 5G,H) were highest in the marine inflow area of the Kattegat with values of up to 72% (group 3) and 15% (group 4), respectively. The relative abundance of saturated compounds (group 5, Supplementary Figures 5I,J) was highest in autumn in the marine inflow waters at the Kattegat (up to 1.4%), while in spring, values were low throughout the Baltic Sea (<0.6%). Saturated compounds with high O/C ratios (group 6) were close to zero and were therefore excluded from further analyses. Unsaturated compounds containing N (group 7, including peptide molecular formulae, Supplementary Figures 5K,L) contributed up to 1.2% throughout the Baltic Sea in autumn and were <1% in spring. In our regression analyses, all compound groups (scaled to DOC concentrations), apart from saturated compounds (group 5), were negatively correlated to salinity in autumn (p < 0.05, Supplementary Figure 6). In spring, compound groups 1–4 negatively correlated with salinity whereas groups 5–11 did not (Supplementary Figure 6). Group 7 compounds positively correlated with DON concentrations in spring (Supplementary Figure 4), when DON concentrations were highest in the anoxic Landsort and Gotland Deeps (Figure 3F).
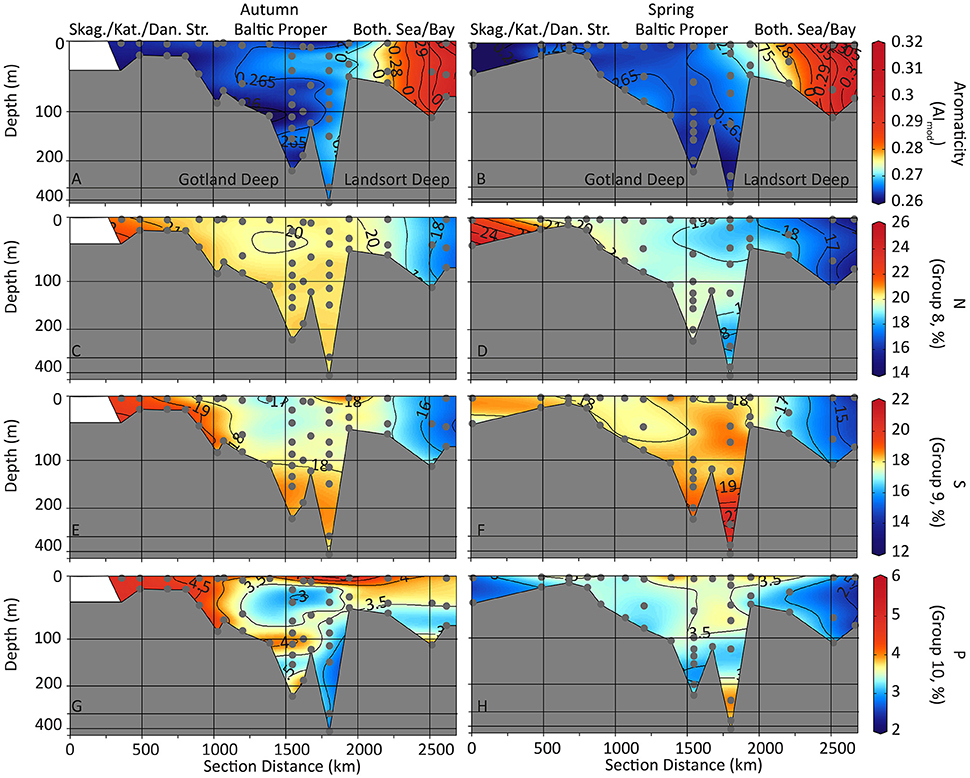
Figure 5. Contour depth plots of the sampling transects. Weighted averages of DOM aromaticity (AImod; A,B) and compound groups of DOM containing nitrogen (C,D), sulfur (E,F), or phosphorus (G,H) (DOM groups 8, 9, and 10) are shown for autumn (left) and spring (right) sampling. Averages are weighted by FT-ICR-MS signal intensity. Non-linear depth scale. Skag., Skagerrak; Kat., Kattegat; Dan. Str., Danish Straits; Both. Sea/Bay, Bothnian Sea and Bothnian Bay.
N-containing compounds (group 8) were most abundant in the marine inflow water at the Kattegat (up to 26% of all molecular formulae; Figures 5C,D). S-containing formulae (group 9, Figures 5E,F) were abundant in the marine inflow water (up to 22% of all molecular formulae) and in the anoxic bottom water of the Gotland Deep and Landsort Deep (18–22% of all molecular formulae). P-containing formulae (group 10) were most abundant in the marine inflow water in autumn (up to 6% of all molecular formulae; Figures 5G,H).
Total DOC concentrations negatively correlated with salinity (p < 0.01) in spring (r = −0.70, n = 41) and autumn (r = −0.75, n = 36; Figure 6A). Likewise, terrestrial DOC concentrations (based on δ13C SPE-DOM) negatively correlated with salinity in both seasons (p < 0.01; Supplementary Figure 6). The DOC-concentration-scaled relative abundances of highly aromatic compounds (group 2, Figure 6B) and unsaturated aliphatic compounds (group 4, Figure 6C) were also negatively correlated to salinity (p < 0.01). In spring, the DOC-concentration-scaled relative abundances of unsaturated aliphatics (compound group 4) deviated more from linear mixing compared to autumn (Figure 6C).
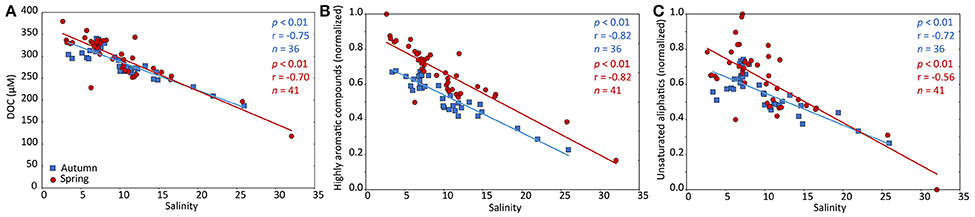
Figure 6. DOC concentrations and the distribution of DOM molecular compound groups along the salinity gradient. Relationship of bulk DOC concentrations (A), the relative abundance of highly aromatic compounds (B) and unsaturated aliphatic compounds (C; molecular formulae of groups 2 and 4, respectively) and salinity for autumn (blue squares) and spring (red circles) samples. The solid lines represent linear regressions. The relative abundance of the compound groups was scaled to the DOC concentrations and normalized to their minimum and maximum values. Bulk DOC concentrations and the highly aromatic compounds strongly correlated with salinity indicative for mixing of riverine and marine DOM. Unsaturated aliphatic compounds were more variable compared to linear mixing suggesting complex processing along the salinity gradient.
Statistical Analyses
In PCoA analysis, the samples were correlated to eight (autumn, Figure 7A) and nine (spring, Figure 7B) environmental parameters (p < 0.1). In the ordination plots, the first two axes explained between 68 and 74% of the DOM molecular variability (spring and autumn, respectively). PCoA and cluster analyses revealed three DOM molecular clusters that generally followed the salinity and oxygen gradients, i.e., (1) terrestrial-oxic, (2) brackish-to-marine oxic, and (3) brackish suboxic-to-anoxic (Figure 7). In PCoA, the projections of sampling points onto the vectors depict correlations with the corresponding environmental parameters. In autumn and spring, the identified clusters correlated with salinity, δ13C SPE-DOM, water temperature (brackish-to-marine oxic cluster, blue circles in Figure 7), DOC, nitrate and dissolved oxygen concentrations (terrestrial-oxic cluster, green circles in Figure 7), as well as depth and phosphate concentrations (suboxic-to-anoxic cluster, red circles in Figure 7). In spring, samples from the brackish-to-marine samples also correlated with DON concentrations (Figure 7B).
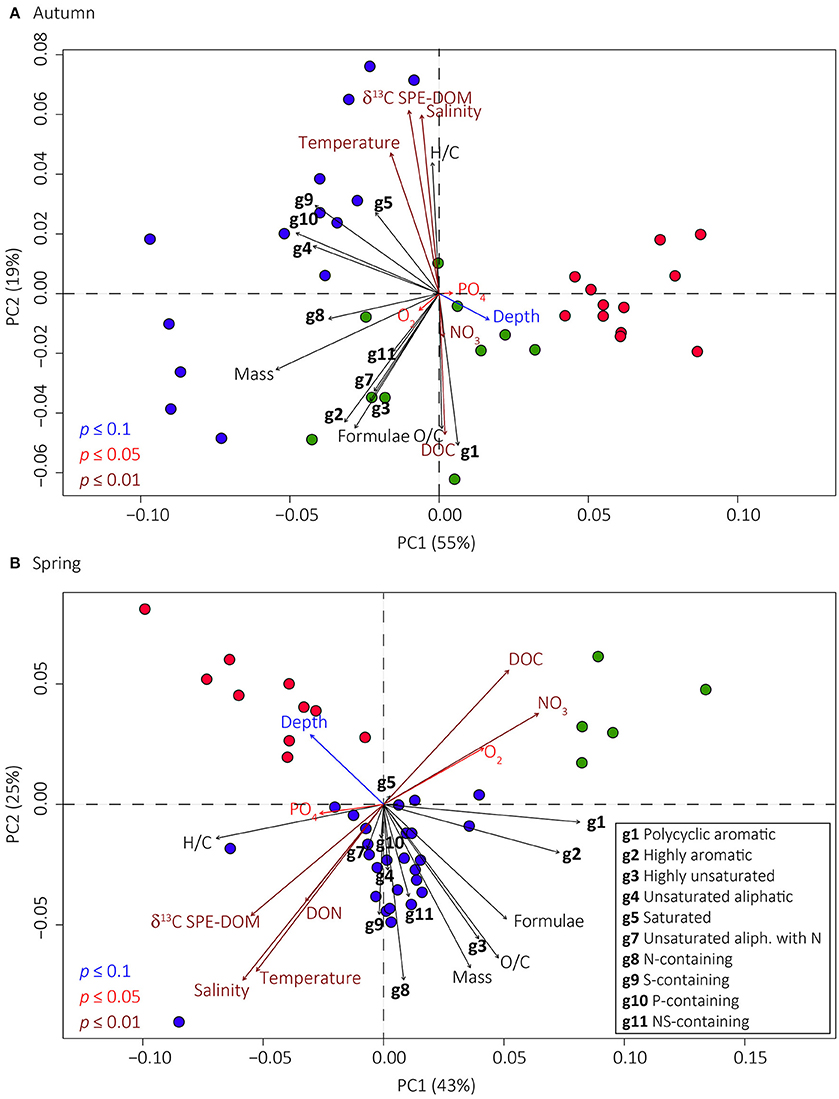
Figure 7. Principal coordinate analyses (PCoA) based on Bray-Curtis dissimilarities of the relative abundance of DOM molecular formulae. Shown are the PCoA for autumn (A) and spring (B) samples, respectively. The percentages give the DOM molecular variability as explained by the axes. Colored circles identify the three main DOM clusters that were found in terrestrial-oxic (green circles), marine-to-brackish oxic (blue circles), and brackish suboxic-to-anoxic conditions (red circles). Environmental parameters (significantly correlated with p ≤ 0.1, p ≤ 0.05, and p ≤ 0.01 blue, red, and dark red arrows, respectively), DOM compound groups (groups g1–g10 specified in legend shown in B; black arrows) and intensity weighted averages of O/C or H/C ratios and masses (“O/C,” “H/C,” “Mass”) and average number of molecular formulae per sample (“Formulae”) were fitted onto the ordination. Correlations with compound group 6 (saturated compounds with high O/C ratios) were not significant and are therefore not shown. The projections of sampling points onto the vector arrows show maximum correlations with the corresponding molecular compound groups, environmental, and molecular parameters.
In autumn, marine-influenced samples correlated with the percentage of DOM groups 4, 5, 8, 9, and 10 (unsaturated aliphatics, saturated, N-, S-, and P-containing compounds, Figure 7A). Terrestrially influenced samples correlated with groups 1, 2, 3, 7, and 11 (polycyclic aromatic, highly aromatic, highly unsaturated, unsaturated aliphatic with N, and NS-containing compounds, Figure 7A). In spring, marine-influenced samples correlated with DOM compound groups 3, 4, 7, 8, 9, 10, and 11 (highly unsaturated, unsaturated aliphatic with/without N, saturated, N-, S-, P-, and NS-containing compounds, Figure 7B). More terrestrial influenced samples correlated with DOM groups 1 and 2 (polycyclic aromatic and highly aromatic compounds, Figure 7B).
Comparison of DOM Molecular Endmembers
The characteristic DOM molecular signatures of the terrestrial, marine, oxic, and anoxic water masses were described by calculating the molar averages of the enriched molecular formulae of the endmembers that were identified in PCoA and cluster analyses. These were the samples from stations Mo14 and At-4 (Bothnian Bay surface close to the Kalix River outflow; terrestrial endmembers), S4 (19 m depth at Kattegat), and S1 (surface close to Skagerrak; marine endmembers) and TF284 (Landsort Deep at 430 m depth; anoxic endmembers) for the autumn and spring cruises, respectively (see Figure 1 for sampling positions). Molecular formulae enriched in terrestrial DOM had higher masses, more carbon and more oxygen atoms, higher O/C and lower H/C ratios than DOM from marine or from anoxic water masses (Table 1). Enriched marine and DOM from anoxic water masses contained 7- to 33-fold more nitrogen, sulfur, and phosphorus (N-, S-, and P-) atoms compared to terrestrial DOM (Table 1). In spring, N-atoms in marine compounds were 2-fold higher compared to autumn (Table 1). Marine water masses in autumn were almost twice as much enriched in S-atoms compared to anoxic DOM compounds. In spring however, S-atoms were more enriched in anoxic DOM compared to marine DOM (Table 1). The S-content of marine DOM varied between the seasons with higher values in autumn compared to spring. Molecular formulae relatively enriched in the terrestrial endmember water in the Bothnian Bay were mainly polycyclic aromatics, highly aromatic, and highly unsaturated compounds (groups 1–3 were 97% of the enriched compounds, Supplementary Table 1). Unsaturated aliphatic compounds, with or without nitrogen and saturated compounds (groups 4–7), contributed comparatively more to the molecular formulae enriched in the marine and anoxic DOM samples (15–32% in spring and 13–22% in autumn, Supplementary Table 1).
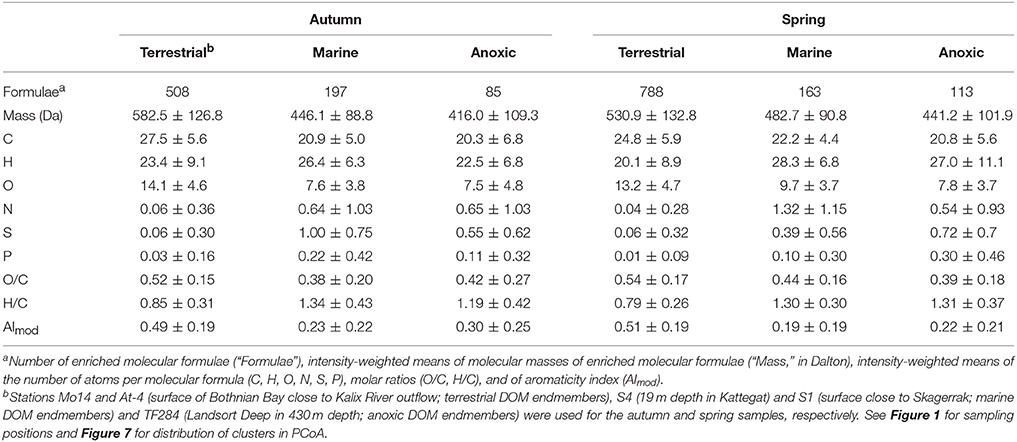
Table 1. Characteristics of DOM molecular formulae (means of molecular parameters ± SD) that were relatively enriched in the terrestrial (riverine sources), marine (autochthonous sources), and anoxic (deep basins) end members in autumn and spring as identified by principal coordinate and cluster analyses.
We characterized molecular formulae that were relatively enriched in the seawater bottom inflow in 17–19 m depth at station S4 (i.e., marine compounds that are transported from the North Sea to the Baltic Sea) and brackish surface outflow at station S4 (i.e., terrestrial compounds that are exported from the Baltic Sea to the North Sea; Table 2) through the Kattegat and Skagerrak (station S4 in Figure 1). The outflowing water had a higher number of molecular formulae than North Sea water entering the Baltic Sea (“formulae” in Table 2). The outflowing water was relatively enriched with molecular formulae with higher masses and more carbon atoms while the inflowing water was enriched with molecular formulae containing nitrogen, sulfur and phosphorus heteroatoms. These trends were more pronounced in spring compared to autumn.
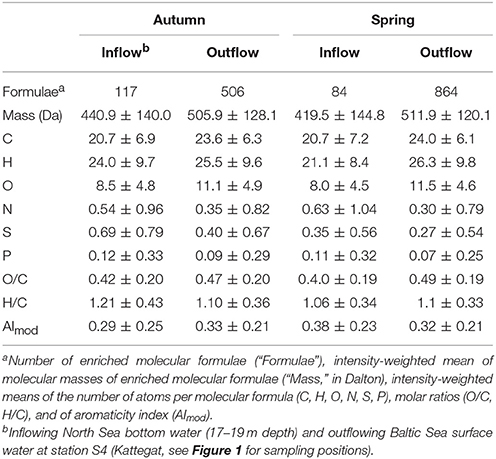
Table 2. Characteristics of DOM molecular formulae (mean of molecular parameters ± SD) that were enriched in inflowing bottom water from the North Sea (into the Baltic Sea) and outflowing surface water from the Baltic Sea (into the North Sea) through the Kattegat area.
Terrestrial DOC Fluxes
The relative proportion of terrestrial DOC decreased from 90 ± 3% and 86 ± 5% in the Bothnian Bay to 60 ± 8% and 66 ± 17% in the western Baltic Sea at the Skagerrak/Kattegat area (stations S1, S3, and S4 in Figure 1) in autumn and spring, respectively (Table 3). Using our box model approach, we estimated a loss of terrestrial DOC in the Baltic Sea (sum of values from Bothnian Bay to Danish Straits) of 1.6–1.9 Tg C yr−1 (43–51% of total riverine input). The Baltic Proper (including terrestrial DOC inputs from the Gulf of Riga and Gulf of Finland) was the biggest sink for terrestrial DOC with 1.8 ± 0.8 Tg C yr−1 (autumn) and 2.5 ± 0.9 Tg C yr−1 (spring) net removal. Removal of terrestrial DOC in the Bothnian Bay was 0.3 ± 0.1 Tg C yr−1 (autumn) and 0.3 ± 0.3 Tg C yr−1 in spring (Table 3). The terrestrial DOC balances in the Bothnian Sea and the Danish Straits were slightly negative or close to zero (Table 3). The export of terrestrial DOC from the Danish Straits into the Kattegat area was between 1.8 and 2.1 Tg C yr−1 in autumn and spring, respectively. The fluxes were slightly higher in spring compared to autumn. The residence times of terrestrial DOC were 3.7–3.8 years in the Bothnian Bay, 3.2–3.4 years in the Bothnian Sea, and 4.5–4.9 years in the Baltic Proper (Table 3). The residence time of terrestrial DOC in the Danish Straits and Kattegat area was 0.3–0.4 years (Table 3).
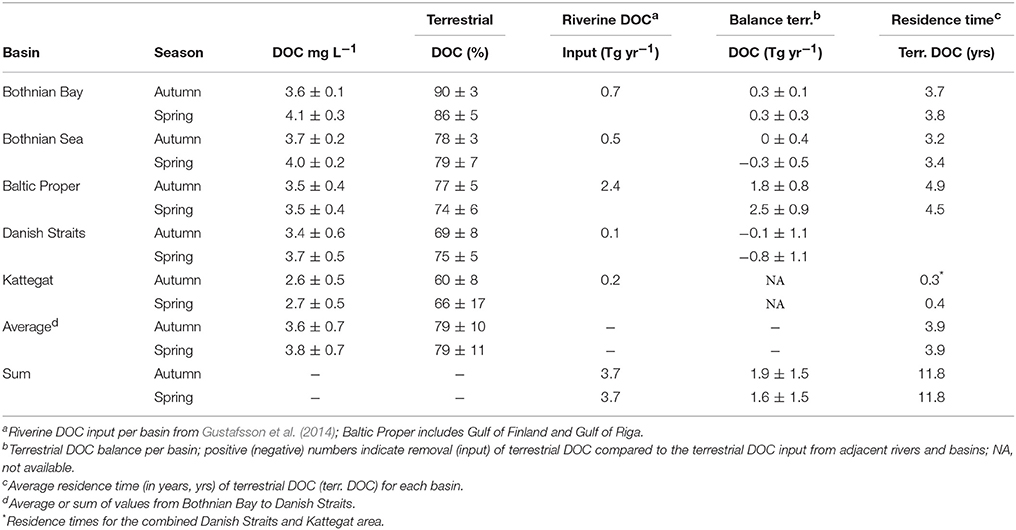
Table 3. Concentrations of DOC and relative abundance of terrestrial DOC (%) in comparison to the riverine DOC input and removal rates of terrestrial DOC (in Tg C per year) for the basins of the Baltic Sea in autumn and spring (means ± SD).
Discussion
Bulk Geochemical and Biological Parameters
The distribution of the chemical constituents in the Baltic Sea water was largely driven by mixing of marine and riverine water masses and by the vertical redox zonation of the water column. The thermal stratification was weaker in autumn compared to spring (water temperature in Figures 2A,B), indicating enhanced convective overturning in the surface mixed layer. Reduced stratification was probably due to a combination of stronger wind-induced mixing, surface cooling as well as reduced inflow of riverine freshwater in autumn (Nausch et al., 2012). In winter, the water column of the Baltic Sea is vertically mixed down to the halocline, whereas in spring, a seasonal thermocline generally forms at about 20 m depth (Eilola and Stigebrandt, 1998). Water masses below the halocline in the deep stagnant basins is only replaced during major inflow events, which have not occurred between 2004 and 2014 (Mohrholz et al., 2015), i.e., during and around the time our samples were taken (2011 and 2012).
Nitrogen is provided to the Baltic Sea by riverine and atmospheric inputs, nitrogen fixation and nutrient recycling within the water column (Thomas et al., 2010). During the autumn months, stronger wind-induced mixing provides the surface and subsurface mixed layers with recycled nutrients from below the thermocline. At the same time in late autumn, the overall phytoplankton biomass (as indicated by chlorophyll a concentrations, Figures 2G,H) was lower. Consequently, higher depth-integrated nitrate concentrations were found in the Bothnian Bay in autumn compared to spring (Figures 3A,B).
Nitrate (Figures 3A,B) and silicate concentrations (Figures 2K,L) were higher in the surface layers of the Bothnian Sea compared to the central Baltic Sea, where these nutrients were depleted in the photic zone, probably due to phytoplankton growth. Silicate and nitrate were still detectable in the areas with high freshwater input such as the Bothnian Bay, where rivers are important nutrient sources (Savchuk, 2005). Dissolved silica and dissolved phosphate are mainly derived from riverine inputs and they are removed as biogenic particles by growth of phytoplankton such as diatoms (Rahm and Danielsson, 2007; Conley et al., 2008). Sinking particles export silica, nitrogen and phosphorus into the deeper water layers where the particles settle and partly dissolve (Struck et al., 2004; Savchuk, 2005). Below the halocline in the stagnant anoxic Gotland and Landsort Deeps, dissolved silicate (Figures 2K,L), phosphate (Figures 2I,J), and ammonium (Figures 3C,D) can accumulate (Nausch and Nehring, 1996; Nausch et al., 2012).
The DOC concentrations of the terrestrial endmembers in the Bothnian Bay were slightly elevated in spring (Figures 4A,B). This was likely due to the flushing of soils and fast response to precipitation events and snow melt. In general, boreal and sub-arctic river systems are characterized by a pronounced seasonality of their hydrograph, because of elevated spring peak flow due to snowmelt (Smedberg et al., 2006). But considering the long residence time of terrestrial DOC in the various basins of the Baltic (see Discussion below), the effect of seasonal runoff is dampened on a basin scale. DOC concentrations strongly correlated with salinity during both seasons but with noticeable deviations from two-endmember mixing (Figure 6A). Positive deviations of DOC concentrations indicate release of DOM during the spring phytoplankton bloom whereas negative deviations suggest degradation of terrestrial DOC. Similar to bulk DOC, the concentration of terrestrial DOC was largely driven by dilution with seawater along the salinity gradient, but noticeable deviations from simple mixing indicate processing of terrestrial DOM along the salinity gradient (Supplementary Figure 6). It is important to keep in mind that in our simplified linear mixing model, we assumed that all terrestrial and marine sources in the Baltic Sea have the same endmember characteristics in terms of stable carbon isotopes and DOC concentrations. This may not be the case, because the various rivers draining into the Baltic Sea differ, especially in their DOC concentrations (e.g., Deutsch et al., 2012). This adds uncertainty to our two-endmember mixing model.
Nonetheless, our considerations are consistent with previous findings. On average, 20–60 μM particulate organic carbon is seasonally produced by phytoplankton in the Baltic Proper during the spring and summer blooms (Nausch et al., 2012), a part of which is likely released in dissolved form. Removal of terrestrial DOM was previously observed in the Baltic Sea (Alling et al., 2010; Deutsch et al., 2012). The bioavailability of terrestrial DOM depends strongly on the catchment area (Asmala et al., 2013; Riedel et al., 2016). However, a more significant sink for terrestrial DOM in the Baltic Sea, and coastal oceans in general, is probably photo-mineralization and bacterial uptake of the photo-produced labile DOM (Miller and Zepp, 1995; Aarnos et al., 2012). In fact, Aarnos et al. (2012) calculated that the total annual photochemical mineralization exceeds the annual input of photo-reactive riverine DOM, suggesting that also autochthonous DOM is photo-transformed in the Baltic Sea. The biodegradation of terrestrial DOC is likely to be significant on time scales of weeks to months due to the semi-labile to refractory character of terrestrial DOC that is exported to the Baltic Sea (Herlemann et al., 2014; Kuliński et al., 2016). The net heterotrophy that was observed in parts of the Baltic Sea suggests that a part of the terrestrial DOC pool is important for supporting bacterial mineralization (Algesten et al., 2006).
DOM Composition in Relation to Marine and Terrestrial Sources
In the riverine-influenced samples, we found a stable carbon isotopic composition of SPE-DOM that is typical for C3 land plants, i.e., between −28 to −25‰, whereas the marine-influenced samples were in the range for marine phytoplankton OM, i.e., around −22‰ (Benner et al., 1997; Guo et al., 2003). C3 plants, such as woody gymnosperms, are a main source for the terrigenous DOM that is discharged into the northern Baltic Sea (Bianchi et al., 1997; Deutsch et al., 2012). This is supported by our finding that most of the riverine DOM consisted of highly aromatic and highly unsaturated molecular formulae, which include lignin degradation products (Stenson et al., 2003), polyphenols (Koch and Dittmar, 2006), but also combustion-derived compounds (Dittmar and Koch, 2006). Molecular formulae with a comparatively low hydrogen content (low H/C ratios) are a general feature of terrestrial DOM due to the high content of aromatic compounds such as degraded lignins and tannins (Sleighter and Hatcher, 2008; Schmidt et al., 2009) and mobilized black carbon from soils (Dittmar et al., 2012; Jaffé et al., 2013).
The non-targeted DOM molecular analyses using ultrahigh-resolution MS allows to distinguish different DOM sources and complex transformations in estuaries and river plumes (Medeiros et al., 2015a,b; Seidel et al., 2015b; Osterholz et al., 2016). Using the PCoA multivariate statistical approach, we identified the molecular composition of the endmembers of the autochthonous marine and allochthonous terrestrial sources, as well as oxic-to-anoxic transformations in the Baltic Sea. The terrestrial endmembers had a higher number of molecular formulae (508–788 enriched terrestrial compounds compared to 163 and 197 enriched compounds in the marine endmembers, Table 1) and contributed more aromatic compounds as indicated by the higher aromaticity (higher AImod, Figures 5A,B) compared to the marine DOM endmembers. The marine endmembers were enriched with saturated compounds (lower AImod values) compared to the terrestrial endmembers (Table 1). The saturation of DOM compounds increased also along other river-to-ocean transects (Sleighter and Hatcher, 2008; Medeiros et al., 2015b; Seidel et al., 2015b). This is because marine DOM is enriched in aliphatic structures compared to freshwater samples that are enriched in aromatic compounds. Our data are consistent with these previously observed trends.
The molecular formulae that were enriched in the marine endmembers were characterized by higher contents of N-, S-, and P-atoms compared to the enriched terrestrial molecular formulae (Table 1). A higher proportion of DOM from phytoplankton and microbial biomass that is enriched in N, P and S-heteroatoms, such as peptides, nucleotides, and lipid degradation products, have also been previously observed in marine DOM (Kujawinski et al., 2004; Sleighter and Hatcher, 2008; Schmidt et al., 2011; Gonsior et al., 2011a; Seidel et al., 2015a). For example, in the Amazon plume and Delaware estuary, the increase of aliphatic compounds was related to addition of DOM from phytoplankton and the biotransformation of terrestrial DOM (Medeiros et al., 2015b; Osterholz et al., 2016). In line with these previous findings, our data demonstrate that the autochthonous production of DOM in the Baltic Sea and possibly also biotransformation of terrestrial compounds are a source for aliphatic N-, S-, and P-heteroatom containing compounds to the estuarine DOM pool.
The seasonal changes between the enriched compounds of the terrestrial endmembers were comparatively small (Table 1). The terrestrial DOM endmembers were from stations close to the Kalix River outflow in the Bothnian Bay (Figure 1). This suggests that at this location the seasonal DOM molecular changes were relatively minor and that the input of mobilized land-plant derived material was the main source of riverine DOM that was transported to the Bothnian Bay. In contrast, the changes between the marine endmembers and the anoxic endmembers were more pronounced. For example, during the spring phytoplankton bloom, the average N-content was 2-fold higher in the marine DOM compared to autumn (Table 1). As mentioned previously, the higher N- content in the molecular formulae can be attributed to DOM from autochthonous (marine) sources (e.g., Sleighter and Hatcher, 2008), particularly in spring, with higher phytoplankton biomass.
A previous study has shown that (chromophoric) DOM is transported from the North Sea (German Bight) into the Baltic Sea via the Jutland Coastal current through the Kattegat area (Stedmon et al., 2010). The sulfidic porewater in the tidal flats of the North Sea is strongly enriched with sulfurized DOM and the porewater discharge is a DOM source to the water column (Seidel et al., 2014). The Skagerrak/Kattegat area (Figures 5E,F), the marine endmember samples (Table 1), and the DOM from seawater flowing into the Baltic Sea (Table 2) were relatively enriched with S-containing DOM (particularly during autumn, when the phytoplankton biomass was lower compared to spring). This may indicate that the S-rich DOM from the North Sea tidal flats is transported into the Skagerrak/Kattegat area. Another possible source for the S-containing compounds is the discharge from the more anthropogenically influenced rivers of the southwestern Baltic Sea. Compared to the less populated sub-arctic north, more dissolved organic sulfur compounds may be introduced by wastewater (Gonsior et al., 2011b; Wagner et al., 2015) in the densely populated southwestern basins.
The distribution of the molecular DOM compound groups along the salinity gradient was strongly influenced by mixing (Figure 6; Supplementary Figure 6). However, similar to bulk and terrestrial DOC concentrations, there was considerable scatter around the mixing lines, which indicates active processing of DOM in the Baltic Sea. Especially DOM compound groups that were identified as typical marine (compounds groups 5–11) showed largest deviations from conservative mixing in spring, which can be associated to autochthonous production in the spring blooms. The high abundance of aromatic compounds makes terrestrial DOM highly susceptible to photochemical degradation (Hernes and Benner, 2003; Gonsior et al., 2009; Stubbins et al., 2010) which would explain the observed depletion of the aromatic compound groups (groups 1 and 2) at mid salinity in both seasons.
During its transit through the Baltic Sea, DOM became more enriched in autochthonous (phytoplankton-produced) compounds, which was more pronounced in spring compared to autumn (Table 1). A net accumulation of more aliphatic compounds (Figure 6C) and marine DOC (Figure 4F) was observed in spring, which is likely due to new addition of OM compounds during the phytoplankton bloom. In combination with the quantitative DOC data and the analysis of the 13C isotopic composition of SPE-DOM, we found indications for processing of terrestrial DOC in the Baltic Sea. A general trend for the Baltic Sea may be inferred: marine DOC accumulates due to the high phytoplankton primary production in spring whereas net (terrestrial) DOC removal occurs in autumn (without a noticeable accumulation of marine DOC). Thus, our data suggest that the carbon budget (here as DOC depletion/accumulation) can shift between net CO2 uptake (conversion to OM) and net release (remineralization of OM to CO2) which varies between the basins but also seasonally (Thomas et al., 2010; Kuliński and Pempkowiak, 2011; Gustafsson et al., 2014; Ylöstalo et al., 2016). In line with that, Algesten et al. (2006) previously suggested net heterotrophy in the Gulf of Bothnia because of terrestrial DOC processing.
DOM Transport from the Baltic Sea to the North Sea
The riverine inflow from the northern Bothnian Bay (e.g., Kalix River) and Bothnian Sea provide ca. 1.2 Tg terrestrial DOC per year (Gustafsson et al., 2014). For that area, our box model calculations resulted in terrestrial DOC removal rates of up to 0.3 Tg C per year (Table 3). Rivers draining into the Baltic Proper, the Gulf of Finland (Neva River) and the Gulf of Riga contribute ca. 2.4 Tg terrestrial DOC per year (Gustafsson et al., 2014). In that area, terrestrial DOC removal rates were between 1.8 and 2.5 Tg C per year. Overall, we estimated that 43–51% of the total riverine input of the 3.7 Tg terrestrial DOC is removed between the Bothnian Sea and the Danish Straits/Kattegat area. The fact that we estimated zero and even negative net balances for some of the lower basins highlights that their carbon budget may be in close balance, but it also emphasizes that the terrestrial DOC budgets (such as the DOC input terms) are still not well-constrained.
Our calculated export of 1.8–2.1 Tg terrestrial DOC per year to the Danish Straits (for autumn and spring, respectively) is comparable to the previously reported net flux of ca. 3 Tg total organic carbon per year by Gustafsson et al. (2014). It is, however, higher than the 0.8 Tg C per year which was based on optical measurements of chromophoric DOM (Osburn and Stedmon, 2011). In a previous study, Deutsch et al. (2012) found that the relative proportion of terrestrial HMW DOM decreased to 43% which is in line with our data. We calculated residence times for terrestrial DOC (i.e., the time that terrestrial DOC spends on average in each basin) of 3.7–4.9 years (Table 3) which also agrees well with previously reported values (Alling et al., 2008; Deutsch et al., 2012; Gustafsson et al., 2014). The water residence times (5.1, 3.2, and 4.4 years for Bothnian Bay, Bothnian Sea, and Baltic Proper, respectively; Savchuk, 2005) are higher or in the same range, indicating removal of terrestrial DOC on the time scales of water transport through the Baltic Sea. Yet, a significant fraction of the terrestrial DOC was resistant to removal in the Baltic Sea and was transported to the North Sea and presumably to the Atlantic Ocean. The residence time of terrestrial DOC in the Danish Straits and Kattegat area is relatively short (0.3–0.4 years, Table 3), probably because this area is relatively shallow and more mixed compared to the deeper basins of the Baltic Sea. However, the similar fluxes of terrestrial DOC to the North Sea in spring and autumn suggest that seasonal changes of OM production and riverine discharge are dampened. We propose that this is due to the long residence time of terrestrial DOC in the Baltic Sea.
After passage through the Baltic Sea, the outflowing DOM was more enriched in autochthonous (marine) compounds than the terrestrial endmember (but still contained a more terrestrial signature than the North Sea inflow). There was a substantial increase in N (6- to 8-fold increase), S (5- to 7-fold increase), and P (3- to 7-fold increase) heteroatoms in the molecular formulae after transit through the Baltic Sea compared to the riverine inflow at the northern Bothnian Bay (comparing the terrestrial endmember in Table 1 to the outflow in Table 2 in spring and autumn, respectively), suggesting that primary production and biotransformation in the Baltic Sea act as sources of these compounds. At the same time, aromatic terrestrial compounds were depleted in the outflow (AImod decreased from 0.49 and 0.51 to 0.33 and 0.32 in spring and autumn, respectively, compared to the terrestrial endmember; Tables 1, 2).
The identified processes appear to be applicable to other regions and to larger scales, although their relative extent will certainly depend on seasonal and spatial variabilities such as redox zonation, river discharge, circulation patterns, and DOM residence times. Arctic shelf seas, for example, show similar river runoff schemes as the Baltic Sea, with pronounced spring flood events. Furthermore, more than 50% of terrestrial DOC is removed on the Eurasian shelf before reaching the Arctic Ocean. Yet, this removal occurs on shorter time scales (2–5 years; Alling et al., 2010; Letscher et al., 2011) compared to the Baltic Sea (11.8 years, Table 3; and Alling et al., 2008; Stedmon et al., 2010; Deutsch et al., 2012). It remains to be resolved how these fluxes and rates change interannually, or if they are susceptible to changes in land use and an increase of (labile) terrestrial DOC export from sub-arctic rivers.
DOM Alterations in the Hypoxic Basins of the Baltic Sea
We observed an enrichment of DON in the central Baltic Sea (Figures 3E,F). This area is influenced by the discharge of rivers draining watersheds with high agricultural land use which could be important DON sources (Stålnacke et al., 1999; Voss et al., 2011). We also observed high chlorophyll concentrations in the regions with high DON concentrations (Figures 2G,H) and high abundances of phytoplankton (data for autumn only, Supplementary Figure 1). Thus, DON release from autochthonous sources such as cyanobacteria (Voss et al., 2005, 2011) is another likely explanation for the observed DON patterns. The DON concentrations positively correlated with unsaturated aliphatic N-containing compounds in spring (group 7, Supplementary Figure 4) which include peptide molecular formulae (Kujawinski et al., 2004; Sleighter and Hatcher, 2008) being consistent with an autochthonous production of DON.
The DON concentrations below the halocline were in the same range as in the photic zone in spring (Figure 3F). The similar DON concentrations in surface and bottom waters may reflect a recalcitrant background of DON. It also indicates DON transport below the halocline into the anoxic basins, probably by sinking particles and subsequent release of DON due to degradation processes. The anoxic endmember contained also more marine SPE-DOC in spring (33%) compared to autumn (27%; Figures 4E,F). Associated with this trend was a higher abundance of typical marine DOM compounds groups in spring compared to fall in the anoxic basins (compound groups 4, 5, and 7 with/without N were 32% in spring but only 13% in autumn, Supplementary Table 1). Such seasonal changes in the stagnant anoxic basins are remarkable and indicate active processing and seasonal inputs into these basins. The particle export to the deep anoxic basins is likely coupled with the seasonal changes of organic matter composition in the overlaying water column, for example, the higher autochthonous production in spring compared to autumn. In turn, this could mean that if the export of terrestrial organic matter from rivers should change (Voss et al., 2011; Räike et al., 2016), it may also affect the DOM composition in the deep anoxic basins of the Baltic Sea.
Our data also highlight additional modification of the DOM in the anoxic basins. The DOM compounds of the deep anoxic basins were more enriched with sulfur-containing compounds compared to the terrestrial endmember (Table 1). Abiotic sulfurization reactions between sulfide species and DOM have been proposed previously to be responsible for the observed elevated dissolved organic sulfur compounds in sulfidic environments (Schmidt et al., 2009; Seidel et al., 2014; Gomez-Saez et al., 2016). Potential abiotic sulfurization reactions include the exchange of an oxygen by a sulfur atom or exchanging H2O, H2, and/or O2 by addition of H2S per DOM molecular formulae (Schmidt et al., 2009; Gomez-Saez et al., 2016). It has further been hypothesized that abiotic sulfurization reactions may increase the recalcitrant character of DOM, which may explain why these compounds accumulate under anoxic conditions (Seidel et al., 2014).
Conclusions
We identified the molecular imprints of the sources and transformations of DOM in the Baltic Sea. Our box model calculations demonstrated that in both, spring and autumn, the Baltic Sea was a net sink for terrestrial DOM, including condensed and highly aromatic DOM compounds. We also found a net accumulation of autochthonous DOM in the Baltic Proper in spring, likely resulting from OM production during the phytoplankton bloom. Phytoplankton production and possibly also the bio- and photo-transformation of terrestrial compounds are sources for aliphatic, nitrogen-, sulfur-, and phosphorous-rich compounds to the Baltic Sea. Seasonal changes of the DOM composition and dissolved organic nitrogen concentrations were found in the deep, stagnant, and anoxic basins, indicating vertical transport of organic particles and organic matter processing in the basins. DOM in the anoxic basins was enriched with sulfur compounds. Abiotic sulfurization reactions in the sulfidic basins are proposed as a likely reason. The inflow of sulfur-rich DOM from North Sea tidal flats and the discharge from the more anthropogenically influenced rivers are likely contributing additional sulfur-containing DOM to the southwestern Baltic Sea and the Kattegat area. Using a box model approach, we estimated that between 43 and 51% of the total terrestrial DOC that is supplied by rivers is removed in the Baltic Sea, while 1.8–2.1 Tg terrestrial DOC is exported per year to the North Sea. These fluxes were comparable for spring and autumn. This suggests that, due to the long residence times of terrestrial DOC in the Baltic Sea (3.7 years in the Bothnian Bay to 6.9 years in the Baltic Proper), seasonal changes of biotransformation and riverine discharge of terrestrial DOM become largely undetectable. More research is needed to reliably predict how the outflow of terrestrial DOM will change over longer time spans if the riverine export of terrestrial DOM from the sub-arctic north should increase in the future.
Author Contributions
MS, MM, and TD conceived the study; MS and MM performed chemical analyses; KJ and DH provided microbiological data; MS, TD, and BD performed flux calculations; DH and DS provided nutrient data; MS wrote the manuscript with significant contributions from all authors.
Funding
This work was supported by the ATKiM Project from the Leibniz Society (SAW-2011-IOW-3) to DH, KJ, and MM as well as by the German Science Foundation (DFG, JU 367/15-1) to KJ, and by the Leibniz Institute for Baltic Sea Research Warnemünde.
Conflict of Interest Statement
The authors declare that the research was conducted in the absence of any commercial or financial relationships that could be construed as a potential conflict of interest.
Acknowledgments
We thank the captains and crews of R/V Meteor for their help during the sampling campaigns (legs M86 and M87). We are also thankful to Matthias Friebe, Katrin Klaproth, and Ina Ulber (University of Oldenburg, Germany) for technical assistance. We further acknowledge the reviewers and the editor for their thoughtful and valuable comments that led to an improved manuscript.
Supplementary Material
The Supplementary Material for this article can be found online at: https://www.frontiersin.org/article/10.3389/feart.2017.00031/full#supplementary-material
References
Aarnos, H., Ylöstalo, P., and Vähätalo, A. V. (2012). Seasonal phototransformation of dissolved organic matter to ammonium, dissolved inorganic carbon, and labile substrates supporting bacterial biomass across the Baltic Sea. J. Geophys. Res. 117, G01004. doi: 10.1029/2010jg001633
Algesten, G., Brydsten, L., Jonsson, P., Kortelainen, P., Löfgren, S., Rahm, L., et al. (2006). Organic carbon budget for the Gulf of Bothnia. J. Mar. Syst. 63, 155–161. doi: 10.1016/j.jmarsys.2006.06.004
Alling, V., Humborg, C., Mörth, C.-M., Rahm, L., and Pollehne, F. (2008). Tracing terrestrial organic matter by δ34S and δ13C signatures in a subarctic estuary. Limnol. Oceanogr. 53, 2594–2602. doi: 10.4319/lo.2008.53.6.2594
Alling, V., Sanchez-Garcia, L., Porcelli, D., Pugach, S., Vonk, J. E., van Dongen, B., et al. (2010). Nonconservative behavior of dissolved organic carbon across the Laptev and East Siberian seas. Glob. Biogeochem. Cycles 24:GB4033. doi: 10.1029/2010GB003834
Asmala, E., Autio, R., Kaartokallio, H., Pitkänen, L., Stedmon, C., and Thomas, D. (2013). Bioavailability of riverine dissolved organic matter in three Baltic Sea estuaries and the effect of catchment land use. Biogeosciences 10, 6969–6986. doi: 10.5194/bg-10-6969-2013
Bauer, J., and Bianchi, T. (2011). Dissolved organic carbon cycling and transformation. Treat. Estuar. Coast. Sci. 5, 7–67. doi: 10.1016/B978-0-12-374711-2.00502-7
Benner, R., Biddanda, B., Black, B., and McCarthy, M. (1997). Abundance, size distribution, and stable carbon and nitrogen isotopic compositions of marine organic matter isolated by tangential-flow ultrafiltration. Mar. Chem. 57, 243–263. doi: 10.1016/S0304-4203(97)00013-3
Bianchi, T. S., Rolff, C., and Lambert, C. D. (1997). Sources and composition of particulate organic carbon in the Baltic Sea: the use of plant pigments and lignin-phenols as biomarkers. Mar. Ecol. Prog. Ser. 156, 25–31. doi: 10.3354/meps156025
Borges, A. V. (2005). Do we have enough pieces of the jigsaw to integrate CO2 fluxes in the coastal ocean? Estuaries 28, 3–27. doi: 10.1007/BF02732750
Conley, D. J., Björck, S., Bonsdorff, E., Carstensen, J., Destouni, G., Gustafsson, B. G., et al. (2009). Hypoxia-related processes in the Baltic Sea. Environ. Sci. Technol. 43, 3412–3420. doi: 10.1021/es802762a
Conley, D. J., Humborg, C., Smedberg, E., Rahm, L., Papush, L., Danielsson, Å., et al. (2008). Past, present and future state of the biogeochemical Si cycle in the Baltic Sea. J. Mar. Syst. 73, 338–346. doi: 10.1016/j.jmarsys.2007.10.016
Deutsch, B., Alling, V., Humborg, C., Korth, F., and Mörth, C. M. (2012). Tracing inputs of terrestrial high molecular weight dissolved organic matter within the Baltic Sea ecosystem. Biogeosciences 9, 4465–4475. doi: 10.5194/bg-9-4465-2012
Dittmar, T., de Rezende, C. E., Manecki, M., Niggemann, J., Coelho Ovalle, A. R., Stubbins, A., et al. (2012). Continuous flux of dissolved black carbon from a vanished tropical forest biome. Nat. Geosci. 5, 618–622. doi: 10.1038/ngeo1541
Dittmar, T., Koch, B., Hertkorn, N., and Kattner, G. (2008). A simple and efficient method for the solid-phase extraction of dissolved organic matter (SPE-DOM) from seawater. Limnol. Oceanogr. Methods 6, 230–235. doi: 10.4319/lom.2008.6.230
Dittmar, T., and Koch, B. P. (2006). Thermogenic organic matter dissolved in the abyssal ocean. Mar. Chem. 102, 208–217. doi: 10.1016/j.marchem.2006.04.003
Eilola, K., and Stigebrandt, A. (1998). Spreading of juvenile freshwater in the Baltic proper. J. Geophys. Res. 103, 27795–27807. doi: 10.1029/98JC02369
Gasol, J. M., Zweifel, U. L., Peters, F., Fuhrman, J. A., and Hagström, A. (1999). Significance of size and nucleic acid content heterogeneity as measured by flow cytometry in natural planktonic bacteria. Appl. Environ. Microbiol. 65, 4475–4483.
Gattuso, J.-P., Frankignoulle, M., and Wollast, R. (1998). Carbon and carbonate metabolism in coastal aquatic ecosystems. Annu. Rev. Ecol. Syst. 29, 405–434. doi: 10.1146/annurev.ecolsys.29.1.405
Gomez-Saez, G. V., Niggemann, J., Dittmar, T., Pohlabeln, A. M., Lang, S. Q., Noowong, A., et al. (2016). Molecular evidence for abiotic sulfurization of dissolved organic matter in marine shallow hydrothermal systems. Geochim. Cosmochim. Acta 190, 35–52. doi: 10.1016/j.gca.2016.06.027
Gonsior, M., Peake, B. M., Cooper, W. T., Podgorski, D., D'Andrilli, J., and Cooper, W. J. (2009). Photochemically induced changes in dissolved organic matter identified by ultrahigh resolution Fourier transform ion cyclotron resonance mass spectrometry. Environ. Sci. Technol. 43, 698–703. doi: 10.1021/es8022804
Gonsior, M., Peake, B. M., Cooper, W. T., Podgorski, D. C., D'Andrilli, J., Dittmar, T., et al. (2011a). Characterization of dissolved organic matter across the Subtropical Convergence off the South Island, New Zealand. Mar. Chem. 123, 99–110. doi: 10.1016/j.marchem.2010.10.004
Gonsior, M., Zwartjes, M., Cooper, W. J., Song, W., Ishida, K. P., Tseng, L. Y., et al. (2011b). Molecular characterization of effluent organic matter identified by ultrahigh resolution mass spectrometry. Water Res. 45, 2943–2953. doi: 10.1016/j.watres.2011.03.016
Grasshoff, K., Kremling, K., and Ehrhardt, M. (1999). Methods of Seawater Analysis. Weinheim: Wiley-VCH.
Green, N. W., Perdue, E. M., Aiken, G. R., Butler, K. D., Chen, H., Dittmar, T., et al. (2014). An intercomparison of three methods for the large-scale isolation of oceanic dissolved organic matter. Mar. Chem. 161, 14–19. doi: 10.1016/j.marchem.2014.01.012
Guo, L., Tanaka, N., Schell, D. M., and Santschi, P. H. (2003). Nitrogen and carbon isotopic composition of high-molecular-weight dissolved organic matter in marine environments. Mar. Ecol. Prog. Ser. 252, 51–60. doi: 10.3354/meps252051
Gustafsson, E., Deutsch, B., Gustafsson, B. G., Humborg, C., and Mörth, C. M. (2014). Carbon cycling in the Baltic Sea — the fate of allochthonous organic carbon and its impact on air–sea CO2 exchange. J. Mar. Syst. 129, 289–302. doi: 10.1016/j.jmarsys.2013.07.005
Herlemann, D. P. R., Manecki, M., Meeske, C., Pollehne, F., Labrenz, M., Schulz-Bull, D., et al. (2014). Uncoupling of bacterial and terrigenous dissolved organic matter dynamics in decomposition experiments. PLoS ONE 9:e93945. doi: 10.1371/journal.pone.0093945
Hernes, P. J., and Benner, R. (2003). Photochemical and microbial degradation of dissolved lignin phenols: implications for the fate of terrigenous dissolved organic matter in marine environments. J. Geophys. Res. 108, 3291. doi: 10.1029/2002JC001421
Hertkorn, N., Benner, R., Frommberger, M., Schmitt-Kopplin, P., Witt, M., Kaiser, K., et al. (2006). Characterization of a major refractory component of marine dissolved organic matter. Geochim. Cosmochim. Acta 70, 2990–3010. doi: 10.1016/j.gca.2006.03.021
Højerslev, N. K., Holt, N., and Aarup, T. (1996). Optical measurements in the North Sea-Baltic Sea transition zone. I. On the origin of the deep water in the Kattegat. Cont. Shelf Res. 16, 1329–1342. doi: 10.1016/0278-4343(95)00075-5
Jaffé, R., Ding, Y., Niggemann, J., Vähätalo, A. V., Stubbins, A., Spencer, R. G. M., et al. (2013). Global charcoal mobilization from soils via dissolution and riverine transport to the oceans. Science 340, 345–347. doi: 10.1126/science.1231476
Kim, S., Kaplan, L. A., and Hatcher, P. G. (2006). Biodegradable dissolved organic matter in a temperate and a tropical stream determined from ultra-high resolution mass spectrometry. Limnol. Oceanogr. 51, 1054–1063. doi: 10.4319/lo.2006.51.2.1054
Kim, S., Kramer, R. W., and Hatcher, P. G. (2003). Graphical method for analysis of ultrahigh-resolution broadband mass spectra of natural organic matter, the Van Krevelen Diagram. Anal. Chem. 75, 5336–5344. doi: 10.1021/ac034415p
Koch, B. P., and Dittmar, T. (2006). From mass to structure: an aromaticity index for high-resolution mass data of natural organic matter. Rapid Commun. Mass Spectrom. 20, 926–932. doi: 10.1002/rcm.2386
Koch, B. P., and Dittmar, T. (2016). From mass to structure: an aromaticity index for high-resolution mass data of natural organic matter. Rapid Commun. Mass Spectrom. 30, 250–250. doi: 10.1002/rcm.7433
Koch, B. P., Dittmar, T., Witt, M., and Kattner, G. (2007). Fundamentals of molecular formula assignment to ultrahigh resolution mass data of natural organic matter. Anal. Chem. 79, 1758–1763. doi: 10.1021/ac061949s
Koch, B. P., Witt, M. R., Engbrodt, R., Dittmar, T., and Kattner, G. (2005). Molecular formulae of marine and terrigenous dissolved organic matter detected by electrospray ionization Fourier transform ion cyclotron resonance mass spectrometry. Geochim. Cosmochim. Acta 69, 3299–3308. doi: 10.1016/j.gca.2005.02.027
Kujawinski, E. B., Del Vecchio, R., Blough, N. V., Klein, G. C., and Marshall, A. G. (2004). Probing molecular-level transformations of dissolved organic matter: insights on photochemical degradation and protozoan modification of DOM from electrospray ionization Fourier transform ion cyclotron resonance mass spectrometry. Mar. Chem. 92, 23–37. doi: 10.1016/j.marchem.2004.06.038
Kujawinski, E. B., Longnecker, K., Blough, N. V., Vecchio, R. D., Finlay, L., Kitner, J. B., et al. (2009). Identification of possible source markers in marine dissolved organic matter using ultrahigh resolution mass spectrometry. Geochim. Cosmochim. Acta 73, 4384–4399. doi: 10.1016/j.gca.2009.04.033
Kuliński, K., Hammer, K., Schneider, B., and Schulz-Bull, D. (2016). Remineralization of terrestrial dissolved organic carbon in the Baltic Sea. Mar. Chem. 181, 10–17. doi: 10.1016/j.marchem.2016.03.002
Kuliński, K., and Pempkowiak, J. (2011). The carbon budget of the Baltic Sea. Biogeosciences 8, 3219–3230. doi: 10.5194/bg-8-3219-2011
Kuliński, K., and Pempkowiak, J. (2012). Carbon Cycling in the Baltic Sea. Springer: Springer Science & Business Media.
Kullenberg, G., and Jacobsen, T. S. (1981). The Baltic Sea: an outline of its physical oceanography. Mar. Pollut. Bull. 12, 183–186. doi: 10.1016/0025-326X(81)90168-5
Lechtenfeld, O. J., Koch, B. P., Gašparović, B., Frka, S., Witt, M., and Kattner, G. (2013). The influence of salinity on the molecular and optical properties of surface microlayers in a karstic estuary. Mar. Chem. 150, 25–38. doi: 10.1016/j.marchem.2013.01.006
Letscher, R. T., Hansell, D. A., and Kadko, D. (2011). Rapid removal of terrigenous dissolved organic carbon over the Eurasian shelves of the Arctic Ocean. Mar. Chem. 123, 78–87. doi: 10.1016/j.marchem.2010.10.002
Löffler, A., Schneider, B., Perttilä, M., and Rehder, G. (2012). Air–sea CO2 exchange in the Gulf of Bothnia, Baltic Sea. Cont. Shelf Res. 37, 46–56. doi: 10.1016/j.csr.2012.02.002
Longnecker, K., and Kujawinski, E. B. (2011). Composition of dissolved organic matter in groundwater. Geochim. Cosmochim. Acta 75, 2752–2761. doi: 10.1016/j.gca.2011.02.020
Medeiros, P. M., Seidel, M., Dittmar, T., Whitman, W. B., and Moran, M. A. (2015a). Drought-induced variability in dissolved organic matter composition in a marsh-dominated estuary. Geophys. Res. Lett. 42, 6446–6453. doi: 10.1002/2015GL064653
Medeiros, P. M., Seidel, M., Ward, N. D., Carpenter, E. J., Gomes, H. R., Niggemann, J., et al. (2015b). Fate of the Amazon River dissolved organic matter in the tropical Atlantic Ocean. Glob. Biogeochem. Cycles 29, 677–690. doi: 10.1002/2015GB005115
Miller, W. L., and Zepp, R. G. (1995). Photochemical production of dissolved inorganic carbon from terrestrial organic matter: significance to the oceanic organic carbon cycle. Geophys. Res. Lett. 22, 417–420. doi: 10.1029/94GL03344
Mohrholz, V., Naumann, M., Nausch, G., Krüger, S., and Gräwe, U. (2015). Fresh oxygen for the Baltic Sea – an exceptional saline inflow after a decade of stagnation. J. Mar. Syst. 148, 152–166. doi: 10.1016/j.jmarsys.2015.03.005
Nausch, G., Feistel, R., Umlauf, L., Mohrholz, V., Nagel, K., and Siegel, H. (2012). Hydrographisch-Hydrochemische Zustandseinschätzung der Ostsee 2011. Meereswissenschaftliche Berichte, 86, Leibniz-Institut für Ostseeforschung Warnemünde.
Nausch, G., and Nehring, D. (1996). “Third periodic assessment of the state of the marine environment of the Baltic Sea, 1989-93,” in Baltic Proper: Hydrochemistry, Baltic Sea Environment Proceedings 64B (Helsinki: Helsinki Commission - Baltic Marine Environment Protection Commission), 80–84.
Obernosterer, I., and Benner, R. (2004). Competition between biological and photochemical processes in the mineralization of dissolved organic carbon. Limnol. Oceanogr. 49, 117–124. doi: 10.4319/lo.2004.49.1.0117
Oksanen, J., Blanchet, F. G., Kindt, R., Legendre, P., Minchin, P. R., O'Hara, R. B., et al. (2015). Vegan: Community Ecology Package. R package version 2.3-0. Available online at: http://CRAN.R-project.org/package=vegan
Osburn, C. L., and Stedmon, C. A. (2011). Linking the chemical and optical properties of dissolved organic matter in the Baltic–North Sea transition zone to differentiate three allochthonous inputs. Mar. Chem. 126, 281–294. doi: 10.1016/j.marchem.2011.06.007
Osterholz, H., Kirchman, D. L., Niggemann, J., and Dittmar, T. (2016). Environmental drivers of dissolved organic matter molecular composition in the Delaware Estuary. Front. Earth Sci. 4:95. doi: 10.3389/feart.2016.00095
Raeke, J., Lechtenfeld, O. J., Wagner, M., Herzsprung, P., and Reemtsma, T. (2016). Selectivity of solid phase extraction of freshwater dissolved organic matter and its effect on ultrahigh resolution mass spectra. Environ. Sci. 18, 918–927. doi: 10.1039/c6em00200e
Rahm, L., and Danielsson, Å. (2007). Spatial heterogeneity of nutrients in the Baltic Proper, Baltic Sea. Estuar. Coast. Shelf Sci. 73, 268–278. doi: 10.1016/j.ecss.2007.01.009
Räike, A., Kortelainen, P., Mattsson, T., and Thomas, D. N. (2016). Long-term trends (1975–2014) in the concentrations and export of carbon from Finnish rivers to the Baltic Sea: organic and inorganic components compared. Aquat. Sci. 78, 505–523. doi: 10.1007/s00027-015-0451-2
Riedel, T., Zark, M., Vähätalo, A., Niggemann, J., Spencer, R., Hernes, P., et al. (2016). Molecular signatures of biogeochemical transformations in dissolved organic matter from ten World Rivers. Front. Earth Sci. 4:95. doi: 10.3389/feart.2016.00085
R core team (2015). R: A Language and Environment for Statistical Computing. Vienna: R Foundation for Statistical Computing. Available online at: http://www.R-project.org/
Savchuk, O. P. (2005). Resolving the Baltic Sea into seven subbasins: N and P budgets for 1991–1999. J. Mar. Syst. 56, 1–15. doi: 10.1016/j.jmarsys.2004.08.005
Schlitzer, R. (2016). Ocean Data View. Available online at: http://odv.awi.de
Schmidt, F., Elvert, M., Koch, B. P., Witt, M., and Hinrichs, K.-U. (2009). Molecular characterization of dissolved organic matter in pore water of continental shelf sediments. Geochim. Cosmochim. Acta 73, 3337–3358. doi: 10.1016/j.gca.2009.03.008
Schmidt, F., Koch, B. P., Elvert, M., Schmidt, G., Witt, M., and Hinrichs, K.-U. (2011). Diagenetic transformation of dissolved organic nitrogen compounds under contrasting sedimentary redox conditions in the Black Sea. Environ. Sci. Technol. 45, 5223–5229. doi: 10.1021/es2003414
Schneider, B., Gülzow, W., Sadkowiak, B., and Rehder, G. (2014). Detecting sinks and sources of CO2 and CH4 by ferrybox-based measurements in the Baltic Sea: three case studies. J. Mar. Syst. 140(Pt A), 13–25. doi: 10.1016/j.jmarsys.2014.03.014
Seidel, M., Beck, M., Riedel, T., Waska, H., Suryaputra, I. G. N. A., Schnetger, B., et al. (2014). Biogeochemistry of dissolved organic matter in an anoxic intertidal creek bank. Geochim. Cosmochim. Acta 140, 418–434. doi: 10.1016/j.gca.2014.05.038
Seidel, M., Beck, M., Riedel, T., Waska, H., Suryaputra, I. G. N. A., Schnetger, B., et al. (2015a). Benthic-pelagic coupling of nutrients and dissolved organic matter composition in an intertidal sandy beach. Mar. Chem. 176, 150–163. doi: 10.1016/j.marchem.2015.08.011
Seidel, M., Yager, P. L., Ward, N. D., Carpenter, E. J., Gomes, H. R., Krusche, A. V., et al. (2015b). Molecular-level changes of dissolved organic matter along the Amazon river-to-ocean continuum. Mar. Chem. 177, 218–231. doi: 10.1016/j.marchem.2015.06.019
Sholkovitz, E. R., Boyle, E. A., and Price, N. B. (1978). The removal of dissolved humic acids and iron during estuarine mixing. Earth Planet. Sci. Lett. 40, 130–136. doi: 10.1016/0012-821X(78)90082-1
Sleighter, R. L., Chin, Y.-P., Arnold, W. A., Hatcher, P. G., McCabe, A. J., McAdams, B. C., et al. (2014). Evidence of incorporation of abiotic S and N into prairie wetland dissolved organic matter. Environ. Sci. Technol. Lett. 1, 345–350. doi: 10.1021/ez500229b
Sleighter, R. L., and Hatcher, P. G. (2008). Molecular characterization of dissolved organic matter (DOM) along a river to ocean transect of the lower Chesapeake Bay by ultrahigh resolution electrospray ionization Fourier transform ion cyclotron resonance mass spectrometry. Mar. Chem. 110, 140–152. doi: 10.1016/j.marchem.2008.04.008
Smedberg, E., Mörth, C.-M., Swaney, D. P., and Humborg, C. (2006). Modeling hydrology and silicon-carbon interactions in taiga and tundra biomes from a landscape perspective: implications for global warming feedbacks. Glob. Biogeochem. Cycles 20:GB2014. doi: 10.1029/2005GB002567
Spencer, R. G. M., Stubbins, A., Hernes, P. J., Baker, A., Mopper, K., Aufdenkampe, A. K., et al. (2009). Photochemical degradation of dissolved organic matter and dissolved lignin phenols from the Congo River. J. Geophys. Res. 114:G03010. doi: 10.1029/2009jg000968
Stålnacke, P., Grimvall, A., Sundblad, K., and Tonderski, A. (1999). Estimation of riverine loads of nitrogen and phosphorus to the Baltic Sea, 1970–1993. Environ. Monit. Assess. 58, 173–200. doi: 10.1023/A:1006073015871
Stedmon, C. A., Markager, S., and Kaas, H. (2000). Optical properties and signatures of chromophoric dissolved organic matter (CDOM) in Danish coastal waters. Estuar. Coast. Shelf Sci. 51, 267–278. doi: 10.1006/ecss.2000.0645
Stedmon, C. A., Osburn, C. L., and Kragh, T. (2010). Tracing water mass mixing in the Baltic–North Sea transition zone using the optical properties of coloured dissolved organic matter. Estuar. Coast. Shelf Sci. 87, 156–162. doi: 10.1016/j.ecss.2009.12.022
Stenson, A. C., Marshall, A. G., and Cooper, W. T. (2003). Exact masses and chemical formulas of individual Suwannee River fulvic acids from ultrahigh resolution electrospray ionization Fourier transform ion cyclotron resonance mass spectra. Anal. Chem. 75, 1275–1284. doi: 10.1021/ac026106p
Struck, U., Pollehne, F., Bauerfeind, E., and Bodungen, B. V. (2004). Sources of nitrogen for the vertical particle flux in the Gotland Sea (Baltic Proper)—results from sediment trap studies. J. Mar. Syst. 45, 91–101. doi: 10.1016/j.jmarsys.2003.11.012
Stubbins, A., Spencer, R. G. M., Chen, H. M., Hatcher, P. G., Mopper, K., Hernes, P. J., et al. (2010). Illuminated darkness: molecular signatures of Congo River dissolved organic matter and its photochemical alteration as revealed by ultrahigh precision mass spectrometry. Limnol. Oceanogr. 55, 1467–1477. doi: 10.4319/lo.2010.55.4.1467
Thomas, H., Pempkowiak, J., Wulff, F., and Nagel, K. (2010). “The Baltic Sea,” in Carbon and Nutrient Fluxes in Continental Margins - A Global Synthesis, Global Change - the IGBP Series, eds K. K. Liu, L. Atkinson, R. Quinones, and L. Talaue-McManus (Berlin: Springer), 334–345.
Urtizberea, A., Dupont, N., Rosland, R., and Aksnes, D. L. (2013). Sensitivity of euphotic zone properties to CDOM variations in marine ecosystem models. Ecol. Model. 256, 16–22. doi: 10.1016/j.ecolmodel.2013.02.010
Vähätalo, A. V., and Zepp, R. G. (2005). Photochemical mineralization of dissolved organic nitrogen to ammonium in the Baltic Sea. Environ. Sci. Technol. 39, 6985–6992. doi: 10.1021/es050142z
Voss, M., Dippner, J. W., Humborg, C., Hürdler, J., Korth, F., Neumann, T., et al. (2011). History and scenarios of future development of Baltic Sea eutrophication. Estuar. Coast. Shelf Sci. 92, 307–322. doi: 10.1016/j.ecss.2010.12.037
Voss, M., Emeis, K. C., Hille, S., Neumann, T., and Dippner, J. W. (2005). Nitrogen cycle of the Baltic Sea from an isotopic perspective. Glob. Biogeochem. Cycles 19, 1–15. doi: 10.1029/2004gb002338
Wagner, S., Riedel, T., Niggemann, J., Vähätalo, A. V., Dittmar, T., and Jaffé, R. (2015). Linking the molecular signature of heteroatomic dissolved organic matter to watershed characteristics in world rivers. Environ. Sci. Technol. 49, 13798–13806. doi: 10.1021/acs.est.5b00525
Ward, N., Bianchi, T., Medeiros, P., Seidel, M., Richey, J., Keil, R., et al. (2017). Where carbon goes when water flows: carbon cycling across the aquatic continuum. Front. Mar. Sci. 4:7. doi: 10.3389/fmars.2017.00007
Ylöstalo, P., Seppälä, J., Kaitala, S., Maunula, P., and Simis, S. (2016). Loadings of dissolved organic matter and nutrients from the Neva River into the Gulf of Finland – biogeochemical composition and spatial distribution within the salinity gradient. Mar. Chem. 186, 58–71. doi: 10.1016/j.marchem.2016.07.004
Keywords: Baltic Sea, sub-arctic rivers, discharge, dissolved organic matter, ultrahigh-resolution mass spectrometry, seasonal variation
Citation: Seidel M, Manecki M, Herlemann DPR, Deutsch B, Schulz-Bull D, Jürgens K and Dittmar T (2017) Composition and Transformation of Dissolved Organic Matter in the Baltic Sea. Front. Earth Sci. 5:31. doi: 10.3389/feart.2017.00031
Received: 07 November 2016; Accepted: 06 April 2017;
Published: 02 May 2017.
Edited by:
Toshi Nagata, University of Tokyo, JapanReviewed by:
Clare Elizabeth Davis, University of Liverpool, UKYouhei Yamashita, Hokkaido University, Japan
Copyright © 2017 Seidel, Manecki, Herlemann, Deutsch, Schulz-Bull, Jürgens and Dittmar. This is an open-access article distributed under the terms of the Creative Commons Attribution License (CC BY). The use, distribution or reproduction in other forums is permitted, provided the original author(s) or licensor are credited and that the original publication in this journal is cited, in accordance with accepted academic practice. No use, distribution or reproduction is permitted which does not comply with these terms.
*Correspondence: Michael Seidel, m.seidel@uni-oldenburg.de
†Present Address: Barbara Deutsch, Biota—Institut für Ökologische Forschung und Planung GmbH, Bützow, Germany