Learning about Hydrothermal Volcanic Activity by Modeling Induced Geophysical Changes
 Gilda M. Currenti
 Rosalba Napoli
- Istituto Nazionale di Geofisica e Vulcanologia, Catania, Italy
Motivated by ongoing efforts to understand the nature and the energy potential of geothermal resources, we devise a coupled numerical model (hydrological, thermal, mechanical), which may help in the characterization and monitoring of hydrothermal systems through computational experiments. Hydrothermal areas in volcanic regions arise from a unique combination of geological and hydrological features which regulate the movement of fluids in the vicinity of magmatic sources capable of generating large quantities of steam and hot water. Numerical simulations help in understanding and characterizing rock-fluid interaction processes and the geophysical observations associated with them. Our aim is the quantification of the response of different geophysical observables (i.e., deformation, gravity, and magnetic fields) to hydrothermal activity on the basis of a sound geological framework (e.g., distribution and pathways of the flows, the presence of fractured zones, caprock). A detailed comprehension and quantification of the evolution and dynamics of the geothermal systems and the definition of their internal state through a geophysical modeling approach are essential to identify the key parameters for which the geothermal system may fulfill the requirements to be exploited as a source of energy. For the sake of illustration only, the numerical computations are focused on a conceptual model of the hydrothermal system of Vulcano Island by simulating a generic 1-year unrest and estimating different geophysical changes. We solved (i) the mass and energy balance equations of flow in porous media for temperature, pressure and density changes, (ii) the elastostatic equation for the deformation field and (iii) the Poisson's equations for gravity and magnetic potential fields. Under the model assumptions, a generic unrest of 1-year engenders on the ground surface low amplitude changes in the investigated geophysical observables, that, being above the accuracies of the modern state-of-the-art instruments, could be traced by continuously running multi-parametric monitoring networks. Devising multidisciplinary and easy-to-use computational experiments enable us to learn how the hydrothermal system responds to unrest and which fingerprints it may leave in the geophysical signals.
Introduction
The concept of “safe and sustainable energy” is seeing a growing interest among the general populations in many countries. As the exhaustion rates of non-renewable resources are rapidly increasing, renewable energy resources are being demanded, and adopted. Geothermal energy, originating from the hot interior of the Earth, is one of the most promising and clean renewable energy resources and recently is gaining special attention in the new energy planning of our planet. Volcanic areas are generally favorable sites for geothermal resources, since the interaction of groundwater and hot magmatic systems produces convection cells whereby hot water is circulated within a permeable zone promoting the establishment of a hydrothermal system within the volcanic complex.
The characterization of the dynamics of a hydrothermal system is of significant economic importance for the effective exploitation of the geo-resource. To this end, a multidisciplinary geophysical approach may contribute to unraveling the processes involved. Continuous observations of ground deformation, gravity and geomagnetic changes have been carried out on many active volcanoes (e.g., Bonforte et al., 2008; Napoli et al., 2008; Currenti et al., 2009; Greco et al., 2010; Currenti, 2014). These observations have mainly been aimed at detecting the modifications of the stress field and of the thermodynamic state related to the magmatic system preceding and accompanying volcanic unrest (Dzurisin, 2007; Battaglia et al., 2008; Currenti et al., 2011; Napoli et al., 2011). However, also non-magmatic sources associated to the perturbation of the hydrothermal system may produce observable geophysical signals (Fournier and Chardot, 2012; Coco et al., 2016a). In particular, the hydrothermal activity results in the heating and pressurization of hydrothermal fluids, which in turn induces changes in different geophysical parameters. Fluid circulation, temperature, and pore-pressure changes necessarily induce thermal, stress and strain variations, which alter the density distribution and the magnetization of the porous media and are reflected on the ground surface in observable variations in deformation, gravity and magnetic fields. Monitoring these geophysical observables, which are the surface expressions of processes that are not directly accessible, and developing tools for their interpretation are the keys to open up new perspectives in the exploration, exploitation and monitoring of hydrothermal areas.
Most geophysical modeling tools have been developed to interpret signals of magmatic origin and the investigations on hydrothermal systems have benefited greatly of these developments. Indeed, the methods cannot always be directly transferred from magmatic to hydrothermal systems and more sophisticated tools and refinements are required. The design of specific models for hydrothermally-driven geophysical processes provides simulation results that may assist in evaluating which properties and characteristics may actually be observed and measured. This enables gathering useful information for the exploration and monitoring of geothermal systems, while minimizing exploration risk with the aim of finding the right balance between cost and risk. In addition, modeling results may help in the optimal design of geophysical monitoring networks for the definition of their configuration and the choice of the measurement resolution devices.
To date, few studies have addressed the modeling of the expected geophysical changes associated with thermal and pore pressure changes induced by hydrothermal processes in volcanic areas. Computational tools used to calculate temporal changes in different individual geophysical observables have been developed since the early 1990's (Ishido and Pritchett, 1999). More recently, Okubo et al. (2006) have developed a postprocessor to calculate the thermomagnetic field variations caused by hydrothermal activities in volcanic regions. Aizawa et al. (2009) conducted a numerical simulation using the finite difference method, calculating the spatial and temporal underground conditions (pressure, temperature, fluid flux) and resulting distributions of resistivity and self-potential. Numerical computations of magnetic field changes due to the piezomagnetic effect caused by hydrothermal pressurization have been afforded by Okubo and Kanda (2010), while computations on ground deformation induced by hydrothermal activity have been investigated in several studies (Hutnak et al., 2009; Rinaldi et al., 2010; Todesco et al., 2010; Troiano et al., 2011; Fournier and Chardot, 2012; Petrillo et al., 2013).
Here, we illustrate the integrated modeling assessment of various induced geophysical changes in a volcano-hydrothermal system. By means of a physics-based approach, it is possible to characterize the system (e.g., temperature distributions, plume diffusion, gas saturation) and monitor the dynamics of its internal state. In order to investigate how hydrothermal fluid circulation may affect ground deformation, magnetic, and gravity changes, a multi-parametric thermo-poroelastic simulator is proposed, which jointly solves (i) the mass and energy balance equations for a multiphase ground-water flow, (ii) the elastostatic equation for evaluating the induced deformation field and (iii) the Poisson's equations for estimating the thermo-magnetic and gravity changes. Two well-established codes, TOUGH2 for simulating fluid-flow in porous media and COMSOL Multiphysics, for solving coupled Partial Differential Equations (PDE), are linked by programming new specific subroutines for automatic sequence execution and data transfer. By fully exploiting the functionality and modularity of the codes, medium heterogeneity in all rock material properties and complex geometries have been handled to jointly estimate temporal changes in geophysical observables induced by hydrothermal activity. To illustrate the feasibility of the numerical approach, computations are designed to model the geophysical response of the hydrothermal system of Vulcano Island to a generic unrest period. Although in recent times no magmatic eruptions have taken place at the island, changes in geochemical and geophysical parameters have been reported that reflect the activity of its hydrothermal system. Vulcano Island may well be considered a representative case due to its environmental settings, which are suitable for being comprised in the model design.
Hydrothermal Model
The hydro-geophysical model is based on the governing equations of the thermo-poro-elasticity theory, which describes the response of a porous medium to the propagation of hot fluid through pores. It is conceived on a well-established methodological approach, which has been applied to simulate hydrothermal activity in volcanic environments (Okubo and Kanda, 2010; Rinaldi et al., 2010; Coco et al., 2016a,b; and references therein). A one-way coupling model is considered in which the pore pressure and temperature changes influence the geophysical parameters (elastic stress, fluid density, rock magnetization), but not vice-versa. Although it is a limitation of the model, this assumption is not so restrictive since uncoupled and coupled pore pressure solutions are quite close for many ranges of medium properties (Roeloffs, 1988). Firstly, we simulate the evolution of a hydrothermal system using the TOUGH2 software and then compute the observables in a post-process calculation implemented under COMSOL Multiphysics programming environment. Vulcano Island has been selected as a case study since: (i) its hydrothermal activity is suitable to be described by the presented numerical approach and to show its capability; (ii) geochemical, geological, and volcanological investigations have provided the required information to set up the model material parameters (Chiodini et al., 1996; Granieri et al., 2006; Federico et al., 2010; Napoli and Currenti, 2016). Moreover, several geophysical data have been acquired over the last decades at Vulcano Island using different kinds of discrete and continuous measurement techniques, which may be used to assess the simulated results.
Vulcano Island Hydrothermal System
Vulcano Island represents the emerged part of an active NW-SE elongated composite volcano rising from the abyssal plane of the south of Tyrrhenian Sea Basin. The development of the island is strongly influenced by the Tindari–Letojanni regional dextral fault system and by minor N-S to NE-SW trending normal faults and cracks associated to the main NW–SE shear zone (Ventura et al., 1999; De Astis et al., 2013). The shallow structures of volcano complex were defined by several geophysical studies since the 70s (Barberi et al., 1994; Blanco-Montenegro et al., 2007; Napoli and Currenti, 2016; Ruch et al., 2016), and by two deep geothermal drillings (Figure 1) in 1983–1987 (Gioncada and Sbrana, 1991), located at the foot of the south-western and northern flanks of La Fossa crater. Since the end of the last magmatic eruption in 1890, the volcano activity has been characterized by fumarolic emissions of variable intensity and temperature and seismic crises due to magma-water interaction (Alparone et al., 2010; Federico et al., 2010). An active hydrothermal system has been detected beneath La Fossa Caldera, developed as a consequence of different collapse events between 80-8 ka (De Astis et al., 2013). Gravity, seismological, and geochemical studies (Chiodini et al., 1992; Berrino, 2000; Alparone et al., 2010) place the active hydrothermal system at a depth between 500 and 1500 m below sea level. At present, its activity is represented by fumarolic emissions located within the crater, where a few high temperature zones are active (De Astis et al., 2003) on the southern and northern flanks of the edifice and in the eastern part of the island (baia di Levante). Carbon dioxide represents the main constituent of anhydrous gases. During periods of quiet and moderate hydrothermal activity, average water flux of about 1,300 t/day and a total CO2 output of 482 t/day have been estimated (Inguaggiato et al., 2012). In recent decades, few episodes of increasing fumarolic activity occurred that were marked by rapid and intense modifications of both geochemical features and the output rate of fumarolic fluids (Federico et al., 2010), which generally persist for few months. On average during crisis episodes the peaks in the carbon dioxide flux rate sharply raises to 1,000 t/day (Granieri et al., 2006).
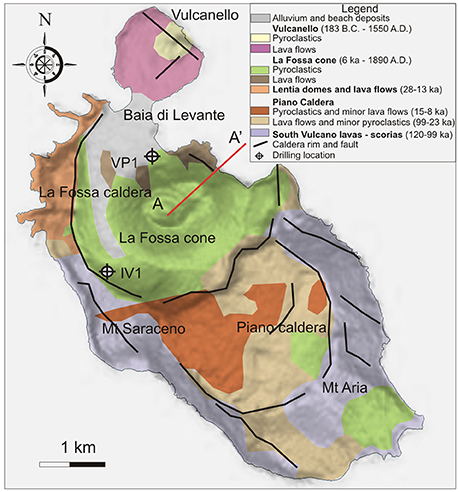
Figure 1. Simplified geological map of Vulcano Island. The profile AA' (red line) defines the vertical section of the axi-symmetric model.
Numerical Model of the Vulcano Island Hydrothermal System
The hot fluid circulation in the hydrothermal system is simulated using the EOS2 module of TOUGH2 software, which incorporates CO2-H2O equations of state in the temperature and pressure range 0–350°C and 0–100 MPa, respectively. It solves the mass and energy balance equations for a two-phase flow (Pruess et al., 1999). Without loss of generality, the model is designed in an axi-symmetric formulation in a computational domain of a 10 × 1.5 km which describes the shallowest portion of the hydrothermal system. We chose a NE-SW profile (Figure 1) and included the real topography of Vulcano using a digital elevation model from the 90 m Shuttle Radar Topography Mission (SRTM) data and a bathymetry model from the GEBCO database (http://www.gebco.net/). Atmospheric pressure is fixed along the subaerial boundary and hydrostatic pressure is assigned to the submarine boundary, whereas the bottom boundary has a constant basal heat flux of 60 mW/m2 and is impermeable except at locations where fluids are being injected. Generally, the rock permeability at depth are low and impermeable boundary conditions does not significantly affect the simulation results. Additionally, in Vulcano Island a monzodioritic subintrusive body, which is inherently low permeable, is firstly encountered between La Fossa Caldera and Piano Caldera in the AGIP well at about 1,000 km (AGIP, 1987; Gioncada and Sbrana, 1991) in agreement with a high Vp-body detected by seismic tomography (Chiarabba et al., 2004). Its presence lowers the permeability values and makes suitable the assumption of impermeable condition at the bottom of the computational domain. At the lateral external boundary the hydrostatic pressure and the geothermal gradient (130°C/km; AGIP, 1987) are assigned.
The hydrological model properties are inferred from logs of the deep VP1 borehole (Figure 2), which allows identifying the succession of different layers from top to bottom (Gioncada and Sbrana, 1991; Tommasi et al., 2016).
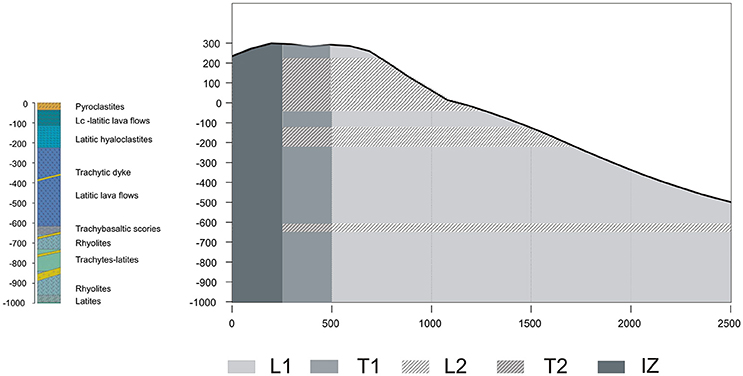
Figure 2. A simplified scheme of the complex geological structure of Vulcano Island along the section AA' (Figure 1) based on the stratigraphy of the VP1 deep borehole reported on the left (after Blanco-Montenegro et al., 2007). In the lack of measurements on permeability of Vulcano Island rock, the lithology units are grouped into two main classes with expected high (hyaloclastites, pyroclastites, scories) and low permeability (latitic lava flows, trachytic intrusion) values. The model domain comprises five different regions with different hydrological properties: L1 (porosity: 0.15; permeability: 5 × 10⁻¹⁵ m2); L2 (porosity: 0.45; permeability: 10−14 m2); T1 (porosity: 0.15; permeability: 10−14 m2); T2 (porosity: 0.15; permeability: 5 × 10⁻¹⁴ m2); IZ (porosity: 0.10; permeability: 5 × 10⁻¹⁴ m2).
At Vulcano Island, such as in other volcanic environments, no detailed information necessary to build up a more complex model material is available especially for fluid flow parameters (permeability, porosity, hydrological model). In the lack of specific data, we have preferred to use a simplified layered structure to represent the geology of the volcano complex. An heterogeneous domain, which considers alternation along and across the main flow paths of hydrothermal fluids, is defined by grouping the lithologic units (Currenti et al., 2017; Figure 2). Particularly, we grouped the lithology units into two main classes with high (hyaloclastites, pyroclastites, scories) and low permeability (latitic lava flows, trachytic intrusion) values. Indeed, Figure 2 shows the correspondence between the grouped lithologic units and the two material classes. To simulate the preferential central pathway of hydrothermal fluids within the rim of the present crater, where the main soil degassing is observed (Granieri et al., 2006), a 250 m wide inner zone is considered by assigning higher porosity and permeability values (Figure 2). On the basis of a conceptual model derived from geochemical investigations (Federico et al., 2010), the initial conditions of the numerical simulations are assigned by simulating thousands of years of continuous injection of 1,300 t/day of pure water and 450 t/day of CO2 at a temperature of 350°C and reaching a steady-state solution (Figure S1). The fluid is injected in a 250 m wide inlet located at the bottom of the domain near the symmetry axis. After having investigated different inlet sizes, the 250 m inlet was the minimum extent to reproduce the exhalation area at Vulcano Island. In order to evaluate the effect of enhanced fluid injection in the volcano-hydrothermal system on geophysical observables, we simulated an unrest phase of 1 year by increasing (after reaching the steady-state solution) the flux rate to 2,000 t/d for the water and to 1,000 t/d for the carbon dioxide content, in agreement with geochemical data collected at the Vulcano Island during several unrest phases (Chiodini et al., 1996; Granieri et al., 2006).
Full descriptions of the unrest on pore pressure, temperature, gas saturation have already been discussed in Currenti et al. (2017), where a model calibration has been performed by investigating different models in order to numerically reproduce the main features of the conceptual model of the hydrothermal system, derived from geophysical and geochemical investigations. Because of the large number of model parameters, it is not straightforward to perform a full sensitivity analysis. Among the model parameters, rock permeability values markedly influence the fluid flow simulation results. The incidence of several permeability configurations has been investigated (Currenti et al., 2017) following previous works (Okubo and Kanda, 2010; Todesco et al., 2010) and the more suitable to reproduce the surficial manifestations in Vulcano Island has been selected. A summary of the main results are reported in the Supplementary Material (Figure S2). Here we focus on the joint effects of increased activity on geophysical observables, namely ground deformation, gravity, and magnetic changes for the most suitable conceptual model of the hydro-thermal system.
Geophysical Changes
Using the changes in pore pressure, temperature, gas saturation and density computed by the fluid flow simulator and referred to the values achieved at the steady-state, the evolution of geophysical observables are then evaluated by a specifically thermo-poroelastic solver developed under the software COMSOL Multiphysics (COMSOL, 2012) by using the PDE engine. Ground deformation, gravity, and thermomagnetic changes are computed by solving a set of PDE which describes the geophysical problem. In the thermo-poroelastic model the computational domain is bounded by infinite mapped elements, which use appropriate transformation functions to map the finite domain into an infinite one and, hence, make the computational variables vanish toward infinity (Currenti, 2014).
Ground Deformation
Assuming that the timescale of deformation is slow enough to allow for pressure equilibration, the rock is in quasi-static equilibrium and the displacement can be found by solving the stress equilibrium equations coupled with thermo-poroelastic extension of the Hooke's law (Fung, 1965; Jaeger et al., 2007), giving the following set of equations:
where σ and ε are the stress and strain tensors, respectively, u is the deformation vector and λ and μ are the Lame's elastic medium parameters, related to the Poisson's ratio and Young's modulus. See Table S1 for a complete list of the symbols used. To the elastic stress tensor of the general Hooke's law, two terms are added: the ΔP pore-pressure contribution from poroelasticity theory through the β = (1-K/Ks) Biot-Willis coefficient, with K and Ks the drained and solid bulk modulus, respectively, and the ΔT temperature contribution from thermo-elasticity theory through the volumetric thermal expansion coefficient αT.
The mathematical problem is closed by imposing zero displacements at infinity and stress-free boundary condition σ · ns = 0 on the ground surface, where n is the normal vector to the ground surface.
Gravity Changes
Two-phase flow is inherently associated with fluid density redistributions, which induce gravity variations. Their quantification can be calculated by solving the following Poisson's differential equation for the gravitational potential φg (Currenti, 2014):
where G denotes the universal gravitational constant and Δρ is the change in the fluid density distribution respect to the initial steady-state condition Δρ = φ(ρt-ρ0), which occupies the porous volume fraction Φ (rock porosity). The fluid density ρi at each i-th time step for a two-phase system is given by:
where ρfi is the fluid density, ρgi the gas density and Si the gas saturation. The problem is closed imposing the condition of vanishing gravitational potential at infinity.
Thermomagnetic Changes
In hydrothermal areas, temperature changes are expected to be relevant and generally yield larger changes in rock magnetization. Therefore, we focused on the thermomagnetic effect and discounted piezomagnetic and electrokinetic effects that are related to stress-induced changes in rock magnetization and to the motion of electric charges within the volcanic edifice, respectively.
In magnetostatic problem, where no currents are present, the thermomagnetic problem can be solved using a scalar magnetic potential φm. The thermomagnetic field generated by changes in rock magnetization ΔJ associated with temperature variations, is given by:
Along the external boundaries the magnetic field is assumed to be tangential by assigning a Neumann condition on the magnetic potential . The problem is made unique by setting the potential to zero at an arbitrary point on the external boundary (Currenti et al., 2009). Inserire invio temperature-dependence of rock magnetization dominates magnetic field changes associated with hydrothermal activity. Following a formulation derived from laboratory experiments on rock sample (Okubo et al., 2006), the magnetization J varies with the temperature field by assuming it is equal to a fixed initial magnetization J0 when temperature T is less than T1 and equal to zero as T exceeds T2. For intermediate temperatures T1<T<T2, the magnetization varies as:
where η = (T − T1)/(T2 − T1).
Numerical Simulations
Material Properties
In order to estimate the expected geophysical changes generated by an unrest of the hydrothermal system, thermo-poro-elastic and magnetic properties of the rock materials need to be defined. Based on literature data (Rinaldi et al., 2010; Todesco et al., 2010; Troiano et al., 2011; Coco et al., 2016b), we chose average values for the volumetric thermal expansion parameter αT, fixed to 10−5°C−1, and for the drained bulk modulus, set to 5 GPa. As for mechanical properties, a heterogeneous medium description of Vulcano Island is assumed using a piecewise linear depth dependent distribution of the elastic material parameters derived from seismic tomography investigations (Ventura et al., 1999; Chiarabba et al., 2004). Within the computational domain the P-wave seismic velocity Vp varies from 2 to 4 km/s and the rock density ρ ranges between 2,100 and 2,400 kg/m3 (Table 1). Low values of Vp and ρ, related to the pyroclastics, hyaloclastites and hydrothermally altered rocks, were assigned to the shallow part of the volcanic edifice, up to 1 km of depth. Because of the axis-symmetric formulation, horizontal heterogeneities and local effects of high velocity bodies (Vp greater than 3 km/s) were disregarded. With increasing depth, higher values of seismic velocity and rock density related to intrusive or sub-intrusive bodies, as well as to crystallized conduits system, were assigned to the medium (Chiarabba et al., 2004). These Vp and ρ values were used to define the elastic Young modulus by the following equation (Kearey and Brooks, 1991):
An average value of 0.3 for the Poisson's ratio ν was derived by using a value of the ratio Vp/Vs of 1.85, adopted in seismic tomography at Vulcano (Chiarabba et al., 2004). Under these assumptions, within the computational domain the Young modulus increases from 9.0 GPa at shallow depth to 23.3 GPa at the bottom of the domain.
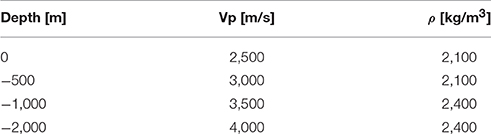
Table 1. Mechanical elastic parameter.
As regards the rock magnetic properties, it is assumed that the average direction of the total magnetization is close to Earth's present-day field direction (inclination of 54°, declination of 0.9°; Napoli and Currenti, 2016). At Vulcano Island the great variety of erupted volcanic products (e.g., lava flows, dikes, pyroclastic deposit) produces a significant heterogeneity in rock magnetic properties. From laboratory tests made on rock specimens of Vulcano Island, which indicated the highest magnetization values for lava flows (Zanella and Lanza, 1994), and the magnetization distributions from 2.75D and 3D magnetic models (Blanco-Montenegro et al., 2007; Napoli and Currenti, 2016), the value of the magnetization J0 (Equation 5) ranges from 0 to 10 A/m. In the area around the center of La Fossa cone, where the main temperature changes are concentrated (Figure S2), rock magnetization variations are expected. In particular, in this area the 3D magnetic model revealed a horseshoe-shaped high magnetized body elongated in the north-south direction for 1 km, with a volume of about 5.3 × 10⁷ m3 and intensity of about 8 A/m. Its magnetization and areal extension diminish with depth and it is bounded by low magnetized volumes that are ascribed to pyroclastic and hydrothermally altered rocks (Napoli and Currenti, 2016). Therefore, we assign to the model material a high magnetization value of 10 A/m in the region corresponding to the horseshoe-shaped body, while zero magnetization is attributed to the remaining domain. The values of the T1 and T2 parameters in the temperature-dependent magnetization function (Equation 5) are set to 100 and 600°C, respectively.
Ground Deformation
Currenti et al. (2017) computed the deformation response of the medium to the unrest of the Vulcano hydrothermal system in terms of pore-pressure and thermo-elastic effects. The time evolution of the radial pattern in the horizontal and vertical deformation are shown in Figure 3. As soon as the fluid injection rate at the inlet is increased, a horizontal displacement of a few millimeters affects an area extending between 1 and 3 km from the symmetry axis, where the volcano edifice submerges. Its amplitude and areal extension increase with time and after 0.6 year it reaches 0.5 cm in amplitude, affecting also the emerged part of the volcano edifice. During the last phases of the simulated unrest, the maximum horizontal displacement of about 0.8 cm is concentrated between 0.4 and 1.5 km from the symmetry axis. Concurrently, in the initial phase the vertical deformation evolves almost linearly in time. In particular, within the first 0.6 year from the unrest, the uplift attains about 0.8 cm from the origin (r = 0) to 1.0 km and almost vanishes at 2.5 km. Successively, the uplift rate increases and a maximum value of 2.2 cm is reached. The uplift is maximum right above the hydrothermal source and rapidly decays with distance, vanishing within 2 km from the symmetry axis. Both horizontal and vertical deformation show an abrupt acceleration between 0.6 and 0.8 years in coincidence with the upward migration of the pore pressure changes (Figure S2), which mainly contribute to the deformation field with respect to the thermo-elastic effect.
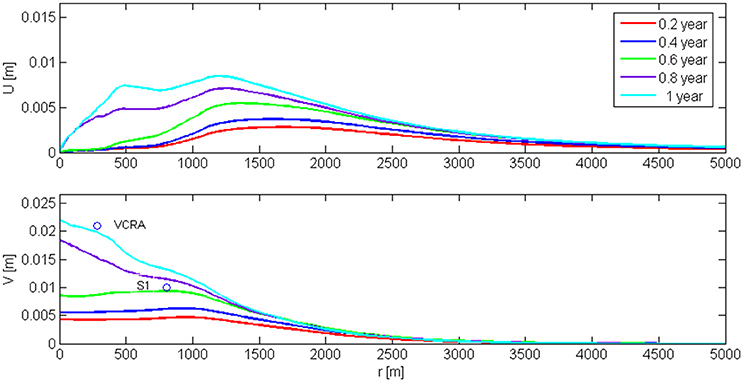
Figure 3. Radial distributions of horizontal (top) and vertical (bottom) displacements over time induced by the injection of 2,000 t/day of H2O and of 1,000 t/day of CO2. The vertical uplifts, computed from GPS measurements carried out in 2006 and 2007 at VCRA and S1 benchmarks, located in La Fossa crater and at the base of La Fossa cone, respectively, are also included (after Bonforte and Guglielmino, 2008).
Gravity Changes
Time-dependent gravity changes arise from density variations due to fluid circulation (Equation 3). In Figure 4 the radial distribution of gravity changes over time from the beginning of the unrest are reported. In the first period (< 0.4 year), no gravity variations with amplitude greater than 5 μGal are observed. Successively, a significant positive trend characterizes the changes in gravity due to the combined effects of increased pore pressure and ascent of new fluids injected during the crisis. At 0.8 year, the maximum amplitude of about 20 μGal is reached right above the source and vanishes within 1 km from the symmetry axis. From 0.8 to 1 year, the gravity changes drops from 20 to 13 μGal, even if the fluid injection at the inlet is still ongoing. This behavior could be attributed to the negative density variations generated by the ascent of low density gas-rich fluids, which substitute the higher density liquid phase. The density variations are restricted in the high permeability zone, where fluid migration is favored (Figure 5). The density changes during the first 0.5 year from the unrest show a positive change up to 50 kg/m3 in a region between 0.5 and 0.25 km below sea level. At 1 year in this region the density changes drastically reduce and a diffuse negative change develops.
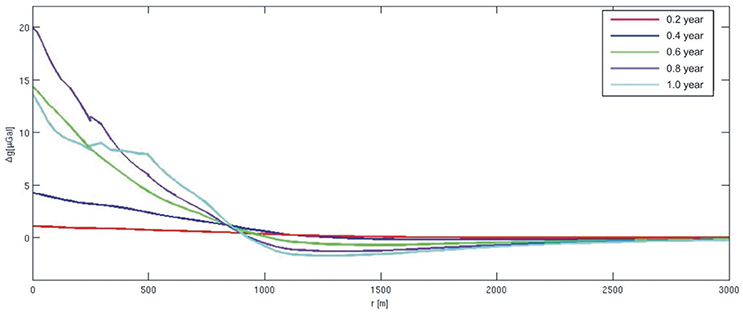
Figure 4. Radial patterns of gravity changes generated by the fluid density variations at different time steps.
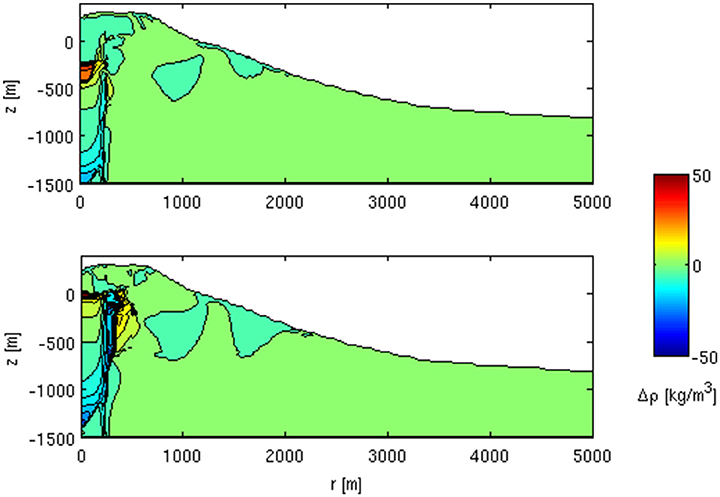
Figure 5. Density changes distribution computed at 0.5 (top) and 1 (bottom) year from the beginning of the unrest. Negative diffuse density changes develop as the gas phase (lower density) replaces the liquid phase (higher density) in the interested region.
Thermomagnetic Changes
On the basis of temperature changes (Figure S2) during a 1-year unrest at Vulcano Island, measurable changes in magnetic field can be also detected. We report on the changes in the total magnetic field intensity, since this is the parameter measured by scalar magnetometers, usually installed in volcano monitoring networks (Napoli et al., 2008, 2011). We calculate the magnetization changes with respect to the initial steady-state value (Equation 5). The magnetic variations are limited to the area around the center of La Fossa cone, near the horseshoe-shaped high magnetized body (Napoli and Currenti, 2016). At the beginning of the unrest no significant magnetic variations are observed; only after 1 year are measurable changes obtained (Figure 6). The magnetic variations range between −0.8 and 0.2 nT. The polarity of the magnetic anomaly, with negative changes on the southern flank and positive changes on the northern flank, is a clear signature of the thermal demagnetization of volcanic rocks related to the temperature increases. Both the amplitude and the areal extent of the magnetic changes are strongly conditioned by the assumed magnetization model. On average, the low rock magnetization in the La Fossa cone, attributable to hydrothermal alteration or persistent thermal demagnetization processes (Napoli and Currenti, 2016), lowers the magnetic field variations in response to thermal changes. In addition, the spatial pattern distribution of the magnetic field reflects the “shape-effect” of the high magnetization body in the eastern part of La Fossa cone.
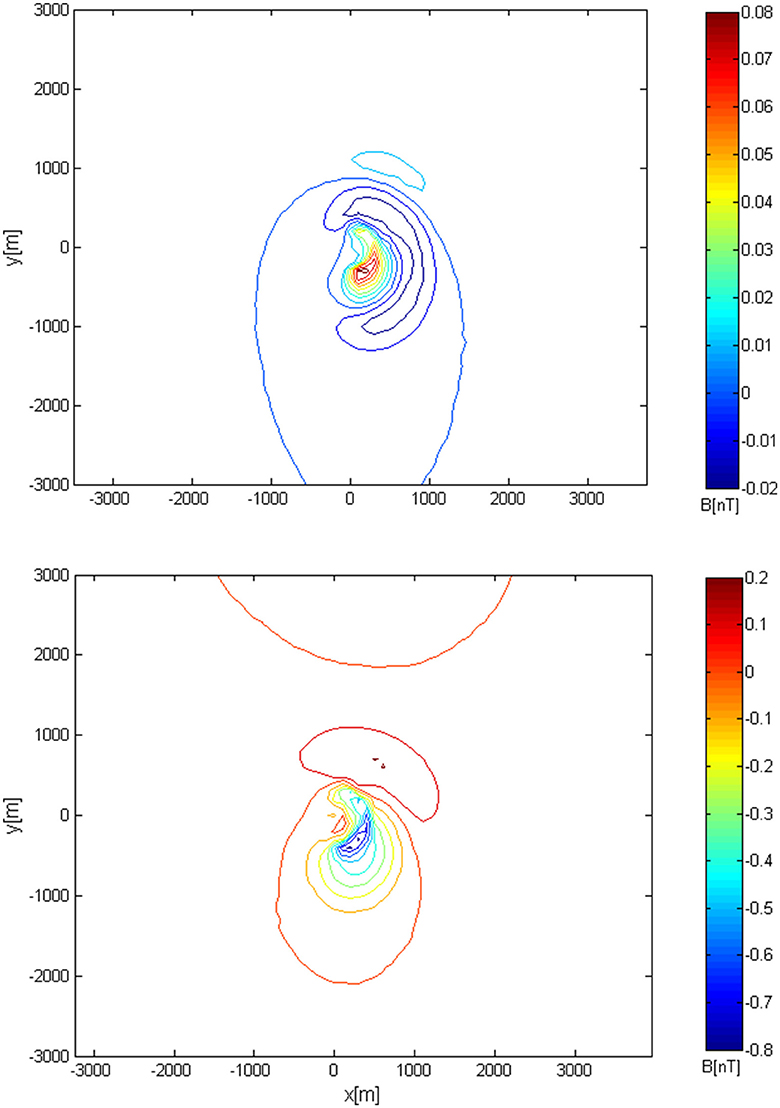
Figure 6. Thermomagnetic changes computed at 0.5 (top) and 1 (bottom) year from the beginning of the unrest.
Discussions and Conclusion
We presented a multi-parametric numerical model (hydrological, thermal, mechanical) to determine the response of different geophysical signals (ground deformation, gravity field, and magnetic field) to the characteristics of the geothermal system (e.g., distribution and paths of the flows, hydrological, and mechanical rock properties, caprock) and to its dynamic (e.g., variation of flows, temperature, and pore pressure changes). It is the first time that different geophysical observables (deformation, gravity, and magnetic) are jointly evaluated as a consequences of an hydrothermal unrest. The main aim of this work is to investigate the spatio-temporal evolution of the geophysical observables as the description of a specific volcanic region becomes more realistic, focusing on the topography, the heterogeneous structure, and the hydrological properties of Vulcano Island. Using a model-based approach, we have demonstrated that detectable geophysical changes may be revealed in association with the resumption of hydrothermal activity at Vulcano Island. Under the model assumptions, a generic unrest of 1-year engenders on the ground surface low amplitude changes in all the geophysical observables, that are, however, above the accuracies of the modern state-of-the-art instruments (in the order of a few mm, μGal and tenths of nT for deformation, gravity, and magnetic changes) applied in volcano monitoring (Dzurisin, 2007; Napoli et al., 2008; Miller et al., 2017). Our findings strongly support the primary role of fluid circulation in La Fossa dynamics. Several studies on ground deformation in the Aeolian Islands (Obrizzo, 2000; Gambino and Guglielmino, 2008; Esposito et al., 2015; and references therein) have shown a diffuse long-term subsidence linked to the regional dynamics (Bonforte and Guglielmino, 2008). At Vulcano Island, in addition to the regional dynamics, ground velocity field is affected by local disturbances and high gradient of deformation, related to the combination and superimposition of volcano-related signals (Bonforte and Guglielmino, 2008; Esposito et al., 2015). Relative uplifts of La Fossa crater are superimposed to the general large-scale subsidence. In particular, Bonforte and Guglielmino (2008) analyzed GPS data acquired during surveys carried out in 2006 and 2007, a time interval encompassing increases of temperature and gas emission in the fumaroles of La Fossa cone. They isolated the contribution of the volcano-related signal from the long-term subsidence ascribable to the regional dynamics. The analysis of GPS data showed a relative uplift of La Fossa crater of at most 2 cm, which markedly decays within less than 1 km. The amplitude and the extent of the deformation pattern is in general agreement with the simulated results, which show slight deformation within few cm restricted in the crater area and associated with hydrothermal unrest (Figure 3). Since we have modeled a generic 1-year unrest phase on the basis of average values of gas emission rate increase measured during several crisis periods, no claim is made that the model strictly applies to the 2006–2007 unrest episode at Vulcano Island. To improve the fitting with the observed values, the numerical modeling should be performed by joining all the geochemical and geophysical data gathered in 2006–2007 and simulating the specific event. The simulated gravity changes are within tens of μGal, while expected thermomagnetic changes range between −0.2 and 0.8 nT. Although no continuous gravity measurements have been performed at Vulcano, repeated microgravity surveys have been carried out from 1993 to 1996 (Di Maio and Berrino, 2016) at gravity benchmarks located at the base of La Fossa Caldera at a radial distance of about 800 m. The numerical results show that gravity changes related to the hydrothermal activity are restricted to a narrow area, extending about 500 m from the hydrothermal active region, where no gravity stations have been installed. On the basis of our findings, the gravity benchmarks are too far to constrain changes related to the hydrothermal activity. Indeed, as formerly suggested by Berrino (2000), the observed gravity changes at the base of La Fossa Caldera may be more likely ascribable to significant seasonal effects as well as to seawater ingression or regression processes. Unfortunately, no continuous magnetic measurements are available in the same observation period to compare the results. Our results highlight that the incidence of the hydrothermal activity on the geophysical changes is limited to the crater area. Therefore, in order to monitor the hydrothermal activity, an optimal design of a multi-parametric geophysical monitoring network should take care of: (i) preferring instruments with high accuracy and resolution, (ii) installing radially the stations as closer as possible to the crater area within a radial distance of 1 km.
To date, quantitative estimates of expected geophysical signals have been based on simple models that have neglected hydrothermal effects, which conversely might represent one of the main processes to interpret geophysical data at Vulcano Island. Coupled geochemical-thermal-hydrologic-mechanical models can substantially improve the understanding of its dynamic. It is worth noting that our preliminary findings are conditioned by the different and numerous model parameters (e.g., fluid geochemistry, hydrogeological, and mechanical properties, rock magnetization), whose values significantly control the spatio-temporal evolution of the geophysical changes. Anyway, this is a first attempt to integrate all the elements in a unified framework, which raises several issues that require further in depth study by experts in different fields to refine the model parameters and validate it with observations.
The time changes of the geophysical observables are a signature of the evolution of the geophysical parameters, namely the temperature, pore pressure, density, and magnetization changes. The rate increase in the geophysical observables does not occur simultaneously with the onset of the unrest. To comprehend their temporal behavior, we computed the average changes over the entire domain and normalized with respect to the maximum absolute value. Of note is the absence of a clear time correspondence in their evolutions (Figure 7). On average, the temperature is linearly increasing and consequently the magnetization decreases. On the contrary, the pore pressure shows an exponential trend which reaches the steady state value at about 0.5 year, whereas the density is slightly positive up to 0.7 year and then becomes negative. These dissimilar behaviors are mainly ascribed to the non-linear relationships, which relate the geophysical parameters with each other. It is therefore no easy task to depict the state of the hydrothermal system by a simplistic correlation analysis among the different measurements. This is further evidence of the need to develop a model-based assessment of geophysical changes to track the complex evolution of hydrothermal systems accurately. By exploiting the different responses, the comparison among the geophysical observables may contribute to distinguishing and estimating the different ongoing processes (i.e., fluid circulation, pore-pressurization, rock-fluid heating). Because of the complexity of the dynamic of the hydrothermal systems, the designing of easy-to-use computational experiments may help understand their dynamical behavior and the processes that engender geophysical signals detectable at the surface. By inverting them with forward or inverse methods, a non-invasive geophysical detection of important hydrothermal system parameters (injection rate, pressure, temperature, fluid diffusion) can be performed.
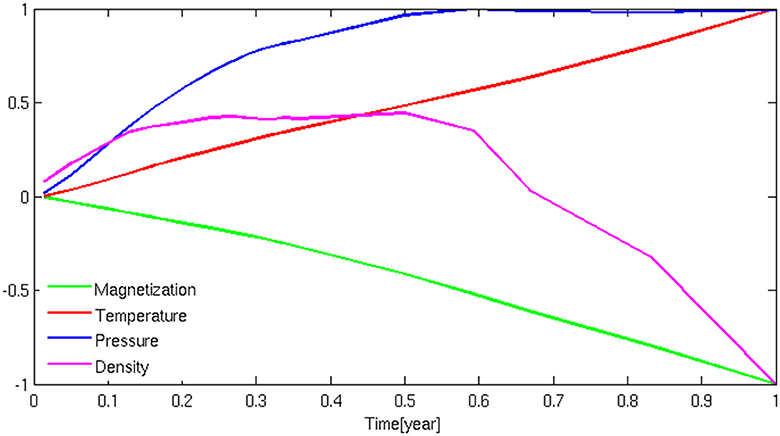
Figure 7. Time evolution of the average normalized geophysical parameters computed over the whole domain.
Author Contributions
GC and RN coordinated the writing of the paper and the research it is based on; numerical modeling was performed by GC; geological characterization was undertaken by RN.
Conflict of Interest Statement
The authors declare that the research was conducted in the absence of any commercial or financial relationships that could be construed as a potential conflict of interest.
Acknowledgments
We thank the Specialty Chief Editor V. Acocella, the Editor R. Sulpizio and referees for their constructive reviews. We are also grateful to S. Conway for revising the English language of the manuscript.
Supplementary Material
The Supplementary Material for this article can be found online at: https://www.frontiersin.org/article/10.3389/feart.2017.00041/full#supplementary-material
References
AGIP S.p.A. (1987). Permesso Vulcano. Sintesi Geomineraria Finale. Int. Rep. n.472 for AGIP-ENEL-EMS, Milano.
Aizawa, K., Ogawa, Y., and Ishido, T. (2009). Groundwater flow and hydrothermal systems within volcanic edifices: delineation by electric self-potential and magnetotellurics. J. Geophys. Res. 114:B01208. doi: 10.1029/2008JB005910
Alparone, S., Cannata, A., Gambino, S., Gresta, S., Milluzzo, V., and Montalto, P. (2010). Time-space variation of the volcano seismic events at La Fossa (Vulcano, Aeolian Islands, Italy): new insights into seismic sources in a hydrothermal system. Bull. Volcanol. 72, 803–816. doi: 10.1007/s00445-010-0367-6
Barberi, F., Gandino, A., Gioncada, A., La Torre, P., Sbrana, A., and Zenucchini, C. (1994). The deep structure of the Eolian arc (Filicudi–Panarea–Vulcano sector) in light of gravity, magnetic and volcanological data. J. Volcanol. Geotherm. Res. 61, 189–206. doi: 10.1016/0377-0273(94)90003-5
Battaglia, M., Gottsmann, J., Carbone, D., and Fernández, J. (2008). 4D volcano gravimetry. Geophysics 73, WA3–WA18. doi: 10.1190/1.2977792
Berrino, G. (2000). Combined gravimetry in the observation of volcanic processes in Italy. J. Geodyn. 30, 371–388. doi: 10.1016/S0264-3707(99)00072-1
Blanco-Montenegro, I., de Ritis, R., and Chiappini, M. (2007). Imaging and modelling the subsurface structure of volcanic calderas with high-resolution aeromagnetic data at Vulcano (Aeolian Islands, Italy). Bull. Volcanol. 69, 643–659. doi: 10.1007/s00445-006-0100-7
Bonforte, A., Bonaccorso, A., Guglielmino, F., Palano, M., and Puglisi, G. (2008). Feeding system and magma storage beneath Mt. Etna as revealed by recent inflation/deflation cycles. J. Geophys. Res. 113:B05406. doi: 10.1029/2007JB005334
Bonforte, A., and Guglielmino, F. (2008). Transpressive strain on the Lipari-Vulcano volcanic complex and dynamics of the “La Fossa” cone (Aeolian Islands, Sicily) revealed by GPS surveys on a dense network. Tectonophysics 457, 64–70. doi: 10.1016/j.tecto.2008.05.016
Chiarabba, C., Pino, N. A., Ventura, G., and Vilardo, G. (2004). Structural features of the shallow plumbing system of Vulcano Island Italy. Bull. Volcanol. 66, 477–484. doi: 10.1007/s00445-003-0331-9
Chiodini, G., Cioni, R., Falsaperla, S., Guidi, M., Marini, L., and Montalto, A. (1992). Geochemical and seismological investigations at Vulcano (Aeolian islands) during 1978–1989. J. Geophys. Res. 97, 11025–11032. doi: 10.1029/92JB00518
Chiodini, G., Frondini, F., and Raco, B. (1996). Diffuse emission of CO2 from the Fossa crater, Vulcano Island (Italy). Bull. Volcanol. 58, 41–50. doi: 10.1007/s004450050124
Coco, A., Currenti, G., Gottsmann, J., Russo, G., and Del Negro, C. (2016a). A hydro-geophysical simulator for fluid and mechanical processes in volcanic areas. J. Math. Ind. 6:6. doi: 10.1186/s13362-016-0020-x
Coco, A., Gottsmann, J., Whitaker, F., Rust, A., Currenti, G., Jasim, A., et al. (2016b). Numerical models for ground deformation and gravity changes during volcanic unrest: simulating the hydrothermal system dynamics of a restless caldera. Solid Earth 7, 557–577. doi: 10.5194/se-7-557-2016
Currenti, G. (2014). Numerical evidences enabling to reconcile gravity and height changes in volcanic areas. Geophys. J. Int. 197, 164–173. doi: 10.1093/gji/ggt507
Currenti, G., Del Negro, C., Di Stefano, A., and Napoli, R. (2009). Numerical simulation of stress induced piezomagnetic fields at Etna volcano. Geophys. J. Int. 179, 1469–1476. doi: 10.1111/j.1365-246X.2009.04381.x
Currenti, G., Napoli, R., Coco, A., and Privitera, E. (2017). Effects of hydrothermal unrest on stress and deformation: insights from numerical modeling and application to Vulcano Island (Italy). Bull. Volcanol. 79:28. doi: 10.1007/s00445-017-1110-3
Currenti, G., Napoli, R., Di Stefano, A., Greco, F., and Del Negro, C. (2011). 3D integrated geophysical modeling for the 2008 magma intrusion at Etna: constraints on rheology and dike overpressure. Phys. Earth Planet. Interiors 168, 88–96. doi: 10.1016/j.pepi.2011.01.002
De Astis, G., Lucchi, F., Dellino, P., La Volpe, L., Tranne, C. A., Frezzotti, M. L., et al. (2013). Geology, volcanic history and petrology of Vulcano (central Aeolian archipelago). Geol. Soc. Lond. Mem. 37, 281–349. doi: 10.1144/M37.11
De Astis, G., Ventura, G., and Vilardo, G. (2003). Geodynamic significance of the Aeolian volcanism (southern Tyrrhenian Sea, Italy) in light of structural, seismological and geochemical data. Tectonics 22, 1040–1057. doi: 10.1029/2003tc001506
Di Maio, R., and Berrino, G. (2016). Joint analysis of electric and gravimetric data for volcano monitoring. Application to data acquired at Vulcano Island (southern Italy) from1993 to 1996. J. Volcanol. Geotherm. Res. 327, 459–468. doi: 10.1016/j.jvolgeores.2016.09.013
Dzurisin, D. (2007). Volcano Deformation – Geodetic Monitoring Techniques. Chichester: Springer-Praxis Publishing Ltd.
Esposito, A., Pietrantonio, G., Bruno, V., Anzidei, M., Bonforte, A., Guglielmino, F., et al. (2015). Eighteen years of GPS surveys in the Aeolian Islands (southern Italy): open data archive and velocity field. Ann. Geophys. 58:S0439. doi: 10.4401/ag-6823
Federico, C., Capasso, G., Paonita, A., and Favara, R. (2010). Effects of steam-heating processes on a stratified volcanic aquifer: stable isotopes and dissolved gases in thermal waters of Vulcano Island (Aeolian archipelago). J. Volcanol. Geotherm. Res. 192, 178–190. doi: 10.1016/j.jvolgeores.2010.02.020
Fournier, N., and Chardot, L. (2012), Understanding volcano hydrothermal unrest from geodetic observations: insights from numerical modeling application to White Island volcano, New Zealand. J. Geophys. Res. 117:B11208. doi: 10.1029/2012jb009469
Gambino, S., and Guglielmino, F. (2008). Ground deformation induced by geothermal processes: a model for La Fossa Crater (Vulcano Island, Italy). J. Geophys. Res. 113:B07402. doi: 10.1029/2007JB005016
Gioncada, A., and Sbrana, A. (1991). “La Fossa caldera”, Vulcano: inferences from deep drillings. Acta Vulcanol. 1, 115–125.
Granieri, D., Carapezza, M. L., Chiodini, G., Avino, R., Caliro, S., Ranaldi, M., et al. (2006). Correlated increase in CO2 fumarolic content and diffuse emission from La Fossa crater (Vulcano, Italy): evidence of volcanic unrest or increasing gas release from a stationary deep magma body? Geophys. Res Lett. 33:L13316. doi: 10.1029/2006GL026460
Greco, F., Currenti, G., Del Negro, C., Napoli, R., Budetta, G., Fedi, M., et al. (2010). Spatiotemporal gravity variations to look deep into the southern flank of Etna volcano. J. Geophys. Res. 115:B11411. doi: 10.1029/2009JB006835
Hutnak, M., Hurwitz, S., Ingebritsen, S. E., and Hsieh, P. A. (2009). Numerical models of caldera deformation: effects of multiphase and multicomponent hydrothermal fluid flow. J. Geophys. Res. 114:B04411. doi: 10.1029/2008JB006151
Inguaggiato, S., Mazot, A., Diliberto, I. S., Inguaggiato, C., Madonia, P., Rouwet, D., et al. (2012). Total CO2 output from Vulcano island (Aeolian Islands, Italy). Geochem. Geophys. Geosyst. 13:Q02012. doi: 10.1029/2011GC003920
Ishido, T., and Pritchett, J. W. (1999). Numerical simulation of electrokinetic potentials associated with subsurface fluid flow. J. Geophys. Res. 104, 15247–15259 doi: 10.1029/1999JB900093
Jaeger, J., Cook, N., and Zimmerman, R. (2007). Fundamentals of Rock Mechanics, 4th Edn. Oxford: Blackwell Publishing.
Kearey, P., and Brooks, M. (1991). An Introduction to Geophysical Exploration, 2nd Edn. Oxford: Blackwell Scientific Publications.
Miller, C. A., LeMevel, H., Currenti, G., Williams-Jones, G., and Tikoff, B. (2017). Microgravity changes at the Laguna del Maule volcanic field: magma induced stress changes facilitate mass addition. J. Geophys. Res. 122. doi: 10.1002/2017JB014048. [Epub ahead of print].
Napoli, R., and Currenti, G. (2016), Reconstructing the Vulcano Island evolution from 3D modeling of magnetic signatures. J. Volcanol. Geother. Res. 320, 40–49. doi: 10.1016/j.jvolgeores.2016.04.011
Napoli, R., Currenti, G., Del Negro, C., Di Stefano, A., Greco, F., and Boschi, E. (2011). Magnetic features of the magmatic intrusion that occurred in the 2007 eruption at Stromboli Island (Italy). Bull. Volcanol. 73:1311. doi: 10.1007/s00445-011-0473-0
Napoli, R., Currenti, G., Del Negro, C., Greco, F., and Scandura, D. (2008). Volcanomagnetic evidence of the magmatic intrusion on 13th May 2008 Etna eruption. Geophys. Res. Lett. 35:L22301. doi: 10.1029/2008GL035350
Obrizzo, F. (2000). “Vulcano - Vertical ground movements: precise levelling. May 1995- May 1996. Acta Vulcanologica,” in Data Related to Eruptive Activity, Unrest Phenomena and Other Observations on the Italian Active Volcanoes 1996, Vol. 12, ed L. Villari ((Rome: Istituti Editoriali e Poligrafici Internazionali), 115–116.
Okubo, A., and Kanda, W. (2010). Numerical simulation of piezomagnetic changes associated with hydrothermal pressurization. Geophys. J. Int. 181, 1343–1361. doi: 10.1111/j.1365-246x.2010.04580.x
Okubo, A., Kanda, W., and Ishiara, K. (2006). Numerical simulation of volcanomagnetic effects due to hydrothermal activity. Ann. Disas. Prev. Res. Inst. Kyoto Univ. 49, 211–218.
Petrillo, Z., Chiodini, G., Mangiacapra, A., Caliro, S., Capuano, P., Russo, G., et al. (2013). Defining a 3D physical model for the hydrothermal circulation at Campi Flegrei caldera (Italy). J. Volcanol. Geotherm. Res. 264, 172–182. doi: 10.1016/j.jvolgeores.2013.08.008
Pruess, K., Oldenburg, C., and Moridis, G. (1999). TOUGH2 User's Guide, Version 2.0. Berkeley, CA: Lawrence Berkeley National Laboratory.
Rinaldi, A. P., Todesco, M., and Bonafede, M. (2010) Hydrothermal instability and ground displacement at the Campi Flegrei caldera. Phys. Earth Planet. Inter. 178, 155–161. doi: 10.1016/j.pepi.2009.09.005
Roeloffs, E. A. (1988). Fault stability changes induced beneath a reservoir with cyclic variations in water level. J. Geophys. Res. 93, 2107–2124. doi: 10.1029/JB093iB03p02107
Ruch, J., Vezzoli, L., De Rosa, R., Di Lorenzo, R., and Acocella, V. (2016), Magmatic control along a strike-slip volcanic arc: the central Aeolian arc (Italy). Tectonics 35, 407–424. doi: 10.1002/2015TC004060
Todesco, M., Rinaldi, A. P., and Bonafede, M. (2010). Modeling of unrest signals in heterogeneous hydrothermal systems. J. Geophys. Res. 115:B09213. doi: 10.1029/2010JB007474
Tommasi, P., Rotonda, T., Verrucci, L., Graziani, A., and Bolidini, D. (2016). “Geotechnical analysis of instability phenomena at active colcanoes: Two cases histories in Italy in Landslides and Engineered slopes,” in Experience, Theory and Practices, eds S. Aversa, L. Cascini, and L. Picarelli (Rome: Associazione Geotecnica Italiana), 53–78.
Troiano, A., Di Giuseppe, M., Petrillo, Z., Troise, C., and De Natale, G. (2011). Ground deformation at calderas driven by fluid injection: modelling unrest episodes at campi flegrei (Italy). Geophys. J. Int. 187, 833–847. doi: 10.1111/j.1365-246X.2011.05149.x
Ventura, G., Vilardo, G., Milano, G., and Pino, N. A. (1999). Relationships among crustal structure, Volcanism and strike-slip tectonics in the Lipari-Vulcano volcanic complex (Aeolian Islands, Southern Tyrrhenian Sea, Italy). Phys. Earth Planet. Inter. 116, 31–52. doi: 10.1016/S0031-9201(99)00117-X
Keywords: numerical modeling, thermo-poro-elasticity, geophysical observations, hydrothermal processes, multidisciplinary geophysical investigations
Citation: Currenti GM and Napoli R (2017) Learning about Hydrothermal Volcanic Activity by Modeling Induced Geophysical Changes. Front. Earth Sci. 5:41. doi: 10.3389/feart.2017.00041
Received: 10 November 2016; Accepted: 09 May 2017;
Published: 26 May 2017.
Edited by:
Valerio Acocella, Roma Tre University, ItalyReviewed by:
Eric B. Grosfils, Pomona College, United StatesRoberto Sulpizio, Università degli Studi di Bari Aldo Moro, Italy (Silvia Massaro contributed to the review of Roberto Sulpizio)
Copyright © 2017 Currenti and Napoli. This is an open-access article distributed under the terms of the Creative Commons Attribution License (CC BY). The use, distribution or reproduction in other forums is permitted, provided the original author(s) or licensor are credited and that the original publication in this journal is cited, in accordance with accepted academic practice. No use, distribution or reproduction is permitted which does not comply with these terms.
*Correspondence: Rosalba Napoli, rosalba.napoli@ingv.it