A New Tool for Separating the Magnetic Mineralogy of Complex Mineral Assemblages from Low Temperature Magnetic Behavior
 France Lagroix
 Yohan Guyodo
- 1Institut de Physique du Globe de Paris, Sorbonne Paris Cité, Univ Paris Diderot, UMR7154 Centre National de la Recherche Scientifique, Paris, France
- 2Institut de Minéralogie, de Physique des Matériaux, et de Cosmochimie, Sorbonne Universités–UMPC, UMR7590 Centre National de la Recherche Scientifique, Muséum National d'Histoire Naturelle, UMR206 IRD, Paris, France
One timeless challenge in rock magnetic studies, inclusive of paleomagnetism and environmental magnetism, is decomposing a sample's bulk magnetic behavior into its individual magnetic mineral components. We present a method permitting to decompose the magnetic behavior of a bulk sample experimentally and at low temperature avoiding any ambiguities in data interpretation due to heating-induced alteration. A single instrument is used to measure the temperature dependence of remanent magnetizations and to apply an isothermal demagnetization step at any temperature between 2 and 400 K. The experimental method is validated on synthetic mixtures of magnetite, hematite, goethite as well as on natural loess samples where the contributions of magnetite, goethite, hematite and maghemite are successfully isolated. The experimental protocol can be adapted to target other iron bearing minerals relevant to the rock or sediment under study. One limitation rests on the fact that the method is based on remanent magnetizations. Consequently, a quantitative decomposition of absolute concentration of individual components remains unachievable without assumptions. Nonetheless, semi-quantitative magnetic mineral concentrations were determined on synthetic and natural loess/paleosol samples in order to validate and test the method as a semi-quantitative tool in environmental magnetism studies.
Introduction
As applications of mineral magnetism to the study of the Earth and other planetary bodies diversify, comprehensive mineral phase identification of multi-component assemblages is increasingly important. The accuracy with which the stoichiometry of the magnetic mineral phases, their grain size distributions and concentrations are determined sets the limits of mineral magnetism interpretations.
Despite the ubiquitous occurrence of iron-bearing ferromagnetic (s.l.) minerals on earth and extraterrestrial bodies (e.g., Lagroix et al., 2016) they are almost exclusively present as accessory minerals in rocks and sediments, with the exception, for example, of iron-ore deposits and banded-iron formations. Ferromagnetic (s.l.) minerals often go undetected by traditional mineral phase speciation analyses such as XRD or Mössbauer spectroscopy because concentrations in bulk material are typically less than a few weight percent. Mineral magnetism, on the other hand, can detect magnetic minerals at concentrations as low as 1 ppm. It has been shown that physical mineral separation, e.g., magnetic extracts or heavy liquid separation, does not comprehensively isolate the entire ferromagnetic (s.l.) mineral assemblage (e.g., Lagroix et al., 2004; Wang et al., 2013) and chemical separation techniques, such as CBD or oxalate, enable to quantify dissolvable Fe concentrations but do not identify the iron-bearing mineral phases (e.g., Mehra and Jackson, 1960; Vidic et al., 2000; van Oorschot and Dekkers, 2001; van Oorschot et al., 2002). Therefore, mineral magnetic analyses on bulk material provide the greatest potential for a comprehensive characterization of iron-bearing ferromagnetic (s.l.) minerals.
Remanence acquisition or demagnetization curves and field-dependence of induced magnetization probed through hysteresis loops and first-order reversal curve (FORC) distributions are the dominant magnetic data currently being numerically unmixed to characterize the magnetic mineral components (Robertson and France, 1994; Carter-Stiglitz et al., 2001; Egli, 2003, 2013; Fabian, 2003; Heslop and Dillon, 2007; Lascu et al., 2010, 2015; Heslop, 2015; Church et al., 2016; Fabian et al., 2016; Maxbauer et al., 2016b; Zhang et al., 2016). While important and useful results have emerged, the currently applied methods present important limitations. The commonly acquired magnetic data listed above are generally acquired at room temperature. Consequently, all iron-bearing mineral phases ordering magnetically below room temperature (e.g., siderite, titanium-rich (>80% Ti) compositions of both magnetite-ulvöspinel and hematite-ilmenite series, lepidocrocite, chromite, daubrelite) will go undetected. Furthermore, for remanence data, fine particles smaller than the superparamagnetic to stable single domain grain size boundary at room temperature will also go undetected. Induced magnetization data is inclusive of all minerals but differences over three orders of magnitude in saturation magnetizations heavily biases hysteresis loop derived data toward strongly ferrimagnetic minerals (e.g., magnetite, see for instance Frank and Nowaczyk, 2008). Decomposing induced magnetization data requires a priori knowledge of basis functions of the individual components (Carter-Stiglitz et al., 2001). These limitations compromise significantly the comprehensiveness of magnetic mineral assemblage characterization and consequently mineral magnetism-based interpretations of geological and biogeochemical processes occurring on Earth and other planetary bodies.
Here, we present a new experimental method using existing equipment for decomposing the mineral magnetic behavior of multi-phase assemblages. The method is validated on synthetic and natural samples. Finally, new frontiers for earth and planetary sciences through mineral magnetism are discussed.
Materials and Methods
The new experimental protocol for separating the low-temperature magnetic behavior of natural geological samples utilizes a MPMS XL-5 EverCool, a commercially available cryogenic magnetometer from Quantum Designs ©. The configuration of the system used includes the ultra-low field, AC and EDC (External Device Control) options, which are needed to run the experimental protocol. The three options enable to measure the residual field of the superconducting magnet once it has been charged and set back to zero field, and to compensate for the residual field by applying a directionally opposing yet equal field. By compensating for the residual field of the superconducting magnet, a zero field inferior or equal to 500 nT is achievable using the Quantum Design MPMS-specific fluxgate. The protocol is a remanent magnetization-based experiment, which can be applied to demagnetize an acquired isothermal or thermal remanent magnetization (IRM or TRM) at any temperature over the instrument 2–400 K temperature range. It is analogous to the protocol suggested in Guyodo et al. (2006) and shares some common features with those of Carter-Stiglitz et al. (2006) and Lascu and Feinberg (2011). The distinguishing feature here is that the isothermal demagnetization step is achieved with the MPMS itself instead of an external alternating field demagnetizer. Advantageously, this eliminates the need for multiple instruments and excessive sample handling and more importantly enables the complete or partial demagnetization of IRMs or TRMs acquired at temperatures other than room temperature. An isothermal demagnetization results from charging the superconducting magnet from one set field to a lower set field using the system's oscillation superconducting magnet charging mode, which produces a series of DC fields of changing polarity and amplitude with a set frequency, resulting in a demagnetization. The resulting DC demagnetization is very similar to that of an AF demagnetizer. To date, the no-overshoot mode was routinely used to charge the superconducting magnet back to zero field in order to preserve the acquired IRM or TRM. The aim of Figure 1 is to illustrate the differences between the two modes by tracing the time evolution of the voltage read by the internal MPMS voltmeter. The voltmeter readings are not direct readings of the current trapped in the superconducting magnet nor its polarity. In the no-overshoot mode, the DC current supplied to the magnet varies rapidly until it reaches 70% of the difference between the initial and target value, then varies slowly to reach the final value without overshooting the target. In the oscillation mode, the current provided to the magnet oscillates in decreasing amplitude to reach the final value. The new experimental protocol was first publicly presented at the EGU General Assembly in 2014 (Lagroix et al., 2014). The use of the MPMS's oscillation mode for demagnetization was mentioned thereafter in the appendix of Maxbauer et al. (2016a).
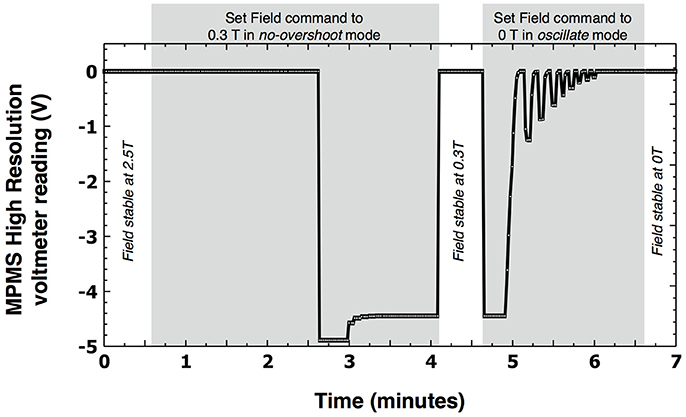
Figure 1. The charging and discharging of the supraconducting magnet differs whether the target magnetic field is approached using the no-overshoot or oscillation modes. The difference can be monitored through the MPMS high-resolution voltmeter readings. The gray boxes delimit the time elapsed from the moment the set field command is activated to the moment the software alerts the set magnetic field is stable. Reducing a stable magnetic field of 2.5–0.3 T using the no-overshoot mode takes approximately three and a half minutes. Reducing a stable magnetic field of 0.3–0 T using the oscillate mode takes approximately 2 min. Manipulating the magnetic field as shown in the figure leads to the 300 mT peak field demagnetization of a 2.5 T IRM that can be acquired at any temperature between 2 and 400 K.
The MPMS isothermal demagnetization protocol was tested and validated on three mono-mineral synthetic powders and one sample composed of a mixture of the three components. Component 1 is a synthetic magnetite powder [Wright Industries Inc. (W3006)] commercialized as multi-domain ~2–3 μm particles. W3006 magnetite has been used in several previous studies (Dunlop, 2002; Kosterov, 2002; Liu et al., 2002; Smirnov and Tarduno, 2002; Yu et al., 2002; Till et al., 2010). Component 2 is a hematite powder with approximate particle size of 10–40 nm based on TEM images synthesized from ferrihydrite following Schwertmann and Cornell (1991) by David Burleson in the laboratory of Prof. R. Lee Penn in the Chemistry Department at the University of Minnesota. Component 3 is a goethite powder composed of micrometer size needle crystals (30 × 350 nm) synthesized following the method of Schwertmann and Cornell (1991) and previously used in Guyodo et al. (2003). Staking the three components with 4.2 mg of magnetite sandwiched in between 74.8 mg of goethite and 102 mg of hematite formed the “mixture” sample. Magnetite, goethite and hematite components represent, respectively, 2.3, 41.3, and 56.3 wt.% of the mixed sample. Further demonstrations are provided on a natural loess sample of the penultimate glacial period (Saalian glacial or marine oxygen isotope stage 6) from the Dolni Vestonice sequence in the Czech Republic (Antoine et al., 2013; Fuchs et al., 2013) and a commercially available hematite sample from The Nature Company (www.naturesowndesigns.com), which is used as a remarkably stable MD magnetite + hematite standard. All samples were prepared in gelatin capsules and when necessary completed with cotton to fill the volume of the capsules. For measurements, the gelatin capsules were inserted in clear plastic straws, following common practices.
The magnetic behavior of the individual components and of the mixture sample is characterized at room temperature (RT) and at low-temperature (LT) (Figure 2, Table 1). Room temperature hysteresis loops were measured on a vibrating sample magnetometer (VSM) in a 1.5 T maximum field. The behavior of a RT saturation isothermal remanent magnetization (SIRM) acquired in a 2.5 T field was monitored while cycling from 300 to 10 K and back to 300 K at a sweep rate of 5 K/min, which is the same rate used throughout. This protocol is commonly referred to as a RT-SIRM experiment even though saturation of the IRM is not necessarily achieved. The behavior of a LT-SIRM acquired in a 2.5 T field at 10 K after cooling the sample from 300 to 10 K in zero field (ZFC) or in a 2.5 T field (FC) is monitored upon warming from 10 to 300 K. This protocol is routinely referred to as a ZFC-FC remanence experiment.
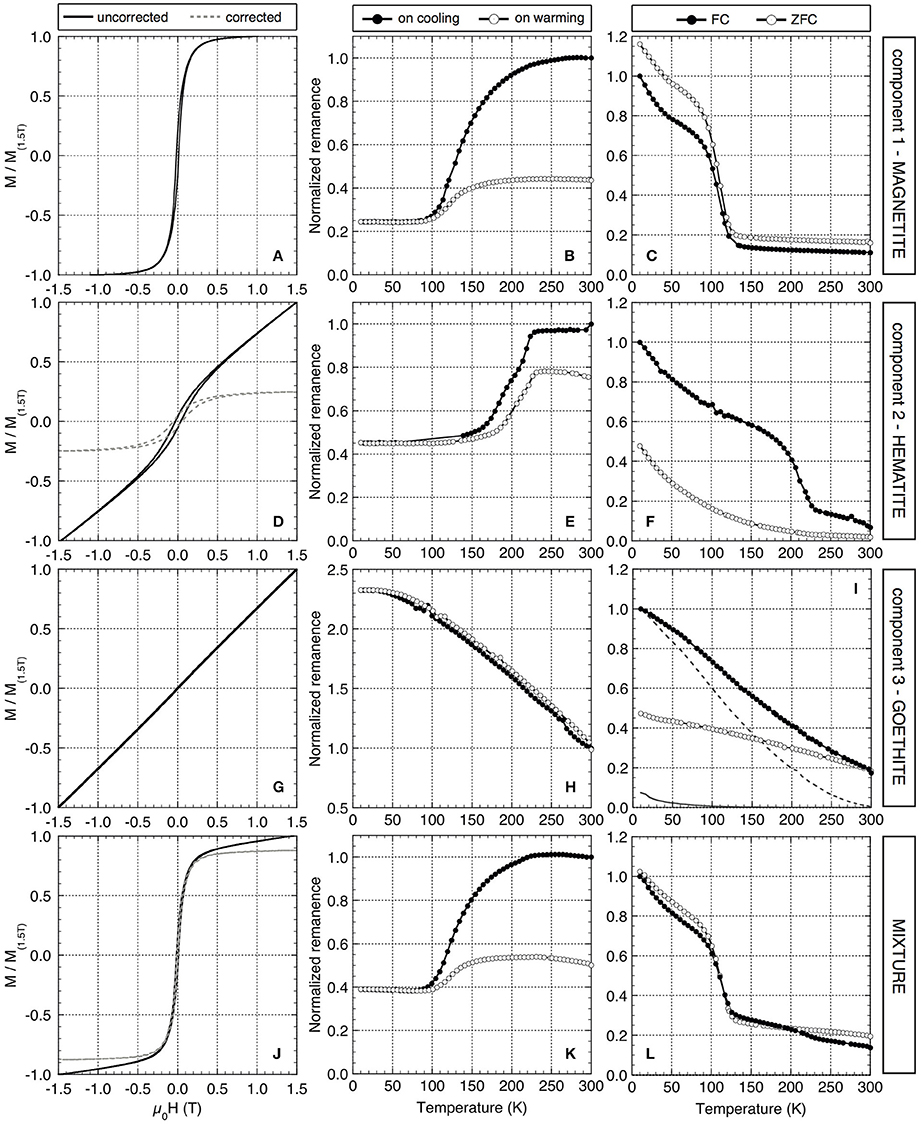
Figure 2. Characterization of the magnetic behavior of the individual components, magnetite (A–C), hematite (D–F) and goethite (G–I), and the mixture (J–L) is shown. Room temperature hysteresis loops (A,D,G,J) are normalized to the uncorrected for high-field slope loop magnetization induced in the maximum 1.5 T field. Room temperature (300 K) IRM acquired in a 2.5 T field (RT-SIRM) is monitored on cooling and warming and remanence values are normalized to the initial RT-SIRM. Low temperature (10 K) IRM acquired in a 2.5 T field is monitored on warming after cooling in zero field (ZFC) or cooling in a 2.5 T field (FC) and remanence values are normalized to the initial FC value at 10 K. All normalizing values and hysteresis loop derived parameters are listed in Table 1. RT-SIRM data in (H,K) are enhanced RT-SIRM and ZFC and FC experiments in (I,L) were acquired without thermally demagnetizing the enhanced RT-SIRM. The gray ZFC (solid) and FC (dashed) curves in (I) are data acquired on the pristine goethite powder sample prior to any “enhancing” pre-treatments.
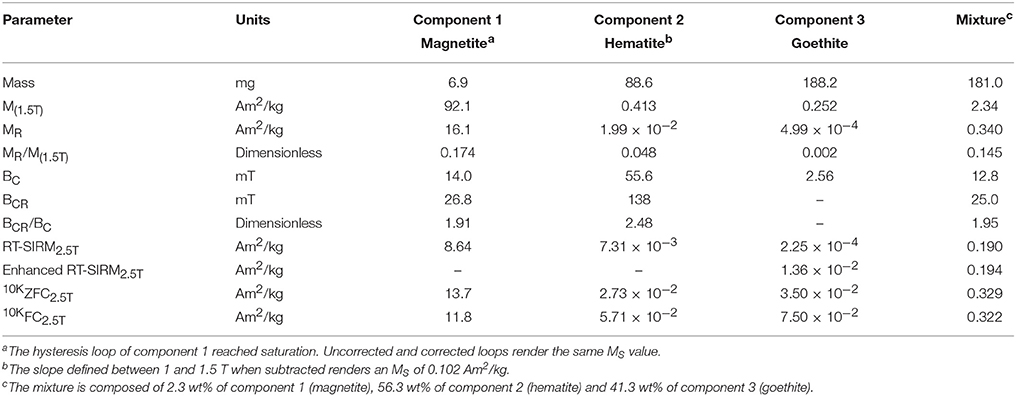
Table 1. Uncorrected hysteresis and low temperature magnetic properties of the individual components and of the three-component mixture used to validate the new method and shown in Figure 2.
In order to test the demagnetization efficiency of the superconducting magnet's oscillation mode, the individual components and mixture samples were subjected to a step-wise demagnetization of an IRM acquired in a 2.5 T field, followed by a step-wise IRM acquisition up to 2.5 T and a one-step demagnetization by charging the superconducting magnet down in the oscillation mode from 300 to 0 mT (Figure 3). The experimental sequence programmed through the MultiVu software is provided as Supplementary Material.
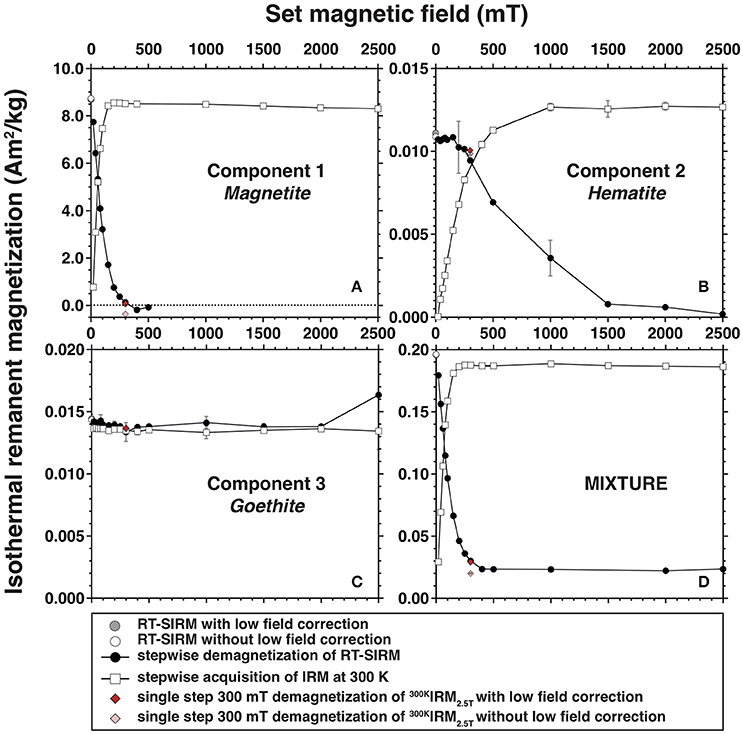
Figure 3. Experiments aimed at testing the demagnetization efficiency of the superconducting magnetic's oscillation mode for the individual components, magnetite (A), hematite (B), goethite (C), and the mixture (D). First a RT-SIRM was imparted in a 2.5 T field (gray and white circles) and stepwise demagnetized by charging the superconducting magnet in the no-overshoot mode and back to zero in the oscillation mode from increasingly higher fields (black circles). Second, each sample was subjected to a stepwise IRM acquisition up to 2.5 T (white squares) followed by single step demagnetization from 300 mT to zero (red and pink diamonds). The low field correction corresponds to a sequence using the AC coil to cancel the magnet residual field. Each data point is the average of three measurements and its standard deviation. MPMS sequence is provided as Supplementary Material.
The experimental protocol followed to generate the data of Figure 4, aiming at decomposing the magnetic behavior of the individual components within the mixture sample following the acquisition of an enhanced RT-SIRM, is provided as Supplementary Material. The sequence is as follows:
1) Acquisition of an IRM in a 2.5 T field at 300 K (RT-SIRM).
2) Measure RT-SIRM and monitor its evolution while cycling the temperature from 300 to 10 K and back to 300 K.
3) Apply a 2.5 T field and sweep the sample from 300 to 400 K and back to 300 K (enhanced RT-SIRM).
4) Measure the enhanced RT-SIRM and monitor its evolution while cycling the temperature from 300 to 10 K, 10 to 400 K, 400 to 10 K, and 10 to 300 K.
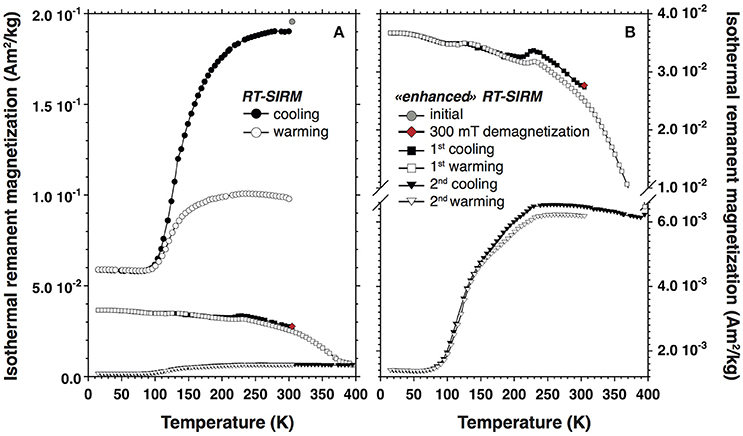
Figure 4. The RT-SIRM of the mixture sample is cooled to 10 K (black circles) and warmed back to 300 K (white circles). An enhanced RT-SIRM is imparted by warming the sample to 400 K and back to 300 K in the presence of a strong 2.5 T field (gray circle). The enhanced RT-SIRM is demagnetized by charging the supraconducting magnet in the no-overshoot mode to 300 mT and back to zero in the oscillation mode and measured (red diamond). The 300 mT demagnetized enhanced RT-SIRM is cooled to 10 K (black squares) and warmed to 400 K (white squares), providing a partial thermal demagnetization before cooling back to 10 K (solid triangles) and warming to 300 K (white triangles). The full experiment is shown in (A). (B) Provides a broken zoomed scale of the first and second cycling of the enhanced and partially demagnetized RT-SIRM. MPMS sequence is provided in Supplementary Material.
The same experimental sequence is run on a natural sample in Figure 5. The RT-SIRM is labeled as enhanced because the sample is cooled from 400 to 300 K in a strong applied field. If any goethite is present, this RT-SIRM pre-treatment effectively imparts a TRM on the goethite population as it cools through its Néel temperature (393 K for stoichiometric goethite) in the presence of a magnetic field. Finally, in Figure 6, we illustrate the new capability by demagnetizing an IRM acquired at 20 K in the case of a ZFC-FC experiment. The experimental sequence executed to generate the data of Figure 6 is provided as Supplementary Material.
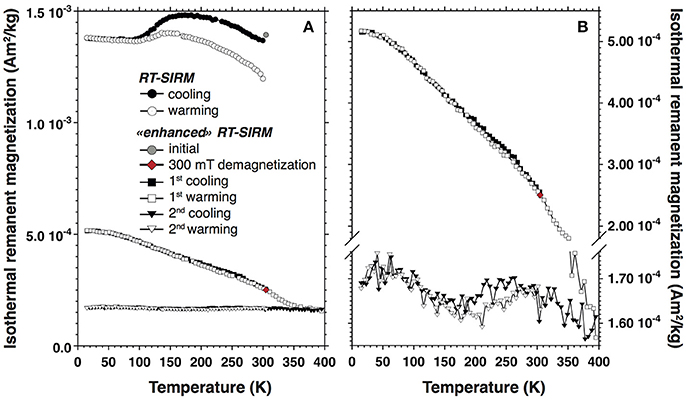
Figure 5. The same experimental protocol as in Figure 4 conducted on a natural loess sample from the penultimate glaciation (Saalian) recovered in the Dolni Vestonice sequence in the Czech Republic. Full experiment is shown in (A) and a zoomed view of the first and second enhanced RT-SIRM cycles are shown in (B).
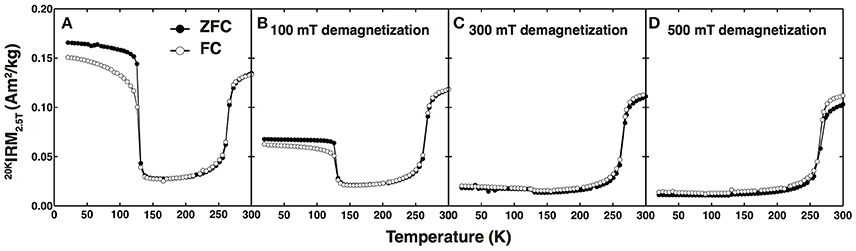
Figure 6. (A) ZFC and FC warming curves of a commercially available hematite purchased from The Nature Company, which also contains magnetite. The same sample was subjected to a new ZFC-FC acquisition where the ZFC and FC 2.5 T IRMs acquired at 20 K were partially demagnetized by charging the supraconducting magnet in the no-overshoot mode to 100 mT (B), 300 mT (C), or 500 mT (D) and further to zero in the oscillation mode. MPMS sequence is provided in Supplementary Material.
Results
Magnetic Characterization: Individual Components and Mixture
The three mineral components used in this study were chosen because of their significantly different low-temperature magnetic signatures, as shown in Figure 2. Component 1, the W3006 synthetic magnetite sample, shows a characteristic magnetic hysteresis with a saturation magnetization of 92.1 Am2/kg (Table 1; Figure 2A). A sharp Verwey transition is observed in both RT-SIRM and ZFC-FC curves (Figures 2B,C). Component 2, the hematite sample, is characterized by an open hysteresis loop that does not saturate at 1.5 T, and a clear Morin transition in both the RT-SIRM and the ZFC-FC curves (Figures 2D–F). The Morin transition on cooling begins at 220 K and spreads over 60 K, which is compatible with the compiled data of hematite nanoparticles in Özdemir et al. (2008). The net separation observed between FC and ZFC curves implies that an additional remament magnetization was acquired during cooling in a 2.5 T magnetic induction likely due to the progressive blocking of a remanence in the smaller particles of the sample's grain-size distribution. Component 3 is a goethite sample displaying a characteristic, nearly strait and closed hysteresis loop (Figure 2G). The enhanced RT-SIRM cooling and warming curves are reversible and show a 230% increase in remanence with decreasing temperature (Figure 2H). ZFC-FC warming curves are well separated and display the expected downward curvature upon warming (dashed and solid gray line data in Figure 2I). The ZFC-FC warming curves shown with open and closed circles in Figure 2I where measured on the sample after an enhanced RT-SIRM (i.e., TRM) was acquired and not thermally demagnetized by heating to a temperature above its Néel temperature. The 2.3 wt.% magnetite, 41.3 wt.% hematite and 56.3 wt.% goethite mixture has magnetic data largely dominated by the 2.3% of magnetite (Figures 2J–L). Only a slight high-field slope is observed in the hysteresis loop (which would be easily discarded as a paramagnetic component in a natural sediment), and a faint Morin transition can be observed in the RT-SIRM curves and FC low-temperature data. The goethite component, which represents more than half of the mixture, cannot be detected in these data.
Efficiency of the Superconducting Magnet's Oscillation Mode
The new experimental protocol utilizes the superconducting magnetic oscillation mode of the MPMS to perform an isothermal demagnetization of the initial remanence without the use of an external AF demagnetizer. Testing of this method was performed at room temperature on all three individual components and the mixture (Figure 3). For the magnetite sample, the stepwise demagnetization of the IRM acquired in 2.5 T results in a rapidly decreasing remanent magnetization. A peak-field of 300 mT demagnetizes 98.6% of the original intensity; the 1.4% remaining remanence equals to 0.128 Am2/kg. As expected for hematite, the stepwise demagnetization of component 2 is spread over a larger range of peak-field and is only complete at 2.5 T. At 300 mT, 78.7% of the initial remanence of component 2 remains. The shape of components 1 and 2 demagnetization curves are relatively similar to that of their IRM acquisition curves, and the single-step 300 mT demagnetizations are superposed to the 300 mT step of the stepwise demagnetizations. As expected, the remanence of the goethite component is not demagnetized (Guyodo et al., 2006). The initial 300 K IRM of 1.36 × 10⁻² Am2/kg shown in Figure 3C is the enhanced 300 K IRM2.5T and is two orders of magnitude greater than the isothermally acquired 300 K IRM2.5T value of 2.25 × 10⁻⁴ Am2/kg. The demagnetization and acquisition behavior of the mixture behaves in a manner similar to that of the magnetite sample with a non-demagnetized baseline slightly higher than the magnetization of component 3. Altogether, these observations demonstrate the efficiency of the superconducting magnetic oscillation mode to demagnetize samples with the appropriate coercivity spectrum.
Validating the New Experimental Method
The MPMS isothermal demagnetization method is first used to separate the magnetic behavior of the individual components within the mixture sample. The MPMS experimental sequence ran to generate the data of Figure 4 is provided as Supplementary Material. A classic RT-SIRM2.5T experiment was initially conducted on the mixture. Its cooling and warming curves are plotted as closed and opened circles, respectively in Figure 4A. For clarity, only the 300 K IRM2.5T magnetization acquired after warming (300–400 K) and cooling (400–300 K) in a 2.5 T field is plotted in Figure 4A as a gray circle. The enhanced RT-SIRM cycle data are plotted in Figure 2K. The enhanced RT-SIRM of the mixture is 2.6% higher than the classic RT-SIRM. Demagnetizing the mixture's enhanced RT-SIRM in a 300 mT peak field with the MPMS removes 85.8% of the magnetization and is represented by the red diamond in Figures 4A,B. Cycling the remaining remanent magnetization to 10 K and back to 300 K (Figure 4B) reveals a clear Morin transition of the hematite component and a net increase in magnetization with decreasing temperatures, which is reversible at temperatures below ~200 K. Evidence of a Verwey transition is observed indicative of an incomplete demagnetization of magnetite. However, the results of the efficiency test presented in section Efficiency of the Superconducting Magnet's Oscillation Mode showed a 98.6% demagnetization of component 1 (magnetite) in 300 mT, which in absolute value equals 0.128 Am2/kg. Therefore, even after demagnetizing 98.6% of its initial remanence, the remaining magnetization of component 1 is greater by one and two orders of magnitude than the initial acquisition of component 2 (hematite) and 3 (goethite) respectively (Table 1). Considering that magnetite constitutes only 2.3 wt.% of the mixture, the remaining magnetization after the 300 mT demagnetization in the mixture should be ~0.003 Am2/kg. This is one tenth of the mixture's remaining enhanced RT-SIRM after 300 mT demagnetization, which is sufficient to be observed. Continued thermal demagnetization up to 400 K above the Néel temperature of goethite removes its behavior from the final cooling and warming cycle plotted as closed and open circles in Figure 4B. The final cycle begins with a 300 K remanence of 6.47 × 10⁻³ Am2/kg, isolating the behaviors of hematite and magnetite. Based on the efficiency tests of Section Efficiency of The Superconducting Magnet's Oscillation Mode (Figure 3) only 13.2% of hematite's remanence would have been demagnetized by the 300 mT peak field along with 98.6% of magnetite's remanence stated above, leading to a calculated remanence of 6.35 × 10⁻³ Am2/kg, which is only 1.8% less than the measured value.
The new experimental method is also tested on a natural sample of loess and results obtained from the same experimental sequence (Supplementary Material) are presented in Figure 5 following the same format as for the mixture sample (Figure 4). The classic RT-SIRM cooling and warming curves display both characteristics of magnetite (Verwey transition) and goethite or maghemite (1% increasing in remanence with cooling trend). The enhanced RT-SIRM 300 K value of 1.39 × 10⁻³ Am2/kg is 1.8% greater than the 1.37 × 10⁻³ Am2/kg 300 K remanence measured in the classic RT-SIRM experiment. When demagnetizing the enhanced RT-SIRM with a 300 mT peak field 82% of the remanence is lost. The remaining 18% (or 2.50 × 10⁻⁴ Am2/kg) when cooled and warmed back to room temperature displays a reversible linearly increasing remanence with decreasing temperature. The remanence increases by 105%, which can be only be attributed to goethite. A slight irreversibility between 300 and 200 K can be observed. Continued thermal demagnetization to 400 K results in a further 6% demagnetization of the initial enhanced RT-SIRM at 300 K. Cycling the remaining 12% or 1.67 × 10⁻⁴ Am2/kg to low temperature and back reveals a remanence loss transition on cooling starting at ~250 K which is recovered on warming with a slight thermal hysteresis reminiscent of a hematite Morin transition. Superimposed is a trend of increasing remanence on cooling quantified to 1% in the 30 to 170 K temperature range, which is similar to observations made from stoichiometric maghemite (Özdemir and Dunlop, 2010).
The new experimental method broadens our current experimental capabilities in allowing the observation of temperature dependent behavior of (partially) demagnetized remanences acquired at temperatures below room temperature. Figure 6 presents ZFC–FC remanence warming curves conducted on a commercially available hematite containing magnetite impurities (see Section Materials and Methods). The initial FC and ZFC remanences (Figure 6A) were partially demagnetized in peak fields of 100, 300 or 500 mT (Figures 6B–D respectively) generated with the MPMS using the oscillation mode. The Verwey transition of the multi-domain impurity magnetite is almost entirely suppressed by the 300 mT demagnetizing field, enabling the isolated observation of the temperature dependent behavior of the hematite component.
Discussion
One timeless challenge in rock magnetic studies, inclusive of paleomagnetism and environmental magnetism, is decomposing a sample's bulk magnetic behavior into its individual magnetic mineral components. For the study of the Earth's magnetic field and its derived applications for paleogeographic, tectonic and geodynamic reconstructions, the breadth of useful mineral stoichiometry and grain size is restricted to those ordering magnetically at a temperature well above ambient temperature and having a grain size stable magnetically over geological time scales. In contrast, for environmental magnetism studies the breadth of useful mineral stoichiometry and grain size is unrestricted. The accuracy of magnetism-based interpretations of climate, environmental and biogeochemical processes and change is dependent, firstly, on a comprehensive identification of all magnetic mineral compositions, no matter their magnetic ordering temperature or particle size. The other two important determinations are the concentration and grain size distribution for each mineral composition.
The magnetic data acquired on the three components and the mixture samples used in this study (Figure 2, Table 1) illustrate fairly well the difficulties in obtaining comprehensive chemical composition, and (semi-)quantitative grain size and concentration estimates even for the most common of iron oxides (magnetite and hematite) and oxyhydroxides (goethite). Scalar quantities derived from hysteresis parameters and their ratios are the most accessible means of characterizing relative variations in mineral composition (e.g., S-ratio, HIRM), mean magnetic grain size (e.g., MRS/MS, χ/MS), and concentration (MS, MRS, χ, χf, χHF) (see review by Liu et al., 2012). The mixture sample, despite being constituted of 97.7 wt% hematite + goethite and only 2.3 wt% magnetite has hysteresis parameters which fall on the magnetite SD-MD mixing lines of Dunlop (2002). Within a natural bulk sample containing paramagnetic and diamagnetic minerals, and in a maximum field of 1.5 T, the magnetization of component 3 (goethite) as well as 75% of the magnetization of component 2 (nano-hematite) would be lost in the high field slope corrected magnetization. Scalar parameters acquired in low to moderately high fields will thus provide an incomplete picture of the ensemble of environmentally significant iron bearing minerals, heavily biased toward magnetite. While this statement is common knowledge, it is often disregarded in reports and reviews of environmental magnetism studies.
Unmixing and principal component analysis of spectrum-type data such as remanence curves, hysteresis loops and FORC distributions can more readily provide evidence of multiple components. These approaches are increasingly undertaken to characterize changes in contributions to the total remanent magnetization and in magnetic grain size of sedimentary archives of various origins from past and present continents and oceans (e.g., Abrajevitch and Kodama, 2011; Lascu et al., 2012; Chen et al., 2014; Nie et al., 2014; Hyland et al., 2015; Fabian et al., 2016; Maxbauer et al., 2016c; Zhang et al., 2016). However, obtaining mineral compositions of an ensemble of components via these methods is only possible indirectly through a series of assumptions or a priori knowledge. In addition, the fact that these analyses are isothermal, (i.e., investigating changes in magnetization as a function of field strength at a single temperature) and that the analysis temperature is almost always room temperature, there is a high probability of incomprehensiveness of the characterization results, similarly to scalar derived hysteresis parameters discussed above. The thermal fluctuation tomography method proposed by Jackson et al. (2006) addresses the limitation of exclusion of particles with SP behavior from room temperature-derived coercivity distribution, and provides a means of characterizing grain size distributions from variable low-temperature remanence coercivity spectrums. Unfortunately, the method has been seldom applied (e.g., Nie et al., 2013; Wang et al., 2013) likely due to the time consuming and relatively costly nature of the analysis.
The most direct means of identifying the chemical composition of magnetic minerals is through thermomagnetic data and the observation of magnetic ordering transitions (Curie and Néel temperature) or other characteristic crystallographic or magnetic transitions (e.g., Verwey, Morin and Besnus transitions, spin glass transition). Many transitions can be observed below 400 K. In Figure 2, for instance, we observe the drastically different low temperature behavior of the three components for both the RT-SIRM and ZFC-FC experiments. This said, the pitfalls due to the overwhelming magnetization of component 1 in the mixture, observed and discussed above, remain even for low-temperature thermomagnetic data. Low-temperature cycling of a RT-SIRM fails to detect any change in intensity that might hint to an additional component other than magnetite (Figure 2K). The same is also true for the ZFC data. The only hint of a second component comes from the small inflection around 220 K in the FC warming curve (Figure 2L). Because heating induced alterations are absent over these temperature ranges, multiple experiments can be conducted on the same sample. With the added new possibility of partially demagnetizing (at any temperature between 2 and 400 K) remanences acquired in fields up to 5, 7, or 14 T and at temperatures as low as 2 K using the same equipment, experimental decomposition of a bulk sample's thermomagnetic behavior, as demonstrated and validated herein (Figures 4–6), becomes possible. The new experimental method presented here is currently the only means of obtaining a comprehensive identification of all mineral species of an ensemble of magnetic mineral within a bulk sample, with a minimum of assumptions and no a priori knowledge.
New Frontiers for Earth and Planetary Sciences through Mineral Magnetism
Recovering continental climate and environmental change through the study of loess and paleosol sequences motivated the development of the new experimental method. The decomposition shown in Figure 5 enables the positive identification of four components: magnetite, hematite, goethite and maghemite. Relative concentrations between samples can be compared given a set of assumptions albeit fewer than for reaching absolute concentrations. While such an analysis on all depth intervals of a loess sequence may be too time consuming and costly, the unambiguous observations it provides is indispensible to constrain other data which can be acquired more easily and rapidly on a voluminous sample suite. Such direct and comprehensive determinations of mineral compositions of all magnetic particle grain sizes are needed to interpret accurately routine measurements, which are intrinsically less comprehensive. The most comprehensive remanence data achievable with instrumentations available in paleomagnetic and rock magnetic laboratories today are FC warming curves. The MPMS systems can field cool a sample from 400 to 2 K and thus even the smallest size particles will acquire a remanence and any mineralogy with an ordering temperature below room temperature will acquire a remanence. The new demagnetization method presented herein permits, as shown in Figure 6, to separate FC remanence warming curves, the most comprehensive data needing to be separated.
As mineral magnetism aims to broaden its reach, contributing for example to the study of the formation of the solar system (e.g., Strauss et al., 2016; Wang et al., 2017), of deep-time terrestrial environments (e.g., Carlut et al., 2015; Slotznick and Fischer, 2016) or of extreme environments of hydrothermal vents (e.g., Toner et al., 2016), it is necessary to accompany these new frontiers with experimental tools adapted to the greater diversity of mineral compositions and greater complexity of mineral assemblages resulting from the superposition of geological and biogeochemical processes through time. Magnetic characterization presents the advantages of a low detection limit (order of 1 ppm) and in situ bulk sample analyses avoiding time consuming physical and chemical separation techniques shown to be biased (e.g., Lagroix et al., 2004; Wang et al., 2013). In addition, low-temperature magnetism in addition avoids complications resulting from in situ alteration when conducting analyses at temperature above ~200°C (e.g., Özdemir and Dunlop, 2000; Till et al., 2015). The new method combines these advantages to the partial demagnetization at any temperature below 127°C (400 K) of a remanent magnetization, especially that of magnetite, which due to its up to 3 orders of magnitude greater magnetization intensity and ubiquity in the geological record can completely mask significant mass or volume concentrations of other environmentally or paleomagnetically important components. In the present study, the mixture sample contains masses of hematite and goethite that are 24 times and 18 times, respectively, greater than that of magnetite and still were undetectable in routine room temperature rock magnetic analyses. The new experimental protocol circumvents the magnetite masks and opens the door to more comprehensive magnetic mineral composition identification through direct observations, to more accurate semi-quantitative concentration estimates by being inclusive of all magnetic particle sizes, and to new frontiers for mineral magnetism in earth and planetary sciences.
Author Contributions
FL and YG both contributed to the experimental development, the data analysis and the writing of the manuscript.
Funding
The work benefitted from financial support through research grants ANR-2010-BLAN-604-01, ANR-08-BLANC-0227-CSD6 and ANR-06-JCJC-0144.
Conflict of Interest Statement
The authors declare that the research was conducted in the absence of any commercial or financial relationships that could be construed as a potential conflict of interest.
Acknowledgments
We are grateful to R. L. Penn and D. Burleson for the synthesis and use of the J-1 hematite sample. This is IPGP contribution 3870.
Supplementary Material
The Supplementary Material for this article can be found online at: https://www.frontiersin.org/article/10.3389/feart.2017.00061/full#supplementary-material
MPMS sequence for the experimental protocol is available as Supplemental Material. For further inquiries or access to the MPMS sequences and the experimental data presented herein validating the new protocol, the reader may contact the corresponding author.
References
Abrajevitch, A., and Kodama, K. (2011). Diagenetic sensitivity of paleoenvironmental proxies: a rock magnetic study of Australian continental margin sediments. Geochem. Geophy. Geosyst. 12:Q05Z24. doi: 10.1029/2010gc003481
Antoine, P., Rousseau, D.-D., Degeai, J.-P., Moine, O., Lagroix, F., Kreutzer, S., et al. (2013). High-resolution record of the environmental response to climatic variations during the Last Interglacial-Glacial cycle in Central Europe: the loess-palaeosol sequence of Dolní Věstonice (Czech Republic). Quat. Sci. Rev. 67, 17–38. doi: 10.1016/j.quascirev.2013.01.014
Carlut, J., Isambert, A., Bouquerel, H., Pecoits, E., Philippot, P., Vennin, E., et al. (2015). Low temperature magnetic properties of the Late Archean Boolgeeda iron formation (Hamersley Group, Western Australia): environmental implications. Front. Earth Sci. 3:18. doi: 10.3389/feart.2015.00018
Carter-Stiglitz, B., Banerjee, S. K., Gourlan, A., and Oches, E. (2006). A multi-proxy study of Argentina loess: marine oxygen isotope stage 4 and 5 environmental record from pedogenic hematite. Palaeogeogr. Palaeoclimatol. Palaeoecol. 239, 45–62. doi: 10.1016/j.palaeo.2006.01.008
Carter-Stiglitz, B., Moskowitz, B. M., and Jackson, M. (2001). Unmixing magnetic assemblages, and the magnetic behavior of bimodal mixtures. J. Geophys. Res. 106, 26397–26411. doi: 10.1029/2001JB000417
Chen, A. P., Berounsky, V. M., Chan, M. K., Blackford, M. G., Cady, C., Moskowitz, B. M., et al. (2014). Magnetic properties of uncultivated magnetotactic bacteria and their contribution to a stratified estuary iron cycle. Nat. Commun. 5:4797. doi: 10.1038/ncomms5797
Church, N. S., Fabian, K., and McEnroe, S. A. (2016). Nonlinear Preisach maps: detecting and characterizing separate remanent magnetic fractions in complex natural samples. J. Geophys. Res. Solid Earth 121, 8373–8395. doi: 10.1002/2016JB013465
Dunlop, D. J. (2002). Theory and application of the Day plot (Mrs/Mr versus Hcr/Hc) 1. Theorectical curves and tests using titanomagnetite data. J. Geophys. Res. 107, EPM 4-1–EPM 4-22. doi: 10.1029/2001JB000486
Egli, R. (2003). Analysis of the field depedence of remanent magnetization curves. J. Geophys. Res. 108:2081. doi: 10.1029/2002JB002023
Egli, R. (2013). VARIFORC: an optimized protocol for calculating non-regular first-order reversal curve (FORC) diagrams. Glob. Planet. Change 110, 302–320. doi: 10.1016/j.gloplacha.2013.08.003
Fabian, K. (2003). Some addtional parameters to estimate domain state from isothermal magnetization measurements. Earth Planet. Sci. Lett. 213, 337–345. doi: 10.1016/S0012-821X(03)00329-7
Fabian, K., Shcherbakov, V. P., Kosareva, L., and Nourgaliev, D. (2016). Physical interpretation of isothermal remanent magnetization end-members: new insights into the environmental history of Lake Hovsgul, Mongolia. Geochem. Geophys. Geosyst. 17, 4669–4683. doi: 10.1002/2016GC006506
Frank, U., and Nowaczyk, N. R. (2008). Mineral magnetic properties properties of artificial samples systematically mixed from haematite and magnetite. Geophys. J. Int. 175, 449–461. doi: 10.1111/j.1365-246X.2008.03821.x
Fuchs, M., Kreutzer, S., Rousseau, D.-D., Antoine, P., Hatté, C., Lagroix, F., et al. (2013). The loess sequence of Dolní Věstonice, Czech Republic: a new OSL-based chronology of the Last Climatic Cycle. Boreas 42, 664–677. doi: 10.1111/j.1502-3885.2012.00299.x
Guyodo, Y., LaPara, T. M., Anschutz, A. J., Penn, R. L., Banerjee, S. K., Geiss, C. E., et al. (2006). Rock magnetic, chemical and bacterial community analysis of a modern soil from Nebraska. Earth Planet. Sci. Lett. 251, 168–178. doi: 10.1016/j.epsl.2006.09.005
Guyodo, Y., Mostrom, A., Penn, R. L., and Banerjee, S. K. (2003). From Nanodots to Nanorods: oriented aggregation and magnetic evolution of nanocrystalline goethite–art. no. 1512. Geophys. Res. Lett. 30:22. doi: 10.1029/2003gl017021
Heslop, D. (2015). Numerical strategies for magnetic mineral unmixing. Earth Sci. Rev. 150, 256–284. doi: 10.1016/j.earscirev.2015.07.007
Heslop, D., and Dillon, M. (2007). Unmixing magnetic remanence curves without a priori knowledge. Geophys. J. Int. 170, 556–566. doi: 10.1111/j.1365-246X.2007.03432.x
Hyland, E. G., Sheldon, N. D., Van der Voo, R., Badgley, C., and Abrajevitch, A. (2015). A new paleoprecipitation proxy based on soil magnetic properties: implications for expanding paleoclimate reconstructions. Geol. Soc. Am. Bull. 127:B31207.1. doi: 10.1130/B31207.1
Jackson, M., Carter-Stiglitz, B., Egli, R., and Solheid, P. (2006). Characterizing the superparamagnetic grain distribution f (Vi, Hk) by thermal fluctuation tomography. J. Geophys. Res. Solid Earth 111:B12S07. doi: 10.1029/2006JB004514
Kosterov, A. (2002). Low-temperature magnetic hysteresis properties of partially oxidized magnetite. Geophys. J. Int. 149, 796–804. doi: 10.1046/j.1365-246X.2002.01686.x
Lagroix, F., Banerjee, S. K., and Jackson, M. J. (2004). Magnetic properties of the Old Crow tephra: identification of a complex iron titanium oxide mineralogy. J. Geophys. Res. Solid Earth 109:B01104. doi: 10.1029/2003jb002678
Lagroix, F., Banerjee, S. K., and Jackson, M. J. (2016). “Geological occurrences and relevance of iron oxides,” in Iron Oxides: From Nature to Applications, ed D. Faivre (Weinheim: Wiley-VCH), 9–29.
Lagroix, F., Guyodo, Y., Till, J. L., and Naess, L. N. (2014). “Magnetic mineral separation: a timeless challenge for an experimental rock magnetist,” in Proceedings EGU General Assembly (Vienna).
Lascu, I., Banerjee, S. K., and Berquó, T. S. (2010). Quantifying the concentration of ferrimagnetic particles in sediments using rock magnetic methods. Geochem. Geophys. Geosyst. 11:Q08Z19. doi: 10.1029/2010gc003182
Lascu, I., and Feinberg, J. M. (2011). Speleothem magnetism. Quat. Sci. Rev. 30, 3306–3320. doi: 10.1016/j.quascirev.2011.08.004
Lascu, I., Harrison, R. J., Li, Y. T., Muraszko, J. R., Channell, J. E. T., Piotrowski, A. M., et al. (2015). Magnetic unmixing of first-order reversal curve diagrams using principal component analysis. Geochem. Geophys. Geosyst. 16, 2900–2915. doi: 10.1002/2015GC005909
Lascu, I., McLauchlan, K. K., Myrbo, A., Leavitt, R., and Banerjee, S. K. (2012). Sediment-magnetic evidence for last millennium drought conditions at the prairie-forest ecotone of northern United States. Palaeogeogr. Palaeoclimatol. Palaeoecol. 337, 99–107. doi: 10.1016/j.palaeo.2012.04.001
Liu, Q., Banerjee, S. K., Jackson, M. J., Zhu, R., and Pan, Y. (2002). A new method in mineral magnetism for the separation of weak antiferromagnetic signal from a strong ferrimagnetic background. Geophys. Res. Lett. 29, 6-1–6-4. doi: 10.1029/2002gl014699
Liu, Q., Roberts, A. P., Larrasoana, J. C., Banerjee, S. K., Guyodo, Y., Tauxe, L., et al. (2012). Environmental magnetism: principles and applications. Rev. Geophys. 50:RG4002. doi: 10.1029/2012rg000393
Maxbauer, D. P., Feinberg, J. M., and Fox, D. L. (2016a). Magnetic mineral assemblages in soils and paleosols as the basis for paleoprecipitation proxies: a review of magnetic methods and challenges. Earth Sci. Rev. 155, 28–48. doi: 10.1016/j.earscirev.2016.01.014
Maxbauer, D. P., Feinberg, J. M., and Fox, D. L. (2016b). MAX UnMix: a web application for unmixing magnetic coercivity distributions. Comput. Geosci. 95, 140–145. doi: 10.1016/j.earscirev.2016.01.014
Maxbauer, D. P., Feinberg, J. M., Fox, D. L., and Clyde, W. C. (2016c). Magnetic minerals as recorders of weathering, diagenesis, and paleoclimate: a core–outcrop comparison of Paleocene–Eocene paleosols in the Bighorn Basin, WY, USA. Earth Planet. Sci. Lett. 452, 15–26. doi: 10.1016/j.earscirev.2016.01.014
Mehra, O. P., and Jackson, M. L. (1960). Iron oxide removal from soils and clays by a dithionite-citrate system buffered with sodium bicarbonate. Clays Clay Miner 5, 317–327.
Nie, J. S., Jackson, M., King, J., and Fang, X. M. (2013). Characterizing the superparamagnetic grain distribution of Chinese red-clay sequences by thermal fluctuation tomography. Glob. Planet. Change 110, 364–367. doi: 10.1016/j.gloplacha.2013.04.012
Nie, J. S., Zhang, R., Necula, C., Heslop, D., Liu, Q. S., Gong, L. S., et al. (2014). Late Miocene- early Pleistocene paleoclimate history of the Chinese Loess Plateau revealed by remanence unmixing. Geophys. Res. Lett. 41, 2163–2168. doi: 10.1002/2014GL059379
Özdemir, Ö., and Dunlop, D. J. (2000). Intermediate magnetite formation during dehydration of goethite. Earth Planet. Sci. Lett. 177, 59–67. doi: 10.1016/S0012-821X(00)00032-7
Özdemir, Ö., and Dunlop, D. J. (2010). Hallmarks of maghemitization in low-temperature remanence cycling of partially oxidized magnetite nanoparticles. J. Geophys. Res. Solid Earth 115:B02101. doi: 10.1029/2009jb006756
Özdemir, Ö., Dunlop, D. J., and Berquó, T. S. (2008). Morin transition in hematite: size dependence and thermal hysteresis. Geochem. Geophys. Geosyst. 9:Q10Z01. doi: 10.1029/2008GC002110
Robertson, D. J., and France, D. E. (1994). Discrimination of remanence-carrying minerals in mixtures, using isothermal remanent magnetization acquisition curves. Phys. Earth Planet. Interiors 82, 223–234. doi: 10.1016/0031-9201(94)90074-4
Schwertmann, U., and Cornell, R. M. (1991). Iron Oxides in the Laboratory: Preparation and Characterization. New York, NY: VCH Publishers.
Slotznick, S. P., and Fischer, W. W. (2016). Examining Archean methanotrophy. Earth Planet. Sci. Lett. 441, 52–59. doi: 10.1016/j.epsl.2016.02.013
Smirnov, A. V., and Tarduno, J. A. (2002). Magnetic field control of the low-temperature magnetic properties of stoichiometric and cation-deficient magnetite. Earth Plane. Sci. Lett. 194, 359–368. doi: 10.1016/S0012-821X(01)00575-1
Strauss, B. E., Feinberg, J. M., and Johnson, C. L. (2016). Magneticmineralogy of the Mercurian lithosphere. J. Geophys. Res. Planets 121, 2225–2238. doi: 10.1002/2016JE005054
Till, J., Guyodo, Y., Lagroix, F., Morin, G., and Ona-Nguema, G. (2015). Goethite as a potential source of magnetic nanoparticles in sediments. Geology 43, 75–78. doi: 10.1130/G36186.1
Till, J. L., Jackson, M. J., and Moskowitz, B. M. (2010). Remanence stability and magnetic fabric development in synthetic shear zones deformed at 500°C. Geochem. Geophys. Geosyst. 11:Q12Z21. doi: 10.1029/2010GC003320
Toner, B. M., Rouxel, O. J., Santelli, C. M., Bach, W., and Edwards, K. J. (2016). Iron transformation pathways and redox micro-environments in seafloor sulfide-mineral deposits: spatially resolved Fe XAS and delta Fe-57/54 observations. Front. Microbiol. 7:648. doi: 10.3389/fmicb.2016.00648
van Oorschot, I. H. M., and Dekkers, M. J. (2001). Selective dissolution of magnetic iron oxides in the acid-ammonium oxalate/ferrous iron extraction method - I. Synthesis samples. Geophys. J. Int. 145, 740–748. doi: 10.1046/j.0956-540x.2001.01420.x
van Oorschot, I. H. M., Dekkers, M. J., and Havlicek, P. (2002). Selective dissolution of magnetic iron oxides with the acid-ammonium-oxalate/ferrous-iron extraction technique - II. Natural loess and paleosol samples. Geophys. J. Int. 149, 106–117. doi: 10.1046/j.1365-246X.2002.01641.x
Vidic, N. J., TenPas, J. D., Verosub, K. L., and Singer, M. J. (2000). Separation of pedogenic and lithogenic components of magnetic susceptibility in the Chinese loess/palaeosol sequence as determined by the CBD procedure and a mixing analysis. Geophys. J. Int. 142, 551–562. doi: 10.1046/j.1365-246x.2000.00178.x
Wang, H., Kent, D. V., and Jackson, M. J. (2013). Evidence for abundant isolated magnetic nanoparticles at the Paleocene–Eocene boundary. Proc. Natl. Acad. Sci. U.S.A. 110, 425–430. doi: 10.1073/pnas.1205308110
Wang, H. P., Weiss, B. P., Bai, X. N., Downey, B. G., Wang, J., Wang, J. J., et al. (2017). SOLAR SYSTEM FORMATION Lifetime of the solar nebula constrained by meteorite paleomagnetism. Science 355:623. doi: 10.1126/science.aaf5043
Yu, Y., Dunlop, D. J., and Özdemir, Ö. (2002). Partial anhysteretic remanent magnetization in magnetite 1. Additivity. J. Geophys. Res. B: Solid Earth 107, EPM 7-1–EPM 7-9. doi: 10.1029/2001jb001249
Keywords: low-temperature magnetism, demagnetization, remanence, magnetite, hematite, goethite, maghemite, nanoparticles
Citation: Lagroix F and Guyodo Y (2017) A New Tool for Separating the Magnetic Mineralogy of Complex Mineral Assemblages from Low Temperature Magnetic Behavior. Front. Earth Sci. 5:61. doi: 10.3389/feart.2017.00061
Received: 12 May 2017; Accepted: 11 July 2017;
Published: 28 July 2017.
Edited by:
Alexandra Abrajevitch, Institute of Tectonics and Geophysics named after Y. A. Kosygin (RAS), RussiaReviewed by:
Simo Spassov, Royal Meteorological Institute of Belgium, BelgiumAnn Marie Hirt, ETH Zurich, Switzerland
Copyright © 2017 Lagroix and Guyodo. This is an open-access article distributed under the terms of the Creative Commons Attribution License (CC BY). The use, distribution or reproduction in other forums is permitted, provided the original author(s) or licensor are credited and that the original publication in this journal is cited, in accordance with accepted academic practice. No use, distribution or reproduction is permitted which does not comply with these terms.
*Correspondence: Yohan Guyodo, yohan.guyodo@impmc.upmc.fr