The Effects of Vent Location, Event Scale, and Time Forecasts on Pyroclastic Density Current Hazard Maps at Campi Flegrei Caldera (Italy)
 Andrea Bevilacqua1,2
  Augusto Neri1*
  Marina Bisson1
  Tomaso Esposti Ongaro1 Franco Flandoli3
  Roberto Isaia4 Mauro Rosi5
  Stefano Vitale4,6
- 1Sezione di Pisa, Istituto Nazionale di Geofisica e Vulcanologia, Pisa, Italy
- 2Geology Department, State University of New York at Buffalo, Buffalo, NY, United States
- 3Dipartimento di Matematica, Università di Pisa, Pisa, Italy
- 4Osservatorio Vesuviano, Istituto Nazionale di Geofisica e Vulcanologia, Napoli, Italy
- 5Dipartimento di Scienze delle Terra, Università di Pisa, Pisa, Italy
- 6Dipartimento di Scienze della Terra, dell'Ambiente e delle Risorse, Università degli Studi di Napoli Federico II, Napoli, Italy
This study presents a new method for producing long-term hazard maps for pyroclastic density currents (PDC) originating at Campi Flegrei caldera. Such method is based on a doubly stochastic approach and is able to combine the uncertainty assessments on the spatial location of the volcanic vent, the size of the flow and the expected time of such an event. The results are obtained by using a Monte Carlo approach and adopting a simplified invasion model based on the box model integral approximation. Temporal assessments are modeled through a Cox-type process including self-excitement effects, based on the eruptive record of the last 15 kyr. Mean and percentile maps of PDC invasion probability are produced, exploring their sensitivity to some sources of uncertainty and to the effects of the dependence between PDC scales and the caldera sector where they originated. Conditional maps representative of PDC originating inside limited zones of the caldera, or of PDC with a limited range of scales are also produced. Finally, the effect of assuming different time windows for the hazard estimates is explored, also including the potential occurrence of a sequence of multiple events. Assuming that the last eruption of Monte Nuovo (A.D. 1538) marked the beginning of a new epoch of activity similar to the previous ones, results of the statistical analysis indicate a mean probability of PDC invasion above 5% in the next 50 years on almost the entire caldera (with a probability peak of ~25% in the central part of the caldera). In contrast, probability values reduce by a factor of about 3 if the entire eruptive record is considered over the last 15 kyr, i.e., including both eruptive epochs and quiescent periods.
Introduction
The development of long-term (sometimes also called base-rate or background) hazard maps for pyroclastic density currents (PDC) originating in a caldera setting is a challenging problem. Nevertheless, such achievement product is necessary for urban planning and risk reduction on the territory. In particular, a significant improvement of the risk mitigation strategies is enabled by the quantitative combination of the probability distributions for the spatial location of the eruptive vent originating the PDC, the size of the flow, and the temporal estimates for such expected event in the future (see Woo, 1999; Marzocchi and Woo, 2009; Rougier et al., 2013; Wadge and Aspinall, 2014). This accomplishment is the main purpose of this research study.
Campi Flegrei (CF) is a ~12 km wide volcanic caldera located in Southern Italy, a very urbanized area including the western part of the city of Napoli (see Figure 1). Three epochs of activity in the last 15 kyr included at least 70 explosive eruptions alternated with periods of quiescence of several millennia (Rosi et al., 1983; Orsi et al., 2004). During this period, which is typically considered representative for hazard assessment studies, past eruptive vents opened in the central part of the caldera as well as at its boundaries, with individual events spanning a large range of eruptive scales including large explosive eruptions characterized by tephra volumes over 1 km3. Sequences of events often occurred closely in time and space thus generating a cluster of events (e.g., Isaia et al., 2004, 2009; Bevilacqua et al., 2016). Subsidence and uplift (bradyseism) of the central part of the caldera are documented from the Roman times and the most recent Monte Nuovo eruption was in A.D. 1538, after ~3,000–3,500 years of quiescence (e.g., Guidoboni and Ciuccarelli, 2011; Di Vito et al., 2016). Ground movements and geochemical variation of the main fumarolic fields within the caldera suggest that the volcano likely entered a phase of unrest in the second half of the last century which is not concluded yet (e.g., Chiodini et al., 2012, 2016). Recent field-work, deep drilling measurements and submarine survey of the Gulf of Pozzuoli have further constrained the tectonic history of the caldera (Isaia et al., 2015; De Natale et al., 2016; Steinman et al., 2016). Several previous studies have been specifically focused on the space-time eruptive history of CF, focusing on the Campanian Plain volcanism occurred during the last ~50 kyr (Scandone et al., 1991), the CF volcanism in the last 12 kyr (Di Vito et al., 1999), or the geochemical evolution of the magmatic system in the last ~15 kyr (Di Renzo et al., 2011; Smith et al., 2011).
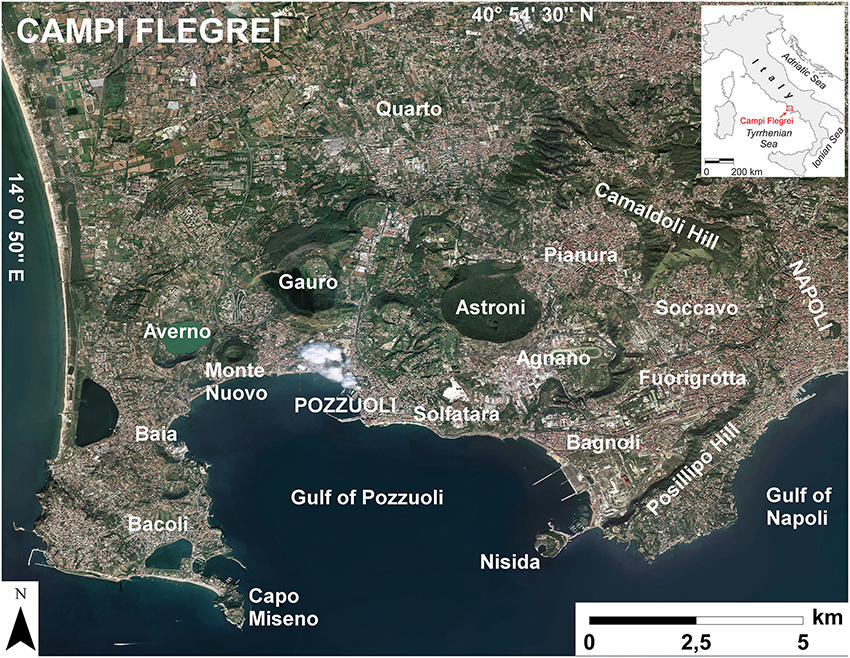
Figure 1. Mosaic of aerial/satellite photos of Campi Flegrei caldera and surrounding areas (including part of the city of Napoli on the east) showing the large urbanization inside and around this active volcano, modified from the ESRI dataset World_Imagery—www.arcgis.com.
One of the main hazards in CF caldera is represented by PDC, which can produce lethal conditions for human beings and heavy damage to urban structures (e.g., Baxter et al., 2005; Neri et al., 2014). In the literature it is possible to find several studies aimed at solving the PDC hazard mapping problem in the CF area. For instance, first hazard maps of the zones potentially affected in the future have been produced by relying on the distribution of invaded areas by PDC associated with some of the main past events or specific eruptive scales (Lirer et al., 2001; Alberico et al., 2002; Orsi et al., 2004). A quantitative hazard map was constructed by using a dynamic flow model, with variable eruptive scales and uniform vent opening probability in an area centered on the town of Pozzuoli (Rossano et al., 2004). Further studies have adopted 2D/3D numerical multiphase flow simulations of single Plinian events, showing that PDC of this scale could overtop the Posillipo Hill, a high topographic barrier toward the central part of the city of Napoli (Todesco et al., 2006; Esposti Ongaro et al., 2007, 2008).
A qualitative hazard map of PDC invasion for the city of Napoli from both CF and Vesuvius was also developed, based on the integration of a spatial probability map of vent opening and the consideration of different eruptive scales (Alberico et al., 2011). The invasion areas were determined using the energy-cone model based on the assumption of linear decay of flow energy with distance (e.g., Hsu, 1975; Malin and Sheridan, 1982). A systematic evaluation of the application of the energy-cone model to CF, aimed at the estimation of value and variability of PDC invaded area and maximum run-out was also accomplished (Tierz et al., 2016).
The PDC hazard assessments presented in this paper largely rely on and further extend the recent studies of Bevilacqua et al. (2015) and Neri et al. (2015), which presented quantitative probabilistic PDC invasion maps, considering some of the main epistemic uncertainty effects. They were developed by using a quite articulated Monte Carlo simulation including some of the main system variables (i.e., vent location and PDC size), but not its time. The PDC propagation was modeled with a simplified integral approximation tested with laboratory experiments and 2D transient numerical simulations of flow dynamics (Neri et al., 2015; Bevilacqua, 2016; Esposti Ongaro et al., 2016).
In this research study several improvements on PDC hazard mapping in the CF area are achieved. First (Section PDC Scale Dependence on the Caldera Sector), the differences in scale between eastern and western sectors of the caldera are described and implemented in all hazard assessments. Indeed the past activity in the western part of the caldera is characterized by lesser volumes (Bevilacqua et al., 2016) and reduced PDC invasion areas. This reduces the hazard in the western sector of the caldera and increases it in the eastern sector with respect to the case of considering average properties of the caldera. Moreover (Section Conditional Maps for Specific PDC Scales and Vent Locations), new PDC invasion hazard maps conditional on specific eruption scales and vent locations inside particular zones of the caldera are presented. Finally (Section Effects of Temporal Assessments on the Maps), and most importantly, temporal assessments are included in the maps based on the statistical models of Bevilacqua et al. (2016). These achievements permit to calculate the PDC invasion hazard in the next 10 and 50 years under the assumptions that the volcano entered, or not, after the last Monte Nuovo eruption, a new epoch of activity similar to the previous ones.
It is important to remark that all the assessments in this study are doubly stochastic, in the sense that the physical variability (also called aleatoric uncertainty) and the epistemic uncertainty effects considered are separately modeled and all the probability estimates concerning the former are associated with confidence intervals due to the latter (see also Cox and Isham, 1980; Sparks and Aspinall, 2004; Marzocchi and Bebbington, 2012; Bevilacqua, 2016).
PDC Hazard Mapping Methods
In this section we will briefly review the methods adopted in Bevilacqua et al. (2015) and Neri et al. (2015), and we will present the new procedures for convolving the spatial hazard mapping with the temporal modeling of Bevilacqua et al. (2016). In particular, in the Section PDC Hazard Maps Conditional on the Occurrence of an Explosive Eruption, we will describe the methods aimed at combining the vent opening location and the invaded area estimates thus producing hazard maps conditional on the occurrence of a PDC. In the Section Temporal Model for Explosive Eruptions, we will detail the temporal model based on the eruption record and its convolution with the conditional maps generated.
PDC Hazard Maps Conditional on the Occurrence of an Explosive Eruption
The following procedure allows obtaining the PDC invasion probability conditional on the occurrence of an explosive event located on-land. This restriction is due to the fact that the source conditions and properties of the flows would be fundamentally different in the case of an underwater vent. These maps display the percentage probability of each location of the considered region to be invaded by a PDC under the assumption that it occurs. The temporal assessments described later (Section Temporal Model for Explosive Eruptions) enable us to extend this approach and to produce PDC invasion hazard maps associated to a specific future time window.
Spatial Probability Distribution of Vent Opening
The long-term spatial probability distribution of vent opening location (Connor and Hill, 1995; Martì and Felpeto, 2010) follows the analysis presented in a previous study (Bevilacqua et al., 2015) where the probability map of new vent opening over the caldera, conditional on the occurrence of an eruption, is expressed as the result of weighted linear combination of five maps describing the spatial distributions of relevant volcanic features. Such features include the eruptive vent locations during the three epochs of CF activity in the past 15 kyr (each epoch is separately considered), and also the maximum fault displacement and the surface fractures density. Indeed the pre-existing faults/fractures have proved to be significantly correlated with the opening of new vents and typically represent a weakness element that may favor the magma ascent (Connor et al., 2000; Calais et al., 2008; Vitale and Isaia, 2014; Mazzarini et al., 2016; Bevilacqua et al., 2017; Tadini et al., 2017). However, several other factors including the fault angle, the magma pressure and the depth of interaction can be relevant too (Gaffney et al., 2007; Le Corvec et al., 2013), but are neglected in the present study. In addition, in order to take into account the influence of other variables not considered or unidentified processes, a uniform probability map inside the caldera is also included.
Some of the epistemic uncertainty sources of the volcanological information are also considered (see Bevilacqua et al., 2015 for more details). In particular, concerning the localization of eruptive vents whose position is reconstructed from field data. The past vent locations are represented by ellipses defining the associated uncertainty area, and not by deterministic points. We also consider past events which do not correspond to presently identified vent features such as craters, cones, calderas, but for which tephra deposits permit some inference on their location, and an uncertain number of “lost vents” whose position in the on-land part of the caldera is unconstrained. Most importantly, the analysis estimates the uncertain weights to be associated with the features that contribute to the definition of the vent opening map, relying on expert judgment techniques (Cooke, 1991; Aspinall, 2006; Bevilacqua, 2016). A logic tree of target questions is defined for simplifying the uncertainty quantification, and various procedures of structured elicitation are applied to test the sensitivity of the results to the different models (e.g., Cooke, 1991; Flandoli et al., 2011). Figure 2a shows an example of average vent opening probability map obtained with the above procedure.
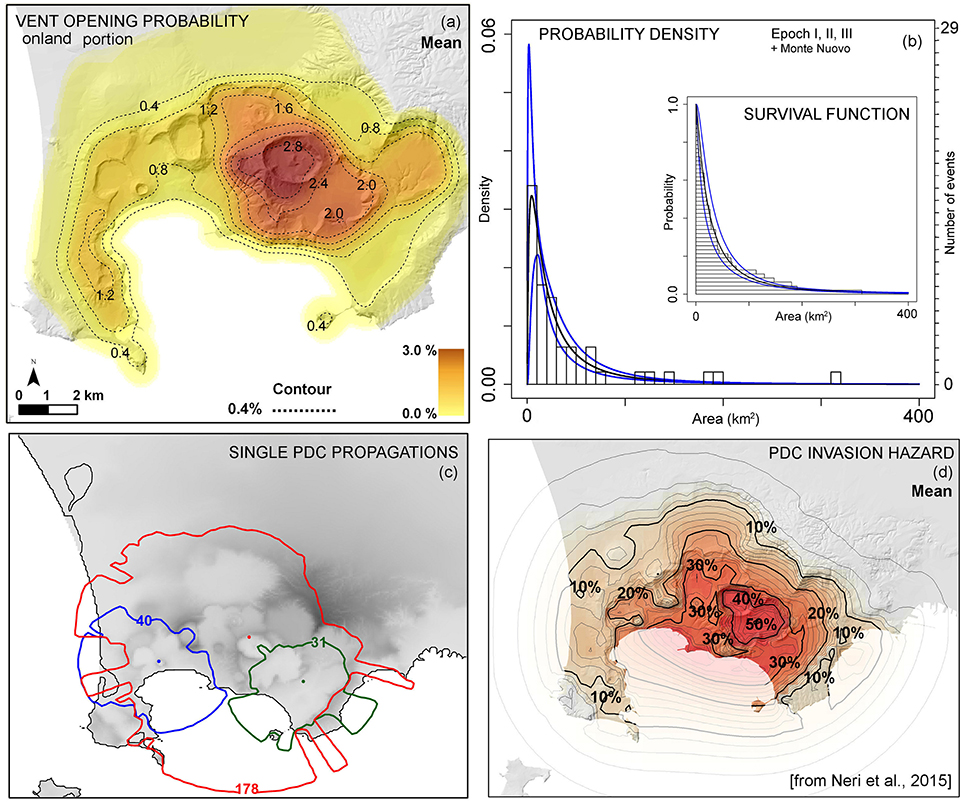
Figure 2. (a) Probability map of new vent opening location, modified from Bevilacqua et al. (2015). Contours and colors indicate the mean percentage probability of vent opening per km2 conditional on the occurrence of an eruption originating on-land. (b) Histograms of the PDC invasion areas as estimated for the events in the last 15 kyr, modified from Neri et al. (2015). Probability density functions (log-normal class) are displayed for the invasion areas—the black curve is the mean value and the blue curves are the 5th and 95th uncertainty bounds. In the small box are included the mean survival functions with their uncertainty bounds. (c) Example of the invasion areas of three PDC simulation runs with different origin and areal extent. Different colors correspond to different runs. The colored contours envelop the invaded areas and the numbers on the contours are the values of the area invaded. (d) PDC invasion probability map as computed in Neri et al. (2015) from the invasion areas distribution and the vent opening map displayed. Contours and colors indicate the mean percentage probability of PDC invasion conditional on the occurrence of an explosive eruption originating on-land.
Distribution of PDC Invasion Areas
Following the approach of Neri et al. (2015), the area invaded by a potential PDC is represented as a random variable. The distribution of this variable is based on the record of the areas of the PDC deposits that occurred in the last 15 kyr. This dataset includes 47 events and largely relies on the work of Orsi et al. (2004), with a few modifications and updates made in order to account for the most recent research findings. Epistemic uncertainty affects such record too: the error of deposit boundaries is considered to vary between ~150 and ~1,000 m, with a mean value of ~500 m (see Bevilacqua, 2016). In order to use a more representative dataset for the totality of past invasion areas, the record is extended including some estimates of unmapped deposits, based on a comparison between the dataset of invasion areas and that of the identified vents. The invasion areas of these not reconstructed PDC are randomly sampled using a distribution fitted to available field datasets, truncated to the thresholds of 10 or 50 km2, depending on the age of the event. In particular, 21 invasion areas are added (31% of the total dataset)—12 events up to 10 km2 and 9 up to 50 km2 (Neri et al., 2015 for more details). The choice to add lost deposits of two different areas reflects the fact that the reconstruction of older deposits is significantly more difficult than for the later epochs and so larger missing deposits are more likely to be appropriate.
Figure 2b shows the probability density functions of PDC invasion area distribution considering the last 15 kyr dataset. The three curves, calculated by a Monte Carlo simulation, and assuming maximum likelihood lognormal distributions, are related to the 5th percentile, the mean and the 95th percentile of the density function values, obtained considering the radial underestimation and unmapped deposits uncertainty sources. The possibility of having dependence between the PDC invasion area and the vent location will be explored in the next sections, with a separate analysis of the PDC originated in the western and eastern sectors of the caldera. Alternative estimates based on the more accurately reconstructed record of the last 5 kyr produce very similar results, as shown in Neri et al. (2015), but such reduced dataset would not contain enough events for permitting such additional analysis.
Simplified PDC Invasion Model
The box model integral approximation of PDC propagation is adopted for effectively computing the main effects of the large variability of vent location and PDC scale on the invasion areas. The model is based on the work of Huppert and Simpson (1980), Dade and Huppert (1996), and Hallworth et al. (1998). It is suited for describing the propagation of turbulent currents, in which inertial effects dominate over viscous forces and particle-particle interactions. More details can be found in Neri et al. (2015), Bevilacqua (2016), and Esposti Ongaro et al. (2016).
The model enables us to approximate the flow kinematics and maximum runout reached over a sub-horizontal surface by a current generated by the instantaneous release (i.e., dam-break configuration) of a finite volume of gas and solid particles. It can thus describe PDC generated by the gravitational collapse of a portion of the column. The box model assumes that the current is vertically homogeneous and deposits particles during propagation at a rate proportional to their settling velocity. A single particle size representative of the mean Sauter diameter of the grain-size distribution of the mixture is considered, as in Neri et al. (2015). The model can therefore approximate the flow front velocity as a function of the distance from the origin. In order to quantify first-order effect of topography on the invasion area, the kinetic energy of the flow front is compared to the potential energy required to overcome the topographical reliefs that the flow encounters, thus following an approach similar to the energy-line (or energy-cone) model (Hsu, 1975; Malin and Sheridan, 1982; Alberico et al., 2011; Tierz et al., 2016). For simplicity the sea surface is assumed as flat ground topography with no effect of the water on the PDC propagation: this enables us to obtain a first (likely minimal) approximation of the potential hazard represented by PDCs traveling over the sea (see Neri et al., 2015, for more details).
It is important to specify that, in the present study, the physical parameter C of the box model is assumed equal to 2 m2/3/s, as in Neri et al. (2015) and Bevilacqua (2016). More details on the meaning of this parameter can be found in those studies. It is also important to remark that, in the generation of the hazard maps, the PDC invasion model is applied in an inverse mode, i.e., starting from invasion area extent (obtained using the density functions described above) and then computing a new invasion area with the same extent, given a specific vent location and surrounding topography. Figure 2c shows three different example runs of the PDC model, changing vent locations and invasion area.
Convolution of the Models through Monte Carlo Simulation
The produced PDC hazard maps are the result of a Monte Carlo simulation procedure, implemented to combine the several probability distributions discussed above. Such Monte Carlo simulation has a nested structure, configured for estimating the effects of epistemic uncertainty on the results according to a doubly stochastic approach. Hence the procedure creates maps of PDC invasion hazard in terms of a mean value and of the 5th and 95th percentiles with respect to the uncertainty sources considered.
In particular, for each random vent location (sampled over a regular 500 m spaced grid) and PDC areal extent, the PDC simulation associates a value of 1 to the zones reached by the flow, and of 0 otherwise. As mentioned above, this is done using the box model approximation in an inverse mode, i.e., using the invaded area extent as an input. By repeating the simulation of a single PDC a large number of times randomly changing vent location and invasion area, and then averaging the 0/1 values obtained in each point, the probability that each location of the map is reached by a PDC is calculated (Neri et al., 2015; Bevilacqua, 2016). In addition, another level of Monte Carlo simulation is implemented for repeating this procedure under several samples of the epistemic uncertainty sources. This enables us to quantify the effects of the uncertainty sources onto the hazard maps. It is worth mentioning that the Monte Carlo convergence concerning the two-dimensional sampling of the vent location is accelerated thanks to the linearity of the whole process with respect to the vent location choice. This is better detailed in Bevilacqua (2016). Figure 2d shows an example of the PDC invasion probability map as obtained from the described steps.
Temporal Model for Explosive Eruptions
Long-term volcanic hazard assessment models including time are quite uncommon in literature because of their complexity and often due to the lack of accurate data older than a few centuries (see Bebbington, 2010, 2013). However, some examples exist: Cox processes have been applied to the assessment of long-term volcanic hazards (e.g., Jaquet et al., 2000, 2008; Jaquet and Carniel, 2006); self-exciting processes have been introduced for modeling the temporal eruptive pattern of volcanic fields (e.g., Bebbington and Cronin, 2011); a complete long-term PDC hazard assessment procedure has been developed at the Montserrat volcano, combining probability estimates of time, size and direction of the flows (Bayarri et al., 2009, 2015). A detailed review also including other approaches has been described in Bebbington (2013).
The temporal assessments adopted in this study are based on a multivariate Cox-Hawkes process, a Poisson-type model capable of a self-excitement behavior producing clusters of events in time-space and including the effect of the epistemic uncertainty affecting the available past record. The model has been developed by Bevilacqua (2016) and Bevilacqua et al. (2016), where the reader can find more details. In the following the temporal model is briefly summarized.
In general the intensity function λ of a counting process has the meaning of the average density of new events occurring. A non-homogeneous Poisson process always assumes λ as a deterministic function of time: in contrast a Cox process Z has a random intensity function λ, such that Z conditional on each trajectory of λ is a Poisson process, and allows us to model the uncertainty effects. The Hawkes processes differ from non-homogeneous Poisson processes because the intensity function increases whenever an event occurs and instead decreases as time passes without any event occurring. Each component of the process counts the number of events occurred in one of spatial zones in which the volcanic caldera is partitioned.
Each event is assumed to self-excite its zone, increasing the probability of additional events nearby. Random intensity is the sum of a constant term λ0 (base rate) and of a time dependent random term that represents an additional intensity produced by each previous event. In particular:
where (ti) is the random sequence sampled in such zone before time t, and φ is a positive decreasing function representing self-excitement decay. A Cox-Hawkes process includes both the doubly stochastic and self-excitement features: the function λ is expressed conditionally on the parameters λ0 and φ which are also treated as uncertain in a hierarchical model. The future eruption times and parameters are jointly conditioned on the recorded eruption history, and then the parameters are integrated out, to give the predictive distribution for future eruptions. There is a closed-form likelihood for a self-exciting process, and the selection of the model parameters with a maximum likelihood estimator can be implemented in a nested Monte Carlo simulation and repeated for each sample of the uncertain past eruptive sequence, for quantifying its effect on the estimates.
Different probability estimates for the chance of having an event in the next T years are obtained considering the eastern of the western eruptive records separately during the three epochs of activity in the past 15 kyr (Bevilacqua et al., 2016). The long periods of quiescence separating the epochs are not easily replicated by the model and therefore are excluded by the analysis. Hence the temporal assessments obtained by the model are under the assumption that after the Monte Nuovo event (A.D. 1538) the caldera system entered a new epoch of activity similar to the three previously occurred in the last 15 kyr. However some first-order temporal estimates including the periods of quiescence will be also provided in Section Effects of Temporal Assessments on the Maps.
In case of a short future time window (i.e., T ≤ 10 years), the time estimates are separately calculated from the temporal model, and then combined with the conditional hazard mapping available. We do not consider the effect of new clusters in this short time horizon. This is done multiplying the temporal probability with all the probability values on the conditional map, hence assuming the independence of the spatial assessments on the temporal assessments, i.e., that the spatial vent opening probability is not going to change with time.
In case of a longer time window (i.e., T ≥ 50 years), the potential occurrence of clustered sequences of eruptive events (e.g., Isaia et al., 2004; Bevilacqua et al., 2016) is also considered. All the explosive eruptions possibly taking place in the selected time frame are included in the hazard mapping, and the area invaded by PDC is assumed equal to the union of the single extents in the sequence. In particular, a multivariate temporal sampling is repeated inside the Monte Carlo simulation, separately assessing the events in the different zones of the caldera partition of Bevilacqua et al. (2015). The areal size sampling is repeated for each PDC. It is significant to note that the offspring events in each cluster sequence were constrained to remain inside the same zone of the first one. In this way the temporal and spatial probability distributions are not-trivially convoluted. We have tested this procedure also on the shorter time windows (i.e., T ≤ 10 years) obtaining results not significantly different from those obtained by the simplified model described above.
Results and Discussion
The above described approach enables us to produce the first long-term PDC invasion hazard maps that include the effects of a correlation between eruption scale and vent location. It also allows generating hazard maps that constrain both these variables to specific PDC sizes (i.e., invasion areas) and spatial zones, respectively. Finally, and most importantly, the method presented allows producing hazard maps with associated temporal assessments, such as PDC invasion hazard maps on 10 and 50 years time windows of the CF caldera.
PDC Scale Dependence on the Caldera Sector
The eruption rates from the eastern and western sectors of the CF caldera are remarkably different for what concerns both the number of events per year and the magma volumes erupted per year, even including the epistemic uncertainty effects (Bevilacqua, 2016; Bevilacqua et al., 2016). In particular the western sector of the caldera is characterized by a less frequent and less clustered activity, as well as by smaller size events. This is confirmed by the analysis of the record of the areal extents of past PDC deposits, as it is shown in Figure 3a. This results in the significantly different probability distributions for the PDC sizes shown in Figure 3b. The difference is significant and not depending on the smaller number of events occurred. It is worth mentioning that the random sampling of not reconstructed past PDC is accomplished including 5 events in the western sector and 7 events in the eastern sector invading <10 km2, plus 9 events in the eastern sector invading <50 km2 (this is compatible with the field evidences). The estimates also incorporate the underestimation bias on the deposit radius (more details in Neri et al., 2015).
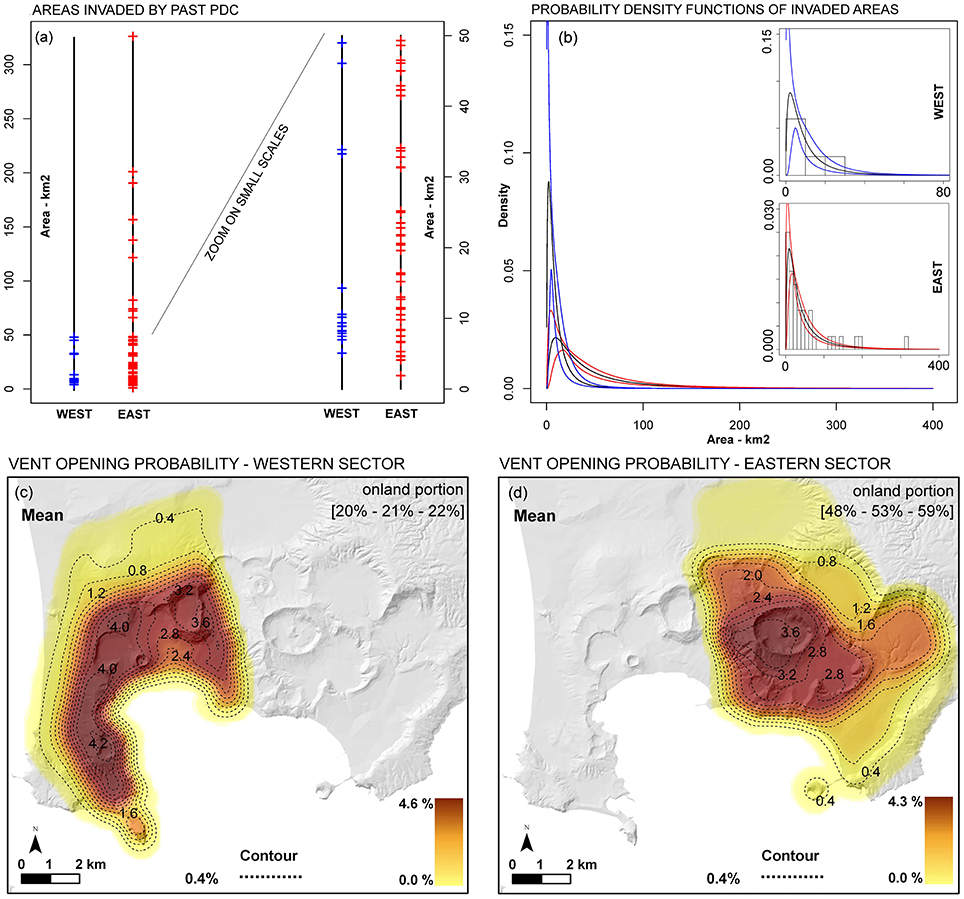
Figure 3. (a) Representation of the areas invaded by past PDC originating in the western (blue) or eastern (red) sectors of the caldera. Each colored dash represents an event. The sequence is ordered increasingly as a function of the areal extents. On the right of the plot is displayed a zoom of the small scales data. (b) Probability density functions (log-normal class) for the invasion areas originating in the western (blue) or eastern (red) sectors of the caldera. The black curve is the mean value and the colored curves are the 5th and 95th uncertainty bounds. In the small boxes the two estimates are displayed at different scales and the histogram data are included. (c,d) Probability maps of new vent opening location modified from Bevilacqua et al. (2015). Contours and colors indicate the mean percentage probability of vent opening per km2 conditional on the occurrence of an eruption originating on-land in the western (c) or in the eastern (d) sector of the caldera. Percentage vent opening probability values of the two on-land sectors, according to Figure 2a, are displayed with their 5th and 95th uncertainty bounds. Please note that the average probabilities of the two sectors do not sum to 100% due to the significant probability of vent opening in the underwater portion of the caldera (25 ± 5% probability).
Because of such relevant discrepancies, separated vent opening probability maps conditional on the on-land portions of the western and eastern sectors of the caldera have been produced. It is worth mentioning that the cells partially on-land had probability values reduced in proportion to their sea covered portion. The Figures 3c,d show the mean values of such probability density distributions with respect to the epistemic uncertainty effects. The Monte Carlo algorithm for PDC hazard mapping has also been modified to produce separated maps under the condition of a PDC originating from a vent located in one of the two sectors of the caldera. This is obtained considering the specific PDC areal extent distribution of that sector, as shown in Figures 3a,b.
The averaged hazard maps obtained for vents opening in the two separate caldera sectors are displayed in Figures 4a,b, respectively. The former (Figure 4a) concerns the western sector and displays a mean PDC invasion probability equal or above 5% in the western half of the caldera, i.e., from Capo Miseno in the south to the outside the caldera boundary to the north-west. Instead, the latter (Figure 4b) shows a mean PDC invasion probability above 5% on almost the whole caldera, with a ~20% mean probability of having a PDC overcoming Posillipo Hill, and ~30% mean probability of PDC invasion outside of the caldera boundary to the north. Peaks of probability are also remarkably different between the two cases, i.e., ~35% in Figure 4a, ~75% in Figure 4b. A new global map is also obtained combining these two hazard assessments. The new PDC invasion average probability map and its 5th and 95th percentiles bounds are reported in Figure 4c. Such maps account for the significant different PDC scales generated in the two different sectors of the caldera and therefore represent a first attempt to correlate the event size with the caldera sector.
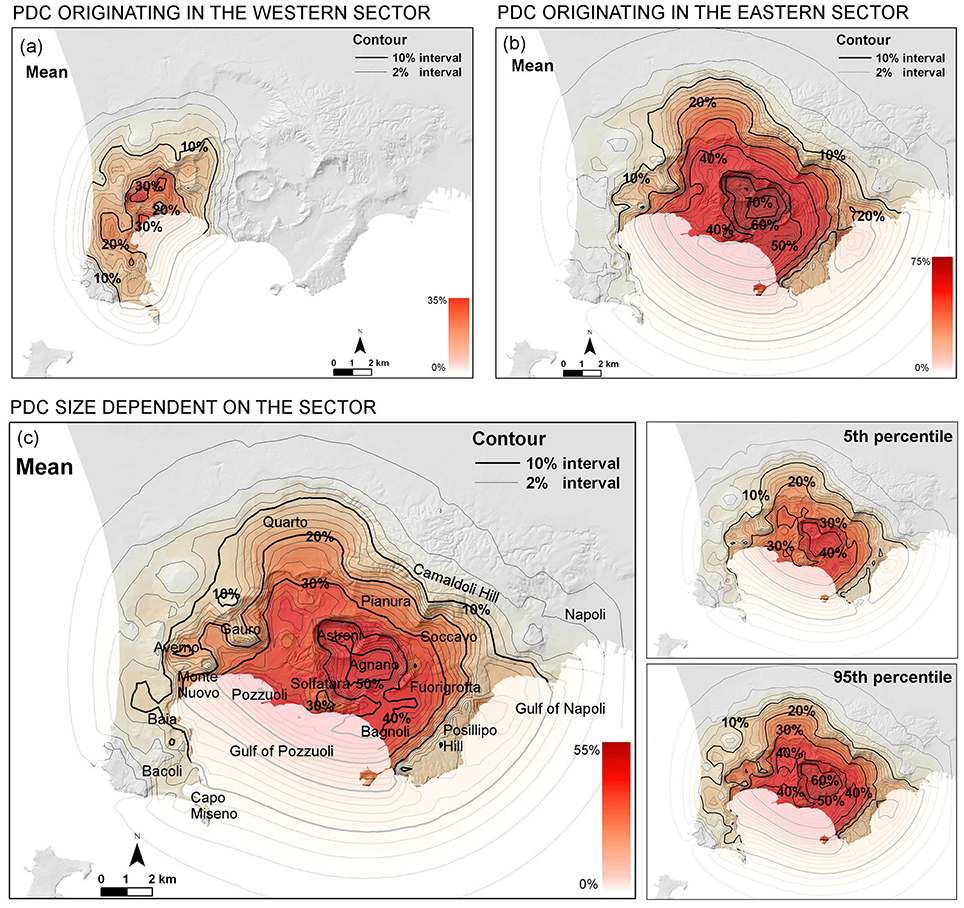
Figure 4. PDC invasion hazard maps based on the areal size distributions and vent opening probability maps displayed in Figure 3. Contours and colors indicate the mean percentage probability of PDC invasion conditional on the occurrence of an explosive event—(a) originating on-land in the western sector, (b) originating on-land in the eastern sector, (c) originating on-land according to the vent opening map in Figure 2, but with the PDC invasion area distribution depending on the sector of the vent location. The two maps on the right of the average map (c) show the 5th and 95th uncertainty percentiles of the distribution by using the same color scales.
From the comparison of the new results with the reference map shown in Figure 2d (Neri et al., 2015) obtained with the same parameters, a significant shift of the higher probability values toward east is observable. The probability peak changes from ~50% to ~55%, and the area with a PDC invasion probability higher above 10% is relevantly reduced to the west. The new map also displays an increased chance of a PDC overcoming the caldera boundary toward the city of Napoli, above 18%, compared to the ~15% previously estimated without introducing the correlation between PDC size and vent location. The effects of the different scales for the eastern and western sectors are considered in all the analyses presented in the following sections.
Conditional Maps for Specific PDC Scales and Vent Locations
Several more PDC hazard maps are obtained under more specific assumptions such as a specific PDC scale and vent location. These maps may result useful in case specific hazard scenarios need to be investigated during emergency and for mitigation purposes.
Some maps refer to a specific scenario represented, in this study, by the occurrence of PDC of a given invasion area. Under such assumption, the Monte Carlo simulation procedure above described is much simplified. Indeed the same eruptive scenario is replicated for each possible vent location. The Figures 5a,b shows two examples, assuming PDC invasion areas respectively equal to 60th and 95th percentiles of the areal distributions shown in Figure 3b. The first percentile implies invaded area extents of ~9 ± 5 km2 in the western sector and ~39 ± 11 km2 in the eastern sector, the second of ~34 ± 9 km2 and ~169 ± 18 km2, respectively, in the western and eastern sectors. Uncertainty is slightly skewed on the higher values. It is significant to note that the first map resembles much the mean reference map (Figure 2d) which includes all the possible PDC scales. The second map delineates instead a more impacting scenario, with ~45% probability of having a PDC overcoming Posillipo Hill. Figures 5c,d show PDC invasion hazard maps assuming PDC areal extent up to the assumed percentiles of 60% and 95% detailed above.
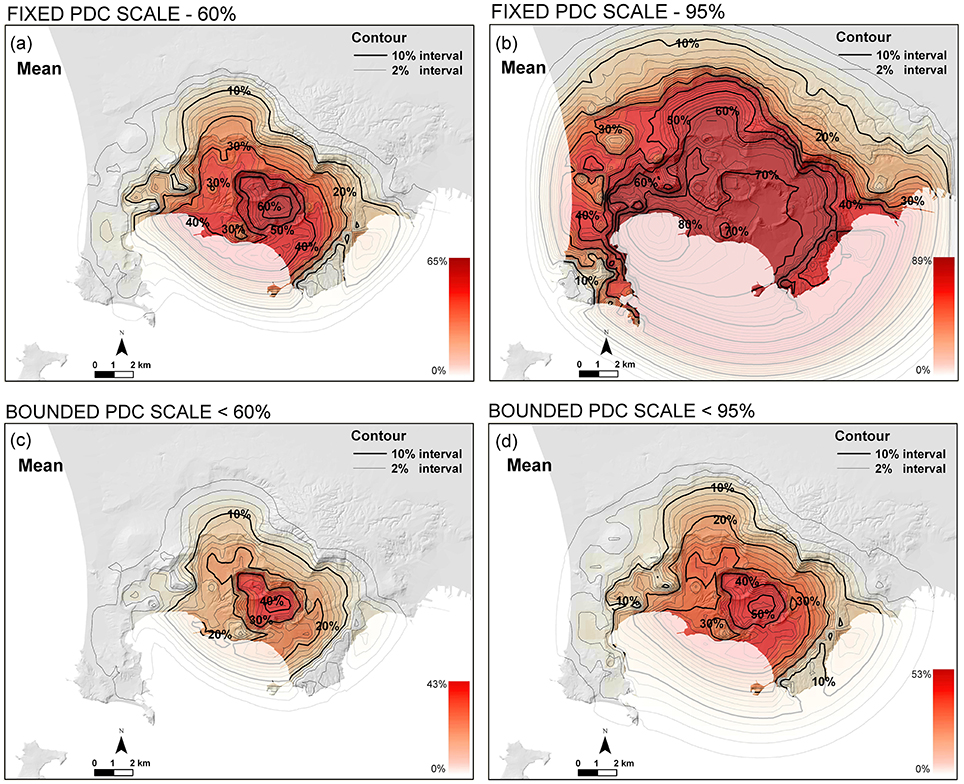
Figure 5. (a,b) Mean PDC invasion hazard maps produced by assuming PDC invasion areas corresponding to the 60% (a), and 95% (b), respectively, of the distributions reported in Figure 3b. The two maps assume the vent opening probability displayed in Figures 3c,d for the two sectors of the caldera. Contours and colors indicate the mean percentage probability of PDC invasion conditional on the occurrence of an explosive event of that size, originating on-land. (c,d) PDC invasion hazard maps assuming PDC areal extent up to the assumed percentiles of the Figure 3b distributions, i.e., 60% in (a), 95% in (b), and the vent opening maps displayed in that figure. Contours and colors indicate the mean percentage probability of PDC invasion conditional on the occurrence of an explosive event of at most that size, originating on-land.
A conditional version of the vent opening map has also been developed. This version enables us to restrict the eruptive vent sampling inside a limited subset of the caldera and to produce PDC invasion hazard maps under such condition. In Figure 6 four examples of the average hazard assessments assuming a PDC originating in a specific zone of the caldera are displayed. The boundary of the vent opening zones is delineated by a yellow dashed line. The zones definition is based on the caldera partition of Bevilacqua et al. (2015). In particular the examples concern the zones of Astroni (a) and Agnano (b) inside the eastern sector, Averno (c) in the western, and also the central-eastern zone of the caldera (d), in which is estimated to concentrate about one third of the total probability of vent opening (see Bevilacqua et al., 2015). Both maps (a) and (b) overcome 90% PDC invasion mean probabilities in some regions. From the maps it is notable that an event originating from the Agnano area has about three times more chance to overcome Posillipo Hill than one originating from the Astroni area. In contrast, the area subject to significant PDC invasion hazard is much reduced when assuming a PDC originating from the Averno area. This is mostly the consequence of the lower eruption size associated with events in the western sector. Finally, the PDC invasion hazard map for a flow originating in the central-eastern portion of the caldera shows a high peak probability above 80% in its center, and also a mean probability above 10% of overcoming Posillipo Hill.
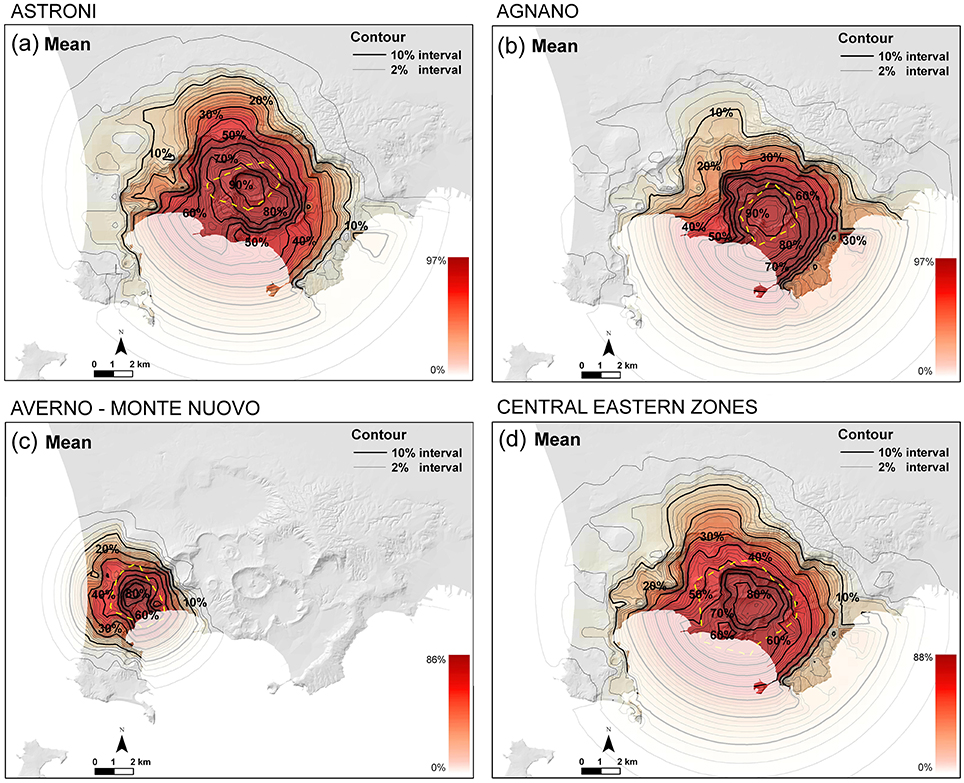
Figure 6. PDC invasion hazard map based on the vent opening map displayed in Figure 2a and the areal size distributions in Figure 3b, with the additional condition of the vent to be inside specific areas of the caldera. (a) Astroni, (b) Agnano, (c) Averno—Monte Nuovo, (d) central-eastern zones. Contours and colors indicate the mean percentage probability of PDC invasion conditional on the occurrence of an explosive event on-land.
Effects of Temporal Assessments on the Maps
The probability estimates adopted here for the time of the next eruptive event are based on the assumption that the future eruptive activity is similar to that of the three epochs of activity in the last 15 kyr. In other words, they are valid under the assumption that the volcano entered, after the last Monte Nuovo A.D. 1538 eruption, a new epoch of activity similar to the previous ones. According to the temporal assessments based on Cox-Hawkes processes, the mean time between eruptions for the eastern sector is ~133 years, while for the western sector it is ~473 years. This implies that mean time between eruptions in any sector of the caldera is ~118 years. These average estimates are significantly affected by epistemic uncertainty, [–25%, +55%]. More details on these estimates are reported in Bevilacqua et al. (2016).
As mentioned above, to account for the self-exciting sequences of multiple events it is necessary to run the Cox-Hawkes model during the Monte Carlo simulation, assuming the maximum likelihood parameters reported in the above mentioned study (i.e., base return time, self-excitement duration, mean offspring). This also allows the inclusion of epistemic uncertainty effects in the hazard assessments. See also (Cox and Isham, 1980; Bevilacqua, 2016) for additional details on the Cox-type stochastic processes.
The PDC hazard maps in this section also assume different event scales for the flows that originate from the western and eastern sectors of the caldera, like in the previously described maps. In addition, separate temporal models are assumed for the western and eastern sectors of the caldera. Very similar results (not reported here for the sake of brevity) are obtained assuming instead a unique temporal model for the whole caldera and assigning the vent locations relying only on the spatial data displayed in Figures 2a, 3c,d. It is important to notice here that all the previously presented maps are conditional on the occurrence of a new explosive event, i.e., no temporal assessments have been included before this section.
In Figure 7 the mean, the 5th and the 95th percentiles bounds of the PDC invasion probability for the first event potentially occurring in the next 10 years are presented. The maximum values of PDC invasion probability, expressed as 5th percentile, mean and 95th percentile values, are [2.5–5.5–8.0%] and are located in the central-eastern part of the caldera. The probability values across Posillipo Hill reach [0.5–2.0–3.5%]. Probability values above 1% cover the entire caldera, and they are over 2% on the most of it. Similarly, in Figure 8 the mean, the 5th and the 95th percentiles bounds of the PDC invasion probability in the next 50 years are displayed, including the possibility of multiple events in this time period. The peak values in the Agnano plain are around [16–25%–32%], while the probability tern of overcoming Posillipo Hill is [5–10–16%]. PDC invasion probability values above 5% cover almost the whole caldera and include also a significant part of the center of Napoli. The hazard values on 50 years are about five times larger than those on 10 years, because of the relatively longer time interval.
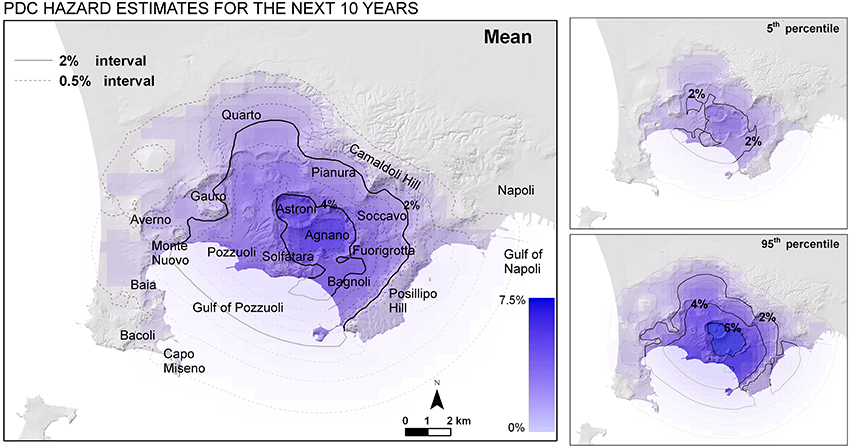
Figure 7. Temporal PDC invasion hazard map based on the vent opening map and the areal size distributions displayed in Figure 3, and temporal estimates assuming that in A.D. 1538 the volcano entered a new eruptive epoch. Contours and colors indicate the mean percentage probability of PDC invasion in the next 10 years—this excludes the possibility of a sequence of multiple events in this time period. In the small boxes are included the 5th (top) and 95th (bottom) uncertainty bounds of the PDC invasion probability.
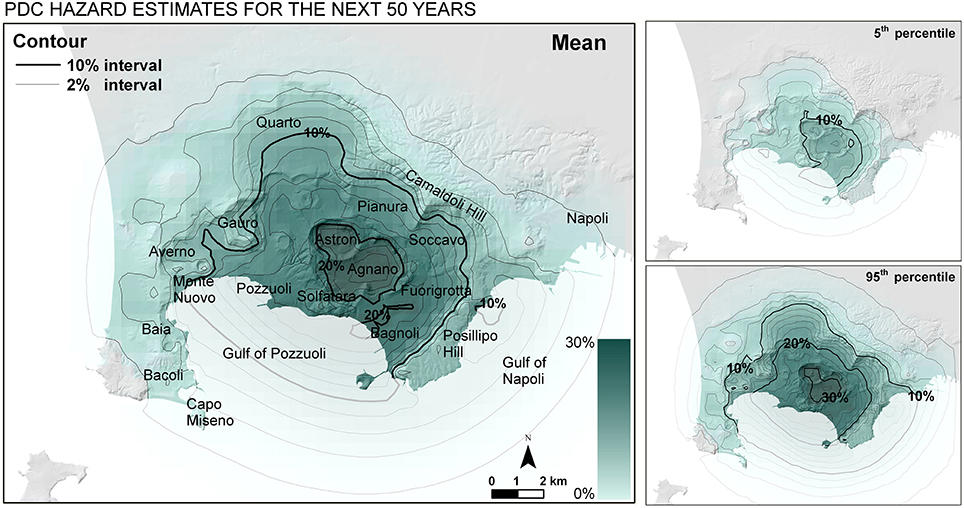
Figure 8. Temporal PDC invasion hazard map based on the vent opening map and the areal size distributions displayed in Figure 3, and temporal estimates assuming that in A.D. 1538 the volcano entered a new eruptive epoch. Contours and colors indicate the mean percentage probability of PDC invasion in the next 50 years—this includes the possibility of a sequence of multiple events in this time period. In the small boxes are included the 5th (top) and 95th (bottom) uncertainty bounds of the PDC invasion probability.
It is worth remarking that, for short time windows (i.e., T ≤ 10 years), the hazard assessments assuming no more than a single PDC occurring in the given time frame are indistinguishable from the ones not excluding a sequence of multiple events in the same period. For longer time windows (i.e., T ≥ 50 years) they are instead different, with the differences becoming larger with the increase of the duration of the time period. Both types of maps have been produced for T = 50 years, showing a ~2% decrease of the PDC invasion probability over the entire area, when just a single event is considered. In addition, when the time length T increases, the PDC hazard map concerning the first event tends to the conditional map in Figure 2d. In contrast, the map assuming a potential sequence of multiple PDC can reach remarkably higher levels of hazard for time periods over 100 years. For example, a PDC invasion hazard map for T = 250 years shows a ~78% PDC invasion probability peak and >40% probability of a PDC overcoming Posillipo Hill.
The assumption that the volcano entered a new eruptive epoch obviously has a significant effect on the results shown so far. Indeed the inclusion of the periods of quiescence between the eruptive epochs in the analysis reduces significantly the hazard estimates. A first estimate of the hazard associated to this assumption is here attempted. Under this hypothesis, based on the above described temporal model, the mean time between eruptions (not considering differences between the caldera sectors) was estimated of ~346 years, with the epistemic uncertainty effect reduced in this case to about ±15% on this average value, because of the longer relative duration of the record considered.
In Figure 9 the mean PDC invasion hazard concerning the next 10 and 50 years is displayed according to this alternative temporal assumption. Maximum percentage value of PDC invasion probability is 1.5 and 7.5% in the next 10 and 50 years, respectively, always located in the central-eastern part of the caldera. The invasion probability behind the Posillipo Hill reaches 0.5 and 2.5%, respectively. It is significant to note that these levels of hazard are about three to four times lower than those obtained under the assumption that the volcano entered a new eruptive epoch after the A.D. 1538 Monte Nuovo eruption.
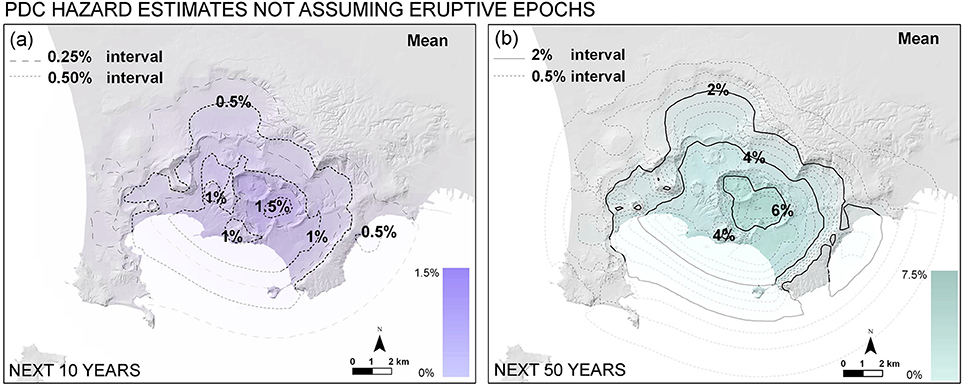
Figure 9. Temporal PDC invasion hazard map based on the vent opening map and the areal size distributions displayed in Figure 3, and temporal estimates without assuming that the volcano entered a new eruptive epoch. In (a,b) contours and colors indicate the mean percentage probability of PDC invasion in the next 10 and 50 years, respectively. In (b) we included the possibility of a sequence of multiple events in the period considered.
It is worth mentioning that if the total duration of the eruption record is divided by the total number of eruptions, the obtained average time between past events is of 204 years, with an uncertainty of about ±7%. If a number of additional not-recorded events are considered (as estimated in Bevilacqua et al., 2015; Bevilacqua, 2016), the average time between past eruptions is reduced of ~13%, to ~177 years. This simplistic approach, which is not capable of modeling any clustering feature, produces intermediate time estimates to those based on the Cox-Hawkes process after the two alternative assumptions described (i.e., ~118 years or ~346 years, respectively).
Concluding Remarks
In this study new long-term (or background) PDC invasion hazard maps have been produced for the CF caldera. To this aim, the spatial distribution of vent opening probability (from Bevilacqua et al., 2015), the density distribution of PDC invasion areas (from Neri et al., 2015), and, for the first time, a sub-domain specific temporal model for the eruption time-space pattern (from Bevilacqua et al., 2016) were combined together. In particular, they were convolved through an articulated Monte Carlo simulation procedure which relied on the box model approximation for the PDC propagation (Neri et al., 2015; Bevilacqua, 2016; Esposti Ongaro et al., 2016). The application of a doubly stochastic approach (Bevilacqua, 2016) enabled us to quantify the effects of some epistemic uncertainty sources affecting the hazard assessments presented. The main results obtained from the study are the following:
• Separate analysis of the eruptive record in the western and eastern sectors of the CF caldera showed remarkable differences in terms of event scale and eruption frequency. Such differences were considered for the first time in the generation of PDC invasion hazard maps. This effect produces a significant shift of the higher probability values toward east, with an increase of the peak probability of ~5% and an increase of ~3% of the chance a PDC could overcome the caldera boundary toward the city of Napoli. In contrast, the hazard levels are significantly reduced on the western sector of the caldera.
• The effects of specific conditions on PDC size on the hazard mapping were explored. Major differences exist between a map generated by considering all the scales up to a given PDC invasion area, with respect to a map generated assuming that specific PDC invasion area (i.e., conditional to the occurrence of a PDC of a given size). For instance, a map for a large scale event (i.e., using the 95th percentile of the areal distributions as computed on the last 15 kyr in the western and eastern sectors, see Figure 3b) delineated ~45% probability of having a PDC overcoming Posillipo Hill (Figure 5b), against ~15% computed assuming PDC invasion area up to the 95th percentile (Figure 5d). Similar major differences between the maps generated under the two assumptions exist also in terms of peak probability of PDC invasion, which increase of ~20% in the case of fixed scale.
• Similarly, the effect of assuming the vent limited to specific caldera zones was investigated. The resulting maps illustrated the major effect associated to this variable. The hazard maps are indeed strongly affected by the source region chosen. For instance, an event originating from the Agnano zone has about three times more chance to overcome Posillipo Hill than one originating from the Astroni zone (see Figure 6). The map obtained by assuming the vent in the Astroni-Agnano-La Solfatara zones showed that PDCs are able to affect large part of the caldera with peak invasion probability up to 80% in the central area. In contrast, the area subject to significant PDC invasion probability is strongly reduced when assuming a PDC originating from the Averno zone, also due to the different PDC scale adopted for the western sector of the caldera.
• The adoption of a temporal model for CF eruption sequence also enabled us to produce PDC invasion hazard maps for specific forecasting time windows. These maps were produced by assuming that, since the last eruption in A.D. 1538, the volcano entered a new epoch of activity. In particular maps with forecasting periods of 10 and 50 years were produced, considering also the effect of a sequence of multiple events in the given time frame. The outcomes showed that the entire caldera has a mean hazard of flow invasion above 1% in the next 10 years and above 5% in the next 50 years. Most exposed area of the caldera (i.e., Agnano-Astroni) reaches average hazard values above 5.5% in the next 10 years and ~25% in the next 50 years. Hazard values up to 2% in the next 10 years and up to ~10% in the next 50 years were also computed in some areas over Posillipo Hill.
• Preliminary PDC invasion hazard estimates were also produced without the assumption that the volcano entered a new epoch of activity since its last eruption. In this case, the hazard estimates are about three to four times lower than the first ones, but still very significant. Although the debate between the possibility of being within a new eruptive epoch or not is still fully open, the two hazard assessments made should be regarded as end-member cases potentially delimiting the real condition of the volcano.
The generation of first PDC invasion hazard maps at CF able to explicitly consider the temporal framework and key features of the system (such as specific event scales, vent locations and dependencies of eruption scale and frequency on the caldera sectors), including some sources of uncertainty, is an important step for developing appropriate risk assessments and mitigation measures. The separate mapping of the caldera sectors/zones has relevant implications for the emergency management, in particular if the monitoring data will enable reasonable constraints on the vent opening site. The further understanding of the processes controlling the transition between periods of quiescence and epochs of activity of the volcano appears to be the next challenging quest. Additional research aimed at improving the knowledge of past eruption record, as well as the structural evolution and current dynamics of the volcanic system seem fundamental for further improving the volcanic hazard assessment in this highly urbanized area.
Author Contributions
AB developed the mathematical methodology and implemented the numerical codes, wrote the manuscript text and produced the figures. All the authors participated with their ideas in the development of the study and gave a contribution in the internal revision of the manuscript. AN contributed to focus and improve the clarity of the geophysical modeling and hazard assessment aspects of the study, and made a line-by-line review of the manuscript, improving the clarity of the science. MB contributed in the development and refinement of the maps with the GIS. FF participated in the development of the mathematical methodology. TE controlled the modeling reliability of the procedure. MR, SV, and RI contributed to the discussion of volcanological implications and scientific coherence of the results in this particular volcanic system.
Conflict of Interest Statement
The authors declare that the research was conducted in the absence of any commercial or financial relationships that could be construed as a potential conflict of interest.
Acknowledgments
Data sets and derived data can be requested to the corresponding author (AN). Additional material and preliminary information on this study can be found in Bevilacqua (2016). This work has been partially developed during the project “V1—Stima della pericolosità vulcanica in termini probabilistici” funded by the Dipartimento della Protezione Civile (Italy). Partial support was also provided by the EU-funded MEDSUV project (grant 308665), by the COST Action Expert Judgement Network (IS1304) and by the Hazard SEES project, NSF (award 1521855). The contribution and support of ideas of many colleagues participating to the above projects are acknowledged. The manuscript does not necessarily represent official views and policies of the Dipartimento della Protezione Civile.
References
Alberico, I., Lirer, L., Petrosino, P., and Scandone, R. (2002). A methodology for the evaluation of long-term volcanic risk from pyroclastic flows in Campi Flegrei (Italy). J. Volcanol. Geother. Res. 116, 63–78. doi: 10.1016/S0377-0273(02)00211-1
Alberico, I., Petrosino, P., and Lirer, L. (2011). Volcanic hazard and risk assessment in a multi-source volcanic area: the example of Napoli city (Southern Italy). Nat. Hazard. Earth Syst. 11, 1057–1070. doi: 10.5194/nhess-11-1057-2011
Aspinall, W. P. (2006). “Structured elicitation of expert judgment for probabilistic hazard and risk assessment in volcanic eruptions,” in Statistics in Volcanology, eds H. M. Mader, S. G. Coles, C. B. Connor, and L. J. Connor (London, UK: Geological Society of London on behalf of IAVCEI), 15–30.
Baxter, P. J., Boyd, R., Cole, P., Neri, A., Spence, R., and Zuccaro, G. (2005). The impacts of pyroclastic surges on buildings at the eruption of the Soufriére Hills Volcano, Montserrat. Bull. Volcanol. 67, 292–313. doi: 10.1007/s00445-004-0365-7
Bayarri, M. J., Berger, J. O., Calder, E. S., Dalbey, K., Lunagomez, S., Patra, A. K., et al. (2009). Using statistical and computer models to quantify volcanic hazards. Technometrics 51, 402–413. doi: 10.1198/TECH.2009.08018
Bayarri, M. J., Berger, J. O., Calder, E. S., Patra, A. K., Pitman, E. B., Spiller, E. T., et al. (2015). Probabilistic quantification of hazards: a methodology using small ensembles of physics-based simulations and statistical surrogates. Int. J. Uncertain Quantif. 5, 297–325. doi: 10.1615/Int.J.UncertaintyQuantification.2015011451
Bebbington, M. S. (2010). Trends and clustering in the onsets of volcanic eruptions. J. Geophys. Res. 115:B01203. doi: 10.1029/2009JB006581
Bebbington, M. S. (2013). Models for temporal volcanic hazard. Stat. Volcanol. 1, 1–24. doi: 10.5038/2163-338X.1.1
Bebbington, M. S., and Cronin, S. J. (2011). Spatio-temporal hazard estimation in the Auckland Volcanic Field, New Zealand, with a new vent-order model. Bull. Volcanol. 73, 55–72. doi: 10.1007/s00445-010-0403-6
Bevilacqua, A. (2016). Doubly Stochastic Models for Volcanic Hazard Assessment at Campi Flegrei Caldera. Pisa: Theses, 21, Edizioni della Normale, Birkhäuser/Springer.
Bevilacqua, A., Bursik, M., Patra, A., Pitman, E. B., and Till, R. (2017). Bayesian construction of a long-term vent opening probability map in the Long Valley volcanic region (CA, USA). Stat. Volcanol. 3, 1–36. doi: 10.5038/2163-338X.3.1
Bevilacqua, A., Flandoli, F., Neri, A., Isaia, R., and Vitale, S. (2016). Temporal models for the episodic volcanism of Campi Flegrei caldera (Italy) with uncertainty quantification. J. Geophys. Res. 121, 7821–7845. doi: 10.1002/2016JB013171
Bevilacqua, A., Isaia, R., Neri, A., Vitale, S., Aspinall, W. P., Bisson, M., et al. (2015). Quantifying volcanic hazard at Campi Flegrei caldera (Italy) with uncertainty assessment: I. Vent opening maps. J. Geophys. Res. 120, 2309–2329. doi: 10.1002/2014JB011775
Calais, E., d'Oreye, N., Albaric, J., Deschamps, A., Delvaux, D., Déverchère, J., et al. (2008). Strain accommodation by slow slip and dyking in a youthful continental rift, East Africa. Nature 456, 783–788. doi: 10.1038/nature07478
Chiodini, G., Caliro, S., De Martino, P., Avino, R., and Ghepardi, F. (2012). Early signals of new volcanic unrest at Campi Flegrei caldera? Insights from geochemical data and physical simulations. Geology 40, 943–946. doi: 10.1130/G33251.1
Chiodini, G., Paonita, A., Aiuppa, A., Costa, A., Caliro, S., De Martino, P., et al. (2016). Magmas near the critical degassing pressure drive volcanic unrest towards a critical state. Nat. Commun. 7:13712. doi: 10.1038/ncomms13712
Connor, C. B., and Hill, B. E. (1995), Three nonhomogeneous Poisson models for the probability of basaltic volcanism: apllication to the Yucca Mountain region, Nevada. J. Geophys. Res. 100, 10107–10125. doi: 10.1029/95JB01055
Connor, C. B., Stamatakos, J. A., Ferrill, D. A., Hill, B. E., Ofoegbu, G. I., Conwey, F. M., et al. (2000). Geologic factors controlling patterns of small-volume basaltic volcanism: application to a volcanic hazards assessment at Yucca Mountain, Nevada. J. Geophys. Res. 105, 417–432. doi: 10.1029/1999JB900353
Cooke, R. M. (1991). Experts in Uncertainty: Opinion and Subjective Probability in Science. New York, NY: Oxford University Press.
Dade, W. B., and Huppert, H. E. (1996). Emplacement of the Taupo ignimbrite by a dilute turbulent flow. Nature 381, 509–512. doi: 10.1038/381509a0
De Natale, G., Troise, C., Mark, D., Mormone, A., Piochi, M., Di Vito, M. A., et al. (2016). The Campi Flegrei Deep Drilling Project (CFDDP): New insight on caldera structure, evolution and hazard implications for the Naples area (Southern Italy). Geochem. Geophys. Geosyst. 17, 4836–4847. doi: 10.1002/2015GC006183
Di Renzo, V., Arienzo, I., Civetta, L., D'Antonio, M., Tonarini, S., Di Vito, M. A., et al. (2011). The magmatic feeding system of the Campi Flegrei caldera: architecture and temporal evolution. Chem. Geol. 281, 227–241. doi: 10.1016/j.chemgeo.2010.12.010
Di Vito, A., Acocella, V., Aiello, G., Barra, D., Battaglia, M., Carandente, A., et al. (2016). Magma transfer at Campi Flegrei caldera (Italy) before the 1538 AD eruption. Sci. Rep. 6:32245. doi: 10.1038/srep32245
Di Vito, M. A., Isaia, R., Orsi, G., Southon, J., De Vita, S., D'Antonio, M., et al. (1999). Volcanism and deformation since 12,000 years at the Campi Flegrei caldera (Italy). J. Volcanol. Geother. Res. 91, 221–246. doi: 10.1016/S0377-0273(99)00037-2
Esposti Ongaro, T., Cavazzoni, C., Erbacci, G., Neri, A., and Salvetti, M. V. (2007). A parallel multiphase flow code for the 3D simulation of volcanic explosive eruptions. Parallel Comput. 33, 541–560 doi: 10.1016/j.parco.2007.04.003
Esposti Ongaro, T., Marianelli, P., Todesco, M., Neri, A., Cavazzoni, C., and Erbacci, G. (2008). Mappe Tematiche, Geo-Referenziate e Digitali, delle Principali Azioni Pericolose Associate alle Colate Piroclastiche del Vesuvio e dei Campi Flegrei Derivanti dalle nuove Simulazioni 3D, Prodotto D2.3.5, Progetto SPEED. Italian: Istituto Nazionale di Geofisica e Vulcanologia (INGV).
Esposti Ongaro, T., Orsucci, S., and Cornolti, F. (2016). A fast, calibrated model for pyroclastic density currents kinematics and hazard. J. Volcanol. Geother. Res. 327, 257–272. doi: 10.1016/j.jvolgeores.2016.08.002
Flandoli, F., Giorgi, E., Aspinall, W. P., and Neri, A. (2011). Comparison of a new expert elicitation model with the Classical Model, equal weights and single experts, using a cross-validation technique. Reliab. Eng. Syst. Saf. 96, 1292–1311. doi: 10.1016/j.ress.2011.05.012
Gaffney, E. S., Damjanac, B., and Valentine, G. A. (2007). Localization of volcanic activity: 2. Effects of pre-existing structure. Earth Planet Sci. Lett. 263, 323–338. doi: 10.1016/j.epsl.2007.09.002
Guidoboni, E., and Ciuccarelli, C. (2011). The Campi Flegrei caldera: historical revision and new data on seismic crises, bradyseisms, the Monte Nuovo eruption and ensuing earthquakes (twelfth century 1582 AD). Bull. Volcanol. 73, 655–677. doi: 10.1007/s00445-010-0430-3
Hallworth, M. A., Hogg, A. J., and Huppert, H. E. (1998). Effects of external flow on compositional and particle gravity currents. J. Fluid Mech. 359, 109–142. doi: 10.1017/S0022112097008409
Hsu, K. J. (1975). Catastrophic debris streams (sturzstroms) generated by rockfalls. Geol. Soc. Am. Bull. 86, 129–140. doi: 10.1130/0016-7606(1975)86<129:CDSSGB>2.0.CO;2
Huppert, H. E., and Simpson, J. E. (1980). The slumping of gravity currents. J. Fluid Mech. 99, 785–799. doi: 10.1017/S0022112080000894
Isaia, R., D'Antonio, M., Dell'Erba, F., Di Vito, M., and Orsi, G. (2004). The Astroni volcano: the only example of closely spaced eruptions in the same vent area during the recent history of Campi Flegrei caldera (Italy). J. Volcanol. Geother. Res. 133, 171–192. doi: 10.1016/S0377-0273(03)00397-4
Isaia, R., Marianelli, P., and Sbrana, A. (2009). Caldera unrest prior to intense volcanism in Campi Flegrei (Italy) at 4.0 ka B.P.: implications for caldera dynamics and future eruptive scenarios. Geophys. Res. Lett. 36:L21303. doi: 10.1029/2009GL040513
Isaia, R., Vitale, S., Di Giuseppe, M. G., Iannuzzi, E., Tramparulo, F. D. A., and Troiano, A. (2015). Stratigraphy, structure and volcano-tectonic evolution of Solfatara maar-diatreme (Campi Flegrei, Italy). Geol. Soc. Am. Bull. 127, 1485–1504. doi: 10.1130/B31183.1
Jaquet, O., Connor, C. B., and Connor, L. (2008). Probabilistic methodology for long-term assessment of volcanic hazards. Nuclear Technol. 163, 180–189. doi: 10.13182/NT08-A3980
Jaquet, O., and Carniel, R. (2006). “Estimation of volcanic hazards using geostatistical models,” in Statistics in Volcanology, eds H. M. Mader, S. G. Coles, C. B. Connor, and L. J. Connor (London, UK: Geological Society of London on behalf of IAVCEI), 89–104.
Jaquet, O., Low, S., Martinelli, B., Dietrich, V., and Gilby, D. (2000). Estimation of volcanic hazards based on Cox stochastic processes. Phys. Chem. Earth 25, 571–579. doi: 10.1016/S1464-1895(00)00087-9
Le Corvec, N., Menand, T., and Lindsay, J. (2013). Interaction of ascending magma with pre-existing crustal fractures in monogenetic basaltic volcanism: an experimental approach. J. Geophys. Res. 118, 968–984. doi: 10.1002/jgrb.50142
Lirer, L., Petrosino, P., and Alberico, I. (2001). Hazard assessment at volcanic fields: the Campi Flegrei case history. J. Volcanol. Geother. Res. 112, 53–74. doi: 10.1016/S0377-0273(01)00234-7
Malin, M. C., and Sheridan, M. F. (1982). Computer-assisted mapping of pyroclastic surges. Science 217, 637–640. doi: 10.1126/science.217.4560.637
Martì, J., and Felpeto, A. (2010). Methodology for the computation of volcanic susceptibility: an example for mafic and felsic eruptions on Tenerife (Canary Islands). J. Volcanol. Geother. Res. 195, 69–77. doi: 10.1016/j.jvolgeores.2010.06.008
Marzocchi, W., and Bebbington, M. S. (2012). Probabilistic eruption forecasting at short and long time scales. Bull. Volcanol. 74, 1777–1805. doi: 10.1007/s00445-012-0633-x
Marzocchi, W., and Woo, G. (2009). Principles of volcanic risk metrics: theory and the case study of Mount Vesuvius and Campi Flegrei, Italy. J. Geophys. Res. 114:B032113. doi: 10.1029/2008JB005908
Mazzarini, F., Le Corvec, N., Isola, I., and Favalli, M. (2016), Volcanic field elongation, vent distribution, and tectonic evolution of a continental rift: the Main Ethiopian Rift example. Geosphere 12:15. doi: 10.1130/GES01193.1
Neri, A., Bevilacqua, A., Esposti Ongaro, T., Isaia, R., Aspinall, W. P., Bisson, M., et al. (2015). Quantifying volcanic hazard at Campi Flegrei caldera (Italy) with uncertainty assessment: II. Pyroclastic density current invasion maps. J. Geophys. Res. 120, 2330–2349. doi: 10.1002/2014JB011776
Neri, A., Esposti Ongaro, T., Voight, B., and Widiwijayanti, C. (2014). “Chapter 5: Pyroclastic density current hazards and risk,” in Volcanic Hazards, Risks and Disasters, eds P. Papale and J. Schroder (London, UK: Elsevier), 109–140.
Orsi, G., Di Vito, M. A., and Isaia, R. (2004). Volcanic hazard assessment at the restless Campi Flegrei caldera. Bull. Volcanol. 66, 514–530. doi: 10.1007/s00445-003-0336-4
Rosi, M., Sbrana, A., and Principe, C. (1983). The Phlegrean Fields: structural evolution, volcanic history and eruptive mechanisms. J. Volcanol. Geother. Res. 17, 273–288. doi: 10.1016/0377-0273(83)90072-0
Rossano, S., Mastrolorenzo, G., and De Natale, G. (2004). Numerical simulation of pyroclastic density currents on Campi Flegrei topography: a tool for statistical hazard estimation. J. Volcanol. Geother. Res. 132, 1–14. doi: 10.1016/S0377-0273(03)00384-6
Rougier, J. C., Sparks, R. S. J., and Hill, L. J. (eds). (2013). Risk and Uncertainty Assessment for Natural Hazards. Cambridge: Cambridge University Press.
Scandone, R., Bellucci, F., Lirer, L., and Rolandi, G. (1991). The structure of the Campanian Plain and the activity of the Neapolitan volcanoes (Italy). J. Volcanol. Geother. Res. 48, 1–31. doi: 10.1016/0377-0273(91)90030-4
Smith, V. C., Isaia, R., and Pearce, N. J. G. (2011). Tephrostratigraphy and glass compositions of post-15 ka Campi Flegrei eruptions: implications for eruption history and chronostratigraphic markers. Q. Sci. Rev. 30, 3638–3660. doi: 10.1016/j.quascirev.2011.07.012
Sparks, R. S. J., and Aspinall, W. A. (2004), “Volcanic activity: Frontiers and challenges in forecasting, prediction risk assessment,” in The State of the Planet: Frontiers and Challenges in Geophysics, Geophysical Monograph 150, IUGG Vol. 19, eds R. S. J. Sparks and C. J. Hawkesworth (Washington, DC: American Geophysical Union), 359–373.
Steinman, L., Spiess, V., and Sacchi, M. (2016), The Campi Flegrei caldera (Italy): formation and evolution in interplay with sea-level variations since the Campanian Ignimbrite eruption at 39 ka. J. Volcanol. Geother. Res. 327, 361–374. doi: 10.1016/j.jvolgeores.2016.09.001
Tadini, A., Bevilacqua, A., Neri, A., Cioni, R., Aspinall, W. P., Bisson, M., et al. (2017). Assessing future vent opening locations at the Somma-Vesuvio volcanic complex: 2. Probability maps of the caldera for a future Plinian/sub-Plinian event with uncertainty quantification. J. Geophys. Res. Solid Earth 112, 4357–4376. doi: 10.1002/2016JB013860
Tierz, P., Sandri, L., Costa, A., Zaccarelli, L., Di Vito, M. A., Sulpizio, R., et al. (2016). Suitability of energy cone for probabilistic volcanic hazard assessment: validation tests at Somma-Vesuvius Campi Flegrei (Italy). Bull. Volcanol. 78, 79. doi: 10.1007/s00445-016-1073-9
Todesco, M., Neri, A., Esposti Ongaro, T., Papale, P., and Rosi, M. (2006). Pyroclastic flow dynamics and hazard in a caldera setting: application to Phlegrean Fields (Italy), Gcube 7, 11. doi: 10.1029/2006GC001314
Vitale, S., and Isaia, R. (2014). Fractures and faults in volcanic rocks (Campi Flegrei, southern Italy): insight into volcano-tectonic processes. Int. J. Earth Sci. 103, 801–819. doi: 10.1007/s00531-013-0979-0
Wadge, G., and Aspinall, W. P. (2014). “A review of volcanic hazard and risk assessments at the Soufriere Hills Volcano, Montserrat from 1997 to 2011,” in The Eruption of Soufriere Hills Volcano, Montserrat from 2000 to 2010, eds G. Wadge, R. E. Robertson, and B. Voight (London: Geological Society), 439–456.
Keywords: hazard mapping, Campi Flegrei, Cox-Hawkes processes, box model, doubly stochastic models, Monte Nuovo, uncertainty quantification, vent opening maps
Citation: Bevilacqua A, Neri A, Bisson M, Esposti Ongaro T, Flandoli F, Isaia R, Rosi M and Vitale S (2017) The Effects of Vent Location, Event Scale, and Time Forecasts on Pyroclastic Density Current Hazard Maps at Campi Flegrei Caldera (Italy). Front. Earth Sci. 5:72. doi: 10.3389/feart.2017.00072
Received: 24 April 2017; Accepted: 23 August 2017;
Published: 12 September 2017.
Edited by:
Mark Naylor, University of Edinburgh, United KingdomReviewed by:
Annalisa Cappello, Istituto Nazionale di Geofisica e Vulcanologia (INGV) Catania, ItalyJoern Lauterjung, Helmholtz-Zentrum Potsdam Deutsches Geoforschungszentrum (GFZ), Germany
Copyright © 2017 Bevilacqua, Neri, Bisson, Esposti Ongaro, Flandoli, Isaia, Rosi and Vitale. This is an open-access article distributed under the terms of the Creative Commons Attribution License (CC BY). The use, distribution or reproduction in other forums is permitted, provided the original author(s) or licensor are credited and that the original publication in this journal is cited, in accordance with accepted academic practice. No use, distribution or reproduction is permitted which does not comply with these terms.
*Correspondence: Augusto Neri, augusto.neri@ingv.it