A Framework for Probabilistic Multi-Hazard Assessment of Rain-Triggered Lahars Using Bayesian Belief Networks
 Pablo Tierz1*†
  Mark J. Woodhouse2
  Jeremy C. Phillips2
  Laura Sandri1
  Jacopo Selva1
  Warner Marzocchi3
  Henry M. Odbert2,4
- 1Istituto Nazionale di Geofisica e Vulcanologia, Sezione di Bologna, Bologna, Italy
- 2School of Earth Sciences, University of Bristol, Bristol, United Kingdom
- 3Istituto Nazionale di Geofisica e Vulcanologia, Sezione di Roma, Rome, Italy
- 4Met Office, Exeter, United Kingdom
Volcanic water-sediment flows, commonly known as lahars, can often pose a higher threat to population and infrastructure than primary volcanic hazardous processes such as tephra fallout and Pyroclastic Density Currents (PDCs). Lahars are volcaniclastic flows of water, volcanic debris and entrained sediments that can travel long distances from their source, causing severe damage by impact and burial. Lahars are frequently triggered by intense or prolonged rainfall occurring after explosive eruptions, and their occurrence depends on numerous factors including the spatio-temporal rainfall characteristics, the spatial distribution and hydraulic properties of the tephra deposit, and the pre- and post-eruption topography. Modeling (and forecasting) such a complex system requires the quantification of aleatory variability in the lahar triggering and propagation. To fulfill this goal, we develop a novel framework for probabilistic hazard assessment of lahars within a multi-hazard environment, based on coupling a versatile probabilistic model for lahar triggering (a Bayesian Belief Network: Multihaz) with a dynamic physical model for lahar propagation (LaharFlow). Multihaz allows us to estimate the probability of lahars of different volumes occurring by merging varied information about regional rainfall, scientific knowledge on lahar triggering mechanisms and, crucially, probabilistic assessment of available pyroclastic material from tephra fallout and PDCs. LaharFlow propagates the aleatory variability modeled by Multihaz into hazard footprints of lahars. We apply our framework to Somma-Vesuvius (Italy) because: (1) the volcano is strongly lahar-prone based on its previous activity, (2) there are many possible source areas for lahars, and (3) there is high density of population nearby. Our results indicate that the size of the eruption preceding the lahar occurrence and the spatial distribution of tephra accumulation have a paramount role in the lahar initiation and potential impact. For instance, lahars with initiation volume ≥105 m3 along the volcano flanks are almost 60% probable to occur after large-sized eruptions (~VEI ≥ 5) but 40% after medium-sized eruptions (~VEI4). Some simulated lahars can propagate for 15 km or reach combined flow depths of 2 m and speeds of 5–10 m/s, even over flat terrain. Probabilistic multi-hazard frameworks like the one presented here can be invaluable for volcanic hazard assessment worldwide.
Introduction
Explosive eruptions can produce volumes of pyroclastic material of up to thousands of cubic kilometers (Newhall and Self, 1982). A substantial proportion of the material erupted during these eruptions is deposited over the areas surrounding the volcano as tephra fallout (e.g., Bursik, 1998) or transported in Pyroclastic Density Currents (PDCs; e.g., Sulpizio et al., 2014). The deposits from tephra fallout typically affect areas of hundreds to thousands of square kilometers, while PDC deposits usually have areal extents of tens to hundreds of square kilometers (e.g., Orsi et al., 2004). This input of fresh loose pyroclastic material into the drainage basins around an erupting volcano alters the hydrogeological equilibrium of the basins, leading commonly to the formation of volcanic water-sediment flows or lahars (Pierson and Major, 2014), which can be considered a cascade effect in response to intense or sustained events of rainfall (Van Westen and Daag, 2005; Pierson et al., 2013). The degree to which the drainage basins are disturbed, and their subsequent hydrogeomorphic response, depend on many different factors (Pierson and Major, 2014) including total tephra volume deposited, grain size distribution of the deposits, changes in the morphology of the catchments, and the type and extent of vegetation damage/loss. Moreover, the rainfall characteristics associated with the climate of the volcano's region have a profound impact on the frequency and volumes of the generated lahars (e.g., Pierson et al., 1992).
The risk associated with the occurrence of lahars can be very high. In the last four centuries, the number of fatalities caused by lahars is second only to PDCs when the largest volcanic disasters are removed from the dataset (Auker et al., 2013). Therefore, quantifying the hazard due to cascading processes, for instance lahars, is crucial to produce complete and robust multi-hazard and multi-risk assessments (e.g., Selva, 2013; Mignan et al., 2014; Liu et al., 2015). Similarly to other volcanic hazards, lahar hazard assessment is affected by deep uncertainties, from the natural variability in the volcanic process and the environmental conditions (aleatory uncertainty) to diverse sources of lack of knowledge (epistemic uncertainty, e.g., Marzocchi et al., 2004; Rougier et al., 2013). These uncertainties can be further increased when chains of multiple hazardous events (e.g., tephra deposition then lahar generation) are considered. In this context, probabilistic approaches addressing and quantifying the uncertainty linked to the volcanic hazard, tend to be preferred by both scientists and decision-makers (e.g., Rougier et al., 2013; Riley et al., 2016).
In the case of rain-triggered lahars, the hazardous event can be divided into two major components: (1) a rainfall event with particular characteristics (rainfall spatial distribution, intensity, duration) acts as the trigger for erosive runoff and/or shallow landsliding on the loose tephra deposits and (2) this generates an initial volume of water-sediment mixture that flows downslope and transforms into a lahar. Hazard analyses of lahars have often focused on one of these two components, either the temporal and/or spatial features of the lahar triggering, or the calculation of the hazard footprints (i.e., inundated areas) of lahars of specified total volumes. For temporal triggering, rainfall Intensity-Duration (I-D) thresholds have been one of the most utilized methods (Tuñgol and Regalado, 1996; Lavigne et al., 2000a; Van Westen and Daag, 2005; Capra et al., 2010). Some studies have improved the classical I-D approach (in which just one line marks the occurrence or not of lahars) to produce probabilistic thresholds by performing logistic regressions on the binary dataset, i.e., event/no event, given an I-D combination (e.g., Frattini et al., 2009), or through Bayesian data analysis (e.g., Berti et al., 2012). Other studies have used several diagnostic triggering variables (e.g., antecedent and total rainfall), in addition to I-D, and have explored their potential use in probabilistic forescasts of lahar occurrence in nearly real time (Jones et al., 2015). For spatial triggering, deterministic physical models of slope stability and/or overland erosion have been employed to delimit the areas that can act as sources of water-sediment flows (e.g., Iverson, 2000; Frattini et al., 2004). Very few of these studies have considered the spatial availability of tephra before the lahar triggering (e.g., Bisson et al., 2007; Volentik et al., 2009). Some probabilistic assessments of the areal susceptibility of such flows have been implemented by exploring the epistemic uncertainty on soil properties (e.g., Frattini et al., 2009) or by coupling the results from deterministic susceptibility models with a probabilistic measure based on the recurrence interval for a specific event of triggering rainfall (e.g., Mead et al., 2016). However, such studies did not merge the lahar triggering with the lahar propagation to compute hazard footprints.
Diverse approaches have been developed to model lahar hazard footprints, including statistical/empirical models (e.g., LAHARZ: Iverson et al., 1998) and two-dimensional shallow-layer continuum models formulated using Coulomb-friction (e.g., Titan2D: Patra et al., 2005), whose potential for extension to describe lahar bulking-debulking (i.e., erosion-sedimentation) during transport has been demonstrated (Fagents and Baloga, 2006; Iverson and George, 2014; Iverson et al., 2015). Typically, one crucial input is the lahar volume either at initiation (if the model incorporates bulking-debulking) or the total lahar volume (if the model does not include this feature). The application of these deterministic models to previous lahar events and specific hazard scenarios has been extensive (e.g., Hubbard et al., 2007; Macías et al., 2008; Procter et al., 2010). However, integration of these models into frameworks for probabilistic assessment of lahar hazard is only just beginning. Recent studies have started to explore the coupling of empirical models (LAHARZ) with Bayesian statistical descriptions (Sandri et al., 2014). Other studies have coupled a physical model for mass-movement susceptibility with simple lahar-propagation models to assess lahar hazard (e.g., Volentik et al., 2009). Nonetheless, the aleatory variability in the temporal and/or spatial triggering of the hazardous event was not described or quantified. Only very recent research has proposed methodologies to couple the spatial-triggering and the flow propagation in a way that could be extended toward probabilistic hazard assessments (Mead et al., 2016; Fan et al., 2017).
In this paper, we address some of the aforementioned limitations and present an integrated framework for probabilistic volcanic multi-hazard assessment, with focus on rain-triggered lahars (Figure 1). Two of the major goals that we pursue through this integrated approach are (1) to create a simple but informative probabilistic model of lahar occurrence and volumes, and (2) to couple this probabilistic model with a lahar simulator in order to propagate the uncertainty in lahar triggering through to the lahar hazard footprints.
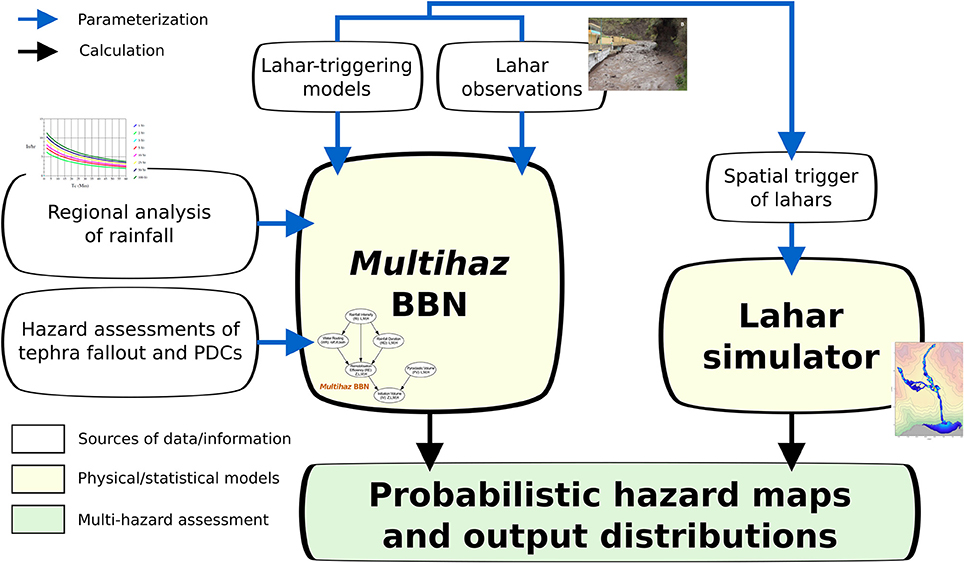
Figure 1. Schematic of our proposed multi-hazard framework in which varied information or data about rainfall characteristics, lahar-triggering mechanisms and availability of fresh tephra is combined quantitatively by a BBN structure (Multihaz, see Figure 2) and also used to set up the initiation points for the simulations of the dynamic lahar model. The Multihaz assessments are then utilized in conjunction with the hazard footprints computed from the lahar simulator to calculate probabilistic hazard maps and discretized output distributions for flow depth and speed of rain-triggered lahars (see text for more details). Graph of regional rainfall and lahar-observation image modified from https://thecriticalflow.wordpress.com and Jones et al. (2015), respectively.
The probabilistic model chosen is a Bayesian Belief Network (BBN, e.g., Koller and Friedman, 2009), a flexible and versatile probabilistic model which allows us to merge information coming from diverse sources (literature data, physical and statistical modeling, probabilistic hazard assessments, see Figure 1) and quantify the aleatory uncertainty linked to the lahar triggering. In particular, we propose a generalizable BBN model (Multihaz) that quantifies the aleatory uncertainty in terms of (i) the pyroclastic volume (from tephra fallout and dense PDCs) stored in different catchments around the volcano; (ii) the rainfall characteristics over the catchments (specifically the intensity and duration); (iii) the response of the catchments to specific conditions of rainfall and pyroclastic volume (in terms of the amount of material that may be remobilized by lahar events); and (iv) lahar initiation volumes for each of the catchments defined over the hazard domain.
In principle, Multihaz can be applied to any volcanic system and coupled with any lahar simulator. In this study, it is coupled with a shallow-water model of lahar dynamics (Woodhouse, in preparation) that incorporates bulking-debulking and permits the calculation of probabilistic hazard footprints of lahars.
As a study case, we present an initial application of our multi-hazard framework to syn-eruptive (defined as in Sulpizio et al., 2006) rain-triggered lahars at Somma-Vesuvius (Italy). We select this volcanic system for three reasons: (1) there are data available to quantify the aleatory uncertainty linked to tephra fallout (e.g., Sandri et al., 2016) and dense PDCs (e.g., Tierz et al., 2014); (2) the volcano has generated syn-eruptive volcaniclastic flows during/after mid-large explosive eruptions (e.g., Rosi et al., 1993; Sulpizio et al., 2006) and is prone to form them at many locations around it (e.g., Bisson et al., 2010, 2014); and (3) the relatively high population density nearby.
In section “The Probabilistic Model: Bayesian Belief Networks,” we briefly describe the basic aspects of BBN models. In section “Multihaz: a BBN Model for Rain-Triggered Lahars,” we detail the variables and structure of Multihaz as well as a core parameterization that could be applicable to any volcano. In section “Coupling Multihaz to a Deterministic Lahar Flow Model,” the procedure of coupling Multihaz with a deterministic lahar model (in our application, LaharFlow, Woodhouse, in preparation) is briefly introduced. In section “Multihaz Applied to Somma-Vesuvius,” we give an outline of the lahar activity at Somma-Vesuvius and report the procedure carried out to parameterize Multihaz at this volcano, with a focus on quantifying the aleatory uncertainty in tephra availability around the volcano (further details about the parameterization of Multihaz and LaharFlow at Somma-Vesuvius are given as Supplementary Material). In section “Probabilistic Volcanic Multi-Hazard Assessment at Somma-Vesuvius,” we show the main results obtained from the probabilistic assessments of Multihaz and the hazard footprints computed from LaharFlow. We pay particular attention to three scenarios of lahar generation, selected to emphasize the impact of the eruption size and the efficiency of tephra remobilization on the probabilistic multi-hazard assessment. In section “Discussion,” our findings are put in the context of previous studies regarding (i) the spatio-temporal triggering of lahars, (ii) lahar hazard assessments worldwide, and (iii) lahar hazard at Somma-Vesuvius. Finally, in section “Conclusions,” we present some concluding remarks and future directions.
The Probabilistic Model: Bayesian Belief Networks
A Bayesian Belief Network (BBN) is a graphical representation of the joint probability distribution of a given set of (random) variables (e.g., Koller and Friedman, 2009), and can be thought of as a combination of a graphical and a probabilistic model (Murphy, 2001). A BBN is a directed acyclic graph composed of nodes, each representing a random variable (usually discretised) of the system being modeled, and arcs, which denote conditional dependences between the variables (Figure 2). A given node is a parent node if it has one or more arcs pointing toward other nodes (which are its children). Note that a node can be both a parent and a child. The BBN is directed because the arcs point from parent to child nodes (unlike Markov networks, for instance, that have undirected arcs) and it is acyclic because Bayesian updating cannot be solved for a cycle of variables that are conditionally dependent on each other. Bayesian updating is based upon the Bayes' theorem, which can be stated as:
where, in the simplest case, A and B are two related events, P(A) denotes the probability of A happening and is commonly known as the prior probability, P(B|A) denotes the probability of B happening given that A has already happened and is commonly known as the likelihood function, P(A|B) denotes the probability of A happening given that B has already happened and is commonly known as the posterior distribution, and P(B) denotes the probability of B happening and acts as a normalizing factor. Bayes' Theorem provides the framework for interpreting joint and marginal probability distributions, for example (a) the probability of rainfall of a specific intensity and a lahar both occurring, or (b) the probability of a lahar occurring given that rainfall of a specific intensity has occurred.
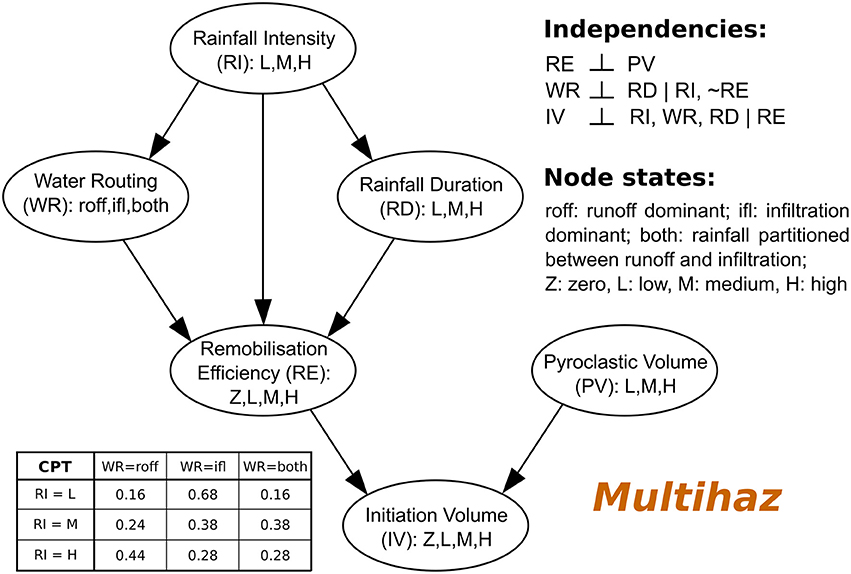
Figure 2. The generalizable probabilistic model proposed in this study: Multihaz. Variables (or nodes) are displayed as ovals while conditional relationships (or arcs) are shown as arrows, with the parent nodes pointing to the child nodes. Abbreviations for the names of the nodes are given in brackets at each node and are used throughout the paper. The abbreviations for the states of each node as well as the independence relationships between nodes that the Multihaz structure implies are reported (“⊥” denotes independence between variables while “~RE” denotes that the RE is not observed). On the bottom left, the Conditional Probability Table (CPT) for the WR node is displayed (see text for more details).
A given BBN structure defines a particular set of unconditional and conditional independences between the variables (nodes) in the network (Koller and Friedman, 2009). This represents one of the main foundations of BBNs: by applying the chain rule of probability calculus, and exploiting the unconditional/conditional independences within the network, the joint probability distribution of the whole model can be calculated at a reduced parametric and computational cost (Koller and Friedman, 2009). For example, let us consider a joint distribution of three variables A, B and C each having three states (e.g., B1, B2, B3). The joint distribution, P(A,B,C), can be calculated as: P(A,B,C) = P(C|B,A) × P(B|A) × P(A), and it contains 33 = 27 probability values. However, if we can build a BBN like A → B → C (the arrows indicate the arcs), then C is independent of A given B, i.e., (C ⊥ A | B), and the joint distribution becomes P(A,B,C) = P(C|B) x P(B|A) x P(A), which contains 9 + 9 + 3 = 21 probability values (or parameters in the BBN; see next paragraph). This reduction in the number of parameters gets more important as the number of nodes, and states within them, increase. Moreover, the reduction speeds up the Bayesian updating that the BBN performs when new evidence is introduced into it (e.g., Murphy, 2001).
A BBN (made of discretised nodes) is parameterized through prior tables and conditional probability tables (CPTs). If a node has no parents, then it is parameterized through a prior table, which has as many parameters as the number of states within the node and expresses the discrete probability density function (PDF) of the node. When a node has one or more parents, it is parameterized through a CPT (Figure 2), that has as many parameters as the product of the number of states of the child and all the parent nodes (e.g., in the example above, P(C|B) would have a CPT with 3 × 3 = 9 parameters). The CPT is a discrete representation of the conditional PDF between the child node and its parents, and indicates the probability of each state of the child node, given one state (or a combination of states) from its parent node(s) (Figure 2).
Second-order independencies can be introduced in a BBN by means of the parameterization of its CPTs. Let us consider another simple BBN with the following structure: D → E ← F, and two states per node. According to the BBN structure, the variable E is dependent on both D and F (its parents). However, if the CPT of E is set in a way that P(E = E1 | D = D1, F = F1) = P(E = E1 | D = D1, F = F2) = 0, then it is seen that E is independent of F given D1, i.e., (E ⊥ F | D = D1). This independence is only a consequence of the way we parameterize the CPT and it is unrelated to the BBN structure (e.g., Koller and Friedman, 2009).
The high modularity of BBNs is increasingly advantageous as the complexity of the probabilistic model grows. For instance, let us assume that the variable D in the example above can be modeled in a more precise way by introducing two new variables (X,Y) that act as parents of node D. The BBN previously described would need to be expanded to include these two new nodes but the only part of the model that we would need to re-parameterize is the CPT of node D; that is P(D|X,Y). In contrast, the CPT of node E would remain unchanged because the distribution P(E|D,F) only depends on the specific states of D and F and not on their relative probabilities (which in the case of node D, now depend on nodes X and Y).
Two software tools are used to implement the BBNs presented in this paper: the online free-version of Netica© (Norsys, 1995-2015) and the Bayes Net Toolbox for MATLAB, created by Murphy (2001) and, in our case, applied using MATLAB (2012).
Multihaz: A BBN Model for Rain-Triggered Lahars
The volcanological and climatological inputs for a BBN for lahar generation can vary significantly from one volcano to another (Chinen, 1986; Pierson et al., 1992; Pierson and Major, 2014). Our approach here is to create a general-purpose BBN (Multihaz), with nodes discretised into qualitative states (e.g., low, medium, high), that can be applied to any volcano. The variables modeled by Multihaz, the network structure and the abbreviations used for each variable are shown in Figure 2 and Table 1. The prior tables and CPTs of Multihaz can be parameterized to satisfy the specific characteristics of a given volcano. For instance, we expect the probability of high-intensity rainfalls to be greater at volcanoes located in areas of tropical (wet) climate compared to those located in areas of temperate (commonly drier) climate. Other CPTs are parameterized to describe the general physical processes for rainfall-triggering of lahars (see Figure 3 and Table 2) and are thus applicable to different volcanoes. We parameterize these CPTs as follows: first we compile information (data and evidential reasoning) from lahar and debris-flows observations and physical and statistical models from the literature (Table 2) and then we translate this information into probabilities in the CPTs. In order to reduce the number of degrees of freedom in these probabilities, we adopt a five-fold classification of likelihood following the structure proposed by the Intergovernmental Panel for Climate Change in 2007 (Table 3; Le Treut et al., 2007). We use central measures of each range in probability and normalize these values to ensure that the states in the nodes are mutually exclusive and exhaustive.
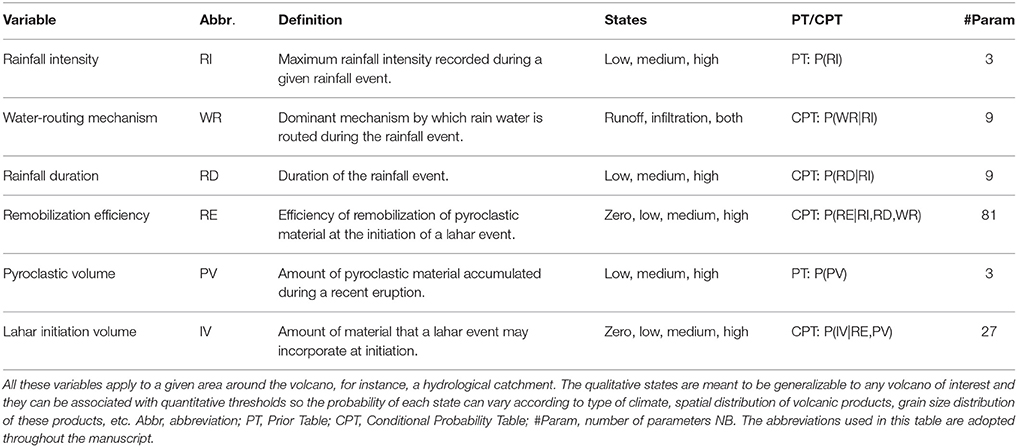
Table 1. Physical variables included in the Bayesian Belief Network (BBN) model Multihaz.
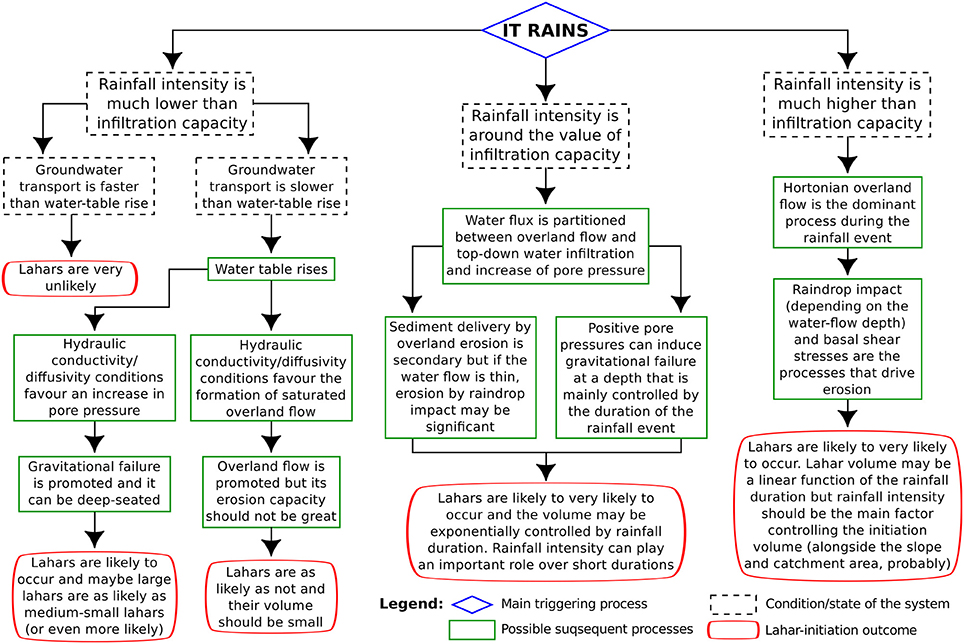
Figure 3. Schematic of the reasoning about the physical processes associated with the triggering of lahars by means of rainfall utilized to construct our BBN model: Multihaz (see Figure 2 and Table 1). Together with Table 2, this reasoning defines the structure and parameterization of Multihaz (see text for more details).
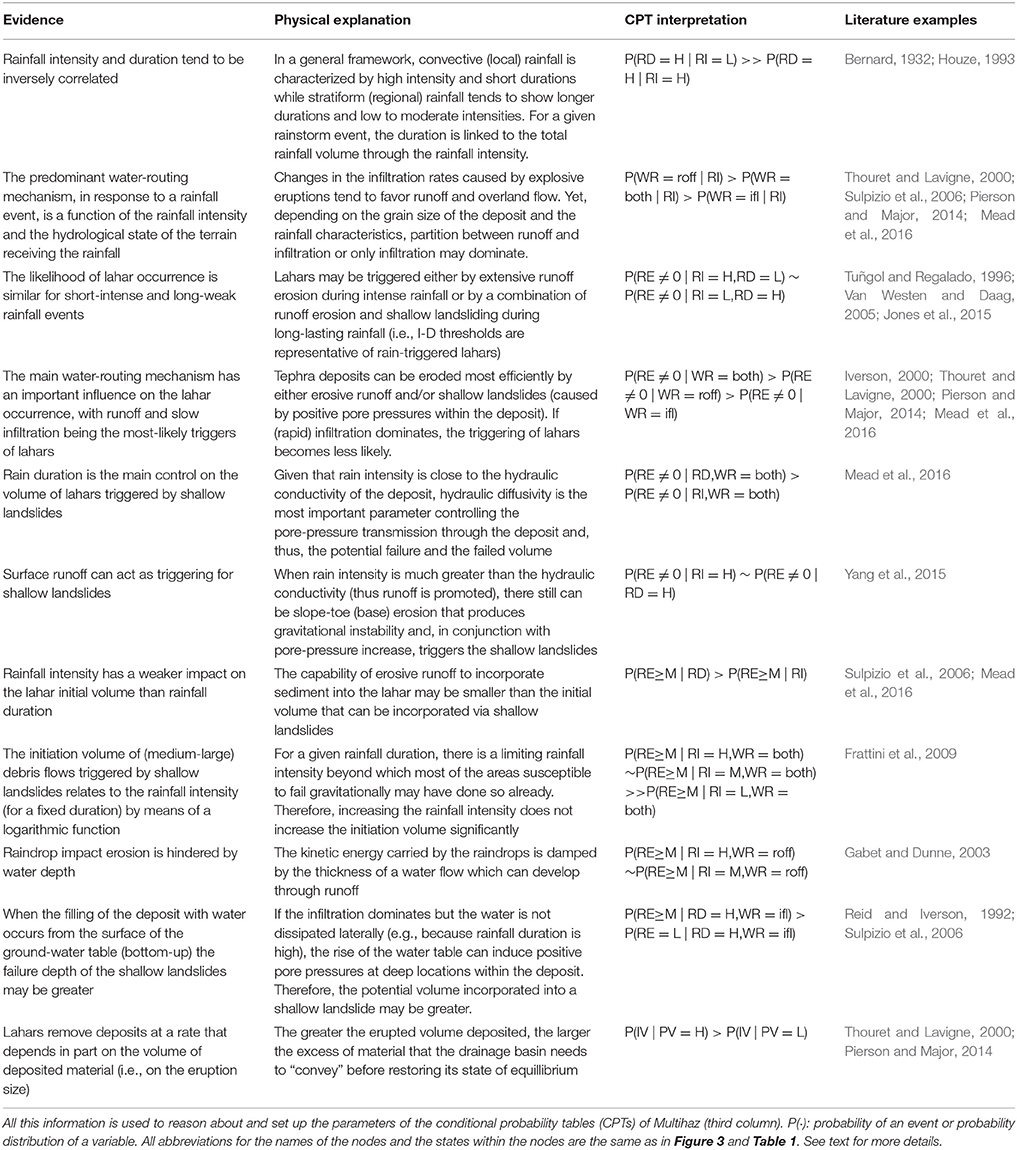
Table 2. Summary of all the strands of evidence (first column), and their physical explanation (second column), collected from literature related to rain-triggered of lahars.
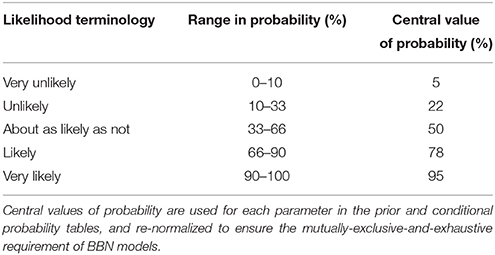
Table 3. Five-fold classification of likelihood adopted for the parameterization of Multihaz (after Le Treut et al., 2007).
The Multihaz structure does not include antecedent rainfall conditions. This choice is made to keep the parameterization as simple as possible, given that rainfall intensity and duration are typically considered more informative for the likelihood of rain-triggered lahars (e.g., Tuñgol and Regalado, 1996; Jones et al., 2015; Mead et al., 2016). Moreover, the conditional links between remobilization efficiency and antecedent rainfall are not yet fully understood; antecedent rainfall is commonly considered to increase the likelihood of lahars or debris flows (e.g., Frattini et al., 2009; Jones et al., 2015), but other physical processes such as “hydro-repellency” have been proposed to decrease the likelihood of lahars when antecedent rainfall is high (e.g., Capra et al., 2010).
Aleatory Uncertainty in Rainfall Intensity and Pyroclastic Volume
The only two nodes in Multihaz that have no parents are RI and PV (Figure 2). Although they are defined in terms of qualitative states, they can also be described in a quantitative way by defining thresholds that characterize their states (see section “Multihaz applied to Somma-Vesuvius” and Supplementary Material). These thresholds can be general but the probabilities for each state within the node need to be set according to the volcano studied and the potential variability of RI and PV. As mentioned above, the rainfall regime can change significantly depending on regional climate (e.g., Pierson et al., 1992). Similarly, the spatial distribution and total amount of pyroclastic material available at the different catchments surrounding the volcano will depend on factors, such as (a) aleatory variability in eruption behavior: eruption column height, grain size distribution, PDC volume and mobility; (b) aleatory variability in wind vector at different altitudes; (c) topography of the volcano and surrounding terrain. We quantify all these aspects in our application for Somma-Vesuvius in section “Multihaz Applied to Somma-Vesuvius” and Supplementary Material.
Physical Insights into Lahar Triggering and Initiation Volumes
Lahar initiation is described in Multihaz through the parameterization of the CPTs for two nodes: RE and IV (see Figure 2 and Table 1). The former has RI, WR and RD as its parent nodes while both the WR and RD nodes have CPTs derived from their common parent node, RI. Finally, the CPT of the IV node is described as a function of the states of its parent nodes, RE and PV (Figure 2).
The CPTs are parameterized following a general-purpose approach, based on diverse strands of evidence about the physical processes behind the complex interrelationships that exist between the variables modeled by Multihaz. This evidence is extracted from the literature and it is summarized in Table 2. The majority of data is related to the RE node which has the largest CPT within Multihaz (Table 1).
In Figure 4, we show some probabilistic trends that are observed within the CPT of the RE node and confirm that the evidence listed in Table 2 is correctly incorporated into Multihaz. For example, the probability of lahar occurrence, i.e., P(RE > 0), is very similar for long-lasting but low-intensity rainfall events (RI = low, RD = high) and for short-lived but high-intensity rainfall events (RI = high, RD = low), especially when the predominant water-routing mechanism is infiltration or a partition between infiltration and runoff (Figure 4D). The CPT of the RE node also shows the expected behavior when runoff is the dominant water-routing mechanism, with increasing probability of lahars occurring as the rainfall intensity increases (Figure 4D), and the lahars that are initiated are expected to have medium-high volumes of material (Figure 4B; Thouret and Lavigne, 2000; Pierson and Major, 2014). Additionally, the importance of rainfall duration in controlling lahar occurrence and volume when shallow landsliding is the main triggering mechanism (Iverson, 2000; Mead et al., 2016) is observed as peaks in probability in all the graphs (and above all for medium-large remobilization efficiencies) when WR = both and RD = high.
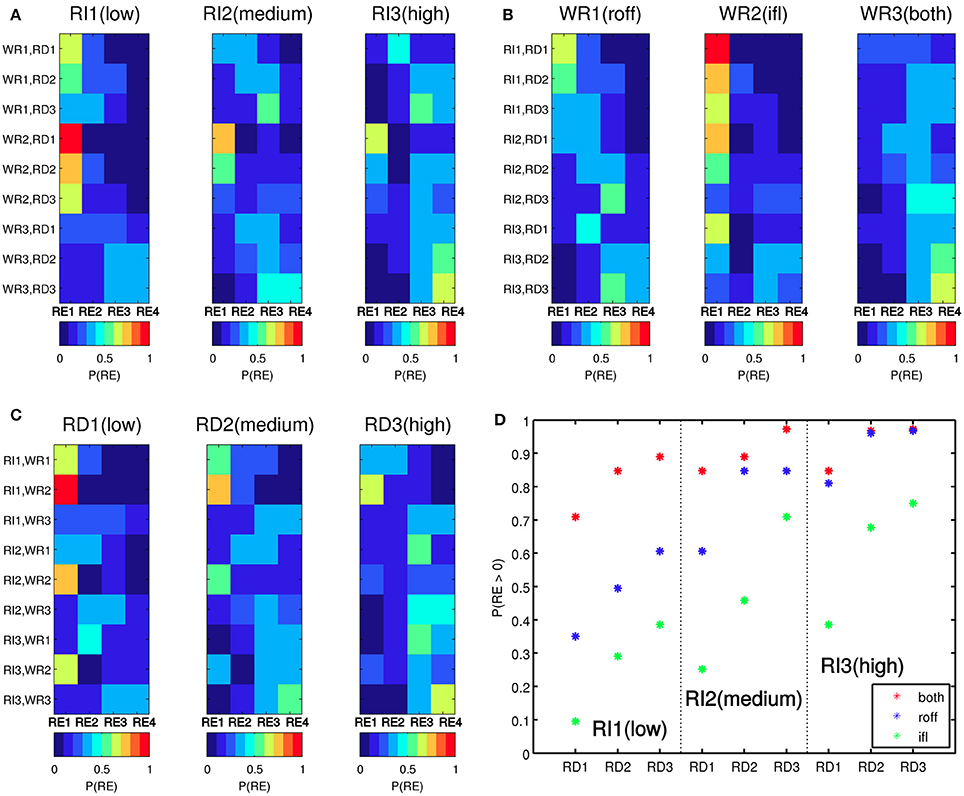
Figure 4. Probabilistic patterns found within the Conditional Probability Table (CPT) of the Remobilization Efficiency (RE) node, arranged according to its parent nodes: rainfall intensity (RI, A), water-routing mechanism (WR, B) and rainfall duration (RD, C). In (D), we show the probability that deposited tephra is remobilized [i.e., P(RE > 0)] for each water-routing mechanism and as a function of the rainfall characteristics (RI and RD). The patterns displayed are in agreement with the scientific knowledge collected about the physical processes responsible for the rainfall triggering of lahars (see Table 2 and text for more details). roff, runoff dominant; ifl, infiltration dominant. RE1, RE2, RE3, RE4 denote the states zero, low, medium, and high, respectively.
The probabilistic patterns included in the CPT of the IV node (derived from the information presented in Table 2) show that the probability of having lahars, especially of medium-large sizes, increases more or less linearly with increasing RE and PV. However, we ensure that the probability of any size of lahars increases considerably when the PV available is relatively high (e.g., Thouret and Lavigne, 2000). Thus, for example, the probability of having medium or large lahars given that PV = high but RE = low is slightly greater than the probability of having such lahars given that PV = low but RE = high. Likewise, the probability of medium-large lahars given that PV = high and RE = medium is higher than the same probability given that PV = medium and RE = high.
Coupling Multihaz to a Deterministic Lahar Flow Model
The Multihaz BBN is a probabilistic model for the volume of pyroclastic material mobilized by rainfall at the initiation of a lahar. To determine the potential spatio-temporal lahar hazard, we must model the transport of the mobilized material away from the lahar source region where it is initiated. By coupling Multihaz to a lahar flow model, the quantified uncertainty in the lahar initiation can be propagated through the lahar flow dynamics to provide a probabilistic “footprint” of the lahar hazard.
To illustrate the coupling of Multihaz to a dynamic lahar model we employ a model called LaharFlow (Woodhouse, in preparation). LaharFlow adopts a shallow-layer formulation, in which the flowing layer is depth-averaged, similarly to many models of earth surface flows. The equations governing the evolution of the lahars are derived from conservation of mass and momentum and are applied on a DEM. The model also includes a description of solids transport, which plays a crucial role in the dynamics, modeled by an equation for the conservation of solids mass. The solid phase is assumed to be transported at the bulk horizontal velocity of the flow, but can settle from the fluid phase and be deposited. Additionally, solids can be entrained into the flow by erosion of the underlying substrate. The erosion and deposition alter the topography, and the morphodynamics is coupled to the flow dynamics in LaharFlow (see Supplementary Material for more details). We note that, in principle, any lahar flow model can be coupled with Multihaz.
The lahar initiation volumes provided by Multihaz serve as intial/boundary conditions for the lahar flow model. As we have adopted discretised states for the IV node of Multihaz, the lahar flow model simulations can be performed deterministically, adopting, for instance, central values of each state of the IV node. The flow model results (hazard footprints) can then be assigned probabilities through application of the BBN model. This allows rapid updating of the hazard assessment when new data are used to initialize or update Multihaz. Further details on the LaharFlow model parameterization and boundary conditions used in our illustrative application to Somma-Vesuvius are given in the Supplementary Material.
Multihaz Applied to Somma-Vesuvius
Somma-Vesuvius, in Southern Italy, is a Pleistocene-Holocene stratovolcano that stands more than 1000 m above the surrounding Campanian Plain, a graben related to the opening of the Tyrrhenian Sea (Scandone et al., 1991; Cioni et al., 2008). The current edifice shows an eruptive history marked by several periods of building and collapse (Cioni et al., 1999, 2008). The remnant of one of those collapses is evidenced by the presence of Mount Somma (Cioni et al., 1999), north of the present cone (Figure 5). The last 20 ka of volcanic activity at Somma-Vesuvius have witnessed highly explosive eruptions (Plinian and sub-Plinian eruptions, e.g., Pompeii and 1631 AD, respectively) as well as periods of mildly-explosive and effusive activity (Cioni et al., 2008, e.g., from 1631 and 1944 AD). Given the current repose time of more than 70 yr, Marzocchi et al. (2004) have postulated that the next eruption at Somma-Vesuvius is likely to be explosive (Volcanic Explosivity Index, Newhall and Self, 1982; VEI ≥ 3) due to the fact that a certain amount of energy will be needed to re-open the now closed volcanic conduit after such repose time.
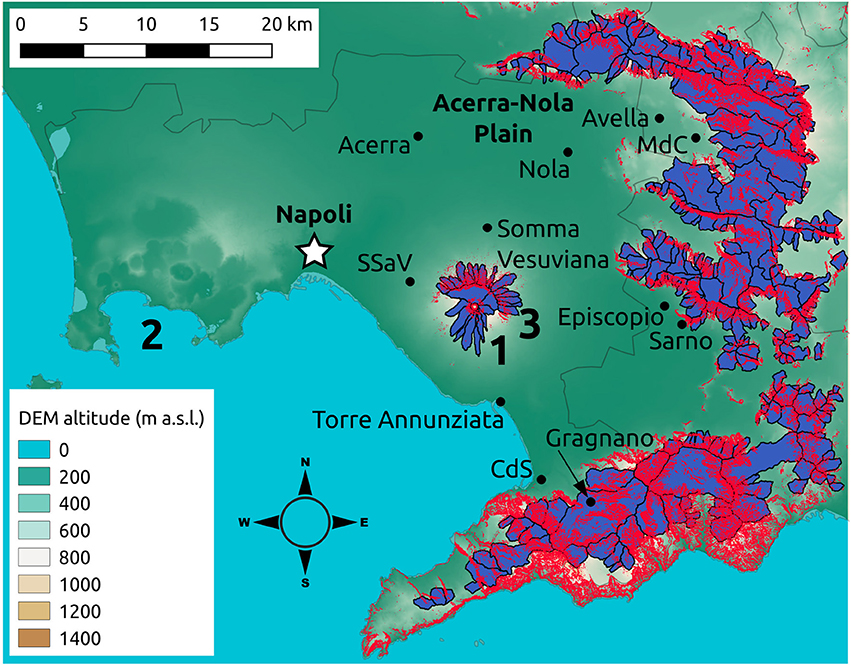
Figure 5. Topographic map of Somma-Vesuvius (1) and surroundings which include the Campi Flegrei caldera (2), the city of Napoli (white star) and many other localities (some of them are reported in the map, see black dots. NB. CdS, Castellammare di Stabia; MdC, Mugnano di Cardinale; SSaV, San Sebastiano al Vesuvio). The catchments identified as having a potential to generate rain-triggered lahars after explosive eruptions at Somma-Vesuvius are shown in blue. Red areas indicate the grid points inside the 20 m-resolution DEM with slope >30°. The horse-shoe shape of Mount Somma (3) is evidenced by grouping of steep-slope points slightly north of the current crater of Somma-Vesuvius. We also indicate the location of the Acerra-Nola Plain, about 15–20 km northwards from the current crater.
At Somma-Vesuvius and surrounding areas, volcaniclastic water-sediment flows, triggered by rainfall, have been common in the past, either as a result of the remobilization of tephra deposits during or immediately after sub-Plinian and Plinian eruptions at the volcano (Rosi et al., 1993; Sulpizio et al., 2006) or during the intervals between such eruptions (Lirer et al., 2001; Fiorillo and Wilson, 2004). An infamous example was the debris flows triggered over the Sarno-Quindici area on 5 May 1998 (e.g., Pareschi et al., 2000; Zanchetta et al., 2004b).
Our analysis focuses on lahars that may be triggered by rainfall in the case of renewal of activity at the volcano. Both tephra fallout and PDCs are likely to happen and they could supply fresh pyroclastic material onto the slopes of the volcanic edifice as well as on the Apenninic reliefs toward the northeast, east and southeast of Somma-Vesuvius (Cioni et al., 1999; Gurioli et al., 2010). In this situation, tephra may be remobilized by erosive runoff of the fine-grained upper-part of the deposit and/or by shallow gravitational failures as the coarser-grained underlying deposit is exposed (Zanchetta et al., 2004a; Sulpizio et al., 2006). This type of shallow landsliding tends to be the consequence of a decrease in the shear strength of the deposit as positive pore pressures occur when rainfall percolates into the tephra layers (Reid and Iverson, 1992; Iverson, 2000; Mead et al., 2016).
We parameterize Multihaz at Somma-Vesuvius by using the general-purpose CPTs for the WR, RD, RE, and IV nodes and initializing volcano-specific prior tables for the RI and PV nodes for 273 hydrological catchments defined over the hazard domain (Figure 5). Our parameterization of the WR node is general-purpose but it is only valid for the fine-grained deposits that may be found in the uppermost part of the pyroclastic stratigraphic sequences from Somma-Vesuvius. The sequences for both tephra-fallout and PDC deposits are commonly topped by fine-rich pyroclastic layers (Cioni et al., 1999; Sulpizio et al., 2006) that have infiltration capacities (~4–40 mm/h; Sulpizio et al., 2006) within the range of the expected rainfall events in the area (AdBCC, 2015). In contrast, the underlying coarse-grained pyroclastic deposits have infiltration capacities (~ 4 · 103 to 4 · 105 mm/h, Favalli et al., 2006; Sulpizio et al., 2006) that can be orders of magnitude above the maximum rainfall intensity expected in the area (e.g., AdBCC, 2015). Therefore, in order to model lahar triggering on such deposits, the CPT of the WR node would need to have very low probability of runoff being the dominant water-routing mechanism, even in the case of high-intensity rains. We contend that this is not the general case at other volcanoes worldwide; there are volcanoes in temperate climates that have had recent eruptions producing much finer-grained deposits (e.g., Mount Saint Helens, USA, Leavesley et al., 1989), and volcanoes located in tropical regions can experience typical rainfall intensities in the order of hundreds of mm/h (e.g., Merapi volcano, Indonesia, Lavigne et al., 2000a; or Mount Pinatubo, Philippines, Van Westen and Daag, 2005).
For the RI node, we collect information on maximum yearly rainfall intensities in the central Campanian region where Somma-Vesuvius is located (AdBCC, 2015) while, in the case of the PV node, we utilize the probabilistic hazard assessment of Sandri et al. (2016) for tephra fallout and develop further the hazard analysis of Tierz et al. (2014) for dense PDCs to quantify the aleatory uncertainty in PV. Details on the procedure to select the hydrological catchments as well as the parameterization of the RI node are given in the Supplementary Material. In section “Tephra-Fallout and PDC-Deposit Volumes,” we describe the parameterization of the PV node that can be accomplished using our methodology.
Tephra-Fallout and PDC-Deposit Volumes
Somma-Vesuvius explosive eruptions capable of producing enough pyroclastic material, dispersed along its flanks and over medial-distal surrounding areas, so as to generate considerable lahar activity, range from violent Strombolian up to sub-Plinian and Plinian eruptions (Cioni et al., 1999, 2008; Sulpizio et al., 2006). The natural variability of these eruptions, in terms of tephra-fallout dispersal and PDC inundation, is quite large (Cioni et al., 2008; Gurioli et al., 2010; Sandri et al., 2016; Tierz et al., 2016a). In this paper, we quantify this aleatory uncertainty in pyroclastic volume over different catchments around Somma-Vesuvius (Figure 5), by computing probabilistic hazard curves (e.g., Rougier et al., 2013) of this variable for tephra fallout and dense PDCs. Our hazard assessment can be expressed as either conditional on the occurrence of a small, medium or large eruption (the sizes defined as in Sandri et al., 2016; Tierz et al., 2016a), or accounting for the aleatory uncertainty in the eruption size (e.g., Sandri et al., 2016).
For tephra fallout, we derive the hazard curves of pyroclastic volume at each catchment from data in Sandri et al. (2016). For dense PDCs, we extend the procedure presented by Tierz et al. (2014) as follows. First, we apply a ratio of 0.5 between the maximum flow depth simulated by Titan2D and the potential thickness of dense PDCs, similarly to findings by Charbonnier and Gertisser (2012) and Ogburn (2015). Secondly, we account for enhanced deposition on low-angle slopes in comparison to high-angle slopes (Doyle et al., 2010; Gurioli et al., 2010) by applying a correction similar to Doyle et al. (2010). However, instead of setting up a slope threshold above which there is no PDC deposition, we use the minimum non-zero value of slope over the study area such that the final thickness is a local-slope-weighted fraction of the initial thickness (the greater the local slope of a point, the smaller the fraction), with
where Hf is the final PDC-deposit thickness estimate, H0 is the thickness estimate after applying the first correction above, δi is the (non-zero) slope at a given point, and min(δ) is the minimum (non-zero) slope in the study area. We note that our PDC modeling is restricted to dense PDCs so, given that dilute PDCs are not simulated, a certain thickness of PDC deposit is expected to be missing from our probabilistic quantification of the PDC volume. Nevertheless, dilute PDCs at Somma-Vesuvius may predominantly invade medial and distal sectors away from the central crater (e.g., Gurioli et al., 2010). These sectors are typically located over the Campanian Plain where conditions that favor lahar generation (e.g., steep slopes) are not likely to be met.
Finally, for those catchments in the proximal areas of Somma-Vesuvius where both tephra-fallout and dense-PDC deposition are expected to occur, we randomly sample the hazard curves of tephra fallout and dense PDCs and sum up the samples to obtain the final quantification of the aleatory uncertainty for the variable PV (i.e., hazard curves of PV). This step assumes that tephra-fallout and PDC propagation are independent, although volumes are correlated through the eruption sizes. Using the hazard curves for PV, we can parameterize the prior table of the node, at each catchment. We set two (general-purpose) thresholds: PV ≤ 104 m3 for PV = low; PV > 106 m3 for PV = high; and 104 < PV ≤ 106 m3 for PV = medium.
Figure 6 shows some examples of the hazard curves of tephra-fallout and dense-PDC volumes at catchments on the flanks of Somma-Vesuvius. We observe quite different curves depending on (a) the location of the catchment with respect to the central crater (we remark that the predominant wind in the area, and therefore the tephra-fallout transport, is generally toward the east) and the topographic barrier of Mount Somma, and (b) the size of the eruption considered. Generally, catchments located beyond Mount Somma (Figures 6A–C) do not experience significant dense-PDC deposition during small eruptions (i.e., pyroclastic volume is < 102 m3). On the central and oriental sectors beyond Mount Somma (Figures 6A,B), greater accumulations of pyroclastic material are expected to occur due primarily to tephra fallout rather than dense PDCs. At the westernmost end of Mount Somma however (Figure 6C), we see that greater pyroclastic volumes can result from dense-PDC deposition rather than from tephra fallout. On the southern flank (Figure 6D), small-size dense PDCs can deposit a substantial amount of pyroclastic volume (even though these volumes are lower than those produced by tephra fallout) and medium and large dense PDCs have the potential to deposit considerably greater amounts of pyroclastic volume in comparison with tephra fallout. We also notice the influence of the eruptions of different sizes on the hazard curves of eruptions of any size. For instance, the hazard curve for dense PDCs of any size in catchment 331 (black dashed line, Figure 6D) shows a step-wise shape. This indicates that (1) small-size eruptions have a high weight (i.e., higher probability of occurrence, Marzocchi et al., 2004; Sandri et al., 2016) in defining the any-size hazard curve since the latter follows the small-size curve over its domain, and (2) the gap between the end of the small-size hazard curve and the values of medium-sized dense PDCs with a exceedance probability far from unity results in the plateau observed in the hazard curve for an eruption of any size (Figure 6D).
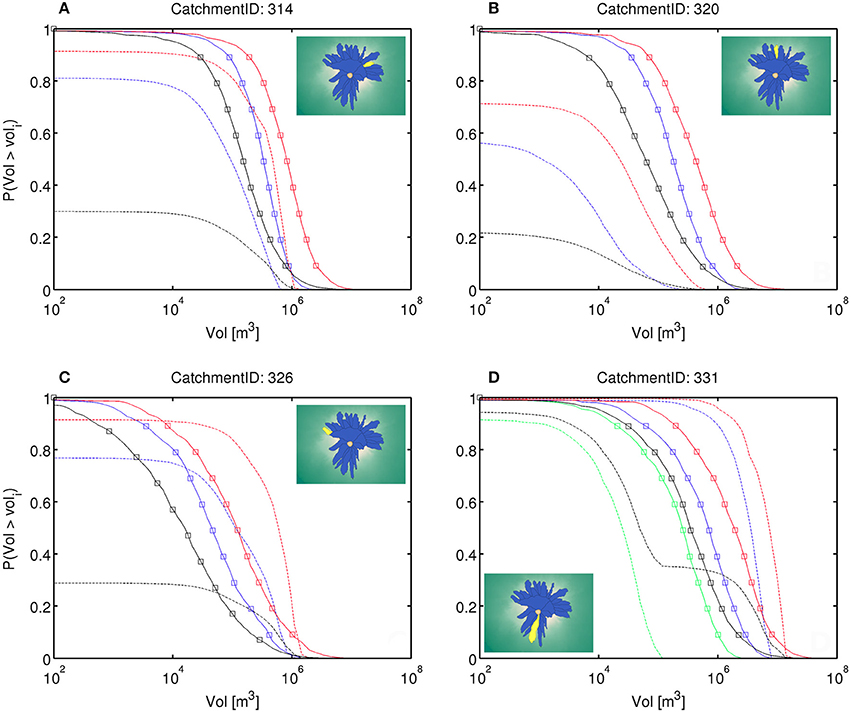
Figure 6. Hazard curves (or Exceedance Probability curves) for the volume of pyroclastic material (Vol), produced by tephra fallout (solid lines with squares) or dense PDCs (dashed lines), at four selected catchments over the flanks of Somma-Vesuvius (Italy): #314 (A), #320 (B), #326 (C), #331 (D). The colors indicate the eruption size: small (green), medium (blue), large (red), and any size (black, see text for more details). The inset maps show the location of the corresponding catchment (in yellow) and the other catchments on the Somma-Vesuvius flanks (in blue). Napoli downtown is located outside the maps, around 10 km toward the WNW.
Probabilistic Volcanic Multi-Hazard Assessment at Somma-Vesuvius
Multihaz Probabilistic Assessments
In Figure 7, we provide an example of the kind of forecast that Multihaz can produce. In particular, we select three medial-distal catchments to highlight the changes in these predictions as a function of (1) the location of the catchment relative to the main dispersion axis for tephra fallout, and (2) the area of the catchment. The selected catchments are: #195 (Figure 7A; area ~2 km2, NNE of the vent), #225 (Figure 7B; area ~ 10 km2, NNE of the vent), and #277 (Figure 7C; area ~2 km2, ENE of the vent). In this example, we show Multihaz models built in the event of a large-size eruption occurring. However, the eruption size has a strong influence on the Multihaz behavior, as we show later in this section for all the catchments and as demonstrated in the previous section for the PV variable over proximal catchments (Figure 6).
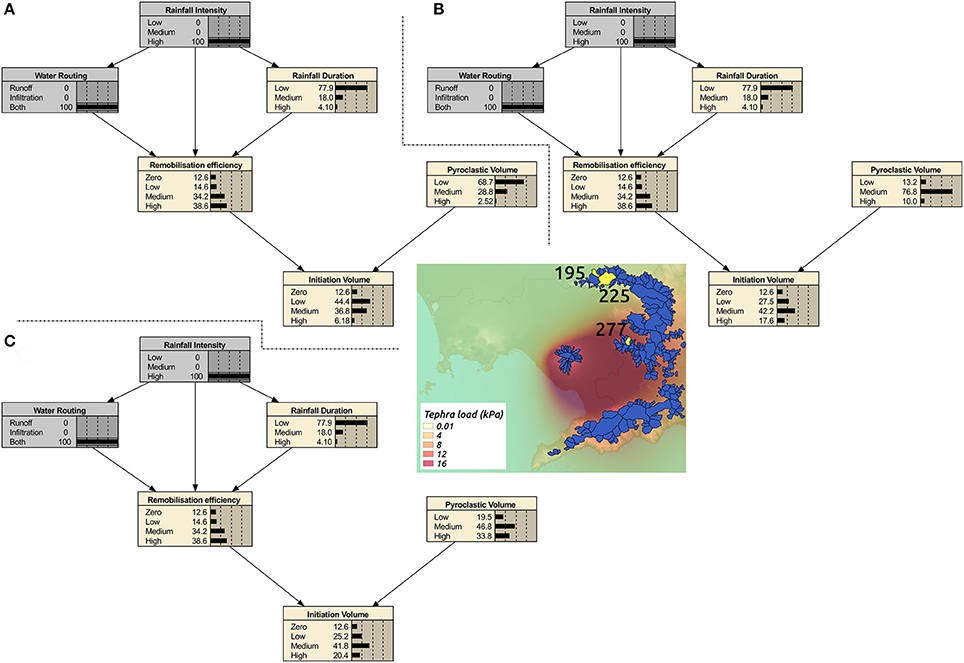
Figure 7. Example of the probabilistic behavior of Multihaz implemented at Somma-Vesuvius (Italy), taking three catchments (#195, A; #225, B; and #277, C) as an example of variability in catchment area and position with respect to the expected maximum accumulation of tephra (see text for more details). All the BBNs are linked to the occurrence of a large eruption and are instantiated on the RI and WR nodes to the states RI = high and WR = both (infiltration and runoff). In the map above, the catchments are highlighted in yellow. In addition, the expected tephra load (median value), given the occurrence of a large eruption, is displayed.
The location of the catchment has a strong role on the potential lahar hazard, as the prevailing wind direction leads to greater tephra-fallout accumulation to the E and SE rather than NNE of Somma-Vesuvius (Figure 7). For example, the probability of large volumes of pyroclastic material being stored in catchment #277 (Figure 7C) is more than 30% higher than this probability at catchment #195 (Figure 7A). The area of the catchment can also be important; if we compare a small catchment situated on the tephra dispersion axis (catchment #277, Figure 7C) with a larger catchment situated further from the dispersion axis, but still downwind from the volcanic vent (catchment #225, Figure 7B), we observe that the probability of PV = low is similar between the two catchments. However, catchment #277, on the tephra dispersion axis, has a probability of PV = high almost 25% higher (Figure 7C), illustrating the importance of location for tephra accumulation in medial-distal catchments.
If we instantiate (i.e., we set one state of the node to be true) the RI node to “high” and the WR node to “both”, we find that the probabilities at the RD and RE nodes mimic each other for all three catchments (Figure 7), since they all share the same parameterization of the CPTs for RD (as determined from regional meteorological behavior and inversely related to RI) and RE (since we have assumed that the tephra properties are consistent across the catchments). However, in terms of initiation volume, we notice that there are important differences in the probability of small-, medium-, and large-sized lahars occurring. In the case of catchments #225 and #277, the differences due to catchment size are offset by the location of the catchments relative to the primary tephra dispersion axis. Nevertheless, we find that the probability of having large lahars is still around 3% greater for the smaller catchment #277 that is located on the on dispersion-axis (Figures 7B,C).
In this study, we parameterize 1092 Multihaz models (273 catchments × 4 eruption sizes that may precede the lahar triggering) that give a wide spectrum of probabilistic hazard assessments for lahars of specific volumes occurring at Somma-Vesuvius. However, exploring all these models (and their coupling with LaharFlow) would be extremely costly in computational terms. We focus our preliminary application of the proposed probabilistic multi-hazard framework on three specific scenarios designed to allow assess the roles of (i) the size of an eruption occurring at Somma-Vesuvius, (ii) the specific value of RE triggering the rainfall lahars, and (iii) the maximum value of IV that a specific catchment can produce, given (i) and (ii). The multi-hazard scenarios are:
• Scenario 1: a large eruption occurs at Somma-Vesuvius and lahars are triggered by means of high remobilization efficiencies (i.e., RE = high).
• Scenario 2: a medium eruption occurs at Somma-Vesuvius and lahars are triggered by means of medium remobilization efficiencies (i.e., RE = medium).
• Scenario 3: an eruption of an unknown size (i.e., any size) occurs at Somma-Vesuvius and lahars are triggered by means of low remobilization efficiencies (i.e., RE = low).
We recall that Multihaz for each catchment shares a common parameterization of the WR, RD, RE, and IV nodes but it has its own parameterization for the RI and PV nodes (see section “Multihaz Applied to Somma-Vesuvius” and Supplementary Material). Figure 8 shows the probabilities for the different states of the IV node, for each of the explored scenarios. To aid in visualizing the results, we divide the catchments into four zones (see Figure 8B): (1) medial-distal catchments (~20–30 km from the vent) toward the SE and E; (2) medial-distal catchments toward the NE; (3) medial catchments (~15–20 km from the vent) toward the E; and (4) proximal catchments (within a radius of about 3–4 km from the vent).
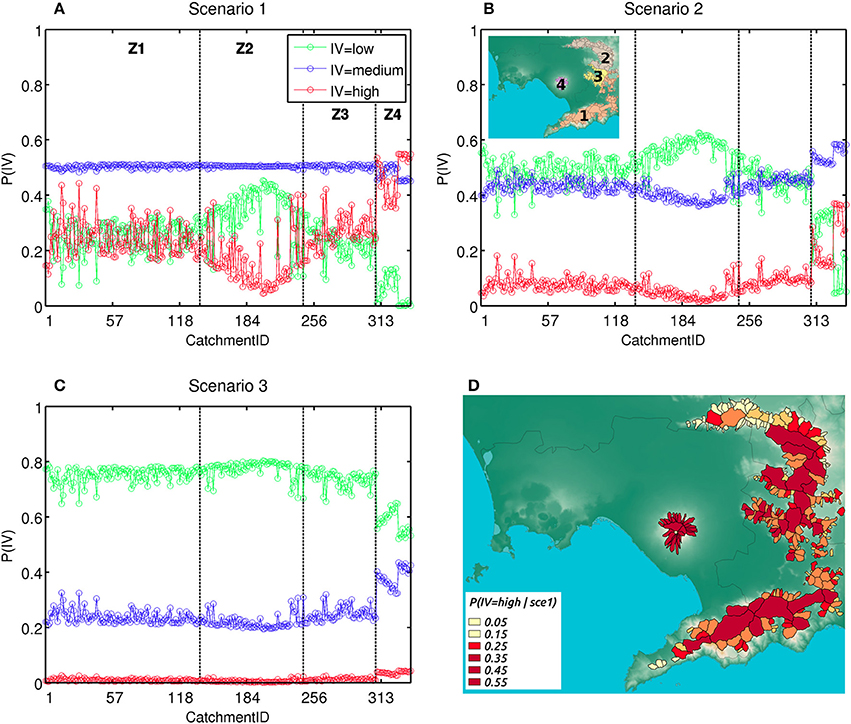
Figure 8. Probability values for the initiation volume (IV) node across all the catchments defined at Somma-Vesuvius (Italy) and surroundings, according to three different scenarios: (A) high remobilization efficiency taking place after a large eruption; (B) medium remobilization efficiency taking place after a medium eruption; and (C) low remobilization efficiency taking place after an eruption of any size. Z1, Z2, Z3, and Z4 are large grouping of catchments (or zones) and their locations are shown in the inset map of (B). Panel (D) displays the probability of large-volume lahars to occur at each catchment along the hazard domain in the event of scenario 1 [i.e., P(IV = high | scenario 1), red line in A]. See text for more details.
Scenario 1 (Figure 8A) is characterized by an almost constant probability for the occurrence of medium-size lahars in each catchment while the probabilities for small and large lahars are both smaller and tend to mirror each other (the states of each node are mutually exclusive and exhaustive, so the sum of their probabilities must be 1, and P(IV = zero | RE ≠ zero) = 0 in our parameterization of Multihaz). In Figure 8D, we display the spatial distribution of P(IV = high) under scenario 1. The northwesternmost catchments of zone 2 have the lowest probabilities of initiating large-volume lahars. In zone 4, however, the probability of small-size lahars is reduced and it is almost zero for the catchments located on the southern flank of Somma-Vesuvius (Figure 8A). In these catchments, IV = high is the most likely state (with probabilities above 50%) under scenario 1 (Figures 8A,D).
Scenario 2 (Figure 8B) is characterized by small and medium lahars having relatively similar probabilities of occurrence in zones 1 and 3. The probability of large lahars increases slightly over zone 3 and more significantly over zone 4, similarly to that observed in scenario 1 (Figures 8A,B). Nonetheless, large lahars are never the most likely outcome in scenario 2.
Scenario 3 is strongly dominated by all catchments having IV = low as their most likely state (Figure 8C). The probability of having medium lahars increases over zone 4 coinciding with a very slight increase in the probability of large lahars, up to 4–5% (Figure 8C). The jump in probability of occurrence for small and medium lahars inside zone 4 marks the separation between the catchments located on the north flank of the volcano, where small lahars are much more likely in scenario 3, and those on the south flank, where small lahars are only slightly more probable than medium lahars (Figure 8C).
Propagation of Aleatory Uncertainty through LaharFlow
The results shown above can be combined with simulations of lahar dynamics to examine the possible impact of such lahars in probabilistic terms. For each of the scenarios, we perform LaharFlow simulations for each of 24 simulation groups each containing multiple lahar sources in a subset of the 273 catchments (see Supplementary Material). We define the hazard domain for each simulation group as a grid of 100 × 100 m of spatial resolution that extends from the source areas of lahars through the areas over which they propagate. The simulations allow us to compute, at each grid point of the hazard domain, three values of lahar flow depth and speed and three values of probability associated with such an event, according to the Multihaz assessments. To do this, we must compute the probability of each source within each simulation group. We assume the sources in each catchment are independent and derive these probability values by multiplying the probability of each catchment to generate the volume of lahars simulated with LaharFlow, given the scenario:
where pi,j is the probability assigned to the hazard footprint computed with LaharFlow for scenario i and simulation group j; Nj is the number of catchments that form the simulation group j; Pk(IVmax|scei) is the probability of the catchment k to trigger lahars with the maximum possible volume for the catchment (IVmax, the volume simulated with LaharFlow), given the scenario i (scei). These Pk values come from the Multihaz model implemented in each catchment and for an eruption of the size indicated by a specific scenario.
The probabilistic independence between the Pk values holds if we assume that: (1) the triggering rainfall is homogeneous over the catchments of the same simulation group, (2) the catchments of the same simulation group are located close enough to each other that changes in available tephra volume (i.e., PV) are only due to the catchment area and not to the spatial distribution of PV, and (3) the spatial distribution of the catchment area does not show any clustering pattern, that is: small and large catchments do not tend to cluster together, spatially. We recognize that some of these assumptions may not hold in some cases. For example, assumption (2) might be reasonable for tephra fallout but it may be questionable for dense PDCs in the presence of topographic barriers, such as Mount Somma. Relaxing these assumptions would require the development of another probabilistic model to assess the dependencies among the Pk values for each simulation group and this is beyond the scope of this paper.
The lahar flows simulated at Somma-Vesuvius and surroundings tend to be channelized following the main (narrow) valleys that descend from their initiation points but there are also cases in which steep short valleys lead to lahars that converge and accumulate material over larger flat areas, like in the area near Sarno. We summarize the observed patterns in lahar propagation in Figure 9. We select four simulation groups, which are characterized by (a) including catchments with large areas, (b) representing one of the zones defined in section “Multihaz Probabilistic Assessments,” and (c) having densely-populated areas nearby. Thus, the simulation groups are the following:
■ Simulation group 3 (Figure 9A) is located in the area of Gragnano in zone 1, in medial sectors toward the SE.
■ Simulation group 19–20 (Figure 9B) is located in the area of Avella in zone 2, in medial-distal sectors toward the NE (NB. Simulation group 19–20 was initially two separate simulation groups (19 and 20) that were combined after preliminary simulations showed that flows could propagate between the simulation groups. To properly model the merging of flows, simulation groups 19 and 20 were combined).
■ Simulation group 22 (Figure 9C) is located in the area of Sarno in zone 3, in medial sectors toward the E.
■ Simulation group 24 (Figure 9D) is located on the flanks of Somma-Vesuvius in zone 4, the most proximal sector (within 3–4 km from the vent).
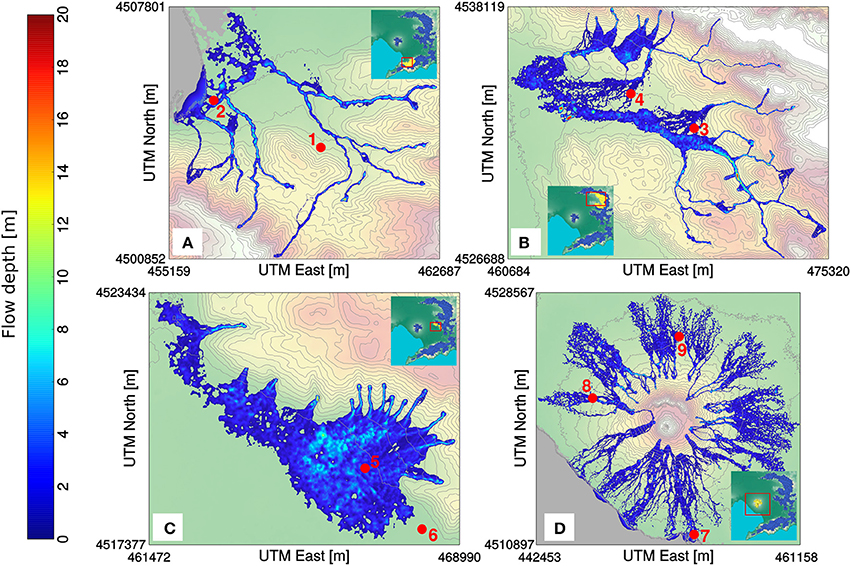
Figure 9. Hazard footprints of flow depth for rain-triggered lahars at four selected locations (simulation groups) on Somma-Vesuvius and surroundings (Italy) computed with the deterministic lahar model LaharFlow. The location of the catchments belonging to each simulation group is given in yellow within the inset of each plot (the red boxes in the insets indicate the limits of each zoomed map): (A) simulation group 03, (B) simulation group 19–20, (C) simulation group 22, (D) simulation group 24. The locations of some villages are given by the red points in the different maps: (1) Gragnano, (2) Castellammare di Stabia, (3) Mugnano di Cardinale, (4) Avella, (5) Episcopio, (6) Sarno, (7) Torre Annunziata, (8) San Sebastiano al Vesuvio, (9) Somma Vesuviana.
The total number of catchments belonging to these four simulation groups is 62, almost one quarter of the total number of catchments (273). In Figure 9, we show the hazard footprints of the maximum flow-depth of lahars computed for scenario 1, for which the most voluminous lahars are produced.
In simulation group 3 (Figure 9A), the flows propagate following the principal valleys of the catchments from SE to NW, primarily, and they spread out after reaching the flat area where Castellammare di Stabia is located. The longest runout of lahars in the simulation group is about 7–8 km (Figure 9A). The maximum values of flow depth tend to be around 10 m while the maximum values of speed are >25 m/s, which are attained close to the initiation of some lahars, but are around 5–10 m/s over the flat lowlands.
In simulation group 19–20 (Figure 9B), the flows propagate following the principal valleys in some cases, especially on the eastern and southeastern sectors of the hazard domain (Figure 9B). The largest flow, formed over the southeastern sector, can develop cross-section widths of few hundreds of meters while keeping flow depths of almost 10 m (Figure 9B). The flow crosses the area where Mugnano di Cardinale, Avella, and other municipalities are located and stops after ~15 km of propagation. The maximum speeds recorded in the simulation can be 30 m/s at the initiation areas but they decrease to about 5 m/s over the flat areas.
In simulation group 22 (Figure 9C), the flows propagate short distances along quite straight valleys before reaching the flat area on the Campanian Plain where Episcopio and Sarno are located. The lahars in the eastern part of the hazard domain converge over the Campanian Plain to produce an extended inundated area where flow depths can be close to 10 m (Figure 9C). The maximum run-outs of the whole simulation group are not greater than 3 km. In terms of lahar speed, maximum values can be above 30 m/s near to the initiation points, are sustained around 10–15 m/s over the initial part (~1 km) of the Campanian Plain and then gradually decrease to below 5 m/s.
In simulation group 24 (Figure 9D), the flows are triggered from the upper part of the Somma-Vesuvius edifice, including the north flank beyond Mt Somma, and propagate radially developing braided patterns when they have reached the mid slopes as the topography is not as confining as in other simulation groups (Figure 9D). The majority of the lahars simulated on the south flank reach the sea after having traveled for ~5–6 km. The lahars on the other flanks of the volcano have similar maximum runouts (Figure 9D). The maximum flow depths are around 10 m in some proximal sectors where flows might get channelized. Maximum flow speeds can reach 25 m/s and be maintained around 10-12 m/s over proximal-medial sectors (up to ~4 km). On distal sectors (~4–6 km), the lahars slow down to speeds of 5 m/s or lower (Figures 9D,10A).
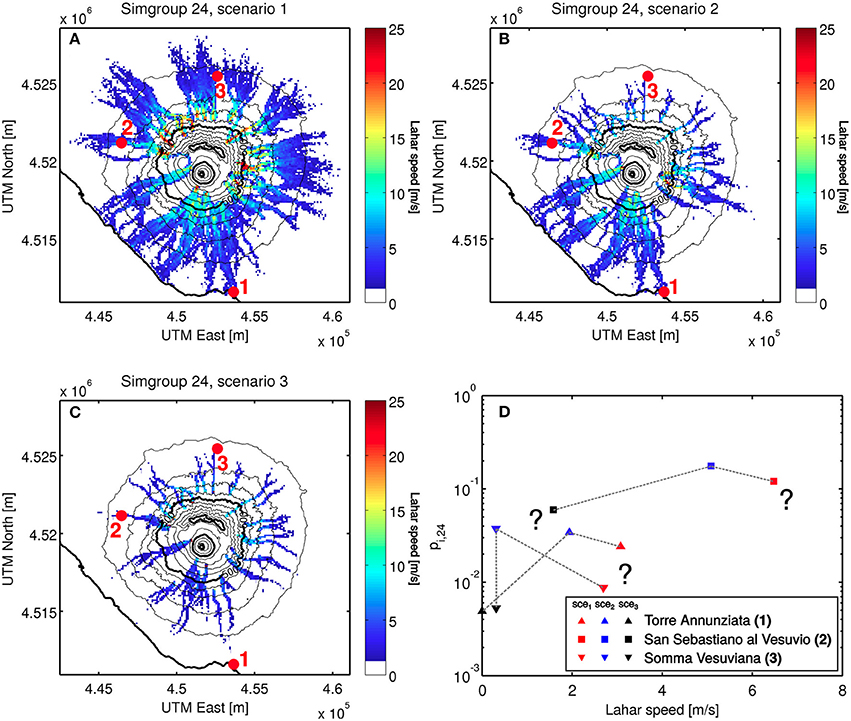
Figure 10. Probabilistic multi-hazard assessment of rain-triggered lahars at Somma-Vesuvius (Italy). On (A–C): hazard footprints of lahar speed at simulation group (simgroup) 24 according to the three selected scenarios: scenario 1 (sce1, A), scenario 2 (sce2, B), and scenario 3 (sce3, C). On (D), probabilistic output distributions for lahar speed, built from the probabilities associated with each scenario (pi,j in Equation 5) and the values of lahar speed recorded at each location (numbers in brackets correspond to the red numbers in A–C). These distributions are discrete: lines connecting the different points are used to aid visualization but the actual density of probability between (and beyond) the points is not known (see text for more details).
Combining the probabilistic assessments performed by Multihaz with the hazard footprints of lahars computed with LaharFlow, we are able to extract discrete probabilistic output distributions for two hazard variables of particular interest: lahar flow depth and speed. In Figure 10, we show such a probabilistic quantification of the lahar hazard for the flow speed and simulation group 24 (Somma-Vesuvius flanks). We compute values of the hazard variable (in this example the lahar speed) for each scenario and our BBN provides the likelihood of each initial volume of lahars which, with additional assumptions about probabilistic independence, allows us to compute the probability value relative to each lahar speed (pi,j in Equation 3; we apply the formula for the catchments generating lahars that actually interact before impacting three selected locations; red filled circles in Figure 10). The final result are discrete probabilistic output distributions of the lahar speed at each location (Figure 10D). Note that we can select any point within our hazard domain and visualize its output probability distribution for lahar speed, and also for lahar flow-depth or any other variable that could be extracted from the simulations.
We find that the fastest lahars are expected to occur for flows simulated under scenario 1, with the maximum speed recorded at San Sebastiano al Vesuvio (~6–7 m/s; p1, 24 ~ 12%). Scenario 3 is associated with lahars of maximum speeds between 0 and 2 m/s for the three selected points and probabilities always below 6% (Figure 10D). Scenario 2 is considered the most likely of the three scenarios (p2, 24 ~[3–18]%). The lahars simulated here show speeds around 2 m/s at Torre Annunziata (p2, 24 ~ 3%), 5 m/s at San Sebastiano al Vesuvio (p2, 24 ~ 18%), and 0.3 m/s at Somma Vesuviana (p2, 24 ~ 4%). Interestingly, we see that the range of lahar speed at Somma Vesuviana is narrower compared to the ranges at the other two locations. Thus, the maximum lahar speed at Torre Annunziata for scenario 1 is slightly higher than that at Somma Vesuviana but, for scenario 3, the former is 0 m/s and the latter is around 0.3 m/s. In summary, we observe that relatively slow lahars may be expected to impact Somma Vesuviana (e.g., scenarios 2 and 3) while lahars may reach Torre Annunziata only during medium-large events (e.g., scenarios 1 and 2) but these lahars could have higher speeds than those impacting areas northwards of Mount Somma (Figure 10).
Discussion
Use of BBNs To Model Rain-Triggered Lahars
In order to model the rainfall-triggering of lahars, we develop a simplified but very versatile probabilistic model that can be easily adapted to many volcanoes, provided that there are probabilistic descriptions available at least for the regional rainfall intensity around the volcano and the spatial distribution of tephra deposits around the volcano following an eruption. Another requirement for building Multihaz at other volcanoes may be the calibration of the parameters of the WR node in order to model tephra deposits with variable properties, e.g., infiltration capacity related to the median grain size distribution (e.g., Pierson and Major, 2014; Jones et al., 2015).
The triggering process is an important ingredient of a lahar hazard model, as it controls the location and timing of lahar events, and influences the magnitude of the flow. However, the physical processes leading to initiation remain poorly understood. While some studies consider erosive runoff to be the principal initiation mechanism (e.g., Collins and Dunne, 1986; Lavigne et al., 2000a; Pierson and Major, 2014; Jones et al., 2015) others deem that shallow-landsliding is the primary generation mechanism for lahars (e.g., Iverson, 2000; Volentik et al., 2009; Mead et al., 2016). Discrepancies in interpretation of volcanological phenomena can lead to contrasting model assessments (e.g., Hincks et al., 2014) so it is important that the selected model is able to incorporate the range of possible behaviors. It is likely that both initiation processes (and perhaps others) can generate lahars and further research could elucidate the regimes in which each is active. Until a deeper understanding of the initiation processes is available, models should capture this source of epistemic uncertainty. Multihaz attempts to model the two distinct initiation mechanisms for lahars through the parameterization of the RE node as a function of its parents: RI, RD and, especially, WR (see Tables 1, 2; and Figures 2–4). Nonetheless, Multihaz could be adapted to model only erosive runoff or shallow-landsliding, for instance, by permanently instantiating the WR node to “runoff” or “both,” respectively (although WR = ifl also implies the possibility of shallow landslides triggering lahars; see Figures 2, 3). Alternatively, the structure of Multihaz could be changed to reflect new fundamental physical insights into lahar initiation, for example removing the WR node and adding other variables that are thought to directly control the triggering for each initiation mechanism, e.g., hydraulic diffusivity (e.g., Mead et al., 2016).
Multihaz is a first attempt to probabilistically model (and forecast) lahar initiation following explosive volcanic eruptions using an integrated multi-hazard framework, and we consciously construct a relatively simple BBN. Inevitably, this leads to some limitations of our model. Thus, the parameterization of Multihaz is preliminary and the performance of the model is not tested against real data. However, at certain volcanoes (e.g., Mount Merapi, Indonesia; Lavigne et al., 2000a; De Bélizal et al., 2013), large datasets of lahar observations may be used to either calibrate the Multihaz parameters or test the performance of the network (Figure 11). That is, using combinations of node states that have been observed (e.g., RI = high, RD = medium, IV = medium), it is possible (i) to refine/update, through Bayesian inference, the probability values (i.e., parameters) in Multihaz; or (ii) to calculate the likelihood of observing the aforementioned combinations, given our paramerization of Multihaz (e.g., Murphy, 2001; Koller and Friedman, 2009). Furthermore, a variety of observations could be collected to calibrate or test Multihaz at any volcano. For instance (1) direct observations of the water-routing mechanism, given rainfall intensity, through slope plots (e.g., Chinen, 1986; Leavesley et al., 1989); (2) discrimination between event/no event, given rainfall intensity and duration, through acoustic flow monitoring (e.g., Lavigne et al., 2000b; Jones et al., 2015); (3) estimation of initiation volume and/or remobilization efficiency through field analyses and remote-sensing techniques (e.g., Bremer and Sass, 2012; Amici et al., 2013; Pierson et al., 2013).
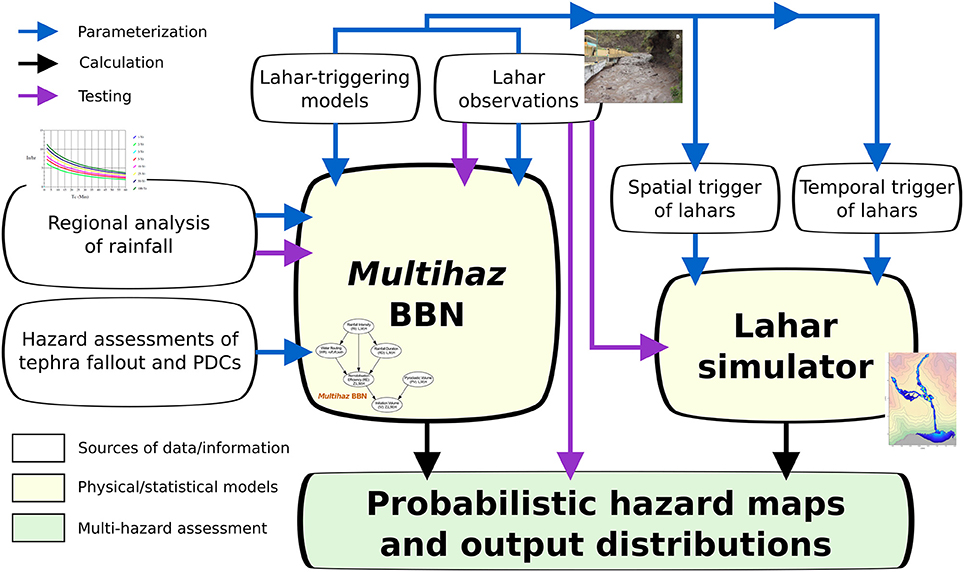
Figure 11. Summarizing schematic of the presented framework for probabilistic volcanic multi-hazard assessment with focus on rain-triggered lahars (see Figure 1), including some possible future research directions to improve such multi-hazard assessment (or similar ones). Observations coming from the regional rainfall phenomenology and the lahar events at the volcano of interest can be used to test the assessments made by Multihaz (purple arrows). Moreover, the lahar observations can serve to test the performance of the lahar simulator and, if there is sufficient data, the probabilistic multi-hazard assessment. Likewise, different sources of information (white boxes) may be utilized to refine the parameterization of the whole multi-hazard framework, including the temporal trigger of lahars, which is not treated in our study (see text for more details). Graph of regional rainfall and lahar-observation image modified from https://thecriticalflow.wordpress.com and Jones et al. (2015), respectively.
Even though the Multihaz probabilistic assessments for the initiation volume are an advance on previous studies in which the outputs are binary (e.g., event or no event, as in Van Westen and Daag, 2005; Berti et al., 2012; Jones et al., 2015), our BBN model is unable to give a detailed temporal analysis of the triggering (e.g., Iverson, 2000; Mead et al., 2016) or even of the spatial changes in lahar susceptibility with time (e.g., Fan et al., 2017). Further development of our multi-hazard framework could include the implementation of dynamic Bayesian networks (e.g., Koller and Friedman, 2009) to model the temporal aspects of the lahar initiation. Additionally, LaharFlow is capable of modeling sources that are active at different times so such a dynamic BBN could be coupled to the flow simulator to provide spatio-temporal hazard footprints of lahars.
Probabilistic Framework to Model Cascading Volcanic Hazards
Secondary hazardous volcanic processes, such as lahars, represent a further challenge for hazard assessment in comparison with primary processes, such as tephra fallout and PDCs. This is largely due to the difficulty in quantifying the cascade effect among the processes. That is, the aleatory (and epistemic) uncertainty in the primary processes conditions the spatial and temporal variability in the secondary process (e.g., Pierson and Major, 2014). Our proposed multi-hazard framework provides a viable solution to deal with such situation.
Firstly, we believe that constraining the spatial distribution of tephra deposits in probabilistic terms and incorporating this information into Multihaz is one of the major strengths of our multi-hazard framework. The coupling between the areas that are expected to be affected by tephra deposition, given an eruption, and the areas that may subsequently act as lahar sources is indeed rarely seen in the literature (e.g., Volentik et al., 2009). However, there are strong links observed between the spatial distribution of tephra accumulation and the magnitude and frequency of lahars at several volcanoes after recent eruptions (e.g., Pierson et al., 1992; Pierson and Major, 2014). In addition, the importance of quantifying the aleatory uncertainty in tephra accumulation is highlighted by our results, which account for the possible occurrence of unlikely (but still possible) events (e.g., large-size lahars at catchment #195 after a large eruption; see Figure 7A). Indeed, low-probability, high-consequence situations are often very relevant not only in volcanic hazards but in any kind of natural hazard (e.g., Rougier et al., 2013; Mignan et al., 2014).
Secondly, our multi-hazard framework fundamentally relies on the strategy of separating the calculation of the probability of a specific event (e.g., medium-size lahars at catchment #195, given the occurrence of a large eruption at Somma-Vesuvius; see Figure 7) and the hazard footprint that ensues from this specific event (e.g., Spiller et al., 2014). This is a great advantage because it implies that changes in the probability distributions of Multihaz, for instance due to a modification in the prior table of RI, do not inevitably require many more simulations to be performed.
The final probabilistic products that we obtain, after having run the lahar simulator, are discrete output distributions for lahar speed (Figure 10) or flow depth. These are important outputs since they link the hazard-intensity measure and its probability of occurrence at a given point of the hazard domain, in a similar way to hazard curves. However, our probabilistic output distributions still consider too few “realizations” of the hazard (they are based on 3 values, one per scenario) and, therefore, we do not have enough information about the exceedance probabilities over the whole possible domain of the hazard-intensity measure. This limitation could be overcome by building a BBN model that used continuous PDFs at each of its nodes (e.g., Hanea et al., 2006) as well as by propagating uncertainty through performing a larger number of lahar simulations and/or using sophisticated uncertainty quantification techniques (e.g., Spiller et al., 2014).
Lahar Hazard at Somma-Vesuvius
This study presents an example of lahar hazard assessment at Somma-Vesuvius that includes novel aspects: (1) an explicit and quantitative coupling between lahar triggering and propagation, and (2) a probabilistic assessment of the lahar initiation volumes. Previous studies have mostly dealt with the analysis of the stratigraphical sequences and historical data of syn- and inter-eruptive lahars (e.g., Rosi et al., 1993; Lirer et al., 2001; Sulpizio et al., 2006). We note that if a precise reconstruction of the spatial distribution of some syn-eruptive lahars was available, this kind of data could represent a first step to test the reliability of our integrated framework, for instance by comparing these lahar deposits to our LaharFlow simulations (e.g., Tarquini and Favalli, 2011; Tierz et al., 2016b).
Other hazard studies of water-sediment flows at Somma-Vesuvius have focused on the detailed description of the susceptibility of different catchments (both around the volcano and in very distal sectors) to act as sources for these volcaniclastic flows according to the spatial distribution of past pyroclastic deposits and the hydrogeomorphological characteristics of these catchments (e.g., Bisson et al., 2010, 2014). Even though our maps are not directly comparable (e.g., our hazard metric—lahar initiation volume—is different from those of Bisson et al., 2010, 2014—instability or disruption proneness), we note that the spatial distribution of the most hazardous catchments is roughly similar. However, with respect to the analyses presented by Bisson et al. (2010, 2014), our study crucially incorporates the aleatory uncertainty in RE and PV. Thus, some catchments ENE of Somma-Vesuvius, which according to morphological features only may not be classified as highly hazardous (e.g., Figure 8 in Bisson et al., 2014), do seem to have the potential to trigger large-volume lahars in our study (Figure 8D) because they are located downwind the main tephra-dispersion axis (Figure 7).
In terms of lahar propagation at Somma-Vesuvius, Favalli et al. (2006) presented a study focusing on the “maximum expected (eruptive) event” at the volcano which, according to the emergency plan implemented by the Italian civil protection at that time, was a sub-Plinian I eruption equivalent to the 1631 AD eruption (e.g., Rosi et al., 1993; Cioni et al., 2008). In contrast, our model includes the aleatory uncertainty in tephra-fallout dispersion and dense-PDC deposition. Nevertheless, our modeling of tephra dispersal does not explicitly consider the occurrence of long-lasting violent Strombolian/ash-emission eruptions (Cioni et al., 2008). This type of eruption could produce significant amounts of tephra near the Somma-Vesuvius cone for long periods of time and, therefore, lahar production might be promoted in the mid to long term (e.g., Jones et al., 2015).
In contrast to Favalli et al. (2006), our results do not identify the Acerra-Nola Plain (Figure 5) as the most-hazardous area in terms of rain-triggered lahars. Due to the expected spatial distribution of the tephra-fallout deposits (Figure 7), the closest catchments to the central part of the plain (approximately catchments #200–225 in Figure 8, zone 3) show the lowest probability, among all catchments, of producing large lahars (Figures 8A,D). Therefore, even when considering an extreme scenario (large eruption combined with high remobilization efficiencies: scenario 1), the LaharFlow runs, for instance, of the simulation group 19-20 (Figure 9B), do inundate the eastern part of the Acerrra-Nola Plain but do not propagate as far as the flows simulated by Favalli et al. (2006). We argue that this can be also related to the quite high value of rainfall intensity used by Favalli et al. (2006): peak intensity at 108 mm/h during 0.5 h of rainfall. According to the hydrological report presented by AdBCC (2015), the maximum rainfall intensity for an infinitesimally-short rainfall (i.e., RD → 0) at the area of the Acerra-Nola Plain, is just above 85 mm/h (we remind that our parameterization of RI through yearly maxima does not influence the hazard analysis of scenario 1 because IV is independent of RI, given RE; see Figure 2).
Conclusions
In this paper, we propose a probabilistic multi-hazard framework to assess the hazard of rain-triggered lahars when incorporating information about the aleatory uncertainty in the rainfall intensity and, importantly, the spatial distribution of tephra volumes around a given volcano due to tephra fallout and (dense) PDCs. The use of a simple and flexible BBN model (Multihaz) allows us to model and forecast the lahar initiation, including rainfall duration or the dominant water-routing mechanism, in a detailed way that other Bayesian models used in probabilistic volcanic hazard (e.g., BET_VH, Marzocchi et al., 2010) cannot achieve at present. Multihaz can be applied to many volcanoes around the world and it can be improved and tested as new data on rain-triggered lahars become available (Figure 11). Moreover, coupling the Multihaz probabilistic assessments with a dynamic model of lahars (e.g., LaharFlow; Woodhouse, in preparation) allows the uncertainty in the lahar triggering to be propagated through to the lahar hazard footprints. This is a novel hazard product for lahars, especially because we integrate the aleatory variability in tephra deposition.
Our preliminary application of the probabilistic multi-hazard framework to Somma-Vesuvius (Italy) shows that the complexity in lahar hazard can be better tackled through structured approaches like the one proposed here. Further development of the modeling framework would provide improved evaluations. For example, it would be valuable to model the dependencies between the probabilities of lahar occurrence (and volumes) in the different catchments around the volcano, but this requires further research.
Other future developments of our framework could include (1) parameterizing Multihaz through expert elicitation exercises (e.g., Aspinall, 2006); (2) collecting more extensive datasets on the rainfall-triggering of lahars (e.g., Balducci, 2007) to either parameterize or test Multihaz; (3) refining the Multihaz structure to accommodate more processes and/or interpretations of the physical processes acting during the triggering (e.g., Mead et al., 2016); (4) modeling long-term evolutions of lahar generation according to the characteristics of the volcano, the eruption size, climate and morphological factors, etc. (e.g., Pierson and Major, 2014); (5) modeling the spatial variability in the grain size distribution of the tephra deposits (e.g., Eychenne et al., 2015).
Author Contributions
PT, HO, JP, MW, LS, JS, and WM conceived the study, PT and MW analyzed the results and prepared the figures with input from the other authors, PT and MW wrote the manuscript with input from the other authors, PT conceived and parameterized the BBN model with input from the other authors, LS provided the final probabilistic assessment of tephra volume, MW performed the LaharFlow simulations. All authors read, reviewed and approved all versions of the manuscript.
Funding
The research leading to these results has received funding from the DIFA (DIpartimento di Fisica e Astronomia), Università di Bologna, through the Marco Polo programme; the EU FP7 projects NEMOH (Numerical, Experimental and stochastic Modeling of vOlcanic processes and Hazard, grant agreement n°289976) and MED-SUV (MEDiterrenean SUpersite Volcanoes, grant agreement n°308665); from Futuro in Ricerca 2008 FIRB Project ByMur [RBFR0880SR] financed by MIUR, the Italian Ministry for Research and Education; the Italian project DPC-INGV “V1: Probabilistic Volcanic Hazard Analysis,” funded by Dipartimento della Protezione Civile, and the UK Natural Environment Research Council Strengthening Resilience in Volcanic Areas (STREVA) project (grant number NE/J019984/1). Some results shown here were obtained through computational resources provided by the Center for Computational Research, University at Buffalo, NY, USA. Some DEM products were downloaded from NASA and others were courtesy of the Laboratory of Geomatics (INGV, Osservatorio Vesuviano, Napoli, Italy).
Conflict of Interest Statement
The authors declare that the research was conducted in the absence of any commercial or financial relationships that could be construed as a potential conflict of interest.
Acknowledgments
We sincerely thank Giuseppe Vilardo for providing access to the DEMs; Abani Patra and Ramona Stefanescu for Titan2D and PCQ support; Greg Valentine, Sarah Ogburn, Sylvain Charbonnier, Pablo Palacios, Ting Wang, Leonel Lara Estrada, Mark Bebbington, Brunella Mastrolembo, Ines Cerenzia, and Thomas Dunne for valuable discussions; and Antonio Costa, Roberto Sulpizio, Andrea Panizza, Stuart Mead, Chris Johnson, and Aishling Barrett for data/knowledge sharing as well as fruitful discussions. We are very grateful to Raffaello Cioni and Eisuke Fujita for their thorough revision and to Roberto Sulpizio and Valerio Acocella for their careful editorial handling and their comments on our research work. All the received feedback helped us improve our manuscript.
Supplementary Material
The Supplementary Material for this article can be found online at: https://www.frontiersin.org/article/10.3389/feart.2017.00073/full#supplementary-material
Abbreviations
AdBCC, Autorità di Bacino Regionale della Campania Centrale; BBN, Bayesian Belief Network; CPT, Conditional Probability Table; DEM, Digital Elevation Model; I-D, Intensity-Duration (of rainfall); IV, Initiation Volume (of lahars); PDC, Pyroclastic Density Current; PDF, Probability Density Function; PV, Pyroclastic Volume; RD, Rainfall Duration; RE, Remobilization Efficiency; RI, Rainfall Intensity; VEI, Volcanic Explosivity Index; WR, Water-Routing mechanism.
References
Amici, S., Turci, M., Giammanco, S., Spampinato, L., and Giulietti, F. (2013). UAV thermal infrared remote sensing of an Italian mud volcano. Adv. Remote Sens. 2, 358–364. doi: 10.4236/ars.2013.24038
Aspinall, W. P. (2006). “Structured elicitation of expert judgment for probabilistic hazard and risk assessment in volcanic eruptions,” in Statistics in Volcanology, Special Publications of IAVCEI No. 1, eds H. M. Mader, S. G. Coles, C. B. Connor, and L. J. Connor (London, UK: The Geological Society for IAVCEI), 15–30.
Auker, M., Sparks, R., Siebert, L., Crosweller, H., and Ewert, J. (2013). A statistical analysis of the global historical volcanic fatalities record. J. Appl. Volcanol. 2, 1–24. doi: 10.1186/2191-5040-2-2
Autorità di Bacino Regionale della Campania Centrale (2015). Piano Stralcio per l'Assetto Idrogeologico (P. S. A. I.): Relazione Idrologica (in Italian). Available online at: http://www.adbcampaniacentrale2.it/documenti/psai/relazioni/RelazioneIdrologica.pdf
Balducci, V. (2007). Rainfall Thresholds for the Initiation of Landslides. Available online at: http://rainfallthresholds.irpi.cnr.it/credit.htm
Bernard, M. M. (1932). Formulas for rainfall intensities of long duration. Trans. Am. Soc. Civ. Eng. 96, 592–606.
Berti, M., Martina, M. L. V., Franceschini, S., Pignone, S., Simoni, A., and Pizziolo, M. (2012). Probabilistic rainfall thresholds for landslide occurrence using a Bayesian approach. J. Geophys. Res. Earth Surf. 117:F4. doi: 10.1029/2012JF002367
Bisson, M., Pareschi, M. T., Zanchetta, G., Sulpizio, R., and Santacroce, R. (2007). Volcaniclastic debris-flow occurrences in the Campania region (Southern Italy) and their relation to Holocene - Late Pleistocene pyroclastic fall deposits: implications for large-scale hazard mapping. Bull. Volcanol. 70, 157–167. doi: 10.1007/s00445-007-0127-4
Bisson, M., Spinetti, C., and Sulpizio, R. (2014). Volcaniclastic flow hazard zonation in the Sub-apennine vesuvian area using gis and remote sensing. Geosphere 10, 1419–1431. doi: 10.1130/GES01041.1
Bisson, M., Sulpizio, R., Zanchetta, G., Demi, F., and Santacroce, R. (2010). Rapid terrain-based mapping of some volcaniclastic flow hazard using Gis-based automated methods: a case study from southern Campania, Italy. Nat. Hazards 55, 371–387. doi: 10.1007/s11069-010-9533-6
Bremer, M., and Sass, O. (2012). Combining airborne and terrestrial laser scanning for quantifying erosion and deposition by a debris flow event. Geomorphology 138, 49–60. doi: 10.1016/j.geomorph.2011.08.024
Bursik, M. (1998). Tephra dispersal. Geol. Soc. Lond. Spec. Publ. 145, 115–144. doi: 10.1144/GSL.SP.1996.145.01.07
Capra, L., Borselli, L., Varley, N., Gavilanes-Ruiz, J. C., Norini, G., Sarocchi, D., et al. (2010). Rainfall-triggered lahars at Volcán de Colima, Mexico: surface hydro-repellency as initiation process. J. Volcanol. Geotherm. Res. 189, 105–117. doi: 10.1016/j.jvolgeores.2009.10.014
Charbonnier, S. J., and Gertisser, R. (2012). Evaluation of geophysical mass flow models using the 2006 block-and-ash flows of Merapi Volcano, Java, Indonesia: towards a short-term hazard assessment tool. J. Volcanol. Geotherm. Res. 231–232, 87–108. doi: 10.1016/j.jvolgeores.2012.02.015
Chinen, T. (1986). Surface erosion associated with tephra deposition on Mt. Usu and other volcanoes. Environ. Sci. Hokkaido J. Grad. Sch. Environ. Sci., Hokkaido Univ. Sapporo 9, 137–149.
Cioni, R., Bertagnini, A., Santacroce, R., and Andronico, D. (2008). Explosive activity and eruption scenarios at Somma-Vesuvius (Italy): towards a new classification scheme. J. Volcanol. Geotherm. Res. 178, 331–346. doi: 10.1016/j.jvolgeores.2008.04.024
Cioni, R., Santacroce, R., and Sbrana, A. (1999). Pyroclastic deposits as a guide for reconstructing the multi-stage evolution of the Somma-Vesuvius Caldera. Bull. Volcanol. 61, 207–222. doi: 10.1007/s004450050272
Collins, B. D., and Dunne, T. (1986). Geological Society of America Bulletin Erosion of tephra from the 1980 eruption of Mount St. Helens. Geol. Soc. Am. Bull. 97, 896–905. doi: 10.1130/0016-7606(1986)97<896:EOTFTE>2.0.CO;2
De Bélizal, E., Lavigne, F., Hadmoko, D. S., Degeai, J. P., Dipayana, G. A., Mutaqin, B. W., et al. (2013). Rain-triggered lahars following the 2010 eruption of Merapi volcano, Indonesia: a major risk. J. Volcanol. Geotherm. Res. 261, 330–347. doi: 10.1016/j.jvolgeores.2013.01.010
Doyle, E. E., Hogg, A. J., Mader, H. M., and Sparks, R. S. J. (2010). A two-layer model for the evolution and propagation of dense and dilute regions of pyroclastic currents. J. Volcanol. Geotherm. Res. 190, 365–378. doi: 10.1016/j.jvolgeores.2009.12.004
Eychenne, J., Cashman, K., Rust, A., and Durant, A. (2015). Impact of the lateral blast on the spatial pattern and grain size characteristics of the 18 May 1980 Mount St. Helens fallout deposit. J. Geophys. Res. Solid Earth 120, 6018–6038. doi: 10.1002/2015JB012116
Fagents, S. A., and Baloga, S. M. (2006). Toward a model for the bulking and debulking of lahars. J. Geophys. Res. Solid Earth 111. doi: 10.1029/2005JB003986
Fan, L., Lehmann, P., McArdell, B., and Or, D. (2017). Linking rainfall-induced landslides with debris flows runout patterns towards catchment scale hazard assessment. Geomorphology 280, 1–15. doi: 10.1016/j.geomorph.2016.10.007
Favalli, M., Pareschi, M. T., and Zanchetta, G. (2006). Simulation of syn-eruptive floods in the circumvesuvian plain (southern Italy). Bull. Volcanol. 68, 349–362. doi: 10.1007/s00445-005-0011-z
Fiorillo, F., and Wilson, R. C. (2004). Rainfall induced debris flows in pyroclastic deposits, Campania (southern Italy). Eng. Geol. 75, 263–289. doi: 10.1016/j.enggeo.2004.06.014
Frattini, P., Crosta, G. B., Fusi, N., and Dal Negro, P. (2004). Shallow landslides in pyroclastic soils: a distributed modelling approach for hazard assessment. Eng. Geol. 73, 277–295. doi: 10.1016/j.enggeo.2004.01.009
Frattini, P., Crosta, G., and Sosio, R. (2009). Approaches for defining thresholds and return periods for rainfall-triggered shallow landslides. Hydrol. Process. 23, 1444–1460. doi: 10.1002/hyp.7269
Gabet, E. J., and Dunne, T. (2003). Sediment detachment by rain power. Water Resour. Res. 39, ESG 1-1–ESG 1-12. doi: 10.1029/2001WR000656
Gurioli, L., Sulpizio, R., Cioni, R., Sbrana, A., Santacroce, R., Luperini, W., et al. (2010). Pyroclastic flow hazard assessment at Somma-Vesuvius based on the geological record. Bull. Volcanol. 72, 1021–1038. doi: 10.1007/s00445-010-0379-2
Hanea, A. M., Kurowicka, D., and Cooke, R. M. (2006). Hybrid method for quantifying and analyzing Bayesian belief nets. Qual. Reliab. Eng. Int. 22, 709–729. doi: 10.1002/qre.808
Hincks, T. K., Komorowski, J.-C., Sparks, S. R., and Aspinall, W. P. (2014). Retrospective analysis of uncertain eruption precursors at La Soufrière volcano, Guadeloupe, 1975–77: volcanic hazard assessment using a Bayesian Belief Network approach. J. Appl. Volcanol. 3:3. doi: 10.1186/2191-5040-3-3
Hubbard, B. E., Sheridan, M. F., Carrasco-Nú-ez, G., Díaz-Castellón, R., and Rodríguez, S. R. (2007). Comparative lahar hazard mapping at Volcan Citlaltépetl, Mexico using SRTM, ASTER and DTED-1 digital topographic data. J. Volcanol. Geotherm. Res. 160, 99–124. doi: 10.1016/j.jvolgeores.2006.09.005
Iverson, R. M. (2000). Landslide triggering by rain infiltration. Water Resour. Res. 36:1897. doi: 10.1029/2000WR900090
Iverson, R. M., and George, D. L. (2014). A depth-averaged debris-flow model that includes the effects of evolving dilatancy. I. Physical basis. Proc. R. Soc. Lond. A Math. Phys. Eng. Sci. 470:20130819. doi: 10.1098/rspa.2013.0819
Iverson, R. M., George, D. L., Allstadt, K., Reid, M. E., Collins, B. D., Vallance, J. W., et al. (2015). Landslide mobility and hazards: implications of the 2014 Oso disaster. Earth Planet. Sci. Lett. 412, 197–208. doi: 10.1016/j.epsl.2014.12.020
Iverson, R. M., Schilling, S. P., and Vallance, J. W. (1998). Objective delineation of lahar-inundation hazard zones. Bull. Geol. Soc. Am. 110, 972–984. doi: 10.1130/0016-7606(1998)110<0972:ODOLIH>2.3.CO;2
Jones, R., Manville, V., and Andrade, D. (2015). Probabilistic analysis of rain-triggered lahar initiation at Tungurahua volcano. Bull. Volcanol. 77:68. doi: 10.1007/s00445-015-0946-7
Koller, D., and Friedman, N. (2009). Probabilistic Graphical Models: Principles and Techniques. Cambridge, MA: MIT Press.
Lavigne, F., Thouret, J., Voight, B., Suwa, H., and Sumaryono, A. (2000a). Lahars at Merapi volcano, Central Java: an overview. J. Volcanol. Geotherm. Res. 100, 423–456. doi: 10.1016/S0377-0273(00)00150-5
Lavigne, F., Thouret, J.-C., Voight, B., Young, K., LaHusen, R., Marso, J., et al. (2000b). Instrumental lahar monitoring at Merapi Volcano, Central Java, Indonesia. J. Volcanol. Geotherm. Res. 100, 457–478. doi: 10.1016/S0377-0273(00)00151-7
Le Treut, H., Somerville, R., Cubasch, U., Ding, Y., Mauritzen, C., Mokssit, A., et al. (2007). “Historical overview of climate change. Climate change 2007: The physical science basis,” in Contribution of Working Group I to the Fourth Assessment Report of The Intergovernmental Panel on Climate Change, eds S. Solomon, D. Qin, M. Manning, Z. Chen, M. Marquis, K. B. Averyt, M. Tignor, H. L. Miller (Cambridge, UK; New York, NY: Cambridge University Press).
Leavesley, G., Lusby, G., and Lichty, R. (1989). Infiltration and erosion characteristics of selected tephra deposits from the 1980 eruption of Mount St. Helens, Washington, USA. Hydrol. Sci. J. 34, 339–353. doi: 10.1080/02626668909491338
Lirer, L., Vinci, A., Alberico, I., Gifuni, T., Bellucci, F., Petrosino, P., et al. (2001). Occurrence of inter-eruption debris flow and hyperconcentrated flood-flow deposits on Vesuvio volcano, Italy. Sediment. Geol. 139, 151–167. doi: 10.1016/S0037-0738(00)00162-7
Liu, Z., Nadim, F., Garcia-Aristizabal, A., Mignan, A., Fleming, K., and Luna, B. Q. (2015). A three-level framework for multi-risk assessment. Georisk Assess. Manag. Risk Eng. Syst. Geohazards 9, 59–74. doi: 10.1080/17499518.2015.1041989
Macías, J. L., Capra, L., Arce, J. L., Espíndola, J. M., García-Palomo, A., and Sheridan, M. F. (2008). Hazard map of El Chichón volcano, Chiapas, México: constraints posed by eruptive history and computer simulations. J. Volcanol. Geotherm. Res. 175, 444–458. doi: 10.1016/j.jvolgeores.2008.02.023
Marzocchi, W., Sandri, L., and Selva, J. (2010). BET_VH: a probabilistic tool for long-term volcanic hazard assessment. Bull. Volcanol. 72, 705–716. doi: 10.1007/s00445-010-0357-8
Marzocchi, W., Sandri, L., Gasparini, P., Newhall, C., and Boschi, E. (2004). Quantifying probabilities of volcanic events: the example of volcanic hazard at Mount Vesuvius. J. Geophys. Res. B Solid Earth 109, 1–18. doi: 10.1029/2004JB003155
Mead, S., Magill, C., and Hilton, J. (2016). Rain-triggered lahar susceptibility using a shallow landslide and surface erosion model. Geomorphology 273, 168–177. doi: 10.1016/j.geomorph.2016.08.022
Mignan, A., Wiemer, S., and Giardini, D. (2014). The quantification of low-probability–high-consequences events: part I. A generic multi-risk approach. Nat. Hazards 73, 1999–2022. doi: 10.1007/s11069-014-1178-4
Murphy, K. (2001). “The bayes net toolbox for matlab,” in Computing Science and Statistics, Vol. 33, eds E. Wegman, A. Braverman, A. Goodman, and P. Smyth (Fairfax Station, VA: Interface Foundation of North America, Inc.), 1024–1034.
Norsys (1995-2015). Netica version 5.12. Available online at: www.norsys.com
Newhall, C. G., and Self, S. (1982). The volcanic explosivity index (VEI): an estimate of explosive magnitude for historical volcanism. J. Geophys. Res. Atmos. 87, 1231–1238. doi: 10.1029/JC087iC02p01231
Ogburn, S. E. (2015). Reconciling Field Observations of Pyroclastic Density Currents with Conceptual and Computational Analogs Using a GIS and a Newly Developed Global Database. Ph.D. thesis, State University of New York, Buffalo.
Orsi, G., Di Vito, M. A., and Isaia, R. (2004). Volcanic hazard assessment at the restless Campi Flegrei caldera. Bull. Volcanol. 66, 514–530. doi: 10.1007/s00445-003-0336-4
Pareschi, M. T., Favalli, M., Giannini, F., Sulpizio, R., Zanchetta, G., and Santacroce, R. (2000). May 5, 1998, debris flows in circum-Vesuvian areas (Southern Italy): insights for hazard assessment. Geology 28, 639–642. doi: 10.1130/0091-7613(2000)28<639:MDFICA>2.0.CO;2
Patra, A. K., Bauer, A. C., Nichita, C. C., Pitman, E. B., Sheridan, M. F., Bursik, M., et al. (2005). Parallel adaptive numerical simulation of dry avalanches over natural terrain. J. Volcanol. Geotherm. Res. 139, 1–21. doi: 10.1016/j.jvolgeores.2004.06.014
Pierson, T. C., and Major, J. J. (2014). Hydrogeomorphic Effects of Explosive Volcanic Eruptions on Drainage Basins. Annu. Rev. Earth Planet. Sci. 42, 469–507. doi: 10.1146/annurev-earth-060313-054913
Pierson, T. C., Janda, R. J., Umbal, J. V., and Daag, A. S. (1992). Immediate and long-term hazards from lahars and excess sedimentation in rivers draining Mount Pinatubo, Philippines. U.S. Geol. Surv. Water-Resour. Invest. Rep. 92:4039.
Pierson, T. C., Major, J. J., Amigo, Á., and Moreno, H. (2013). Acute sedimentation response to rainfall following the explosive phase of the 2008-2009 eruption of Chaitén volcano, Chile. Bull. Volcanol. 75, 1–17. doi: 10.1007/s00445-013-0723-4
Procter, J. N., Cronin, S. J., Fuller, I. C., Sheridan, M., Neall, V. E., and Keys, H. (2010). Lahar hazard assessment using Titan2D for an alluvial fan with rapidly changing geomorphology: Whangaehu River, Mt. Ruapehu. Geomorphology 116, 162–174. doi: 10.1016/j.geomorph.2009.10.016
Reid, M. E., and Iverson, R. M. (1992). Gravity-driven groundwater flow and slope failure potential: 2. Effects of slope morphology, material properties, and hydraulic heterogeneity. Water Resour. Res. 28, 939–950. doi: 10.1029/91WR02695
Riley, K., Webley, P., and Thompson, M. (ed.). (2016). Natural Hazard Uncertainty Assessment: Modeling and Decision Support. Hoboken, NJ: John Wiley & Sons, Inc.
Rosi, M., Principe, C., and Vecci, R. (1993). The 1631 Vesuvius eruption. A reconstruction based on historical and stratigraphical data. J. Volcanol. Geotherm. Res. 58, 151–182. doi: 10.1016/0377-0273(93)90106-2
Rougier, J., Sparks, S., and Hill, L. J. (2013). Risk and Uncertainty Assessment for Natural Hazards. Cambridge, UK: Cambridge University Press.
Sandri, L., Costa, A., Selva, J., Tonini, R., Macedonio, G., Folch, A., et al. (2016). Beyond eruptive scenarios: assessing tephra fallout hazard from Neapolitan volcanoes. Sci. Rep. 6:24271. doi: 10.1038/srep24271
Sandri, L., Thouret, J. C., Constantinescu, R., Biass, S., and Tonini, R. (2014). Long-term multi-hazard assessment for El Misti volcano (Peru). Bull. Volcanol. 76, 1–26. doi: 10.1007/s00445-013-0771-9
Scandone, R., Bellucci, F., Lirer, L., and Rolandi, G. (1991). The structure of the Campanian Plain and the activity of the Neapolitan volcanoes (Italy). J. Volcanol. Geotherm. Res. 48, 1–31. doi: 10.1016/0377-0273(91)90030-4
Selva, J. (2013).Long-term multi-risk assessment:statistical treatment ofinteraction among risks.Nat. Hazards 67, 701–722. doi: 10.1007/s11069-013-0599-9
Spiller, E. T., Bayarri, M. J., Berger, J. O., Calder, E. S., Patra, A. K., Pitman, E. B., et al. (2014). Automating emulator construction for geophysical hazard maps. SIAM/ASA J. Uncertain. Quantif. 2, 126–152. doi: 10.1137/120899285
Sulpizio, R., Dellino, P., Doronzo, D. M., and Sarocchi, D. (2014). Pyroclastic density currents: state of the art and perspectives. J. Volcanol. Geotherm. Res. 283, 36–65. doi: 10.1016/j.jvolgeores.2014.06.014
Sulpizio, R., Zanchetta, G., Demi, F., Di Vito, M. A., Pareschi, M. T., and Santacroce, R. (2006). The Holocene syneruptive volcaniclastic debris flows in the Vesuvian area: geological data as a guide for hazard assessment. Geol. Soc. Am. Spec. Pap. 402, 217–235. doi: 10.1130/2006.2402(10)
Tarquini, S., and Favalli, M. (2011). Mapping and DOWNFLOW simulation of recent lava flow fields at Mount Etna. J. Volcanol. Geotherm. Res. 204, 27–39. doi: 10.1016/j.jvolgeores.2011.05.001
Thouret, J.-C., and Lavigne, F. (2000). “Lahars: occurrence, deposits and behaviour of volcano-hydrologic flows,” in Volcaniclastic Rocks from Magma to Sediments, eds H. Leyrit and C. Montenat (Amsterdam: Gordon Breach Science Publishers), 151–174.
Tierz, P., Ramona Stefanescu, E., Sandri, L., Patra, A., Marzocchi, W., and Sulpizio, R. (2014). “Probabilistic hazard analysis of dense Pyroclastic Density Currents at Vesuvius (Italy) via parametric uncertainty characterization of TITAN2D numerical simulator,” in EGU General Assembly Conference Abstracts (Göttingen: Copernicus Publications), 12229.
Tierz, P., Sandri, L., Costa, A., Sulpizio, R., Zaccarelli, L., Di Vito, M. A., et al. (2016a). “Uncertainty assessment of pyroclastic density currents at Mount Vesuvius (Italy) simulated through the energy cone model,” in Natural Hazard Uncertainty Assessment: Modeling and Decision Support, Vol. 223, AGU Geophysical Monograph, eds K. Riley, P. Webley, and M. Thompson (Hoboken, NJ: John Wiley & Sons, Inc.), 125–145.
Tierz, P., Sandri, L., Costa, A., Zaccarelli, L., Di Vito, M. A., Sulpizio, R., et al. (2016b). Suitability of energy cone for probabilistic volcanic hazard assessment: validation tests at Somma-Vesuvius and Campi Flegrei (Italy). Bull. Volcanol. 78:79. doi: 10.1007/s00445-016-1073-9
Tuñgol, N. M., and Regalado, M. T. M. (1996). “Rainfall, acoustic flow monitor records, and observed lahars of the Sacobia River in 1992,” in Fire and Mud: Eruptions and Lahars of Mount Pinatubo, Philippines, eds C. G. Newhall and R. S. Punongbayan (Quezon City; Seattle, WA: University of Washington Press; PHIVOLCS), 1023–1032.
van Westen, C. J., and Daag, A. S. (2005). Analysing the relation between rainfall characteristics and lahar activity at Mount Pinatubo, Philippines. Earth Surf. Process. Landforms 30, 1663–1674. doi: 10.1002/esp.1225
Volentik, A. C. M., Connor, C. B., Connor, L. J., and Bonadonna, C. (2009). “Aspects of volcanic hazard assessment for the Bataan nuclear power plant, Luzon Peninsula, Philippines,” in Volcanic and Tectonic Hazard Assessment for Nuclear Facilities, eds C. Conno, N. Chapman, and L. Connor (New York, NY: Cambridge University Press), 229–256.
Yang, H., Wang, F., Vilímek, V., Araiba, K., and Asano, S. (2015). Investigation of rainfall-induced shallow landslides on the northeastern rim of Aso caldera, Japan, in July 2012. Geoenviron. Disasters 2:20. doi: 10.1186/s40677-015-0028-3
Zanchetta, G., Sulpizio, R., and Di Vito, M. A. (2004a). The role of volcanic activity and climate in alluvial fan growth at volcanic areas: an example from southern Campania (Italy). Sediment. Geol. 168, 249–280. doi: 10.1016/j.sedgeo.2004.04.001
Zanchetta, G., Sulpizio, R., Pareschi, M. T., Leoni, F. M., and Santacroce, R. (2004b). Characteristics of May 5-6, 1998 volcaniclastic debris flows in the Sarno area (Campania, southern Italy): relationships to structural damage and hazard zonation. J. Volcanol. Geotherm. Res. 133, 377–393. doi: 10.1016/S0377-0273(03)00409-8
Keywords: probabilistic hazard assessment, volcanic multi-hazard, lahar triggering, Bayesian belief network, Somma-Vesuvius
Citation: Tierz P, Woodhouse MJ, Phillips JC, Sandri L, Selva J, Marzocchi W and Odbert HM (2017) A Framework for Probabilistic Multi-Hazard Assessment of Rain-Triggered Lahars Using Bayesian Belief Networks. Front. Earth Sci. 5:73. doi: 10.3389/feart.2017.00073
Received: 21 April 2017; Accepted: 23 August 2017;
Published: 11 September 2017.
Edited by:
Roberto Sulpizio, Università degli studi di Bari Aldo Moro, ItalyReviewed by:
Eisuke Fujita, National Research Institute for Earth Science and Disaster Prevention, JapanRaffaello Cioni, University of Florence, Italy
Copyright © 2017 Tierz, Woodhouse, Phillips, Sandri, Selva, Marzocchi and Odbert. This is an open-access article distributed under the terms of the Creative Commons Attribution License (CC BY). The use, distribution or reproduction in other forums is permitted, provided the original author(s) or licensor are credited and that the original publication in this journal is cited, in accordance with accepted academic practice. No use, distribution or reproduction is permitted which does not comply with these terms.
*Correspondence: Pablo Tierz, pablo@bgs.ac.uk
†Present Address: Pablo Tierz, British Geological Survey, The Lyell Centre, Edinburgh, United Kingdom