The Volcanic Hazards Assessment Support System for the Online Hazard Assessment and Risk Mitigation of Quaternary Volcanoes in the World
 Shinji Takarada
- Geological Survey of Japan, National Institute of Advanced Industrial Science and Technology, Tsukuba, Japan
Volcanic hazards assessment tools are essential for risk mitigation of volcanic activities. A number of offline volcanic hazard assessment tools have been provided, but in most cases, they require relatively complex installation procedure and usage. This situation causes limited usage of volcanic hazard assessment tools among volcanologists and volcanic hazards communities. In addition, volcanic eruption chronology and detailed database of each volcano in the world are essential key information for volcanic hazard assessment, but most of them are isolated and not connected to and with each other. The Volcanic Hazard Assessment Support System aims to implement a user-friendly, WebGIS-based, open-access online system for potential hazards assessment and risk-mitigation of Quaternary volcanoes in the world. The users can get up-to-date information such as eruption chronology and geophysical monitoring data of a specific volcano using the direct link system to major volcano databases on the system. Currently, the system provides 3 simple, powerful and notable deterministic modeling simulation codes of volcanic processes, such as Energy Cone, Titan2D and Tephra2. The system provides deterministic tools because probabilistic assessment tools are normally much more computationally demanding. By using the volcano hazard assessment system, the area that would be affected by volcanic eruptions in any location near the volcano can be estimated using numerical simulations. The system is being implemented using the ASTER Global DEM covering 2790 Quaternary volcanoes in the world. The system can be used to evaluate volcanic hazards and move this toward risk-potential by overlaying the estimated distribution of volcanic gravity flows or tephra falls on major roads, houses and evacuation areas using the GIS-enabled systems. The system is developed for all users in the world who need volcanic hazards assessment tools.
Introduction
A large number of fatalities due to volcanic events have been recorded such as 60,000 (1815 Tambora) and 36,417 (1883 Krakatau) (Takarada et al., 2016a). To mitigate further volcanic event fatalities, useful and powerful volcanic hazard assessment tools are essential. Volcanic hazard assessment tools have been developed during the last few decades (e.g., Loughlin et al., 2015; Papale and Shroder, 2015). A number of deterministic offline volcanic hazard assessment tools have been developed since late 1980's, such as Energy Cone (Sheridan, 1980; Malin and Sheridan, 1982), Titan2D (Pitman et al., 2003; Sheridan et al., 2004), VolcFlow (Kelfoun and Druitt, 2005; Kelfoun et al., 2009), LaharZ (Schilling, 1998), PUFF (Searcy et al., 1998), Tephra 2 (Bonadonna et al., 2005; Connor, 2006), Hazmap (Macedonio et al., 2005), Fall3D (Costa et al., 2006; Folch et al., 2009), and Ash3d (Schwaiger et al., 2012). However, most of them require relatively complex installation procedure and usage (e.g., operation on UNIX command system and preparation of digital elevation model by themselves). This situation causes limited usage of volcanic hazard assessment tools among volcanologists (especially field-based volcanologists) and volcanic hazard communities. Therefore, a user-friendly, open-access online volcanic hazard assessment system is necessary for risk-mitigation of volcanoes in the world.
Recently, the probabilistic volcanic hazard assessment (PVHA) has been developed using multiple methods such as event tree (e.g., Newhall and Hoblitt, 2002; Neri et al., 2008), BET_VH (Bayesian Event Tree for Volcanic Hazard) long-term (e.g., Marzocchi et al., 2010; Selva et al., 2010) and BET_VH short-term (e.g., Selva et al., 2014). Other probabilistic tools to evaluate volcanic scenarios using the Bayesian event tree method (HASSET; Sobradelo et al., 2014) have been developed. The HASSET was built on a QGIS platform and long-term (Becerril et al., 2014) as well as short-term (Sobradelo and Marti, 2015; Bartolini et al., 2016) versions are available. These probabilistic volcanic hazard assessment methods have become important tools for risk mitigation of volcanic events.
Several platforms, which provide a number of numerical simulations and volcanic hazards assessment tool, are available these days. The online volcanic hazard simulations and sharing knowledge platform Vhub (Palma et al., 2014) was launched and is widely used in the volcanic scientific community. The Vhub is online-based but still remains complex to use. The VeTOOLS project, which seeks to develop and implement e-tools for volcanic hazard and risk-management, provides a multiplatform method (VOLCANBOX; Martí et al., 2016). Furthermore, another simulation and visualization multiplatform system (VOLCWORKS) was also recently developed (Granados et al., 2012). The VeTOOLS and VOLCWORKS provide useful system for multi-numerical simulations and assessment tools, but still require complex installation and usage.
An online, open-access, WebGIS-based, platform has many advantages. For example, (1) anybody in the world, who has a browser and internet connection, can use the assessment system (especially during emergency cases), (2) the simulation results could be shown directly on base maps, and (3) users could consider any volcanoes in the world with simple procedures, as digital elevation models are already available in the system.
Outline of Volcanic Hazards Assessment Support System
The Volcanic Hazards Assessment Support System (VHASS: http://volcano.g-ever1.org) aims to implement a user-friendly, WebGIS-based, open-access online system for potential hazards assessment and risk mitigation of Quaternary volcanoes in the world (Figure 1). The VHASS provides user-friendly interface, which does not require any complex installation procedure and Unix command operations. The VHASS is developed based on WebGIS technology, which makes it easy to compare the simulation results with other maps (e.g., topographic maps, roads, houses, evacuation sites, and population distributions). The VHASS implements useful volcano search system and digital elevation model covering all 2790 Quaternary volcanoes in the world. It also provides up-to-date information, such as eruption chronology, type and scale, satellite images, geophysical monitoring data, and precursors to an eruption of a specific volcano using the direct link system. The VHASS provides 3 notable deterministic simulation models such as Energy Cone, Titan2D and Tephra2, which can estimate affected area caused by volcanic gravity flows (e.g., pyroclastic flows and debris avalanches) and tephra falls. Furthermore, the VHASS has an easy to understand graphical input interface (e.g., simulation area and start point are assigned on a map or satellite image) and it provides useful data download system that can choose data types (e.g., kml and shape files). The VHASS has been developed as part of the Asia-Pacific Region Earthquake and Volcanic Eruption Risk Management (G-EVER) Consortium activities (Takarada et al., 2014).
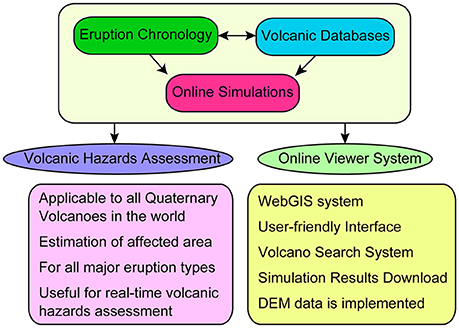
Figure 1. Concept of Volcanic Hazards Assessment Support System (VHASS).
The VHASS was developed using eruption chronology, volcanic eruption databases and numerical simulations, which are useful for volcanic hazards assessment (Figure 1; Takarada et al., 2014). The volcanic eruption database was developed using past eruption results, which only represent a subset of possible future scenarios. These possible future scenarios should include variable potential cases. Therefore, numerical simulations with controlled parameters are needed for more reliable volcanic hazards assessments. Using the volcano hazard assessment system, the area that would be affected by volcanic eruptions at any locations near the volcano can be estimated using numerical simulations. The VHASS could estimate volcanic hazards by overlaying the estimated distributions of volcanic gravity flows or tephra falls on major roads, houses and evacuation areas using WebGIS (Web based Geographic Information Systems). The WebGIS is a technology that is being used to display and analyze spatial data online, combining the advantages of using both the internet and GIS. The Open Geospatial Consortium (OGC; http://www.opengeospatial.org/) is providing international standards for spatial data and web services involving spatial information such as Web Map Service (WMS), Web Coverage Service (WCS) and Web Processing Service (WPS).
The VHASS can include any volcano in the world using the ASTER Global DEM at 30 m in resolution. ASTER is a cooperative effort involving NASA, Japan's Ministry of Economy, Trade and Industry (METI), Japan Space Systems (J-spacesystems) and the Geological Survey of Japan, AIST. The AIST developed the value-added ASTER data (ASTER-VA) and is providing the data in KML and GeoTiff formats from the MADAS website (https://gbank.gsj.jp/madas/?lang=en#top). The DEM data at 10-m resolution provided by the Geospatial Authority of Japan (GSI) is being used only in Japan area. The links to major volcanic databases, such as Smithsonian Global Volcanism Program (GVP; http://volcano.si.edu/; Siebert et al., 2010), the Volcano Global Risk Identification and Analysis Project (VOGRIPA; http://www.bgs.ac.uk/vogripa), ASTER Satellite images (https://gbank.gsj.jp/vsidb/image/index-E.html), Volcanoes of Japan (https://gbank.gsj.jp/volcano/index_e.htm), and WOVOdat (http://www.wovodat.org/; Newhall et al., 2017) are available in the volcano information pop-up of the application. The user could compare volcanic eruption chronology and volcanic databases using the system.
The current version of VHASS uses relatively simple and widely-used simulation tools, for the moment. Other simulation tools, such as Volcflow, Puff, Fall3D, Downflow (Tarquini and Favalli, 2011) and LaharZ are also planned to be implemented by the system in the future. VHASS provides deterministic tools because probabilistic assessment tools, though ideal in many possible cases, are normally much more computationally demanding on the system. The deterministic tools are relatively simple, with short running time, crucial for web-based simulation system. However, the deterministic tools show only one possible case, and users have to run multiple models to find the best fit parameters. The tools are simplified (e.g., 3D movements are not considered) and some results do not fit with the observed distributions and thickness data. The complex 3D multiphase codes, which usually take many hours to weeks of computation time are not suitable for VHASS. The VHASS does not cover all types of volcanic hazards (e.g., lava flows and lahar simulations are not included). Furthermore, users should be knowledgeable about volcanoes to be able to use the models correctly. It is strongly recommended that the users should consult with specialists especially if the simulation results will be used for real hazard assessments.
Volcano Search System and Base Map
All Quaternary volcanoes in the world (total number is 2790) could be assessed using the VHASS. Quick volcano search system is one of the important features of VHASS. The volcano search system was developed using the Smithsonian Global Volcanism Program, the Volcano Global Risk Identification and Analysis Project, and the Volcanoes of Japan databases (Figure 2). The Smithsonian GVP contains data on the 1,508 Holocene volcanoes in the world (Siebert et al., 2010). The VOGRIPA database was developed using the Large Magnitude Explosive Volcanic Eruptions (LaMEVE) database, which contains data on global eruptions with a magnitude of 4 or greater dating back to the start of the Quaternary (Crosweller et al., 2012). The VOGRIPA currently contains data on 2,672 Quaternary volcanoes and over 1,800 eruption records. The Volcanoes of Japan database contains data on 455 Quaternary volcanoes in Japan.
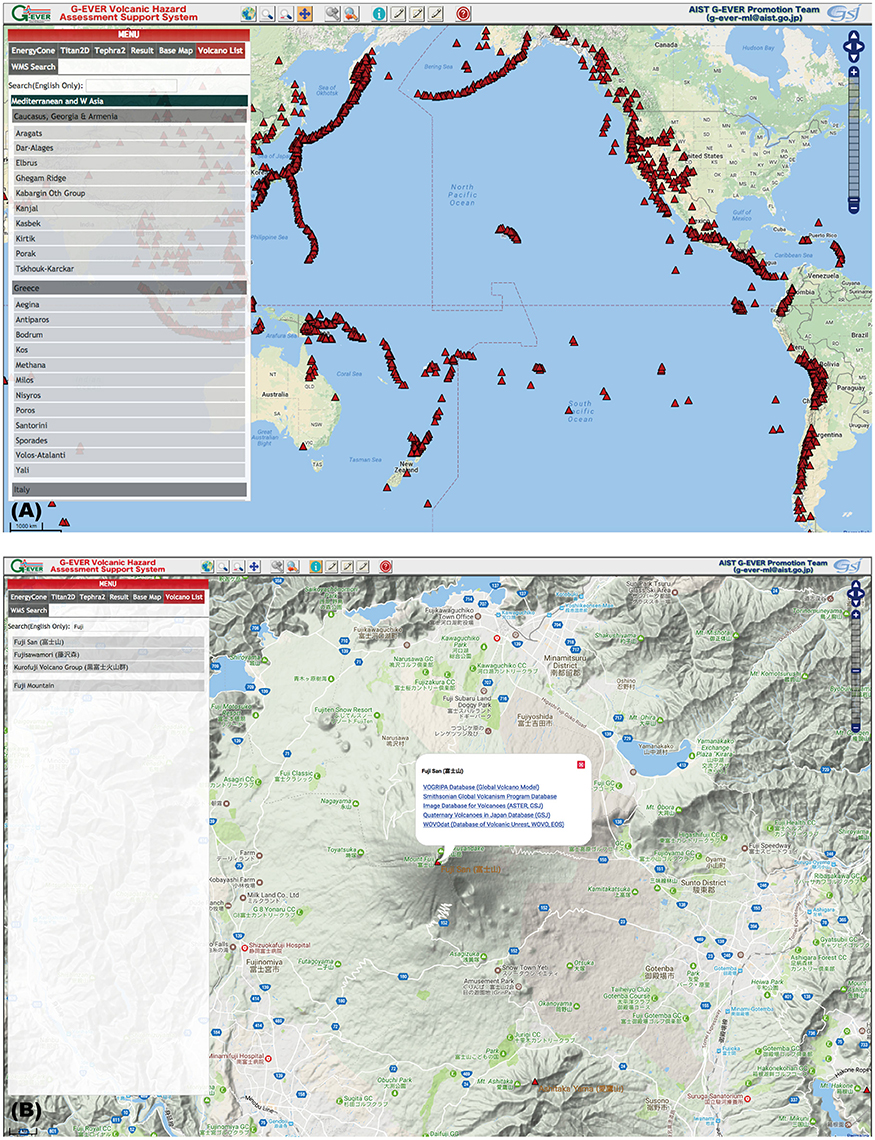
Figure 2. Quaternary volcanoes search system. (A) Search menu on VHASS categorized by region. (B) Search system by volcano name and links to major volcano databases.
The list and the distribution of all the identified Quaternary volcanoes from these databases are shown in the volcano list menu and on the Google map (Figure 2A), respectively. The volcano list is categorized by region as provided by the Smithsonian GVP database, such as Mediterranean and W. Asia, Africa and Red Sea, Middle East and Indian Ocean, New Zealand to Fiji, Melanesia and Australia, Indonesia, and Philippines and SE Asia. A search window is available above the volcano list which can be used to search for a particular volcano, that is, when a user enters a volcano name (e.g., Fuji), the candidate volcanoes will be shown in the list (Figure 2B). When the user chooses a volcano from the list, the volcano will be directly shown on the map. The user can directly zoom in to a volcano, if its location is known.
The available base maps that can be utilized are Google maps (satellite, street, and physical), Bing maps (aerial), Landsat and MODIS satellite images and ASTER GDEM. The 1:200,000 Seamless Geological Map of Japan and the 1:25,000 topographic map of Japan (Geospatial Information Authority of Japan) can also be shown (Figure 3). External maps which are provided as Web Map Service (WMS) can also be displayed on the map. Many base maps are available for volcanic hazard assessments by volcanic gravity flows and tephra falls using the VHASS, which provide more information when overlaid with the simulation results.
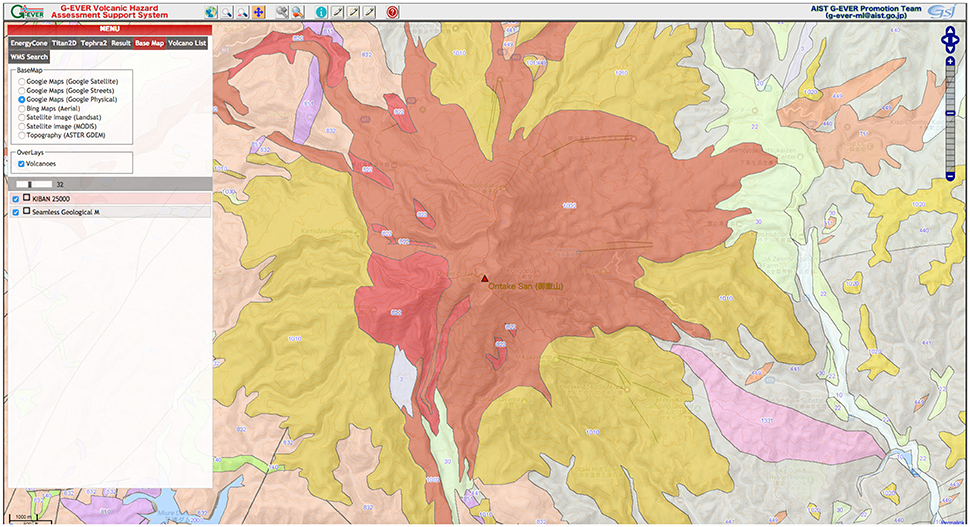
Figure 3. Available base maps on the VHASS system. The 1:200,000 seamless geological map of Japan and the 1:25,000 topographic map of Japan are overlain on the Google maps (physical) covering Japan.
Links to Major Volcanic Databases
The eruption chronology and volcanic databases are key information for hazards assessment and risk mitigations. There are many volcano databases in the world, but currently most of them are isolated and not connected to and with each other. The VHASS provides direct links to major volcanic databases such as VOGRIPA, Smithsonian GVP, Image database for volcanoes, Quaternary volcanoes in Japan (Volcanoes of Japan) and WOVOdat for each volcano (Figure 2B). The users can review up-to-date information, such as eruption chronology, type and scale, satellite images, geophysical monitoring data, and precursors to an eruption of a specific volcano using the direct link system on the VHASS.
The image database for volcanoes is the ASTER-satellite image database provided by the Geological Survey of Japan (https://gbank.gsj.jp/vsidb/image/index-E.html). The image database covers 964 volcanoes in the world which provides a series of VNIR (visible and near-infrared) and TIR (thermal infrared) sensor images and DEM data. The WOVOdat is a comprehensive global database on volcanic unrests aimed at understanding pre-eruptive processes and improving eruption forecasts (http://www.wovodat.org/). The WOVOdat is provided by the WOVO (World Organization of Volcano Observatories), which contains 233 volcanoes with monitoring data, and is presently hosted by EOS (Earth Observatory of Singapore).
Based on these volcano databases, the user could collect basic information on volcanic eruption chronology, aerial distributions of past major volcanic products, and precursor events. The VHASS can also enable users to estimate future possible eruptive scenarios using simulation modeling. The simulation results should always be calibrated and validated based on the past volcanic events (e.g., distributions, arrival time and deposit thickness), which are mainly available from these linked databases and cited references.
Energy Cone Simulation
Features of Energy Cone Simulation System
The volcanic gravity flow simulation using Energy Cone model is available on VHASS. The Energy Cone model is simple but a powerful volcanic hazard assessment tool, which is widely used in the world. The Energy Cone model, which was initially formulated by Malin and Sheridan (1982), is a 3D extrapolation of the energy line (Heim, 1882; Figure 4). The angle of the energy line, which controls the mobility of the volcanic gravity flow, is expressed by the ratio of relative height (H) and lateral travel distance of the volcanic gravity flow (L). Only two parameters, H/L ratio and column collapse height (Hc; height of collapsing column above the vent) are required for hazard assessment using the Energy Cone model. The Energy Cone model is applicable to major volcanic gravity flows, including pyroclastic flows (both dome-collapse and fountain-collapse types), debris avalanches and lahars.
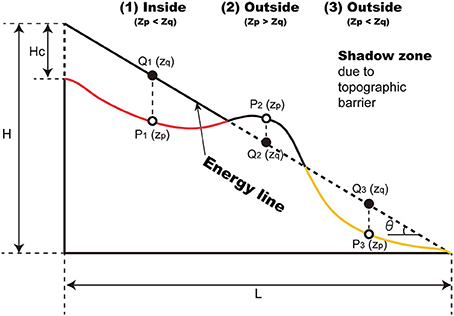
Figure 4. Concept of Energy line model. Relative height (H), lateral travel distance (L) and Column collapse height (Hc) are shown. If the energy line position is higher than the topography, the area can be affected by volcanic gravity flows (case 1). If the energy line position is lower than the topography, the area is assumed not to be affected by volcanic gravity flows (case 2). The shadow zone, where the lee side of the topographic barrier is located and the energy line is higher than the topography, can be evaluated using VHASS (case 3).
Determining the possible range of H/L ratios of volcanic gravity flows in the world is possible. The H/L ratios of compiled all debris avalanche deposits in Japan range between 0.2 and 0.06 (Ui, 1983; Ui et al., 1986). The H/L ratio of compiled non-volcanic debris avalanches, volcanic debris avalanches, and pyroclastic flows in the world ranges from 0.58 to 0.08, 0.21 to 0.05, and 0.52 to 0.04, respectively (Hayashi and Self, 1992). The user can choose H/L ratios of the volcanic gravity flows based on their type and volume. The observed H/L ratios of the Unzen 1991 block-and-ash flows in Japan range from 0.4 to 0.2 (Takarada et al., 1993; Figure 5). The H/L ratio (mobility) of larger-volume events tend to be smaller (volume of 106 m3 was about 0.2–0.3 and 104 m3 was about 0.4). The column collapse height (Hc) is relatively difficult to choose. If Hc is too high, most of the areas including high regions are covered by the affected area of volcanic gravity flows. The user could evaluate the possible runout distances and the affected area of the volcanic current on a map by adjusting the H/L ratio and Hc.
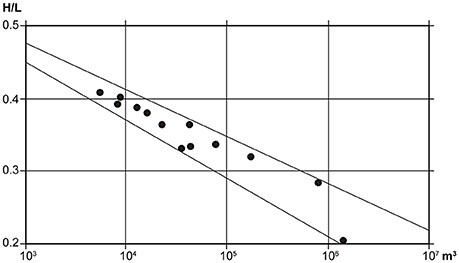
Figure 5. Relation between H/L ratio and volume of Unzen block-and-ash flows, Japan from May 25 to June 8, 1991 (after Takarada et al., 1993). The H/L ratio of 104 m3 PDC is about 0.4. The H/L ratio of 106 m3 PDC is about 0.3–0.2. The larger PDC shows smaller H/L ratio (higher mobility).
On the VHASS system, the user may initially choose a DEM on the Energy Cone menu (Figure 6A). The ASTER Global Digital Elevation Model (ASTER GDEM; https://asterweb.jpl.nasa.gov/gdem-wist.asp), covering from 83° northern latitude to 83° southern latitude at 30 m resolution, and 10 m resolution of the Geospatial Information Authority of Japan, which covers the Japan area, are available. The VHASS provides original graphical input interface. On other simulation tools, users normally have to enter coordinate values (longitude and latitude) of the simulation areas and start points manually. The location of the volcanic vent can be identified on the topographic map or satellite images through a click of the mouse after choosing the calculation point icon, which determines the longitude and latitude values automatically. The input parameters column collapse height (Hc), minimum and maximum cases of H/L ratios and interval of H/L ratios are entered in the boxes. Unlike other Energy Cone tools, VHASS can evaluate many scenarios in a single run, which makes the minimum and maximum H/L ratios necessary. The VHASS also provides an original function for the user to choose whether to include shadow zone or not (Figure 4, case 3), which determine whether the area by the curve of the valley might be affected by gravity flows or not.
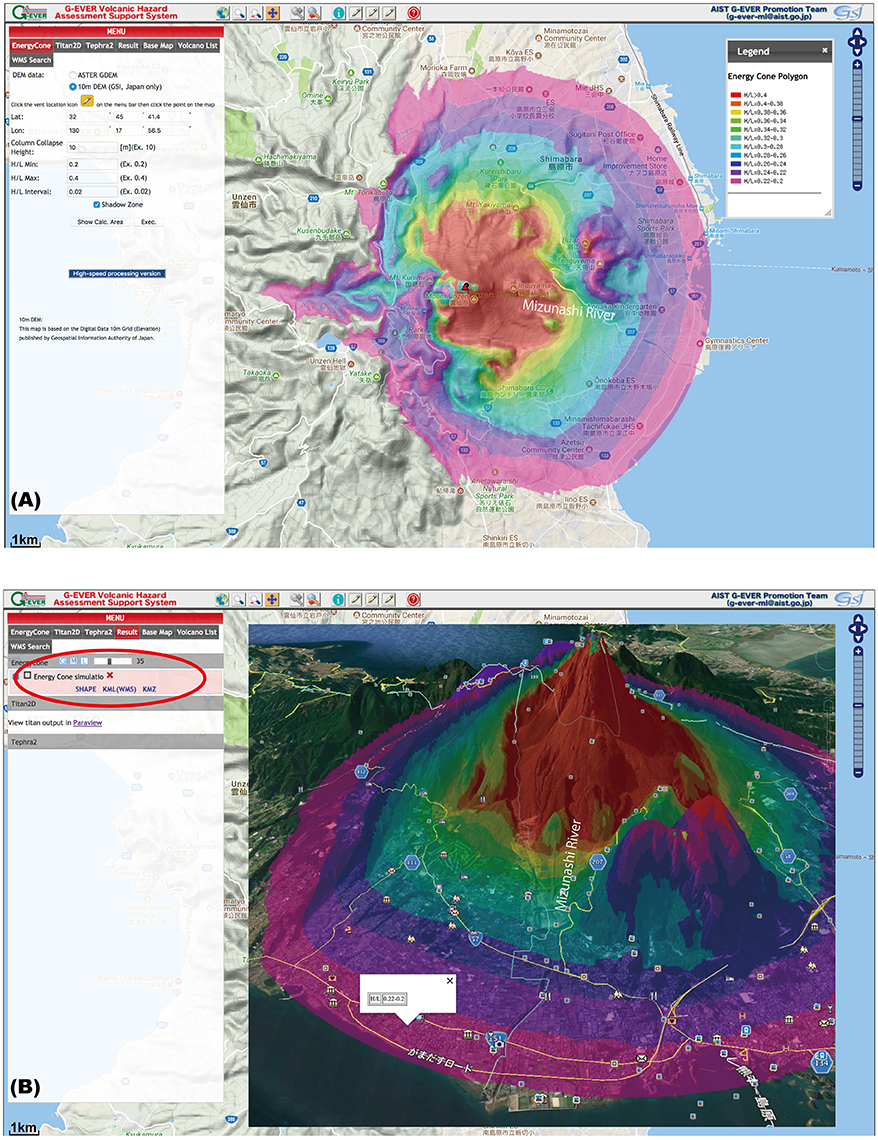
Figure 6. An energy-cone simulation result at Unzen Volcano, Japan, using VHASS. (A) Energy Cone simulation menu with the result of the simulation displayed on the map. (B) Eastern view of the simulation result in 3D using Google Earth. The result can be downloaded as Shape, KML (using Web Map Service) and KMZ files. The users can evaluate detailed volcanic hazards assessments using GIS software and Google Earth overlaying the simulation result on maps showing roads, buildings, and evacuation sites.
It should be noted that the area shown by the energy cone simulation indicates the “potentially” affected area by gravity flows. The gravity flows usually affect only parts of the area that is covered by the simulation (e.g., descending along several valleys). The WebGIS and OGC's WMS, WPS, WCS, and DEM data are used to execute the simulation and display the results on the maps online.
The energy cone simulation needs only two parameters (H/L and Hc) and calculation time is relatively short (normally less than a minute). The fast calculation version (http://g-ever1.org/quick/index_en.html) is also provided. The user could assess affected areas (runout distances) by volcanic gravity flows by conducting as many simulations as possible with changing parameters and vent positions. The energy cone simulation could map possible potentially affected area, which is suitable for the creation or revision of hazard maps and real-time hazard mapping. However, this model is not considering volcanic gravity flow dynamics. Therefore, careful assessment is highly recommended [e.g., detachment of surge portion from pyroclastic density currents (PDCs)].
Application of Energy Cone Simulation
Figure 6A shows the simulation results at Unzen Volcano, Japan. The transparency of the results of the energy cone simulation is increased and overlain over the Google maps. The results can also be downloaded as Shape file (GIS data), KML (WMS image), and KMZ vector files using the result menu (Figure 6B). More detailed examinations and validations of simulation results using GIS software (e.g., ArcGIS, QGIS) and Google Earth are possible. Overlaying the simulation results on roads, buildings and evacuation sites using GIS software and Google Earth are useful for hazard assessments (Figure 6B).
The energy cone simulation results (Figures 6A,B) suggest that if the current Heisei-Shinzan lava dome at the summit area would be activated again, it would produce block-and-ash flows to ESE direction (same as the early-stages of the 1991–95 activities), the 104 m3-scale block-and-ash flow (H/L is about 0.4) would travel about 2.9 km from the source (red-colored region) and the 106 m3-scale block-and-ash flow (H/L = 0.3–0.2) would travel about 4.6–7.3 km from the source (pale-blue to red-purple region; indicating it may reach to the coast line).
Titan2D Simulation
Features of Titan2D Simulation System
The notable geophysical mass flow model, Titan2D simulation (Patra et al., 2005), is available on VHASS. The Titan2D model is one of the essential volcanic hazards assessment tools for volcanic gravity flows. Titan2D is suitable for volcanic mass flows, including dome-collapse type pyroclastic flows and debris avalanches. However, it is not suitable for assessment of dilute turbulent PDCs (e.g., pyroclastic surges), because it is based on a mass flow model. The Titan2D is useful to simulate a specific, well-known event, but not a hazard map, which normally shows all possible inundation areas (larger than a specific single event).
Almost all Quaternary volcanoes in the world can be evaluated using Titan2D. The users can also upload a more detailed DEM in Geotiff format like LIDAR data. The simulation area can be identified by dragging the mouse on the base map after clicking the area icon (Figure 7A). The piles, flux sources and discharged planes can be assigned. Parameters for the simulation, such as length of scale, maximum number of time steps (e.g., 2,000–4,000), maximum time, internal friction angle (e.g., 30–35°) and bed friction angle (e.g., 8–20°) will be entered in the input boxes manually (Figure 7A). The runout distance is particularly sensitive to change in bed friction angle. If the maximum time is too short, the simulation ends, even if the volcanic current is still moving.
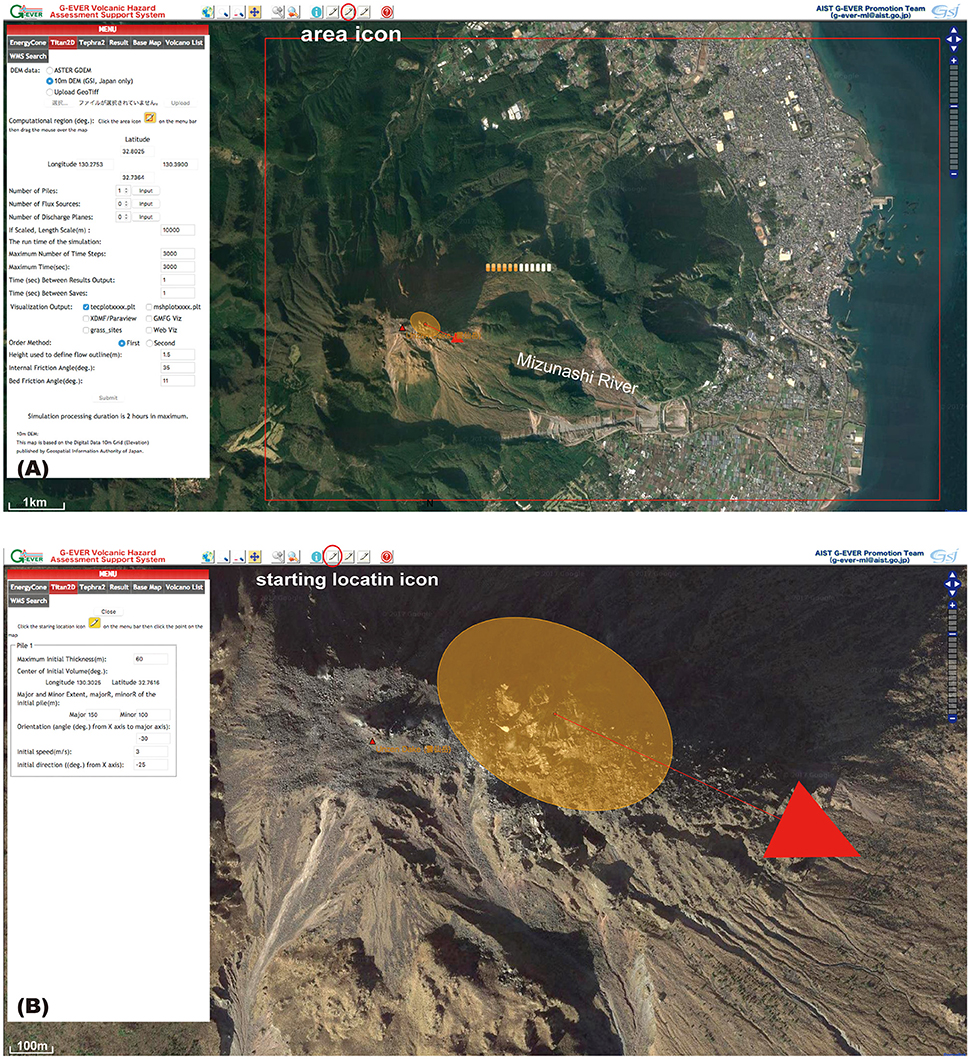
Figure 7. Titan2D simulation at Unzen Volcano, Japan on the VHASS system. (A) Titan2D simulation menu on VHASS. The red square indicates a simulation calculation area. (B) The pile location, size (major and minor extent), elongation angle, the initial velocity and direction are visualized on Google maps.
The graphical input parameter menu, where users can check the locations of starting mass on topographic map and/or satellite images, is one of the advantages of the VHASS. The users have to enter the UTM coordinate values manually in the original Titan2D simulation system. In the pile input parameter menu, the values of maximum initial thickness, major and minor extent, orientation angle (from x axis to major axis), initial speed and initial direction (from x axis) of the pile are entered in the input boxes manually. The location of the pile center can be selected by clicking the mouse over the selected point after choosing the starting location icon (Figure 7B). Based on these parameter values, the elongated pile extent, initial collapse direction and speed (shown as arrow length) are displayed on the map (Figure 7B). The user can determine the position, extent of the pile, initial starting direction and speed on the map. The visual display of area affected by volcanic gravity flows is sensitive to the size of the pile, initial collapse direction and speed. The column-collapse type pyroclastic flow simulation parameters can be assigned using the number of flux sources menu.
The simulation result can be downloaded using the result tab. The downloaded data can be displayed using a visualization software, such as Paraview. The file in tecplot format can be converted into GIS format (e.g., Shapefile), which can then be analyzed using a GIS software for hazards assessment. The GIS format data is also useful for validation, comparing simulation results and actual observations of volcanic gravity flows (e.g., distribution, thickness and time sequences).
The Titan2D simulation could assess possible affected areas based on volcanic gravity flow dynamics (depth-averaged shallow-water granular flow model). If the user needs to assess the affected area of a specific event, this method is suitable. However, this simulation needs many parameters and more computing time. Therefore, Titan2D is not suitable for emergency cases, but better to be used for pre-analysis-type hazard assessments and hazard map improvement.
Application of Titan2D Simulation
Figure 8A shows a Titan2D simulation result of the Unzen June 3, 1991 block-and-ash flow (Yamamoto et al., 1992; Takarada et al., 1993) shown on Paraview using a pre-eruption DEM at 10 m resolution. The collapsed lava dome (pile) size was 150 m (major extent) × 100 m (minor extent) × 50 m (height) (about 1.2 × 10⁶ m3) based on the observation of collapsed lava dome size (Takarada et al., 1993). The internal friction was 33°, basal friction was 11° and initial velocity was 5 m/s. The distribution was confined within the Mizunashi River. The maximum thickness of the deposit was about 9.3 m. The yellow-lines in the River indicate the observed June 3, 1991 block-and-ash deposit. The simulation result fits well with the lower-stream part of the deposit. It is impossible to find appropriate parameter values that will result in a distribution fitting both the upper-stream and lower-stream distributions of the final deposits. The Titan2D's usage of the mass flow model is probably the main reason for the discrepancy, which does not reflect on the more detailed processes such as progressive aggradation depositional processes (Branney and Kokellar, 1992, 2002). It is assumed that the Titan2D's performance can be improved if the more detailed depositional processes are incorporated into the system. Another possibility is the limitation of frictional rheological law (constant basal friction value) used by Titan2D as discussed by Kelfoun et al. (2009) for a pyroclastic flow simulation at Tsungurahua volcano, Ecuador.
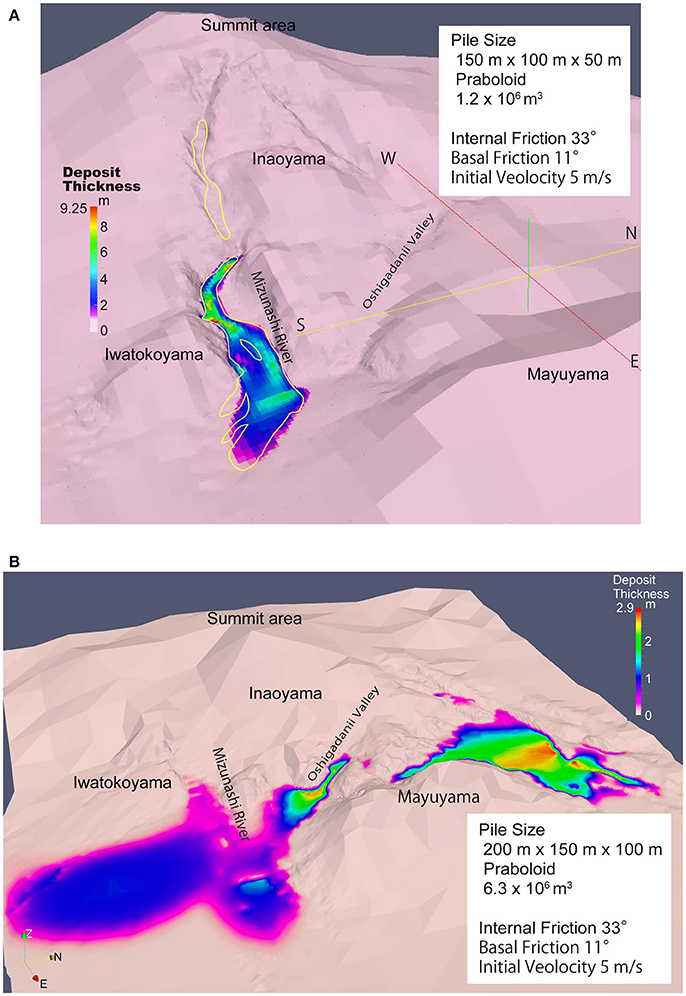
Figure 8. Titan2D simulation results of the Unzen block-and-ash flows. (A) The result of the June 3, 1991 event. The yellow lines indicate the observed distribution of the deposit. The collapsed pile size was 150 × 100 × 50 m (1.2 × 10⁶ m3). The internal and basal frictions were 33° and 11°, respectively. A pre-eruption DEM was used for the simulation. Please note that the DEM is only shown in detail at 10 m resolution in and around the deposit (to minimize the simulation time). (B) A large-scale simulation result of Unzen block-and-ash flow. The collapsed pile size was 200 × 150 × 100 m (6.3 × 10⁶ m3). The internal and basal frictions were 33° and 11°, respectively. The present DEM at 10 m resolution was used. The block-and-ash flow deposit distributes a wider area (not only confined in the Mizunashi River, but also in the Oshigadani Valley, NE and SE flank regions). Parallel lineaments in the deposits in the Mizunashi River are caused by the presence of artificial dikes.
Figure 8B shows the Titan2D simulation result of large-scale Unzen block-and-ash flows. The collapsed lava dome (pile) size was 200 m (major extent) × 150 m (minor extent) × 100 m (height) (about 6.3 × 10⁶ m3). The internal friction was 33°, basal friction was 11° and initial velocity was 5 m/s. The present DEM data at 10 m resolution was used. If the initial dome collapse volume is about 5.3 times larger than the June 3, 1991 event, the affected area becomes much larger including the portion along Oshigadani Valley to farther downstream areas in the SE and NE directions. The deposits are thinner (<2.9 m). Based on the results, future PDC hazard assessments such as velocities, path, distribution area and deposit thickness are possible using Titan2D simulations on VHASS.
Tephra2 Simulation
Features of Tephra2 Simulation System
The widely-used, advection-diffusion type, tephra fall simulation model, Tephra2 (Bonadonna et al., 2005; Connor, 2006), is available on VHASS. The thickness and grain size distributions of the tephra deposit in grid-type data are obtained using Tephra2. Comparison between the deposit and simulation results are possible using this model. Several inversion studies have been made recently (e.g., Mannen, 2014; Magill et al., 2015). The Tephra2 model is suitable for relatively small-scale tephra falls, because wind directions and speeds are defined only at the vent position.
The Tephra2 code implemented on VHASS is a modified version developed by Mannen (2014). The grain size distribution of released particles is assumed to be Gaussian and users are only allowed to assign the median grain size and standard deviation in the original version. On the other hand, the modified version allows users to give arbitrary grain size distributions of released particles. The grain size parameter and the wind file (height in meter, wind speed in m/s, and wind direction in degrees: the wind direction is along the wind vector) can be uploaded using the menu (Figure 9A). The wind data is available from the Department of Atmospheric Science, University of Wyoming (http://weather.uwyo.edu/upperair/sounding.html) and the 2.5° world-wide reanalysis wind data is available from the NOAA website (https://www.esrl.noaa.gov/psd/data/gridded/data.nmc.reanalysis.html). But the NOAA's 3D reanalysis data have to be converted into 1D data.
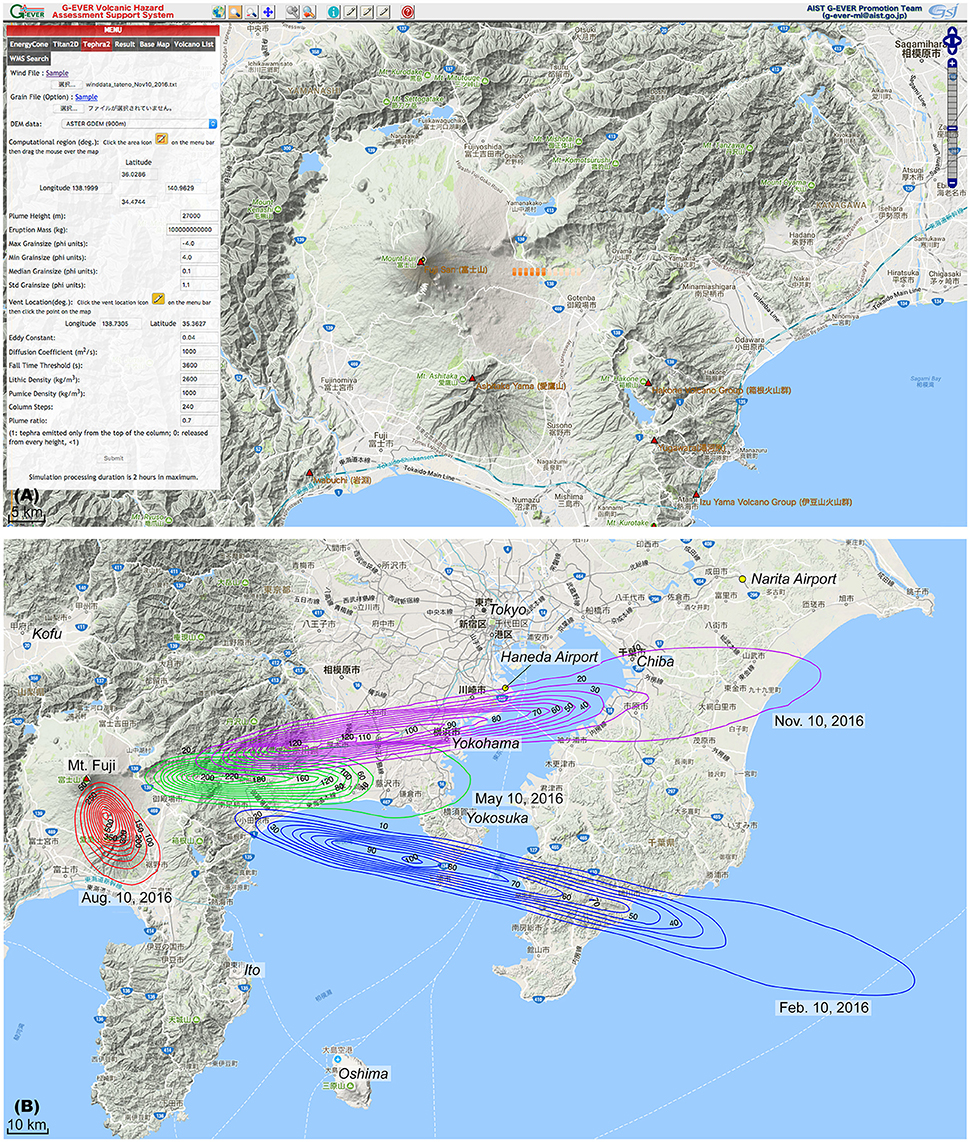
Figure 9. Tephra2 simulation at Fuji Volcano, Japan on the VHASS system. (A) Tephra2 simulation menu. (B) Isomass contour maps created using GIS software and four wind data at 9:00 a.m. on Feb. 10 (blue), May 10 (green), Aug. 10 (red), and Nov. 10 (purple), 2016 are shown on a Google map (kg/m2). Locations of Haneda and Narita Airports are reported.
The DEM data can be selected from ASTER GDEM (300, 600, and 900 m in grid size resolutions; covering from 83° north to south latitude of the globe) and GSI DEM (Geospatial Information Authority of Japan; 100, 200, and 300 m in grid size resolutions, resampled from 10 m DEM; Japan area only). Smaller grid size resolutions enable the assessment of the deposit thickness and grain size data in each grid point in detail, but the possible assessment area will be smaller. The user should choose an appropriate grid size according to the target area of the simulation. If the eruption size and wind speed are small, the 100–300 m grid sizes are suitable. On the other hand, if the eruption scale and wind speed are large, the 300–900 m grid sizes are suitable.
The simulation area can be identified by dragging the mouse on the base map after clicking the area icon. The vent location is determined by clicking the mouse on the map after choosing the starting location icon. The input parameters such as plume height, eruption mass, grain size, eddy constant, diffusion coefficient, and plume ratio, are entered in the input boxes. The aerial distributions and thickness of tephra fall deposits are sensitive to the values of plume height, eruption mass, diffusion coefficient, and plume ratio. The simulation results in shapefile and text file formats can be downloaded using the result tab. An isomass contour map can be drawn using a GIS software (e.g., QGIS; Figure 9B). The contour and grid data in GIS format are useful to validate the simulation results, with actual field observations (e.g., distributions, thickness, and grain size distributions at each grid points).
Application of Tephra2 Simulation
Figure 9B shows Tephra2 simulation results for Fuji volcano. Wind data were obtained from the past wind data archive (http://www.data.jma.go.jp/obd/stats/etrn/) provided by the Japan Metrological Agency. The wind data at Tateno station, located in Tsukuba city (50 km NE of Tokyo), were used. Four wind data were selected at 9:00 on Feb. 10, May 10, Aug. 10, and Nov. 10, 2016 as representative for the winter, spring, summer, and autumn periods, respectively. The DEM data at 900 m resolution was selected, because the study area was relatively large. The summit crater was selected as the vent position. The values of the used parameters are following:
plume height = 27,000 m
eruption mass = 1.0 × 10¹¹ kg
maximum grain size = −4.0 phi
minimum grain size = 4.0 phi
median grain size = 0.1 phi
standard grain size = 1.1 phi
eddy coefficient = 0.04
diffusion coefficient = 1,000 m2/s
fall time threshold = 3,600 s
lithic density = 2,600 kg/m2
pumice density = 1,000 kg/m2
column steps = 240
plume ratio = 0.7
The estimated plume height of the Hoei eruption (AD1707) was 20–28 km (Connor et al., 2009; Mijyaji et al., 2011). The estimated eruption mass of Hoei eruption in each phase (I, II, III, and IV) was 1.0 - 6.2 × 10¹¹ kg (Mijyaji et al., 2011). The plume ratio of 0.7 indicates that pyroclastics were released from the upper 30% of the eruption column.
The Feb. 10, 2016 simulation result indicates that the tephra fall deposit was distributed toward ESE and the 10 kg/m2 isomass contour reached as far as 200 km from the source due to strong winter wind (e.g., 69 m/s at 14,000 m a.s.l.). The maximum isomass contour (100 kg/m2) is located 80 km ESE from the source. The Tephra2 simulation is based on advection-diffusion model, hence the maximum isomass contour area is shifted far away from the source, especially in case of strong winds. In the real eruption case, much thicker pyroclastic materials are accumulated in and around the volcano due to ballistics, partial collapse of eruption column, pyroclastic density current deposit, and direct fallout from the side of the eruption column, placing the maximum isomass area (thickest part) near the source area (Takarada et al., 2016b). The May 10, 2016 simulation result indicates that the tephra fall deposit is distributed toward the east and the 20 kg/m2 isomass contour area reaches as far as 87 km from the source (near Yokohama). The maximum isomass contour (220 kg/m2) is located at 30 km east from the source. The Aug. 10, 2016 simulation result indicates that the tephra fall deposit is distributed toward SSE and a relatively thick deposit is accumulated near the volcano. The maximum isomass contour (600 kg/m2) is located at 9 km SSE from the source. The Nov. 10, 2016 simulation result indicates that the tephra fall deposit is distributed toward ENE and the 10 kg/m2 isomass contour area reaches as far as 165 km from the source. The expected amount of the tephra fall deposit ranges from 1.7 and 40 kg/m2 at the Haneda Airport and from 0.4 and 1.9 kg/m2 at the Narita Airport (grid data in the airport area were used for estimation). The maximum isomass contour area (120 kg/m2) is located at 55 km ENE from the source. Impacts due to large amount of volcanic tephra fall in urban area are critical, such as on transportations (especially aircrafts) and power supply (e.g., Jenkins et al., 2015; Wilson et al., 2015). These tephra fall volcanic hazard assessments may be important for the risk mitigation of future Mt. Fuji eruptions.
Discussion
Advantages of VHASS
The advantages of using VHASS are the following: (1) it provides a user-friendly interface, which does not require any complex installation procedure and Unix command operation; (2) it is developed based on WebGIS technology, which make it easy to compare the simulation results with other maps; (3) it is implemented using a volcano search system and digital elevation model covering almost all 2790 Quaternary volcanoes in the world; (4) it provides up-to-date information, such as chronology, type and scale, satellite images, geophysical monitoring data, and precursors to an eruption of a specific volcano, using the direct link system to major volcano databases; (5) it provides 3 notable deterministic simulation models, such as Energy Cone, Titan2D and Tephra2, which can estimate affected area caused by major volcanic events such as pyroclastic flows, debris avalanches, lahars and tephra falls; (6) it is useful for real-time hazards assessment and revision of volcanic hazard maps; (7) it provides easy to understand graphical input interface (e.g., simulation area and start point are assigned on a map or satellite image); (8) the mainstream base maps are accessible (e.g., Google satellite and street maps); (9) it provides useful data download wherein the user can choose different data types (e.g., kml and shape files); and (10) it is built on a freely available open-access system.
The VHASS users only need a browser and internet connection, therefore many researchers could use this system, including observatory staff in developing countries and undergraduate students who are interested in volcanic hazards assessment. It is suitable for real-time hazard assessment and revision of volcanic hazard maps. Vhub (Palma et al., 2014) provides an online simulation system for Titan2D and Tephra2. However, the users conducting the online numerical simulations on Vhub must prepare the DEM data by themselves. On the other hand, VHASS provides the needed DEM data and graphical input parameter assisting system (e.g., the pile positions and initial speed and directions on Titan2D). Online user-friendly interface and functions are necessary for an easy to use and highly accessible volcanic hazard assessment system. However, it is highly recommended to consult with specialists when simulation results are used on real hazards assessments.
Future Plan
The future version of VHASS provides the capability to display simulation results of Titan2D and Tephra2 directly on the online maps using WebGIS. It will also implement other tephra fall online numerical simulations such as Hazmap, Puff and Fall3D. Tools that processes wind reanalysis data, lava flow and lahar simulation (e.g., Downflow; Tarquini and Favalli, 2011; LaharZ; Schilling, 2014) will also be implemented on VHASS.
The VHASS is currently providing deterministic hazard assessment tools to make the system less computationally expensive and maximize the number of users online. The computationally expensive yet accurate probabilistic volcanic hazard assessment tools (e.g., PyBetVH, Tonini et al., 2015; HASSET, Sobradelo et al., 2014) will also be implemented in the future. Making hazard curves of potential hazards at selected points is also one of the important features to be included on VHASS.
Conclusions
The VHASS is a user-friendly, WebGIS-based, open-access online system for potential hazards assessment and risk mitigation of Quaternary volcanoes in the world. It also provides a user-friendly interface, developed based on WebGIS technology, implements useful volcano search system and provides digital elevation model covering all Quaternary volcanoes in the world. The system also provides direct links to major volcano databases and 3 notable deterministic simulation models such as Energy Cone, Titan2D and Tephra2. It also provides user friendly graphical input interface and data download system. The system is developed for all potential users in the world who need volcanic hazards assessment tools.
Author Contributions
The author confirms being the sole contributor of this work and approved it for publication.
Conflict of Interest Statement
The author declares that the research was conducted in the absence of any commercial or financial relationships that could be construed as a potential conflict of interest.
Acknowledgments
The author acknowledges the assistance and support provided by the members of the G-EVER Promotion Team in GSJ, AIST during the development of VHASS system. He would also like to give special thanks to Dr. Joel Bandibas of GSJ, AIST and Mr. Nils Steinau for setting up the system's volcano database. He is also thankful to Dr. Bandibas and Mr. Nils Steinau for checking the English of the manuscript. Also the Orkney and CTC for providing the computer programming needs of the VHASS system using OGC technology. Dr. Shinsuke Kodama of GSJ, AIST and Dr. Kazutaka Mannen for providing the programming codes for the Energy Cone and the revised Tephra2, respectively. Mr. Yoshinaru Nishioka and Mrs. Juri Nagatsu of GSJ, AIST developed the fast calculation version of Energy Cone simulation system. The author also would like to thank the Japan Space Systems and the Geospatial Information Authorities of Japan for providing the ASTER Global DEM and the 10-m resolution DEM, respectively. The funding to develop the VHASS system was provided by GSJ, AIST. The author is also grateful for the detailed comments from two reviewers, Pablo Samaniego and Susanna Jenkins, and chief editor, Valerio Acocella, who allowed him to improve the manuscript.
References
Bartolini, S., Sobradelo, R., and Marti, J. (2016). ST-HASSET for volcanic hazard assessment: a python tool for evaluating the evolution of unrest indicators. Comput. Geosci. 93, 77–87. doi: 10.1016/j.cageo.2016.05.002
Becerril, L., Bartolini, S., Sobradelo, R., Marti, J., Morales, J. M., and Galindo, I. (2014). Long-term volcanic hazard assessment on El Hierro (canary islands). Nat. Hazards Earth Syst. Sci. 14, 1853–1870. doi: 10.5194/nhess-14-1853-2014
Bonadonna, C., Connor, C. B., Houghton, B. F., Connor, L., Byrne, M., Laing, A., et al. (2005). Probabilistic modeling of tephra-fall dispersal: hazard assessment of a multiphase rhyolitic eruption at Tarawera, New Zealand. J. Geophys. Res., 110:B03203. doi: 10.1029/2003JB002896
Branney, M. J., and Kokellar, P. (1992). A reappraisal of ignimbrite emplacement: progressive aggradation and changes from particulate to non-particulate flow during emplacement of high-grade ignimbrite. Bull. Volcanol. 54, 504–520. doi: 10.1007/BF00301396
Branney, M. J., and Kokellar, P. (2002). Pyroclastic Density Currents and the Sedimentation of Ignimbrite. London: The Geological Society London.
Connor, C. B. (2006). “Inversion is the solution to dispersion: understanding eruption dynamics by inverting tephra fallout,” in Statistics in Volcanology, eds H. M. Mader, S. Coles, C. B. Connor, and L. J. Connor (London: Geological Society of London), IAVCEI1, 231–242.
Connor, L. J., Koyama, M., and Maejima, Y. (2009). “Estimation of the height of eruption column of the 1707 Hoei eruption of Fuji Volcano, Japan based on historical documents and CG scenery reconstruction,” in The Volcanological Society of Japan, Fall Meeting (Odawara), Abstract, (in Japanese).
Costa, A., Macedonio, G., and Folch, A. (2006). A three-dimensional Eulerian model for transport and deposition of volcanic ashes. Earth Planet. Sci. Lett. 241, 634–647. doi: 10.1016/j.epsl.2005.11.019
Crosweller, H. S., Arora, B., Brown, S. K., Cottrell, E., Deligne, N. I., Natalie Ortiz Guerrero, N. O., et al. (2012). Global database on large magnitude explosive volcanic eruptions (LaMEVE). J. Appl. Volcanol. 1:4. doi: 10.1186/2191-5040-1-4
Folch, A., Costa, A., and Macedonio, G. (2009). Fall3D: a computational model for transport and deposition of volcanic ash. Comput. Geosci. 35, 1334–1342. doi: 10.1016/j.cageo.2008.08.008
Granados, H. D., Guzman, R. R., Befitex, J. L. V., and Sanchez, T. G. (2012). VOLCWORKS: a suite for optimization of hazards mapping. EGU Gen. Assem. Abstr. 14, EGU2012–EGU12809.
Hayashi, J. N., and Self, S. (1992). A comparison of pyroclastic flow and debris avalanche mobility. J. Geophys. Res. 97, 9063–9071. doi: 10.1029/92JB00173
Jenkins, S. F., Wilson, T. M., Magill, C., Miller, V., Stewart, C., Marzocchi, W., et al. (2015). “Volcanic ash fall hazards and risk,” in Global Volcanic Hazards and Risk, eds S. C. Loughlin, S. Sparks, S. K. Brown, S. F. Jenkins, and C. Vye-Brown (Cambridge: Cambridge University Press), 173–221. doi: 10.1017/CBO9781316276273.005
Kelfoun, K., and Druitt, T. H. (2005). Numerical modeling of the emplacement of socompa rock avalanche, chile. J. Geophys. Res. 110:B12202, doi: 10.1029/2005JB003758
Kelfoun, K., Samaniego, P., Palacios, P., and Barba, D. (2009). Testing the suitability of frictional behavior for pyroclastic flow simulation by comparison with a well-constrained eruption at Tungurahua volcano (Ecuador). Bull. Volcanol. 71, 1057–1075 doi: 10.1007/s00445-009-0286-6
Loughlin, S. C., Sparks, S., Brown, S. K., Jenkins, S. F., and Vye-Brown, C. (2015). Global Volcanic Hazards and Risk. Cambridge: Cambridge University Press.
Macedonio, G., Costa, A., and Longo, A. (2005). A computer model for volcanic ash fallout and assessment of subsequent hazard. Comput. Geosci. 31, 837–845. doi: 10.1016/j.cageo.2005.01.013
Magill, C., Mannen, K., Connor, L., Bonadonna, C., and Connor, C. (2015). Simulating a multi-phase tephra fall event: inversion modelling for the 1707 Hoei eruption of Mount Fuji, Japan. Bull. Volcanol. 77:81 doi: 10.1007/s00445-015-0967-2
Mannen, K. (2014). Particle segregation of an eruption plume as revealed by a comprehensive analysis of tephra dispersal: theory and application. J. Volcanol. Geotherm. Res. 284, 61–78. doi: 10.1016/j.jvolgeores.2014.07.009
Malin, M. C., and Sheridan, M. F. (1982). Computer-assisted mapping of pyroclastic surges. Science 13, 637–640. doi: 10.1126/science.217.4560.637
Martí, J., Bartolini, S., and Becerril, L. (2016). Enhancing safety in a volcano's shadow. EOS 97. doi: 10.1029/2016EO054161
Marzocchi, W., Sandri, L., and Selva, J. (2010). BET_VH: a probabilistic tool for long-term volcanic hazard assessment. Bull. Volcanol. 72, 705–716. doi: 10.1007/s00445-010-0357-8
Mijyaji, N., Kan'no, A., Kanamori, T., and Mannen, K. (2011). High-resolution reconstruction of the Hoei eruption (AD 1707) of Fuji volcano, Japan. J. Volcanol. Geotherm. Res. 207, 113–129. doi: 10.1016/j.jvolgeores.2011.06.013
Neri, A., Aspinall, W. P., Cioni, R., Bertagnini, A., Baxter, P. J., Zuccaro, G., et al. (2008). Developing an Event Tree for probabilistic hazard and risk assessment at Vesuvius. J. Volcanol. Geotherm. Res. 178, 397–415. doi: 10.1016/j.jvolgeores.2008.05.014
Newhall, C. G., Costa, F., Ratdomopurbo, A., Venezky, D. Y., Widiwijayanti, C., Nang Thin Zar, W., et al. (2017). WOVOdat – an online, growling library of worldwide volcanic unrest. J. Volcanol. Geotherm. Res. 345, 184–199. doi: 10.1016/j.jvolgeores.2017.08.003
Newhall, C. G., and Hoblitt, R. P. (2002). Constructing event trees for volcanic crises. Bull. Volcanol. 64, 3–20. doi: 10.1007/s004450100173
Palma, J. L., Courtland, L., Charbonnier, S., Tortini, R., and Valentine, G. (2014). Vhub: a knowledge management system to facilitate online collaborative volcano modeling and research. J. Applied Volcanol. 3:2. doi: 10.1186/2191-5040-3-2
Papale, P., and Shroder, J. F. (eds.) (2015). Volcanic Hazards, Risks, and Disasters. Amsterdam: Elsevier.
Patra, A. K., Baer, A. C., Nichita, C. C., Pitman, E. B., Sheridan, M. F., Bursik, M., et al. (2005). Parallel adaptive simulation of dry avalanches over natural terrain. J. Volcanol. Geotherm. Res. 139, 1–22. doi: 10.1016/j.jvolgeores.2004.06.014
Pitman, E. B., Patra, A., Bauer, A., Sheridan, M., and Bursik, M. (2003). Computing debris flows and landslides. Phys. Fluids 15, 3638–3646. doi: 10.1063/1.1614253
Schilling, S. P. (1998). LAHARZ; GIS Programs for Automated Mapping of Lahar-Inundation Hazard Zones, Open-File Report, U S Geological Survey 98-638. 80.
Schilling, S. P. (2014). Laharz_py –GIS tools for automated mapping of lahar inundation hazard zones. Open-File Report, U.S. Geological Survey 2014-1073, 78.
Schwaiger, H. F., Denlinger, R. P., and Mastin, L. G. (2012). Ash3d: A finite-volume, conservative numerical model for ash transport and tephra deposition. J. Geophys. Res. 117:B4. doi: 10.1029/2011JB008968
Searcy, C., Dean, K., and Stringer, W. (1998). PUFF: A high-resolution volcanic ash tracking model. J. Volcanol. Geotherm. Res. 80, 1–16. doi: 10.1016/S0377-0273(97)00037-1
Selva, J., Costa, A., Marzocchi, W., and Sandri, L. (2010). BET_VH: exploring the influence of natural uncertainties on long-term hazard from tephra fallout at Campi Flegrei (Italy). Bull. Volcanol. 72:717.
Selva, J., Costa, A., Sandri, L., Macedonio, G., and Marzocchi, W. (2014). Probabilistic short-term volcanic hazard in phases of unrest: a case study for tephra fallout. J. Geophys. Res. 119, 8805–8826. doi: 10.1002/2014JB011252
Sheridan, M. F. (1980). Pyroclastic block flow from the September, 1976, eruption of La Soufrière volcano, Guadeloupe. Bull. Vocanol. 43, 397–402. doi: 10.1007/BF02598040
Sheridan, M. F., Stinton, A. J., Patra, A., Pitman, E. B., Bauer, A., and Nichita, C. C. (2004). Evaluating Titan2D mass-flow model using the 1963 Little tahoma peak avalanches, mount rainier, Washington. J. Volcanol. Geotherm. Res. 139, 89–102. doi: 10.1016/j.jvolgeores.2004.06.011
Siebert, L., Simkin, T., and Kimberly, P. (2010). Volcanoes of the World, 3rd Edn. Berkeley, CA; Los Angeles, CA: University of California Press.
Sobradelo, R., Bartolini, S., and Marti, J. (2014). HASSET: a probability event tree tool to evaluate future volcanic scenarios using Bayesian inference. Bull. Volcanol. 76:770. doi: 10.1007/s00445-013-0770-x
Sobradelo, R., and Marti, J. (2015). Short-term volcanic hazard assessment throught Baysian inference: retrospective application to the Pinatubo 1991 volcanic crisis. J. Volcanol. Geotherm. Res. 290, 1–11. doi: 10.1016/j.jvolgeores.2014.11.011
Takarada, S., Bandibas, J. C., Ishikawa, Y., and G.-EVER Promotion Team (2014). Global earthquake and volcanic eruption risk management activities, volcanic hazard assessment support system and Asia-pacific region hazard mapping project in G-EVER. Episodes 37, 321–328.
Takarada, S., Ishikawa, Y., Maruyama, T., Yoshimi, M., Matsumoto, D., Furukawa, R., et al. (2016a). Eastern Asia Earthquake and Volcanic Hazards Information Map. Tsukuba: Geological Survey of Japan, AIST.
Takarada, S., Kazahaya, K., Kawanabe, Y., Sakaguchi, K., Suto, S., Yamamoto, T., et al. (1993). Volume estimation of 1991-92 eruption of Unzen volcano, and initiation mechanisms of pyroclastic flows on June 3 and June 8, 1991. Bull. Geol. Surv. Jap. 44, 11–24.
Takarada, S., Oikawa, T., Furukawa, R., Hoshizumi, H., Itoh, J., Geshi, N., et al. (2016b). Estimation of total discharged mass from the phreatic eruption of ontake volcano, central Japan, on September 27, 2014. Earth Planets Space 68:138. doi: 10.1186/s40623-016-0511-4
Tarquini, S., and Favalli, M. (2011). Mapping and DOWNFLOW simulation of recent lava flow fields at Mount Etna. J. Volcanol. Geotherm. Res. 204, 27–39. doi: 10.1016/j.jvolgeores.2011.05.001
Tonini, R., Sandri, L., and Thmpson, M. A. (2015). PyBetVH: a Python tool for probabilistic volcanic hazard assessment and for generation of Bayean Hazard curves and maps. Comp. Geosci. 79, 38–46. doi: 10.1016/j.cageo.2015.02.017
Ui, T. (1983). Volcanic dry avalanche deposits – identification and comparison with nonvolcanic debris stream deposits. J. Volcanol. Geotherm. Res. 18, 135–150. doi: 10.1016/0377-0273(83)90006-9
Ui, T., Yamamoto, H., and Suzuki-Kamata, K. (1986). Characterization of debris avalanche deposits in Japan. J. Volcanol. Geotherm. Res. 29, 231–243.
Wilson, T. M., Jenkins, S., and Stewart, C. (2015). “Impacts from volcanic ash fall,” in Volcanic Hazards, Risks, and Disasters, Hazard and Disasters Series, eds P. Papale and J. F. Shroder (Amsterdam: Elsevier), 47–86.
Keywords: hazards, assessment, online, WebGIS, simulation, energy cone, Titan2D, Tephra2
Citation: Takarada S (2017) The Volcanic Hazards Assessment Support System for the Online Hazard Assessment and Risk Mitigation of Quaternary Volcanoes in the World. Front. Earth Sci. 5:102. doi: 10.3389/feart.2017.00102
Received: 05 May 2017; Accepted: 22 November 2017;
Published: 06 December 2017.
Edited by:
Eliza Shona Calder, University of Edinburgh, United KingdomReviewed by:
Pablo Samaniego, UMR6524 Laboratoire Magmas et Volcans (LMV), FranceSusanna Jenkins, Earth Observatory of Singapore, Singapore
Copyright © 2017 Takarada. This is an open-access article distributed under the terms of the Creative Commons Attribution License (CC BY). The use, distribution or reproduction in other forums is permitted, provided the original author(s) or licensor are credited and that the original publication in this journal is cited, in accordance with accepted academic practice. No use, distribution or reproduction is permitted which does not comply with these terms.
*Correspondence: Shinji Takarada, s-takarada@aist.go.jp