Permafrost Favorability Index: Spatial Modeling in the French Alps Using a Rock Glacier Inventory
 Marco Marcer1*
  Xavier Bodin2*
  Alexander Brenning3
  Philippe Schoeneich1
  Raphaële Charvet4 Frédéric Gottardi5
- 1Institut de Géographie Alpine, Université Grenoble Alpes, Grenoble, France
- 2Laboratoire EDYTEM, Centre National de la Recherche Scientifique, Université Savoie Mont Blanc, Le Bourget-du-Lac, France
- 3Department of Geography, Friedrich Schiller University Jena, Jena, Germany
- 4Service RTM, Office National de Forets, Gap, France
- 5EDF-DTG, Grenoble, France
In the present study we used the first rock glacier inventory for the entire French Alps to model spatial permafrost distribution in the region. Climatic and topographic data evaluated at the rock glacier locations were used as predictor variables in a Generalized Linear Model. Model performances are strong, suggesting that, in agreement with several previous studies, this methodology is able to model accurately rock glacier distribution. A methodology to estimate model uncertainties is proposed, revealing that the subjectivity in the interpretation of rock glacier activity and contours may substantially bias the model. The model highlights a North-South trend in the regional pattern of permafrost distribution which is attributed to the climatic influences of the Atlantic and Mediterranean climates. Further analysis suggest that lower amounts of precipitation in the early winter and a thinner snow cover, as typically found in the Mediterranean area, could contribute to the existence of permafrost at higher temperatures compared to the Northern Alps. A comparison with the Alpine Permafrost Index Map (APIM) shows no major differences with our model, highlighting the very good predictive power of the APIM despite its tendency to slightly overestimate permafrost extension with respect to our database. The use of rock glaciers as indicators of permafrost existence despite their time response to climate change is discussed and an interpretation key is proposed in order to ensure the proper use of the model for research as well as for operational purposes.
Introduction
In the European Alps widespread evidence of ice-rich mountain permafrost existence has been observed, mostly intact rock glaciers (in the sense of Barsch, 1996, i.e., all the rock glaciers for which the presence of ice is expected) that can be found in almost all massives above 2,500 m (Baroni et al., 2004; Monnier, 2006; Ribolini and Fabre, 2006; Bodin, 2007; Cremonese et al., 2011). In addition, observations of accelerating and destabilizing rock glaciers are interpreted as potential signals of ice-rich permafrost degradation (Roer et al., 2008; Delaloye and Morard, 2011; Ramelli et al., 2011; Delaloye et al., 2013; Scotti et al., 2017). In the French Alps two recent cases of geomorphological phenomena linked to permafrost degradation received particular attention: the collapse of the Bérard rock glacier in 2006 (Bodin et al., 2016), and the active layer detachment of the Lou rock glacier that resulted in a destructive debris flow, damaging the town of Lanslevillard in August 2015 (Schoeneich et al., 2017). In the present context of warming climate, such hazardous situations are expected to become more common as a consequence of the degradation of ice-rich permafrost (Haeberli et al., 1993; Bodin et al., 2015). For operational needs, knowing the spatial extent and the status of permafrost is therefore an extremely important issue (Haeberli et al., 2010).
Statistical models of permafrost distribution have been used for more than two decades in Switzerland (Keller, 1992; Imhof, 1996; Lambiel and Reynard, 2001; Frauenfelder, 2004). In France, a first model was built using a rock glacier inventory covering the massif du Combeynot (30 km2, around 45°N) and locally validated using two independent datasets in the Vanoise and Mercantour massives (Bodin et al., 2008). More recently, as an international effort, the APIM (Alpine Permafrost Index Map) was conceived to estimate permafrost extent over the entire Alpine range (Boeckli et al., 2012a,b). The APIM was however calibrated using only a limited number of rock glaciers in the French Alps (only the Combeynot inventory, Cremonese et al., 2011) and, considering that many authors pointed out that permafrost distribution models tend to be site-specific and weak when transferred to others sites (Frauenfelder et al., 1998; Lambiel and Reynard, 2001; Baroni et al., 2004; Bonnaventure and Lewkowicz, 2008), its significance in this region still remains unknown. Therefore, a permafrost modeling effort focused on this region is necessary.
In France, Restauration des Terrains en Montagne (RTM), a division of the French National Forest Office (ONF) that is responsible for natural hazard management in mountainous regions, has become concerned about the potentially emerging hazards related to ice-rich permafrost degradation and rock glacier destabilization. A Geographical Information System (GIS) inventory of all rock glaciers of the French Alps was therefore created between 2009 and 2016, compiling information for more than 3000 landforms (Roudnitska et al., 2016). It represents a unique database for permafrost modeling in the region.
The present work aims to exploit this inventory to produce and evaluate a permafrost distribution model specifically designed for the French Alps. This is done following the two main assumptions recurrent in the permafrost distribution modeling literature (Boeckli et al., 2012a; Sattler et al., 2016; Azócar et al., 2017). First, the rock glaciers indicate the presence (absence) of permafrost if they are active (fossil). Second, the activity of the rock glacier is controlled by a set of topo-climatic proxies of the local climate at the rock glacier location. These two assumptions allow us to develop a statistical model, described in section Statistical Modeling, which describes the spatial distribution of permafrost, represented by the rock glaciers activity, using the spatial distribution of the topo-climatic proxy variables, which are described in section Data. The assessment of the modeling performance is described in section Uncertainty Estimation of the RGLs inventory. Results and results discussion are presented in sections Results and Discussion, including an interpretation key for the model and its comparison with previous studies (section Model Interpretation).
Study Area
In the present study, the French Alps are defined as the portion of the Alpine range within the French national borders. This mountain range forms a north-south oriented arc about 250 km long and 50–75 km wide (between 44 and 46°N and from 5.7 to 7.7°E) that hosts the highest summits of the entire Alpine Range. The climate is complex, being influenced by the Atlantic Ocean from northwest and by the Mediterranean Sea from south (Beniston, 2006). The climate of the French Alps is usually divided into southern and northern Alps at the geographical limit of the Col du Lautaret (45°N), where a climatic breakpoint is noticeable (Bénévent, 1926; Gottardi, 2009). The zero °C isotherm increases from ~2,200 m in the Chablais up to ~2,700 m in the Mercantour (Durand et al., 2009a). Precipitation patterns are even more variable than temperature, being influenced by atmospheric circulation patterns and topographic sheltering effects. The north-western Alps are remarkably wetter than the rest of the French Alpine range, being directly exposed to the Atlantic perturbations, while the Mediterranean influence determines a drier climate in the south. A topographic sheltering in the interior valleys is also observable, due to the high elevations of the massives directly facing the oceanic air masses (Durand et al., 2009b).
In order to analyse this vast area with its heterogeneous climatic, geological and geomorphological settings, we divided it into five sub-regions (Figures 1, 2 and Table 1) that group the areas that present similar characteristics with respect to the periglacial environment (Kenner and Magnusson, 2017). Sectors 1, 2, and 3 comprise the Western and Eastern side of the Northern Alps. In sub-region 2, where the highest peaks of the French Alps are located, there is a significant degree of glacierization (due to both high elevation and high precipitation), which leaves little space for the development of rock glaciers. Sub-region 1 is also exposed to this climate but, due to the substantially lower elevations hardly reaching 2,500 m a.s.l., there are only small glaciers. Sub-region 3 is sheltered from this influence, resulting in a drier and more continental climate, where periglacial activity flourishes (Guodong and Dramis, 1992; Harris and Corte, 1992; Monnier, 2006). These three sub-regions present also a different lithology. The sub-region 2 is the external crystalline range, dominated by granitic and metamorphic rocks Sub-region 3 is characterized by an inhomogeneous geological structure dominated by schist, micashists, and ophiolites and Sub-region 1 is composed by low altitude limestones and sandstones.
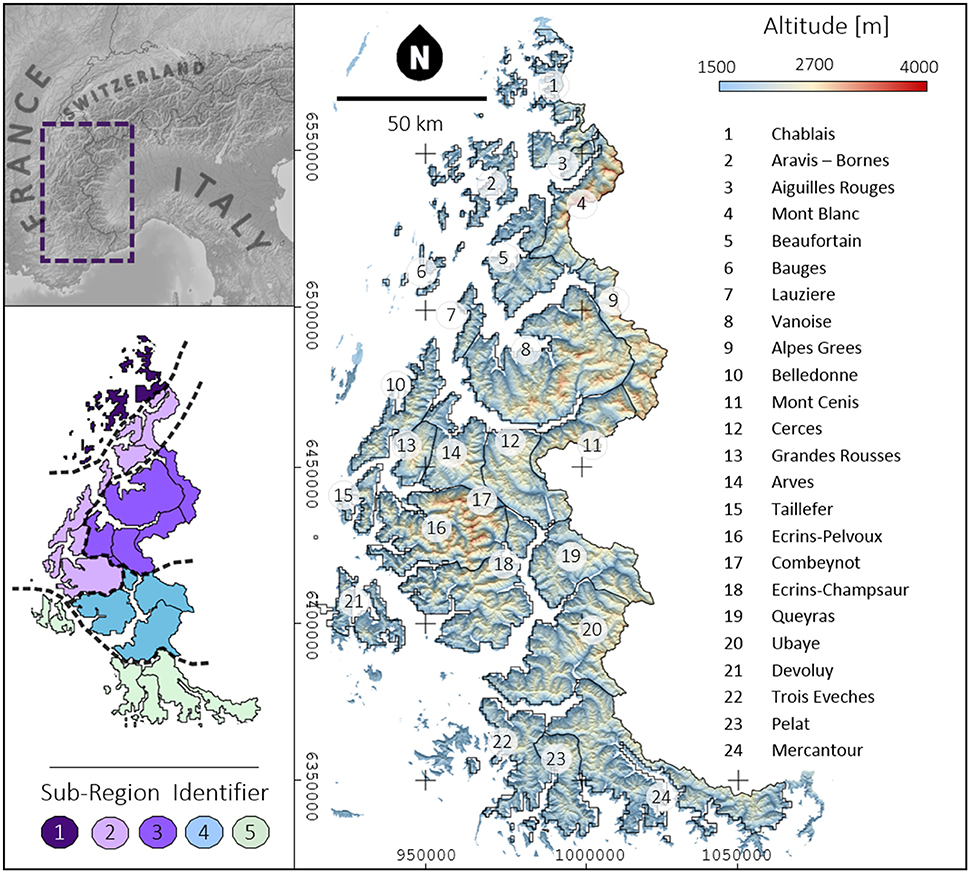
Figure 1. Overview of the study area and presentation of the massif grouping. Coordinates are in Lambert 93: EPSG 2154.

Figure 2. Overview of the dominant lithology and glacier cover in the study area and pie charts of the geological cover and the relative surface above 1,500 m.s.l. covered by glaciers. Lithological data are made available by the Bureau de Recherches Géologiques et Minières (BRGM, 2015) while the glacier cover (2006–2009) is obtained using the data from Gardent (2014).
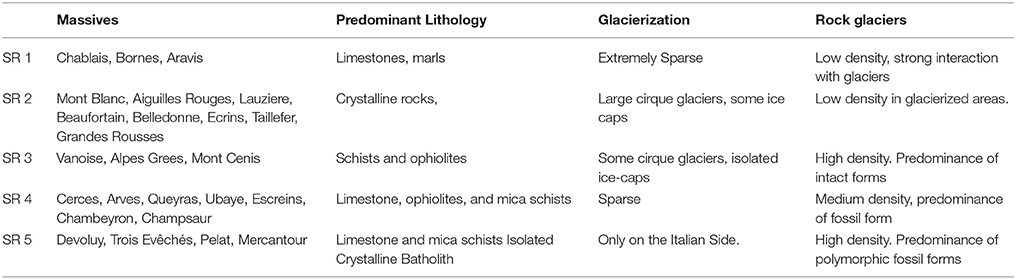
Table 1. Sub-Regions (SR) repartition of the French Alps according to main characteristics (lithology and glaciation) for rock glacier existence.
The southern French Alps present lower elevations and under a strong Mediterranean influence (Gottardi, 2009), resulting in a drier and warmer climate with a low degree of glacierization. Similar to the northern Alps, the southern Alps can be divided into northwest and southeast sub-regions. The eastern sub-region (number 5) hardly reaches 3,000 m a.s.l. and limestone dominates the lithology, with the notable exception of the significantly higher, crystalline massif du Mercantour. The western sub-region (number 4) reaches 3,500 m a.s.l. and it is dominated by micashists and ophiolites.
Methods and Data
Permafrost distribution was modeled using the statistical approach proposed already by several authors (Keller, 1992; Imhof, 1996; Frauenfelder et al., 1998; Lambiel and Reynard, 2001; Bodin et al., 2008; Deluigi and Lambiel, 2011; Boeckli et al., 2012a; Sattler et al., 2016; Azócar et al., 2017). Using the French Alps rock glaciers inventory (Roudnitska et al., 2016), we first hypothesized that the rock glaciers, here treated as dependent variable, are indirect indicators of the presence and absence of permafrost according to their activity. The second hypothesis is that the conditions for permafrost existence can be discriminated by a set of local topoclimatic controls, here treated as predictor variables, such as present-day air temperature, incoming solar radiation and precipitation patterns that were sampled from raster maps at each rock glacier's location. The authors acknowledge that permafrost presents a delayed signal with respect to the climate and it is assumed that the present day climatic patterns are representative of climatic patterns of the past several decades. A statistical model was then trained to evaluate the correlation between the permafrost existence indicators, called the response variable, and the topoclimatic controls, called predictor variables. In using a model of rock glacier activity status to predict permafrost in areas outside rock glaciers, it is assumed that the same relationships that apply to permafrost presence / absence within rock glaciers hold in surrounding terrain.
It is emphasized that fitting a statistical model based on rock glacier activity status does not model the actual permafrost distribution, but rather the likelihood of the occurrence of the complex processes associated to the rock glaciers existence and activity, which are an expression of permafrost presence. Therefore here we will be use the term “Permafrost Favorability Index” (PFI) instead of permafrost distribution to express this likelihood (Azócar et al., 2017).
Statistical Modeling
In the present study statistical modeling was performed using a generalized linear model (GLM) with logistic link function. It has been demonstrated that the GLM is suitable for modeling permafrost distribution (Boeckli et al., 2012a; Sattler et al., 2016), periglacial landform existence (Marmion et al., 2008) and landslide occurrence (Goetz et al., 2015) as long as relationships between predictors and response are approximately linear and the sample size is larger than few hundred individuals (Hjort and Marmion, 2008). This parametric model offers a good transparency to the user, which allows direct interpretation of the predictor variables role by examining the model coefficients. More complex models, such as random forests or support vector machines, may achieve higher performances, but their black box nature could limit the interpretation of results (Deluigi and Lambiel, 2011), and their flexibility may result in overfitting. Generalized additive models are sometimes used as a compromise between interpretability and flexibility when nonlinearities justify their use (Goetz et al., 2015; Azócar et al., 2017). Since, at regional scale, the impact of some climatic forcing on permafrost distribution is still unclear, e.g., precipitation and seasonality, it was considered important here to produce a model transparent to interpretation, and we therefore used a GLM, or logistic regression.
PFI was modeled as a categorical response variable, presence or absence of permafrost, using continuous predictor variables, e.g., elevation. Fitting a linear model directly on the categorical response variable would lead to values of probability that may exceed the interval [0;1]. The logistic link function transforms the probability of permafrost occurrence to the logits, continuous and unbounded variables that can be linearly modeled (Brenning, 2005). This was done by considering the permafrost occurrence (Y = 1) as a probability conditioned by a set of predictors (x):
The conditional probabilities, also called odds, were transformed to logits by the logit link function
which are continuous and unbounded, and the linear model consisting of the intercept α and the predictor variables coefficients β could therefore be fitted upon them:
The model was fitted by maximum likelihood, and it could be used to predict the probability of permafrost occurrence for any set of predictors. The model was computed using the function glm in the R software, while the data handling was done using the packages RSaga (Brenning, 2008) and rgdal (Bivand et al., 2015).
Model performance was evaluated using the Akaike Information Criterion (AIC) and the Area Under the Receiver Operating Characteristic (AUROC; Hosmer and Lemeshow, 2000) estimated by cross-validation (Hand, 1997). The AIC was used for model selection, measuring the goodness of fit of different models trained on the same dataset. Since the AIC includes a penalty term that depends on model complexity, less complex models are preferred to larger models that fit the data equally well. Smaller AIC values indicate better goodness of fit. In this study, the AIC is used to select a subset of predictor variables by stepwise forward selection.
The AUROC is a tool to evaluate the quality of the model classification. Varying from 0.5 (random classification) to 1 (perfect classification), it quantifies the probability that the model will properly classify a dependent variable for a set of predictors variables.
Cross-validation is a statistical estimation procedure that can be used to assess the predictive performance and determine the degree of overfitting of a model. In general, it is performed by randomly dividing the dataset into two subsets used for training the model and testing its predictive capabilities, respectively. The process is repeated until all the data have been used at least once as a test set. All test-set predictions are combined to obtain a cross-validation estimate of the performance measure, in this study the AUROC. A model performing on average substantially better on the training set compared to the cross-validation results is said to overfit.
Here, cross-validation was performed using the sub-regions as partitioning class: the model was trained on 4 sub-regions, while the model performance is evaluated on the left-out sector. The hypothesis behind this validation method was that climate, lithology and landscape history within a sector are relatively homogeneous compared to the other sectors. By building models on a group of massives and testing them in the remaining sector, it was possible to assess the transferability of the model to different environments within our study region. Model performances were evaluated using the R package sperrorest (Brenning, 2012).
Data
In the present study the observational units were the fossil rock glaciers (absence of permafrost) and the production areas of active rock glaciers (presence of permafrost).
Response Variable: Rock Glacier Inventory
The response variable was obtained using the first exhaustive rock glacier inventory of the French Alps, compiled and supplied by the RTM (Roudnitska et al., 2016). The rock glaciers were inventoried using Bing satellite imagery (yearly updated and accessible via QGIS), IGN aerial orthophotography (available for 2013 and at 50 × 50 cm resolution) (IGN, 2013). The digitized outlines of the landforms included their rooting zones, i.e., the slopes that furnish the debris to the rock glaciers and where the ice-debris mixture is supposed to originate (Humlum, 1998). The activity status was judged according to morphologic indicators (Barsch, 1996; Scapozza, 2008).
Since the inventory was compiled by different operators, the landforms' geometry and activity status were cross-revised by the authors in order to ensure the quality and conformity of the digitization method and activity attribution. Rock glaciers that were suspected to interact with glacial processes were discarded because of their ambiguous rooting zone. Also, only monomorphic forms (Frauenfelder and Kääb, 2000) with fully identifiable outlines were selected. Polymorphic forms are witnesses of a complex interaction between climate and local geomorphology (Frauenfelder and Kääb, 2000; Bodin, 2013). Since we study rock glaciers in correlation with climatic proxies, these complex interactions may not be trivial to be modeled statistically and may induce biases.
Historical orthophotos were used to determine if an allegedly active rock glacier was actually moving. Three sets of historical orthophotos (from 2000 to 2006, 2006 to 2010, and 2013 to 2015) are made available to the public by the National Institute of Geography (IGN, 2011b, 2013). Image resolution ranges from 1 × 1 m for the older data to 0.5 × 0.5 m for the 2013–2015 data. Displacement was assessed by visual inspection. In general, orthophotos present different degree of distortions, often higher in steep slopes. Rock glacier movement was confirmed when consistent with slope orientation and greater than any geometric distortions observed in the neighborhood of the landform.
In the present study the production area, or rooting zone, only of active rock glaciers was considered as evidence of permafrost existence (Bodin et al., 2008; Sattler et al., 2016). The rooting zone is the area where the mixture of ice and debris is created, and due to an over-saturation with ice, permafrost creep starts generating the rock glacier (Barsch, 1996; Humlum, 1998). The hypothesis behind this was that the climatic conditions favorable for mountain permafrost existence are found primarily in the rooting zone of active rock glaciers. In this way the model was considered to avoid bias by including the rock glaciers' dynamical processes that export permafrost toward lower altitudes and that depend not only on the local climate but also on the morphometric characteristics of the rock glaciers' catchment (Humlum, 1998; Matsuoka and Ikeda, 2001; Frauenfelder et al., 2003; Brenning, 2005; Janke and Frauenfelder, 2007; Cossart et al., 2010). The break between the talus and the typical morphology of an active rock glacier, dominated by ridges and furrows, was used as a morphological criterion to identify the lower limit of production areas. Landforms whose production area was not clearly identifiable were discarded. In agreement with previous studies (Boeckli et al., 2012a; Sattler et al., 2016; Azócar et al., 2017), fossil rock glaciers were used as evidence of permafrost absence. While in active rock glaciers the rooting zone is often clearly identifiable, this is not the case for the fossil forms because of vegetation cover and re-arrangement of the surface after the ground thaw. For this reason, we chose to use the centroids of fossil rock glaciers instead of fossil production areas as evidence of permafrost absence.
Predictor Variables: Topoclimatic Data
The predictor variables aim to describe the processes that determine the realization of the response variable.
Altitude and potential incoming solar radiation
A DTM at a 25 × 25 m pixel size (IGN, 2011a) was used to calculate the Potential Incoming Solar Radiation (PISR) with the Terrain analysis toolbox in SAGA (Wilson and Gallant, 2000). The PISR is the sum of the computed direct and diffusive components of the solar radiation using the DTM. Calculation is made assuming clear sky conditions, i.e., transmittance at 70%, and absence of snow cover. The PISR describes the process of ground warming caused by the direct exposure to the sunlight, and it also controls snow cover duration.
Air temperature
Gridded temperature data at a 1 × 1 km resolution belongs to EDF (Gottardi, 2009) and are the result of an inverse distance weighting interpolation corrected for elevation of data from a network of 216 weather stations in the French Alps during the 1975–2005 period. In order to take into account strong climatic gradients due to topography, the method is based on a “ridge crossing” distance, which penalizes the interaction between two weather stations separated by a topographic barrier. Using a cross-validation method, the RMSE of the interpolation was assessed to be 1.07°C for maximum temperatures (TX, mean over the warmest month) and 0.77 for minimum temperatures (TN, mean over the coldest month).
Mean Annual Air Temperature (MAAT) was calculated using the same method for TN and TX on the same weather station network. TX and TN were considered as proxies of winter and summer temperatures, respectively. A seasonal variation of temperature (TSEASON) was also calculated as the difference between TX and TN, as proposed by Boeckli et al. (2012a). Since water bodies tend to reduce seasonal variation, TSEASON was also a measure of continentality, which is suspected to play a significant role in rock glacier distribution (Sattler et al., 2016).
In order to capture the local variability of air temperature due to the complex terrain, the data were resampled using the 25 × 25 m DTM. Since lapse rates are known to vary from the northern to the southern Alps, using a constant lapse rate, e.g., −0.65°C/100 m, would be incorrect (Gottardi, 2009). Therefore, lapse rates were locally obtained by computing the linear relationship between neighboring temperatures and elevation data for each grid cell at 1 km resolution. Lapse rates were then resampled at 25 m resolution using a bilinear interpolation method. Finally, the temperatures were adjusted by calculating the differences in elevation between the 25 m and the 1,000 m DTMs and multiplying them by the resampled lapse rate.
Precipitation patterns
The precipitation dataset belongs to EDF (Gottardi, 2009). Gottardi (2009) classified the precipitation in the French Alps during the 1948–2003 period into eight regional-scale perturbation systems, called Weather Types (WTs). Gottardi (2009) evaluated the spatial pattern of the precipitation intensity using the same statistical approach used to estimate the air temperatures, and finally obtained raster maps at 1 × 1 km resolution of mean precipitation amount for each WT. Interpolation was done including also high-altitude nivometers, making the estimation more reliable for the mountainous environments.
Using the time series of the daily WT, it was possible to create precipitation maps for different time periods. The monthly frequency of each weather type was evaluated by counting their mean occurrences for each month along the whole time series. Frequencies are then used to weight the sum of the WT maps to create monthly precipitation maps that were further aggregated to produce a Mean Annual Precipitation (MAP) map and seasonal precipitation maps. The latter were created by aggregating the months when solid and liquid precipitations are expected to fall in the high mountain environment. Solid precipitation is expected to fall in winter (October to May), while liquid precipitation is expected to fall in summer (June to September). Finally, the Early Winter Precipitation Ratio (EWPR), i.e., the ratio of the total winter precipitation falling before February was also computed.
Uncertainty Estimation of the RGLs Inventory
The rock glacier activity attribution using the classical geomorphological approach involves a certain degree of subjectivity. To assess the influence of this source of uncertainty on the statistical modeling results, a model trained on the full active production areas dataset was compared to a model trained on the confirmed production areas, i.e., production areas feeding a rock glacier that were found to be moving by inspecting the historical orthophotos. Uncertain active production areas were assigned an Activity Uncertainty Index (AUI) of 2 and confirmed active production areas were assigned an AUI equal to 1. By this approach, we aimed at quantifying uncertainties in the model arising from uncertain interpretation of rock glacier movement.
The subjectivity of the rock glacier digitization process is also a known source of uncertainty (Schmid et al., 2014). Here, we assessed this uncertainty by having three operators digitalize 10 randomly selected rock glaciers and comparing their boundaries and activities. The influence of the digitization uncertainty on the model was then assessed by a Monte Carlo approach. For each landform in the database the values of MAAT and PISR were randomly varied using a normal distribution of standard deviation equal to the values found by the digitization uncertainty assessment process. The randomization of the database was performed 1,000 times and for each run a model was fit on the database. The models were then compared by evaluating the difference of the PFI in the predictor variable space MAAT-PISR.
Results
Presentation of the Rock Glacier Inventory
The complete inventory (Figure 3) included 3,261 rock glaciers, 814 of which were classified as active, 671 as inactive and 1,776 as fossil. By visual inspection of the rock glacier inventory, it can be observed at first that the landform distribution within the different sub-regions is uneven by density and activity status. While sub-regions areas were comparable (with the exception of sub-region 1), rock glacier numbers ranged from about 600 in sub-region 2 to more than 1000 in sub-region 3. Also the distribution of rock glacier activity within each sub-region was uneven, ranging from 60% of fossil rock glaciers in sub-region 4 to more than 50% of active ones in sub-region 1.
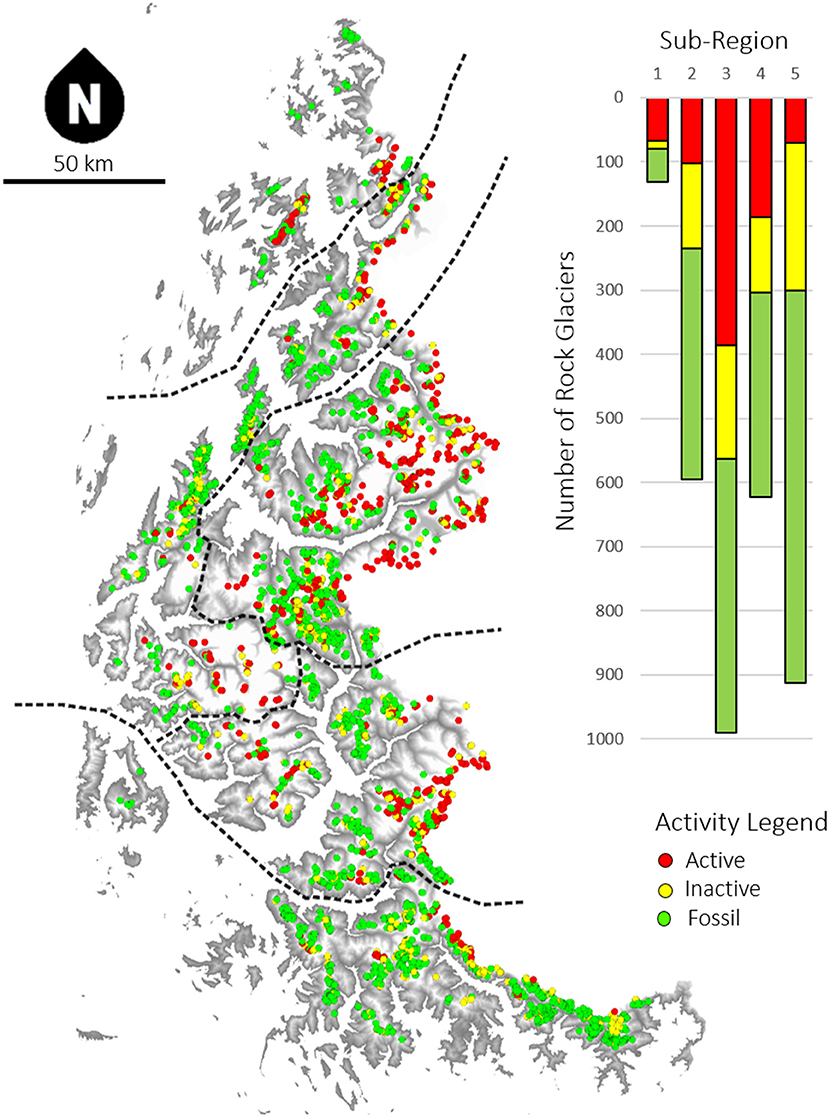
Figure 3. Distribution of the inventoried rock glaciers and number of rock glaciers per activity status and by sub-regions.
Almost half of the rock glaciers were not isolated and coexist sharing lobes or being superimposed upon each other in polymorphic structures (Frauenfelder and Kääb, 2000). Polymorphic structures represented a great source of uncertainty since the separation of different lobes and flow paths using only aerial imagery could be subjective. The number of rock glaciers given above is therefore not an absolute one. A considerable number of rock glaciers was found to be interacting with present and former glaciers, especially in sub-regions 1 and 2.
The revision of the inventory allowed to discard landforms not suitable for modeling. The sampling used for the modeling stage comprised 541 fossil rock glaciers and 515 active production areas (Figure 4). Of the 515 active production areas, 373 were feeding rock glaciers whose movement was clearly identifiable on historical imagery. The centroids of active production areas and fossil rock glaciers are available as spreadsheets files in the Supplementary Materials.
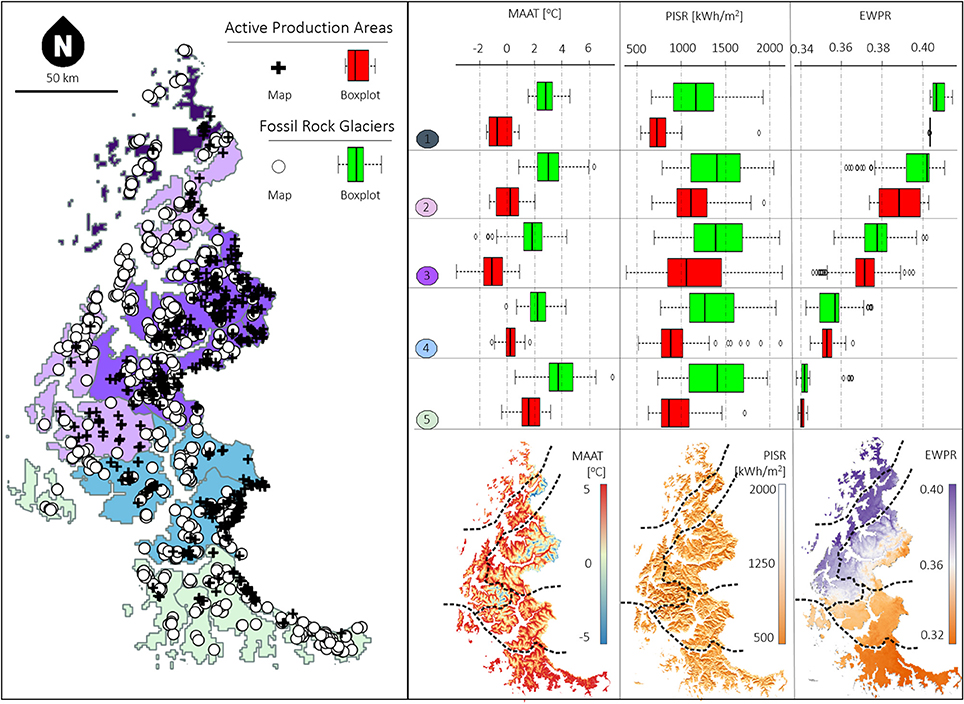
Figure 4. Predictor-variable boxplots for the sampling of rock glaciers used in the modeling. Green boxes refer to P0 (active production areas of rock glaciers), while red boxes refer to P1 (fossil rock glaciers). Predictor-variables boxplots are presented by sub regions. The data P0 and P1 are available as spreadsheet files in the Supplementary Materials.
Statistical Modeling
A summary of the modeling results is shown in Table 2. In general, the logistic regression model was found to describe the rock glacier distribution extremely well, which is in agreement with previous studies (Boeckli et al., 2012a; Sattler et al., 2016). The AUROC values can be classified as “outstanding” (Hosmer and Lemeshow, 2000). The cross-validation analysis showed that the models had a strong predictive power, since training and test performances were comparable. Nevertheless, the high AUROC values were at least partly due to the elimination of inactive rock glaciers from the data set.
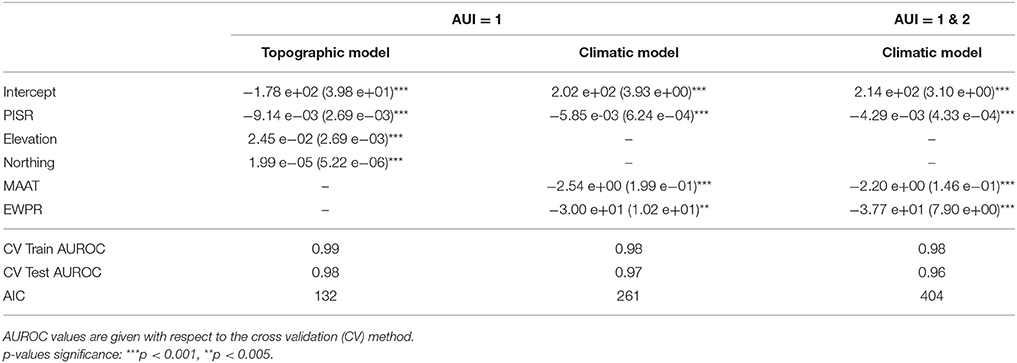
Table 2. Model coefficients and standard error in brackets, followed by model performances.
As found in previous work, MAAT (or its topographical proxy, the elevation) and PISR were the most significant predictors. The stepwise variable selection showed that MAP and seasonality are not significant predictors. EWPR was the only predictor linked to precipitation to have high statistical significance. The north-south trend described above was also highly significant, indicating that in the southern Alps the permafrost belt is located at higher elevations but it can exist at higher MAATs (cf. Figure 8). The relationships with respect to the MAAT and PISR and EWPR (Figure 4) were inspected. It could be observed that the behavior of rock glaciers with respect to the local climate varies throughout the region roughly from north to south. Active production areas could be found at positive MAATs commonly in the Southern Alps, while fossil rock glaciers were also found at negative MAATs in sub-region 3. This regional trend was found to be coherent with EWPR, which decreases toward the southern Alps. The role of PISR in separating presence/absence of permafrost was also variable, being more relevant in sub-regions 1, 4, and 5.
A topographic model, i.e., using only terrain attributes (PISR, Elevation and Northing), and a climatic model, i.e., using climatic data (PISR, MAAT, and EWPR), were fitted to the database of confirmed active and fossil landforms (AUI = 1). The topographic model fitted substantially better than the climatic model (AIC = 132 vs. AIC = 261). The PFI map was therefore computed using the topographic model and the database of confirmed active production areas (AUI = 1). The PFI map is available as geotiff image in the Supplementary Materials (Figure S1). The difference between the predicted PFI and the actual PFI at the rock glacier locations is presented in Figure 5. When the residual was close to 1 then the model failed to predict the PFI, since the active production area (respectively fossil rock glacier) was in a low (high) PFI. Overall there is a slight regional trend in the residuals: in Mercantour (Sector 5), Ecrins and Belledonne (2) some active production areas can be found in in low PFI values, while in Eastern Vanoise (3) and Ubaye (4) fossil rock glaciers can be found within the modeled permafrost belt.
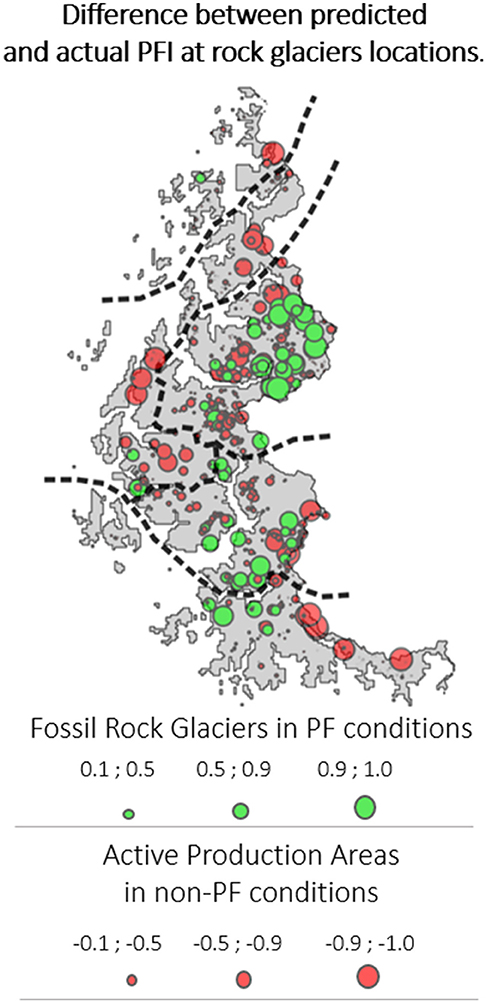
Figure 5. Map of the model residuals, evaluated as the difference between predicted and actual Permafrost Favorability Index (PFI) at rock glacier locations. Maximal difference reaches the value of 1, i.e., when a fossil rock glacier is located in an area where the model predicts PFI = 1 or, inversely, an active production area is located in an area where PFI = 0.
Uncertainty Assessment
In Table 2 are reported the predictor coefficients and performances of the models trained with confirmed production areas and with all the production areas. While directly comparing the model performances is not meaningful due to the different database used, we could observe a substantial difference between the two models in the PISR coefficient. Introducing the uncertain production areas in the modeling dataset generated a model that gives less importance to the role of the PISR. The difference in the two models, shown in Figure 6, could reach a difference in the PFI of 0.35 in the MAAT-PISR space.
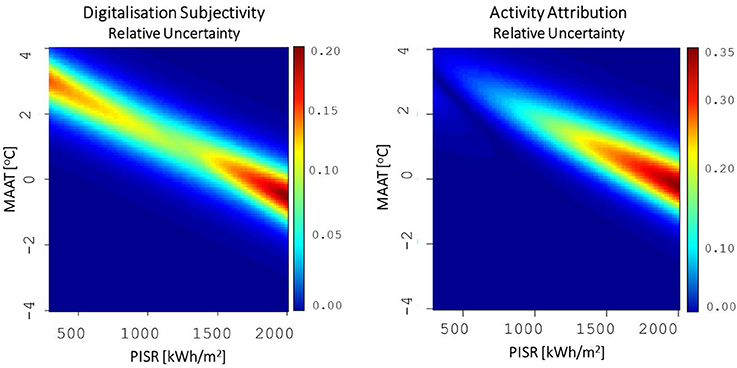
Figure 6. Uncertainty mapping in the Mean Annual Air Temperature (MAAT)—Potential Incoming Solar Radiation (PISR) variable space. The left plot maps the maximum uncertainty linked to the digitization subjectivity, obtained by Monte Carlo simulation. The uncertainty reaches maximum values of 0.18 for sites with high PISR and MAATs close to −1°C. The right plot maps the uncertainty due to the choice of the active production areas with Activity Uncertainty Index (AUI) = 1, 2 and AUI = 1. The most sensitive sites to this source of uncertainty are, again, the ones having high PISR and near-negative MAATs, reaching uncertainties of up to 0.35 points of the PFI.
Comparing the digitisation of 10 landforms by three different operators revealed results comparable to previous knowledge (Schmid et al., 2014). Most of the disagreement among the operators concerned the upper boundaries of the landforms and areas with dense vegetation (Figure 7). Differences in surface areas were high up to 16%. The resulting uncertainty on the predictor variables was 0.10°C for the MAAT and 61 kWh/m2 for the PISR, values used as standard deviation in the Monte Carlo perturbation of the inventory data. The range of the resulting models is presented in the space of the predictor variables MAAT and PISR in Figure 6. It could be observed that the digitization uncertainty may introduce biases of up to about 10%, which are maximized (15%) for high solar radiation (~2,000 kWh/m2) and near-zero temperatures.
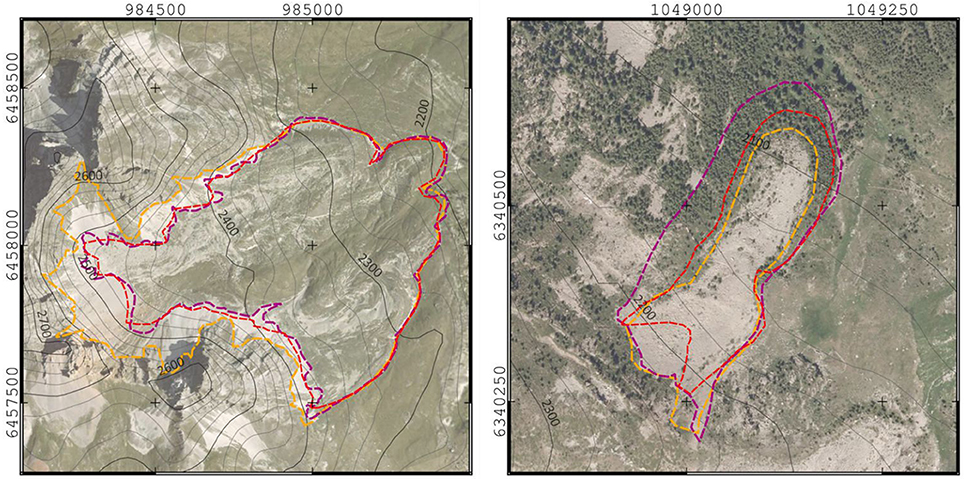
Figure 7. Examples of digitization bias resulting on two of the 10 rock glaciers analyzed by three different operators. Base image provider: Orthophoto BD Ortho 2013 (IGN, 2013).
Discussion
Database
Rock Glacier Inventory
The observed uneven distribution of the rock glaciers is in agreement with the findings of previous studies (Guodong and Dramis, 1992; Harris and Corte, 1992; Kenner and Magnusson, 2017). In glacierized areas, i.e., Sector 2, rock glaciers are sparse. In sector 3, in contrast, glaciers are rather limited due to a drier climate, more space is left for periglacial landforms, and active rock glaciers are therefore widespread. In the Southern Alps rock glaciers are abundant, thanks to the non-existent glacierization and a densely jointed lithology prone to rock-weathering and talus production (Matsuoka and Ikeda, 2001). The predominance of fossil forms suggests favorable conditions for widespread permafrost in the late-glacial cold events, i.e., in a drier and colder climate (Frauenfelder and Kääb, 2000).
Predictor Variables
The climatic data used are specific for the region and the altitudes of interest and therefore considered appropriate for the present study. However, they cover only the second half of the past century, while the onset of active production areas is a phenomenon that took place at the scale of several centuries to millennia (Kerschner, 1978, 1985; Frauenfelder and Kääb, 2000; Frauenfelder et al., 2001; Cossart et al., 2010). Temperature and precipitation are known to vary considerably during the Holocene (Ilyashuk et al., 2011; Fohlmeister et al., 2013), therefore the data for each rock glacier derived from the climate dataset should be interpreted with respect to regional trends and not as the absolute values of the climatic variables. Furthermore, the predictor variables are only proxies for processes affecting permafrost existence. Each predictor variable represents the combined effect of several processes and results therefore have to be interpreted carefully since the assumed predominant process, described by a predictor variable may not be trivial. For example, air temperature, being strongly correlated to the altitude, has an influence on ground cooling, snow cover persistence and also on cloud cover. Also, rock glacier activity status is more likely related to thermal conditions decades to centuries ago (Lambiel and Reynard, 2001). While any overall shift in temperature would be absorbed by the model's intercept term, we must still assume that spatial patterns of present-day MAAT are coherent with spatial patterns in temperature during the time period relevant for controlling rock glacier activity status and permafrost presence/absence.
Statistical Modeling
Model Performance
By examining the out-of-sample AUROC values of each sub-region it can be observed that the simple model combining MAAT and PISR performs very well (Table 3). By adding precipitations as a third predictor to the model, the AUROC reaches lower performances. This is attributed to the fact that precipitation varies at a regional scale and the model may tend to overfit the response variable when trained at the local scale. This indicates that a complex model performs well where the training points cover evenly one area but performs poorly when transferred to other areas. A simple model is therefore preferable to predict permafrost occurrence outside the dataset's spatial domain.
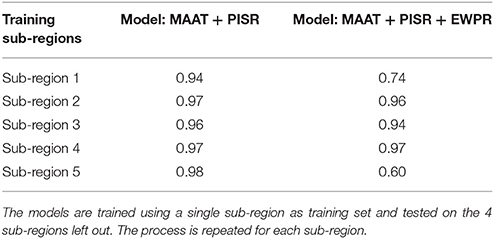
Table 3. AUROC values for two different models.
Model performances in the entire region generally vary around AUROC = 0.98, which can be classified as “outstanding” (Hosmer and Lemeshow, 2000). Although it is complex to compare model performances of different studies, the results obtained by Boeckli et al. (2012a) (AUROC = 0.91) and Sattler et al. (2016) (AUROC = 0.98) using the same statistical models, are similar. The lower performance obtained by Boeckli et al. (2012a) can be explained by the fact that we used active production areas and fossil rock glaciers to train the model, while the APIM is based on intact and fossil rock glaciers, which are “climatically” in between because of the dynamic behavior of these landforms that moves permafrost toward lower elevations.
The topographic model performs marginally better than the climatic model, suggesting that the elevation is a better predictor than MAAT. However, the elevation, which is a proxy of MAAT, does not capture the climatic patterns influenced by the Atlantic Ocean and the Mediterranean Sea. For this reason we focus in section Regional patterns in the spatial distribution of the rock glacier activity on the interpretation of the climatic model.
Model Uncertainties
While the Monte Carlo simulation highlights that the model is reasonably robust to random digitization error in the rock glacier inventory, the uncertainty concerning rock glacier activity attribution by morphometric parameters (Scapozza, 2008) is not negligible. The use of historical imagery of the rock glaciers reduces this uncertainty, ensuring that the active production areas are actually evidence of permafrost since creep could be observed. However, it must be noticed that in a certain number of cases the movements of the rock glaciers could not be assessed because of distortions and poor georeferencing in the orthophoto or presence of snow cover. Also, due to the relatively short time span of 8–15 years covered by the aerial imagery, the movement of rock glaciers creeping at small velocities (~0.1–0.2 m/y) may have remained undetected.
Regional Patterns in the Spatial Distribution of the Rock Glacier Activity
Climatic Influence
The influence of the Atlantic and Mediterranean weather systems seems to play a significant role for rock glacier activity. It is interesting to notice that, while PFI limits increase in elevation toward the South, they are found at higher temperatures (Figure 8). Previous studies managed to explain regional trends by analyzing the mean annual precipitation or the continentality (Ridefelt et al., 2008; Boeckli et al., 2012a; Sattler et al., 2016; Azócar et al., 2017). However, in the present study these predictor variables were found not significant in the statistical model. EWPR is found to be the predictor better explaining this behavior, suggesting that precipitation patterns may play a more important role in the distribution of rock glaciers activity.
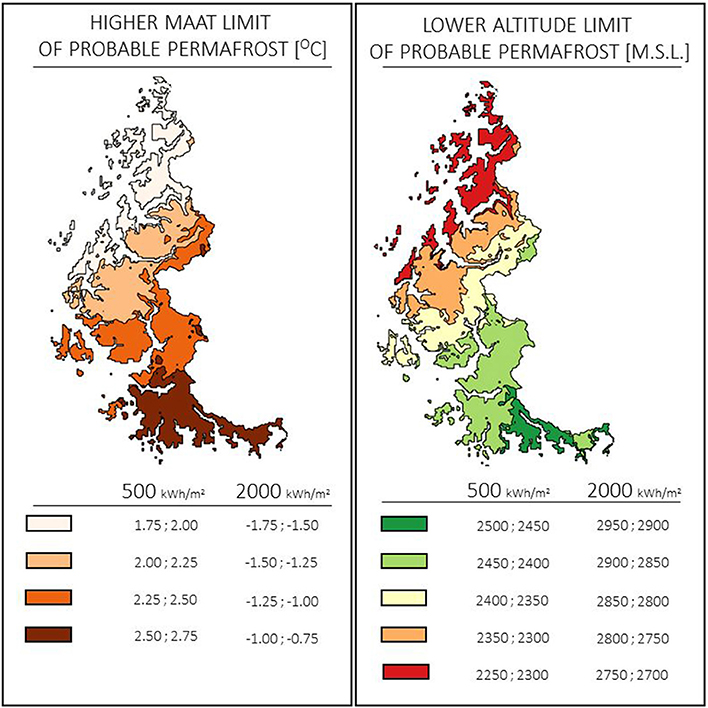
Figure 8. Lower limit of probable permafrost [Permafrost Favorability Index (PFI) > 0.6] at the regional scale with respect to Mean Annual Air Temperature (MAAT) and elevation. Data are presented for two values of solar radiation: 500 kWh/m2, corresponding to a typical small north-facing cirque, and 2,000 kWh/m2, corresponding to an open south face with moderate steepness (~30°). It can be observed that permafrost limits rise in elevation from the northern toward the Southern Alps, due to the warmer climate. However, probable permafrost is found at higher MAAT in the Southern Alps, thanks to the favorable precipitation patterns.
Crossing our findings and the data in Durand et al. (2009b), it appears that the snow cover presents varying characteristics from North to South. While previous studies highlighted the relevance of the snow cover characteristics for permafrost existence on a local scale (Lerjen et al., 2003; Delaloye, 2005; Bodin, 2007; Luetschg et al., 2008; Gubler et al., 2011; Apaloo et al., 2012), we suggest that this factor could be relevant on a regional scale, influencing rock glacier activity distribution by altering the ground thermal regime. An insulating and long-lasting snow cover appearing in early winter characterizes the northern sectors impeding an efficient ground cooling during the first part of the cold season. On the other hand, a thinner cover more prone to ground cooling characterizes the southern Alps, allowing actives production areas to exist in conditions otherwise unsuitable for permafrost.
Lithological Influence
Lithological influences on rock glacier distribution have been identified by many authors (e.g., Johnson et al., 2007). Matsuoka and Ikeda (2001) observed that crystalline rockwalls tend to produce coarser debris, resulting in “blocky” rock glaciers, while shales rockwalls produce finer debris, resulting in “pebbly” rock glaciers. A coarser matrix may enhance the Balch thermal ventilation, potentially allowing blocky rock glaciers to exist in higher MAAT (Johnson et al., 2007). These observations seem to be consistent with the distribution of residuals shown in Figure 5 and dominant lithology (BRGM, 2015) in Figure 2. Indeed, it can be noticed that active production areas in low PFIs are more likely found in granites and gneiss, while fossil rock glaciers in high PFIs are more likely found in schists, ophiolites, and limestones. In order to test the statistical validity of this observation, a GLM is computed adding the lithology as categorical predictor variable. Lithology is divided into two groups, i.e., granites and gneiss vs. the others types of rocks. The resulting model has an AIC of 120 (vs. AIC = 132 for the topographic model) and the lithology predictor has a p-value of 0.0018, confirming that the lithological patterns have a statistically significant role in rock glacier activity distribution. Specifically, the odds ratio of a rock glacier being active (vs. fossil) with respect to the lithology is 18.5. This corresponds to a shift downwards by 111 m of the permafrost belt in crystalline lithology.
Model Interpretation
Comparison with the APIM
Since both APIM and the present PFI cover the French Alps, a comparison between the two models is proposed. However, we wish to stress that, since the two models are based on a different database and different statistical approaches, any comparison is limited. We therefore propose a merely qualitative comparison, presented in Figure 9, without the intention to prove the superiority of one or the other model. Considering that the French Alps are the only region that was not extensively used to calibrate the APIM, our test may give an insight into the predictive power of APIM. In general, APIM is found to be suitable for the French Alps, as permafrost distribution is comparable to the PFI. The distribution of the residuals, presented in Figure 10, shows that APIM has the tendency to slightly overestimate permafrost probability with respect to our database, as fossil rock glaciers are more likely to have an APIM values between 0.1 and 0.2 rather than 0. This can be explained by the omission of inactive rock glaciers from the present model fit, which creates a sharper transition between the zones of expected presence and absence of permafrost, witnessed by a higher AUROC.
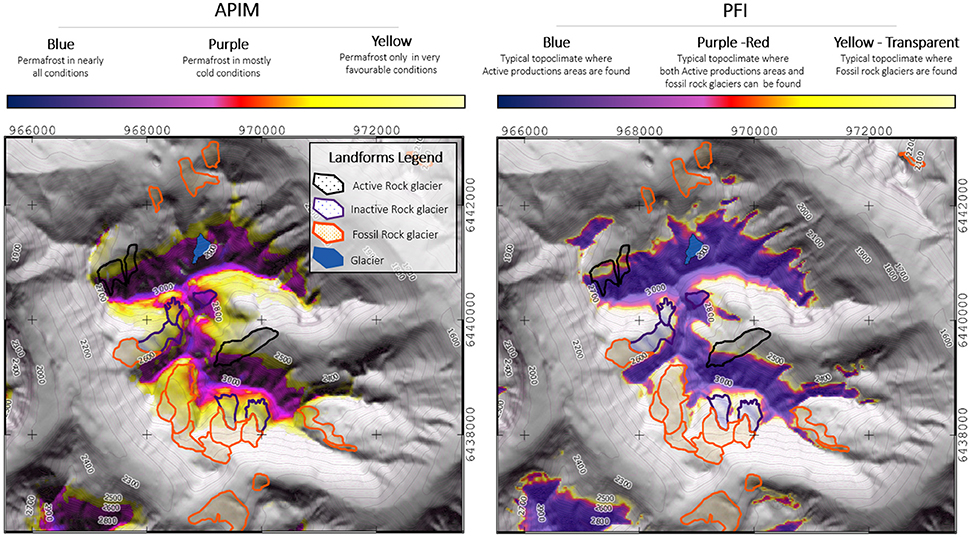
Figure 9. Comparison between Alpine Permafrost Index Map (APIM) and Permafrost Favorability Index (PFI) in Massif du Combeynot. The PFI map is available as geotiff image in the Supplementary Materials.
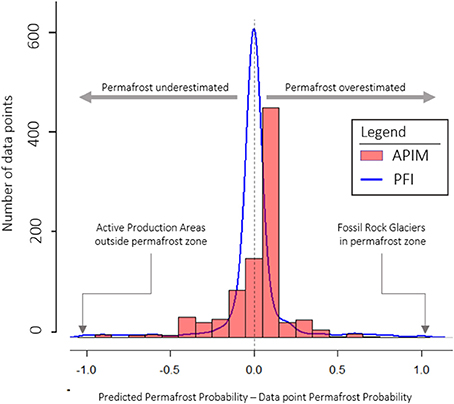
Figure 10. Comparison between the residuals on our inventory with respect to Alpine Permafrost Index Map (APIM) and Permafrost Favorability Index (PFI). Since the PFI is calibrated on this inventory, residual distribution is not surprisingly centered to zero.
Use of the Model
Process-related assumptions at the core of the PFI and the APIM models are substantially different, resulting in different interpretations of the distribution maps. While the APIM uses intact rock glaciers as indicators of permafrost existence and successively applies a thermal offset to account for the dynamic and thermal bias induced by the creep of ice-rich coarse debris, the present model predicts the probability, based on the climate, of the existence of an active production area vs. the presence of a fossil rock glacier. PFI probabilities should be interpreted as climatic suitability for the existence of permafrost in relation to rock glaciers. An active rock glacier which is located in a low-PFI site can be interpreted as a rock glacier which is in a climate where fossil forms are statistically more likely to occur; such a rock glacier could either currently be degrading, or it might be either explained by processes not described by the model, e.g., unusual permafrost preservation.
Mountain permafrost degradation and the climatic inactivation of rock glaciers have been observed in recent climatic episodes such as the Medieval Warm Period (Scapozza et al., 2010; Ramelli et al., 2011; Luetscher et al., 2013). Therefore, the currently active rock glaciers are believed to be representative for the climatic conditions of the colder periods of recent centuries, e.g., the Little Ice Age (LIA) (Lambiel and Reynard, 2001; Cossart et al., 2010). Although rock glaciers have been demonstrated to be sensitive to climate change, the response time is estimated to be of several decades to centuries (Scapozza et al., 2010; Scotti et al., 2017). As consequence, the present model likely reflects the permafrost favorability in climatic conditions that are no longer valid in the present climate, and even less so in warmer future climate.
Conclusions
The study presents the first permafrost distribution model of the French Alps calibrated on a rock glacier inventory covering the region. Rock glacier activity distribution is best modeled using a set of three predictors: Elevation, PISR and Northing. The statistical significance of the Northing predictor shows a regional trend that is suggested to be correlated with the properties of snow cover insulating the ground. The relevance of the dominant lithology is also highlighted, showing that active production areas fed by crystalline rockwalls tend to exist in topoclimatic conditions unfavorable to permafrost existence while the opposite may occur to fossil rock glaciers generated by rockwalls dominated by schists, limestones, and ophiolites. While previous studies indicate the importance of these processes for thermal state of permafrost at local scale, here we suggest that snow cover characteristics and lithology may control rock glacier activity at the regional scale. Several new procedures are proposed to improve the established modeling process, such as inventory revision using historical imagery, digitization uncertainty assessment and spatial cross-validation. The use of historical imagery to verify rock glacier activity was found to substantially reduce the model uncertainty. The model was found to be fairly robust to the subjectivity of the digitization process. However, it is suggested that performing the inventory revision is necessary when the study area is spatially partitioned among different operators, which may introduce personal biases on spatial clusters of rock glaciers. The spatial cross-validation suggests that the model has a good predictive power which, however, decreases significantly when training the model on a reduced dataset and using a larger number of predictors.
Although comparing models designed on different databases and statistical inferences is problematic, a qualitative comparison with APIM data is proposed. Considering that the APIM was not calibrated using this dataset, the present study suggests that this model has a very good predictive power. Differences between the two models are mainly due to the fact that the PFI has a sharper transition between permafrost and non-permafrost areas. As a consequence, the APIM generally tends to slightly over-estimate the permafrost spatial distribution with respect to our database. The differences between PFI and APIM are however at the core of the statistical approaches used: the PFI has to be interpreted as the probability that the local climate during the LIA was suitable for the existence of an active production area. The model is therefore a useful tool to detect rock glaciers that are in disequilibrium with the local climate and may present degradation issues. However, the model is lagging in time since it does not account for the present disequilibrium that already affects Alpine permafrost. Therefore, future work will focus on integrating degradation data in the model in order to understand the spatial extent of the processes behind these phenomena.
Author Contributions
PS, RC, XB, and MM conceived the project. RC and FG supplied and pre-processed fundamental data, which were revised by MM and XB. AB and MM designed the statistical modeling approach. MM wrote the paper and produced the figures. AB, XB, and PS contributed to the writing providing feedback, revision, and editing of the paper.
Conflict of Interest Statement
The rock glaciers inventory used for the modeling process was realized under the financial support of the RTM. Therefore, this database is property of the French Minister of the Environment, which is engaged to publish it free of charge to the public by the end of 2018.
The authors declare that the research was conducted in the absence of any commercial or financial relationships that could be construed as a potential conflict of interest.
Acknowledgments
The present study was realized in the context of the Ph.D. project PERMARISK, funded by the region Auvergne–Rhone Alpes through the ARC-3 grant. The rock glacier inventory was supplied by the Office National des Forets, Departement Service Restauration des Terrains en Montagne. Climatic data were supplied by Électricité de France.
Supplementary Material
The Supplementary Material for this article can be found online at: https://www.frontiersin.org/articles/10.3389/feart.2017.00105/full#supplementary-material
Figure S1. Permafrost Favorability Index map in format geotiff. The reference system is Lambert 93 (EPSG:2154).
References
Apaloo, J., Brenning, A., and Bodin, X. (2012). Interactions between seasonal snow cover, ground surface temperature and topography (Andes of Santiago, Chile, 33.5 S). Permafr. Periglac. Process. 23, 277–291. doi: 10.1002/ppp.1753
Azócar, G. F., Brenning, A., and Bodin, X. (2017). Permafrost distribution modelling in the semi-arid Chilean Andes. Cryosphere 11, 877–890. doi: 10.5194/tc-11-877-2017
Baroni, C., Carton, A., and Seppi, R. (2004). Distribution and behaviour of rock glaciers in the Adamello–Presanella Massif (Italian Alps). Permafr. Periglac. Process. 15, 243–259. doi: 10.1002/ppp.497
Barsch, D. (1996). Rockglaciers - Indicators of the Present and Former Geoecology in High Mountain Environments. Berlin: Springer-Verlag.
Bénévent, E. (1926). Documents sur le climat des Alpes françaises. Étude critique. Rev. Géograp. Alpine 14, 681–764. doi: 10.3406/rga.1926.5004
Beniston, M. (2006). Mountain weather and climate : a general overview and a focus on climatic change in the Alps. Hydrobiologia 562, 3–16. doi: 10.1007/s10750-005-1802-0
Bivand, R., Keitt, T., and Rowlingson, B. (2015). rgdal: Bindings for the Geospatial Data Abstraction Library. R package version 1.1-1. Available online at: http://CRAN.R-project.org/package=rgdal
Bodin, X. (2007). Géodynamique Du Pergélisol De Montagne : Fonctionnement, Distribution Et Évolution Récente L'exemple Du Massif Du Combeynot (Hautes Alpes). PhD Thesis, Université Paris-Diderot, Paris.
Bodin, X. (2013). Present status and development of rock glacier complexes in south-faced valleys (45 ° n, French alps). Geogr. Fis. Dinam. Quat. 36, 27–38. doi: 10.4461/GFDQ.2013.36.2
Bodin, X., Krysiecky, J. M., Schoeneich, P., Le Roux, O., Lorier, L., Echelard, T., et al. (2016). The 2006 collapse of the bérard rock glacier (Southern French Alps). Permafr. Periglac. Process. 28, 209–223. doi: 10.1002/ppp.1887
Bodin, X., Schoeneich, P., Deline, P., Ravanel, L., Magnin, F., Krysiecki, J. M., et al. (2015). Mountain permafrost and associated geomorphological processes: recent changes in the French Alps. J. Alpine Res. 103-2, 1-16. doi: 10.4000/rga.2885
Bodin, X., Schoeneich, P., Lhotellier, R., Deline, P., Ravanel, L., and Monnier, S. (2008). “Towards a first assessment of the permafrost distribution in the French Alps,” in Alpine Glaciological Meeting (Chamonix).
Boeckli, L., Brenning, A., Gruber, S., and Noetzli, J. (2012a). A statistical approach to modelling permafrost distribution in the European Alps or similar mountain ranges. Cryosphere 6, 125–140. doi: 10.5194/tc-6-125-2012
Boeckli, L., Brenning, A., Gruber, S., and Noetzli, J. (2012b). Permafrost distribution in the European Alps: calculation and evaluation of an index map and summary statistics. Cryosphere 6, 807–820. doi: 10.5194/tc-6-807-2012
Bonnaventure, P., and Lewkowicz, A. G. (2008). Mountain permafrost probability mapping using the BTS method in two climatically dissimilar locations, northwest Canada. Can. J. Earth Sci. 45, 443–455. doi: 10.1139/E08-013
Brenning, A. (2005). Geomorphological, Hydrological and Climatic Significance Of Rock Glaciers In The Andes Of Central Chile (33-35 S). PhD thesis, Mathematisch-Naturwissenschaftlichen Fakult at II Humboldt-Universit at zu Berlin.
Brenning, A. (2008). “Statistical geocomputing combining R and SAGA: the example of landslide susceptibility analysis with generalized additive models,” in Hamburger Beitraege zur Physischen Geographie und Landschaftsoekologie, Vol. 19, eds J. Böhner, T. Blaschke, and L. Montanarella (Hamburg: Institut für Geographie), 23–32.
Brenning, A. (2012). “Spatial cross-validation and bootstrap for the assessment of prediction rules in remote sensing: the R package sperrorest,” in 2012 IEEE International Geoscience and Remote Sensing Symposium (Munich), 5372–5374.
BRGM (2015). BD Million-Géol: Carte Géologique à 1/1 000 000 Métropole, Image et Vecteur. Available online at: http://www.brgm.fr/sites/default/files/plaquette_million_2015.pdf
Cossart, E., Fort, M., Bourles, D., Carcaillet, J., Perrier, R., Siame, L., et al. (2010). Climatic significance of glacier retreat and rockglaciers re-assessed in the light of cosmogenic dating and weathering rind thickness in Clarée valley (Briançonnais, French Alps). Catena 80, 204–219. doi: 10.1016/j.catena.2009.11.007
Cremonese, E., Gruber, S., Phillips, M., Pogliotti, P., Boeckli, L., Noetzli, J., et al. (2011). Brief Communication: “an inventory of permafrost evidence for the European Alps” Cryosphere 5, 651–657. doi: 10.5194/tc-5-651-2011
Delaloye, R. (2005). Contribution à l'étude Du Pergélisol De Montagne En Zone Marginale. Ph.D. Thesis, Faculté des Sciences, de l'Université de Fribourg.
Delaloye, R., and Morard, S. (2011). “Le glacier rocheux déstabilisé du Petit-Vélan (Val d'Entremont; Valais): morphologie de surface; vitesses de déplacement et structure interne,” in Actes Du Colloque De La Société Suisse De Géomorphologie, 3–5, Septembre 2009, (Géovisions n°36), eds C. Lambiel, E. Reynard, and C. Scapozza (Olivone: Institut de géographie; Université de Lausanne), 195–210.
Delaloye, R., Morard, S., Barboux, C., Abbert, D., Gruber, V., Riedo, M., et al. (2013). “Rapidlymoving rock glaciers in mattertal,” in Mattertal—ein Tal in Bewegung. Publikationzur Jahrestagung der Schweizerischen Geomorphologischen Gesellschaft, ed C. Graf (St. Niklaus; Birmensdorf: Eidg. Forschungsanstalt WSL), 21–31.
Deluigi, N., and Lambiel, C. (2011). “PERMAL: a machine learning approach for alpine permafrost distribution modeling,” in Jahresta-gung der Schweizerischen Geomorphologischen Gesellschaft (St. Niklaus; Birmensdorf: Eidg. Forschungsanstalt WSL), 47–62.
Durand, Y., Giraud, G., Laterneser, M., Etchevers, P., Merindol, L., and Lesaffre, B. (2009a). Reanalysis of 44 yr of climate in the French Alps (1958–2002): methodology, model validation, climatology, and trends for air temperature and precipitation. J. Appl. Meteorol. Climatol. 48, 429–449. doi: 10.1175/2008JAMC1808.1
Durand, Y., Giraud, G., Laterneser, M., Etchevers, P., Merindol, L., and Lesaffre, B. (2009b). Reanalysis of 47 years of climate in the French Alps (1958–2005): climatology and trends for snow cover. J. Appl. Meteorol. Climatol. 48, 2487–2512. doi: 10.1175/2009JAMC1810.1
Fohlmeister, J., Vollweiler, N., Spötl, C., and Mangini, A. (2013). COMNISPA II : update of a mid-European isotope climate record, 11 ka to present. Holocene 23, 749–754. doi: 10.1177/0959683612465446
Frauenfelder, R. (2004). Regional-Scale Modelling of the Occurrence and Dynamics of Rockglaciers and the Distribution of Paleopermafrost. Ph. D. Thesis, Schriftenreihe Physische Geographie Glaziologie und Geomorphodynamik.
Frauenfelder, R., Allgöver, B., Haeberli, W., and Hoelzle, M. (1998). “Permafrost investigations with GIS—acase study in the Fletschhorn area, Wallis, Swiss Alps,” in Proceedings of Seventh International Conference on Permafrost, Vol. 55 (Yellowknife, NT: Collection Nordicana), 291–295.
Frauenfelder, R., Haeberli, W., and Hoelzle, M. (2003). “Rockglacier occurrence and related terrain parameters in a study area of the Eastern Swiss Alps,” in 8th International Conference on Permafrost, eds P. Phillips and S. Arenson (Lisse), 253–258.
Frauenfelder, R., Haeberli, W., Hoelzle, M., and Maisch, M. (2001). Using relict rockglaciers in GIS-based modelling to reconstruct Younger Dryas permafrost distribution patterns in the Err-Julier area, Swiss Alps. Nor. J. Geogr. 55, 195–202. doi: 10.1080/00291950152746522
Frauenfelder, R., and Kääb, A. (2000). Towards a paleoclimatic model of rock-glacier formation in the Swiss Alps. Ann. Glaciol. 31, 281–286. doi: 10.3189/172756400781820264
Gardent, M. (2014). Inventaire Et Retrait des Glaciers Dans les Alpes Françaises Depuis la fin du Petit Age Glaciaire. PhD thesis, Institut de Géographie Alpine, Université de Grenoble.
Goetz, J. N., Brenning, A., Petschko, H., and Leopold, P. (2015). Evaluating machine learning and statistical prediction techniques for landslide susceptibility modeling. Comput. Geosci. 81, 1–11. doi: 10.1016/j.cageo.2015.04.007
Gottardi, F. (2009). Estimation Statistique Et Réanalyse Des Précipitations En Montagne Utilisation D'ébauches Par Types De Temps Et Assimilation De Données D'enneigement Application Aux Grands Massifs Montagneux Français. Ph. D. Thesis, Institut National Polytechnique de Grenoble - INPG.
Gubler, S., Fiddes, J., Keller, M., and Gruber, S. (2011). Scale-dependent measurement and analysis of ground surface temperature variability in alpine terrain. Cryosphere 5, 431–443. doi: 10.5194/tc-5-431-2011
Guodong, C., and Dramis, F. (1992). Distribution of mountain permafrost and climate. Permafr. Periglac. Process. 3, 83–91. doi: 10.1002/ppp.3430030205
Haeberli, W., Guodong, C., Gorbunov, A. P., and Harris, S. A. (1993). Mountain permafrost and climatic change. Permafrost Periglacial Process. 4, 165–174. doi: 10.1002/ppp.3430040208
Haeberli, W., Noetzli, J., Arenson, L., Delaloye, R., Gärtner-Roer, I., Gruber, S., et al. (2010). Mountain permafrost: development and challenges of a young research field. Environ. Res. 56, 1043–1058. doi: 10.3189/002214311796406121
Harris, S. A., and Corte, A. (1992). Interactions and relations between mountain permafrost, glaciers, snow and water. Permafr. Periglac. Process. 3, 103–110. doi: 10.1002/ppp.3430030207
Hjort, J., and Marmion, M. (2008). Geomorphology effects of sample size on the accuracy of geomorphological models. Geomorphology 102, 341–350. doi: 10.1016/j.geomorph.2008.04.006
Hosmer, D. W., and Lemeshow, S. (2000). Applied Logistic Regression. New York, NY: John Wiley and Sons.
Humlum, O. (1998). The climatic significance of rock glaciers. Permafr. Periglac. Process. 9, 375–395. doi: 10.1002/(SICI)1099-1530(199810/12)9:4<375::AID-PPP301>3.0.CO;2-0
IGN (2011a). BD ALTI® Version 2.0 - Descriptif de Contenu. Available online at: http://professionnels.ign.fr/sites/default/files/DC_BDALTI_2-0.pdf.
IGN (2011b). BD Ortho®Historique, Descriptif de Contenu et Livraison. Available online at: http://pro.ign.fr/sites/default/files/u136/DC_DL_BDORTHOHisto.pdf
IGN (2013). BD Ortho® Version 2.0, Ortho HR® Version 1.0, Descriptif de Contenu. Available online at: http://professionnels.ign.fr/doc/DC_BDORTHO_2-0_ORTHOHR_1-0.pdf
Ilyashuk, E. A., Koinig, K. A., Heiri, O., Ilyashuk, B. P., and Psenner, R. (2011). Holocene temperature variations at a high-altitude site in the Eastern Alps : a chironomid record from Schwarzsee ob Sölden, Austria. Quat. Sci. Rev. 30, 176–191. doi: 10.1016/j.quascirev.2010.10.008
Imhof, M. (1996). Modelling and verification of the permafrost distribution in the Bernese Alps (Western Switzerland). Permafr. Periglac. Process. 7, 267–280. doi: 10.1002/(SICI)1099-1530(199609)7:3<267::AID-PPP221>3.0.CO;2-L
Janke, J., and Frauenfelder, R. (2007). The relationship between rock glacier and contributing area parameters in the front range of Colorado. J. Quat. Sci. 23, 153–163. doi: 10.1002/jqs.1133
Johnson, B. G., Thackray, G. D., and Kirk, R. V. (2007). The effect of topography, latitude, and lithology on rock glacier distribution in the Lemhi Range, central Idaho, USA. Geomorphology 91, 38–50. doi: 10.1016/j.geomorph.2007.01.023
Keller, F. (1992). Automated mapping of mountain permafrost using the program PERMAKART within the geographical information system ARClINFO. Permafr. Periglac. Process. 3, 133–138. doi: 10.1002/ppp.3430030210
Kenner, R., and Magnusson, J. (2017). Estimating the effect of different in fluencing factors on rock glacier development in two regions in the Swiss Alps. Permafr. Periglac. Process. 208, 195–208. doi: 10.1002/ppp.1910
Kerschner, H. (1978). Paleoclimatic inferences from late wurm rock glaciers, Eastern Central Alps, Western Tyrol. Arct. Alp. Res. 10, 635–644. doi: 10.2307/1550684
Kerschner, H. (1985). Quantitative palaeoclimatic inferences from late glacial snowline, timberline and rock glacier data, Tyrolean Alps, Austria. Zeitschrift fur Gletscherkunde und Glazialgeologie 21, 363–369.
Lambiel, C., and Reynard, E. (2001). Regional modelling of present, past and future potential distribution of discontinuous permafrost based on a rock glacier inventory in the Bagnes-Hérémence area (Western Swiss Alps). Norsk Geografisk Tidsskrift 55, 219–223. doi: 10.1080/00291950152746559
Lerjen, M., Kääb, A., Hoelzle, M., and Haeberli, W. (2003). “Local distribution pattern of discontinuous mountain permafrost. a process study at Flüela Pass, Swiss Alps,” in Proceedings of the 8th International Conference on Permafrost (Zurich), 21–25.
Luetscher, M., Borreguero, M., Moseley, G. E., Spotl, C., and Edwards, R. L. (2013). Alpine permafrost thawing during the medieval warm period identified from cryogenic cave carbonates. Cryosphere 7, 1073–1081. doi: 10.5194/tc-7-1073-2013
Luetschg, M., Lehning, M., and Haeberli, W. (2008). A sensitivity study of factors influencing warm / thin permafrost in the Swiss Alps. J. Glaciol. 54, 696–704. doi: 10.3189/002214308786570881
Marmion, M., Hjort, J., Thuiller, W., and Luoto, M. (2008). A comparison of predictive methods in modelling the distribution of periglacial landforms in Finnish Lapland. Earth Surf. Process. Landf. 2254, 2241–2254. doi: 10.1002/esp
Matsuoka, N., and Ikeda, A. (2001). Geological control on the distribution and characteristics of talus-derived rock glaciers. Ann. Rep. Inst. Geosci. Univ. Tsukuba 27, 11–16.
Monnier, S. (2006). Les Glaciers-Rocheux, Objets géogrAphiques, Ph. D. Thesis, Université Paris XII, Laboratoire de Géographie Physique EA.
Ramelli, G., Scapozza, C., Mari, S., and Lambiel, C. (2011). “Structure interne et dynamique des glaciers rocheux du massif de la Cima di Gana Bianca, Val Blenio (Tessin),” in La géomorphologie alpine: entre patrimoine et contrainte. Actes du colloque de la Société Suisse de Géomorphologie, 3–5 septembre 2009, eds C. Lambiel, E. Reynard, and C. Scapozza (Olivone: Institut de géographie de l'Université de Lausanne), 177–193.
Ribolini, A., and Fabre, D. (2006). Permafrost existence in rock glaciers of the argentera massif, maritime Alps, Italy. Permafr. Periglac. Process. 17, 49–63. doi: 10.1002/ppp.548
Ridefelt, H., Etzelmüller, B., Boelhouwers, J., and Jonasson, C. (2008). Statistic-empirical modelling of mountain permafrost distribution in the Abisko region, sub-Arctic northern Sweden. Nor. J. Geogr. 62, 278–290. doi: 10.1080/00291950802517890
Roer, I., Haeberli, W., Avian, M., Kaufmann, V., Delaloye, R., Lam-biel, C., et al. (2008). “Observations and considerations on desta–bilizing active rockglaciers in the European Alps,” in Proceedings of the Ninth International Conference on Permafrost, eds D. L. Kane and K. M. Hinkel (Fairbanks, AK: University of Alaska), 1505–1510.
Roudnitska, S., Charvet, R., Ribeyre, C., and Favreaux, B. L. (2016). Les Glaciers-Rocheux De Savoie: Inventaire, Cartographie Et Risques Associés - Rapport Provisoire. Chambery: Office National des Forets, Service de Restauration des Terrains en Montagne.
Sattler, K., Anderson, B., Mackintosh, A., and Norton, K. (2016). Estimating permafrost distribution in the maritime Southern Alps, New Zealand, based on climatic conditions at rock glacier sites. Front. Earth Sci. 4:4. doi: 10.3389/feart.2016.00004
Scapozza, C. (2008). Contribution a l'etude Geomorphologique Et Geodesique Des Elements Periglaciaire Des Alpes Tessinoise Orientales. Ph. D. Thesis, Universite de Lausanne.
Scapozza, C., Lambiel, C., Reynard, E., Fallot, J.-M., Antognini, M., and Schoeneich, P. (2010). Radiocarbon dating of fossil wood remains buried by the Piancabella rock glacier, Blenio Valley (Ticino, southern Swiss Alps): Implications for rock glacier, treeline and climate history. Permafrost Periglac. Process. 21, 90–96. doi: 10.1002/ppp.673
Schmid, M., Baral, P., Gruber, S., Shahi, S., Shrestha, T., and Stumm, D. (2014). Assessment of permafrost distribution maps in the Hindu Kush Himalayan region using rock glaciers mapped in Google Earth. Cryosphere Discuss. 8, 5293–5319. doi: 10.5194/tcd-8-5293-2014
Schoeneich, P., Ribeyre, C., Marcer, M., Bodin, X., and Brenguier, O. (2017). Etude Géomorphologique et Géophysique du Glacier Rocheux du Col du Lou, Suite à la Lave Torrentielle du 14 août 2015. Grenoble.
Scotti, R., Crosta, G. B., and Villa, A. (2017). Destabilisation of creeping Permafrost : the plator rock glacier case study (Central Italian Alps). Permafr. Periglac. Process. 28, 224–236. doi: 10.1002/ppp.1917
Keywords: permafrost modeling, French Alps, mountain permafrost, rock glaciers, statistical modeling
Citation: Marcer M, Bodin X, Brenning A, Schoeneich P, Charvet R and Gottardi F (2017) Permafrost Favorability Index: Spatial Modeling in the French Alps Using a Rock Glacier Inventory. Front. Earth Sci. 5:105. doi: 10.3389/feart.2017.00105
Received: 21 July 2017; Accepted: 30 November 2017;
Published: 15 December 2017.
Edited by:
Christian Hauck, University of Fribourg, SwitzerlandReviewed by:
Lukas Arenson, BGC Engineering, CanadaDavid Loibl, Humboldt-Universität zu Berlin, Germany
Karianne Lilleøren, Department of Geosciences, University of Oslo, Norway
Copyright © 2017 Marcer, Bodin, Brenning, Schoeneich, Charvet and Gottardi. This is an open-access article distributed under the terms of the Creative Commons Attribution License (CC BY). The use, distribution or reproduction in other forums is permitted, provided the original author(s) or licensor are credited and that the original publication in this journal is cited, in accordance with accepted academic practice. No use, distribution or reproduction is permitted which does not comply with these terms.
*Correspondence: Marco Marcer, marco.marcer@univ-grenoble-alpes.fr
Xavier Bodin, xavier.bodin@univ-savoie.fr