Stress Redistribution Explains Anti-correlated Subglacial Pressure Variations
 Pierre-Marie Lefeuvre1,2*
  Thomas Zwinger3
  Miriam Jackson2
  Olivier Gagliardini4
  Gaute Lappegard5 Jon Ove Hagen1
- 1Department of Geosciences, University of Oslo, Oslo, Norway
- 2Hydrology Department, Norwegian Water Resources and Energy Directorate, Oslo, Norway
- 3CSC-IT Center for Science Ltd., Espoo, Finland
- 4University of Grenoble Alpes, Centre National de la Recherche Scientifique, IRD, IGE, Grenoble, France
- 5Energy Management, Statkraft A.S., Oslo, Norway
We used a finite element model to interpret anti-correlated pressure variations at the base of a glacier to demonstrate the importance of stress redistribution in the basal ice. We first investigated two pairs of load cells installed 20 m apart at the base of the 210 m thick Engabreen glacier in Northern Norway. The load cell data for July 2003 showed that pressurisation of a subglacial channel located over one load cell pair led to anti-correlation in pressure between the two pairs. To investigate the cause of this anti-correlation, we used a full Stokes 3D model of a 210 m thick and 25–200 m wide glacier with a pressurised subglacial channel represented as a pressure boundary condition. The model reproduced the anti-correlated pressure response at the glacier bed and variations in pressure of the same order of magnitude as the load cell observations. The anti-correlation pattern was shown to depend on the bed/surface slope. On a flat bed with laterally constrained cross-section, the resulting bridging effect diverted some of the normal forces acting on the bed to the sides. The anti-correlated pressure variations were then reproduced at a distance >10–20 m from the channel. In contrast, when the bed was inclined, the channel support of the overlying ice was vertical only, causing a reduction of the normal stress on the bed. With a bed slope of 5 degrees, the anti-correlation occurred within 10 m of the channel. The model thus showed that the effect of stress redistribution can lead to an opposite response in pressure at the same distance from the channel and that anti-correlation in pressure is reproduced without invoking cavity expansion caused by sliding.
1. Introduction
Water pressure in the subglacial hydrological system controls glacier and ice-sheet seasonal dynamics. Our current understanding of the relationship between water pressure and ice flow is limited, however, due to complex feedback mechanisms (e.g., Schoof, 2010) and the scarcity of direct observations of the glacier bed. As a result, glacier hydrology is one of the greatest sources of uncertainty in predictions of land ice contribution to sea-level rise (IPCC, 2013). There is thus a need to better understand hydrologically-forced glacier sliding, the criterion for pressurisation of water in subglacial channels (Kamb, 1987; Iken and Truffer, 1997; Bartholomaus et al., 2008) and the interaction of the channel with the rest of the glacier bed (Hubbard et al., 1995; Andrews et al., 2014).
Pressurisation of subglacial channels occurs when the capacity of the drainage system cannot accommodate all the meltwater input (Bartholomaus et al., 2008). The duration of the pressurisation depends on the rate of melting of channel walls, which is mainly controlled by water flow and frictional heat production, the contraction of channels due to ice creep (Röthlisberger, 1972), and the initial capacity of the drainage system (Schoof, 2010). Melt and creep act at two different time scales: seconds to hours and hours to years, respectively, which makes channel geometry and thus pressurisation inherently unstable over time (Schoof, 2010; Kingslake and Ng, 2013). Large and rapid changes in meltwater input cause transient pressurisation (Bartholomaus et al., 2008). Pressurisation can also occur diurnally in summer if water input and the subglacial drainage system are close to steady-state, but experience variations on a sub-daily time scale (Fudge et al., 2008). Pressurisation greater than the ice overburden pressure is another important element of the glacier response as it causes hydraulic jacking of the glacier, stress redistribution at the glacier bed and mechanical uplift of the glacier surface (Bartholomaus et al., 2008). This mechanical response of the ice is little studied, however, and current models are unable to accurately reproduce observations (Sugiyama et al., 2007; Pimentel and Flowers, 2011).
The response of the glacier bed to pressurisation of the hydrological system is spatially different in the hydrologically connected parts of the bed compared to the unconnected parts. The pressure variations in the hydrologically connected parts are correlated with the channel pressure and the amplitude of the variations is controlled by subglacial hydraulic conductivity (Hubbard et al., 1995). The conductivity dictates that the amplitude is greatest in the subglacial channels and decays with distance from the channels. However, pressure variation in the unconnected drainage system is anti-correlated with the pressure in channels as reported from borehole data (Murray and Clarke, 1995; Dow et al., 2011; Andrews et al., 2014; Meierbachtol et al., 2016) and direct observations at the glacier bed (Lappegard et al., 2006; Lefeuvre et al., 2015). Which exact mechanism causes this type of anti-correlated pressure response is still uncertain, but observations point to the role of ice flow and stress redistribution at the bed. Murray and Clarke (1995) proposed that pressurised channels support part of the load from their surroundings, thus reducing pressure on hydrologically unconnected regions of the bed. Iken and Truffer (1997) and Andrews et al. (2014) suggested that pressurised channels cause sliding and, indirectly, cause the passive opening of cavities. The increase in cavity volume thus decreases the pressure in the isolated cavity system. These processes can be simplified and included in larger models as recently shown by Hoffman et al. (2016). However, there has been no model developed to study the effect of mechanical stress redistribution near subglacial channels and test whether anti-correlated pressure variations recorded at the glacier base can be reproduced.
The aim of this paper is to investigate the cause of observed anti-correlation in pressure at different parts of the glacier bed by comparing direct observations with numerical modelling. Lefeuvre et al. (2015) showed that anti-correlation of pressure variations is a persistent signal at the bed of Engabreen, a temperate glacier in Norway. Section 2 summarises pressure and hydro-meteorological data collected in July 2003 at Engabreen. The data analysis identifies the necessary condition for anti-correlated pressure variations. In section 3, a numerical model was used to reproduce the anti-correlation at the glacier bed for simple glacier and subglacial channel geometries. The data and model results were compared to explain anti-correlated pressure variations and show the important effect of stress redistribution at the glacier bed.
2. Anti-Correlated Pressure at the Glacier Bed
2.1. Field Site
This study focuses on subglacial observations from Engabreen, a hard-bedded maritime glacier in Northern Norway (Figure 1). Engabreen has an area of 36 km2 and is part of the western Svartisen ice cap, the second largest ice cap in continental Europe. Engabreen has a large plateau that narrows into a glacial valley to its northwest, with a mean surface slope of 6 degrees. In 1999, the elevation ranged from 14 m a.s.l. (above sea level) to 1,581 m a.s.l. (Andreassen et al., 2012). Above 1,100 m a.s.l., the plateau is relatively flat and ice flows at <18 m year−1 (Jackson et al., 2005). The glacier is steeper (>20 degrees) in the icefall below 900 m a.s.l., where velocities exceed 220 m year−1 (Messerli and Grinsted, 2015).
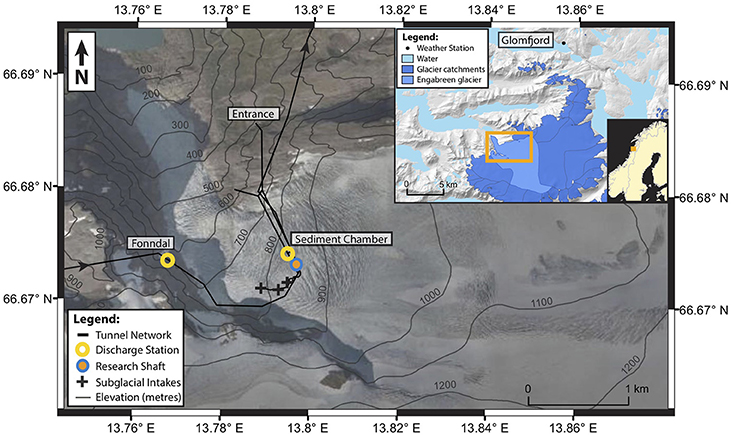
Figure 1. Engabreen and the Svartisen Subglacial Laboratory, with inset showing the extent of the glacier catchment, adapted from Lefeuvre et al. (2015). The discharge measured at Fonndal and Sediment Chamber stations is used to calculate subglacial discharge collected by the subglacial intakes. The load cells are installed near the research shaft. The background satellite image is from summer 2009 (source: Statens Kartverk).
The pressure at the glacier bed was recorded at the Svartisen Subglacial Laboratory. The laboratory is located about 200 m below the surface of the glacier within a hydropower rock tunnel network (Figure 1). Two research shafts connected to the main tunnel network give access to the glacier base (Figure 2). Experiments have been conducted in the subglacial laboratory to investigate ice rheology (e.g., Cohen et al., 2005; Cohen, 2017), sliding (e.g., Cohen et al., 2000), and basal hydraulics (e.g., Lappegard and Kohler, 2005). Long-term monitoring of basal pressure using load cells has also been undertaken since the opening of the facilities in 1992 (e.g., Lappegard et al., 2006; Lefeuvre et al., 2015). Near the research shaft, the overburden pressure is about 1.8 MPa and sliding in winter is 44 ± 7 m year−1 (Cohen et al., 2005).
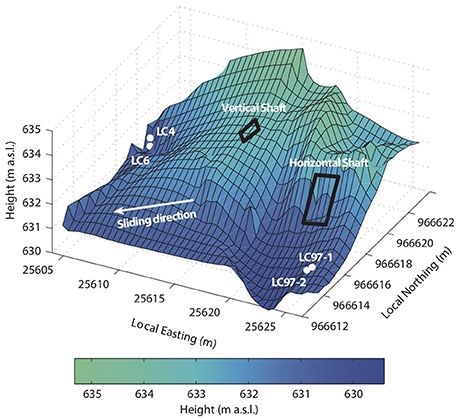
Figure 2. Map of the bed topography near the research shafts and location of the load cells, adapted from Lappegard et al. (2006).
2.2. Measurements
In this paper, we focus on data acquired in the period from 13 to 31 July 2003, that was identified in Lefeuvre et al. (2015) as a particularly distinct example of anti-correlated pressure variations. The pressure at the bed was recorded by two pairs of load cells that are permanently installed at the ice-rock interface (Figure 2). The first pair, LC4 and LC6, is located parallel to the ice flow direction, with LC4 facing down from a 1-m overhang and LC6 at the base of the cliff facing up (Figure 10 in Lappegard et al., 2006). The second pair is located 21 m away on a gentle lee slope, with LC97_1 45 cm upstream of LC97_2. A summary of their azimuth and tilt as well as distance from LC97_2 is given in Table 1. The load cells were installed in 1992 (LC4 and LC6) and 1997 (LC97_1 and LC97_2) at the location of pre-existing rock boreholes by melting an artificial cavity from the research shafts. The cavity closed after a few days and the load cells have recorded pressure at the glacier bed since then.
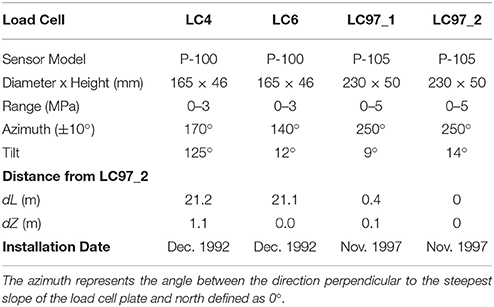
Table 1. Characteristics of the load cells.
The load cells measure normal stress at the glacier bed, which approximates local overburden pressure (Lappegard et al., 2006). A taut wire under the plate of the load cell vibrates at a frequency directly related to the applied load, which is calibrated with an error <1% of the total range (0–9 MPa, GEONOR AS, Oslo). There is little drift of the zero frequency in the first few years of installation and it is negligible over a period of a month (DiBiagio, 2003). The two load cell pairs show different levels of noise due to their model and plate size (Table 1), their environment, and the intensity of the subglacial changes. An analysis of the residuals computed from a 2-h running mean from June to September 2003 shows that the random error is <0.02 MPa for LC97_1 and LC97_2 and <0.001 MPa for LC6 and LC4. The data from all the load cells is recorded with a sample interval of 15 min on one datalogger located in the heated facility of the Svartisen Subglacial Laboratory. The load cells are connected to the datalogger via rock boreholes reaching the main tunnel network using 50-m long cables.
Regarding the subglacial environment above the load cells, Lefeuvre et al. (2015) determined that the load cells measure (1) ice pressure, when the load cell pressure is stable and close to overburden pressure (Lappegard et al., 2006); (2) water pressure, when pressure decreases from the ice overburden and varies synchronously with surface melt; and (3) the effect of transported rocks on pressure (Hagen et al., 1983) when not in phase with hydrological input, but this last effect is comparatively rare and neglected here.
Air temperature and precipitation were measured at a meteorological station in Glomfjord, 30 m a.s.l. and 18 km northeast of Engabreen (Figure 1). The station is maintained by the Norwegian Meteorological Institute. Air temperature was recorded hourly and precipitation daily, as shown in Figure 3A.
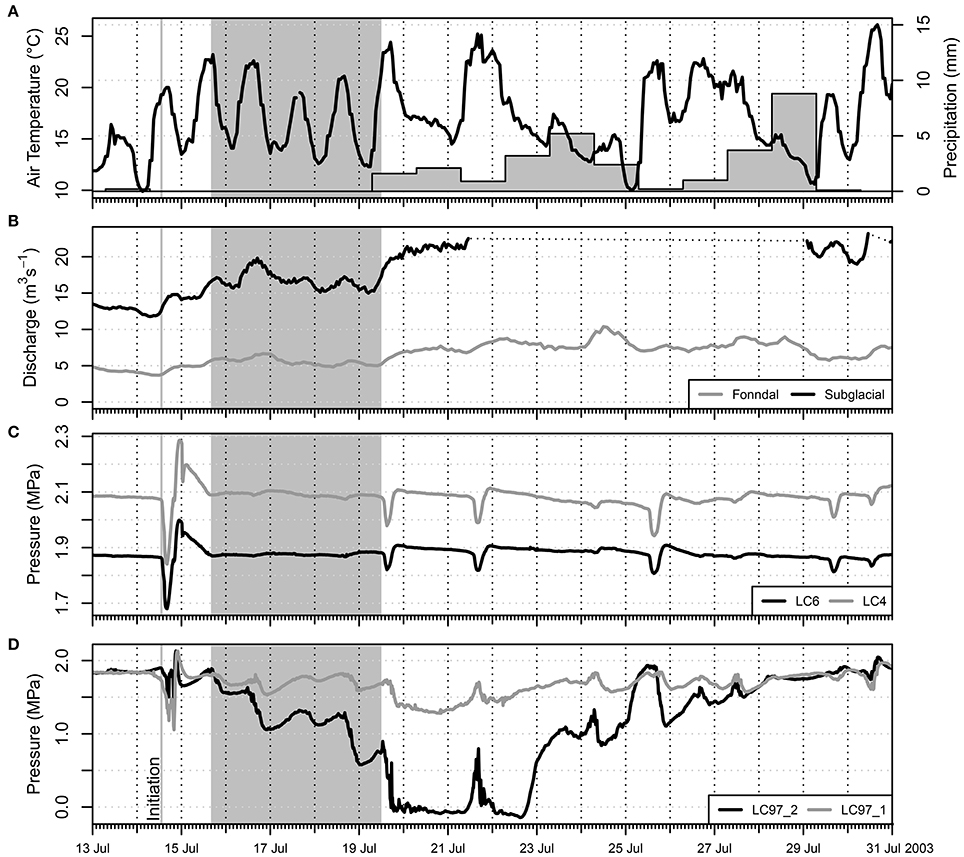
Figure 3. Observational data in July 2003. (A) Hourly air temperature and daily precipitation at Glomfjord 30 m a.s.l. and 18 km from Engabreen; (B) discharge at Fonndal station and calculated subglacial discharge; (C) load cell pressure records for LC6 and LC4; (D) and for LC97_1 and LC97_2. The shaded period is shown in Figure 4.
Discharge is permanently monitored within the tunnel network at two locations. The first station, Fonndal (Figure 1), records discharge from the catchment west of Engabreen, which has glacier cover of 84% and contribution from snow melt and rain. The second station, the Sediment Chamber station, collects water from Engabreen catchment through subglacial intakes (i.e., large openings connecting the glacier base to the underground tunnel network), as well as from the station Fonndal. The subglacial discharge from Engabreen was estimated by the difference in discharge measured at the two stations at a 2 h interval, which is the sampling frequency of Fonndal station (Figure 3). The random error in discharge was estimated at <0.5 m3s−1 based on an analysis of the residuals from a 12-h running mean. It was not possible to calculate subglacial discharge for discharge >30 m3s−1 because of a change in cross-section not accounted for in the rating curve at the Sediment Chamber station. Data were recorded at both stations between 13 and 20 July 2003 and showed that the discharge was in phase and had a mean daily correlation of 0.87 ± 0.07. When discharge from the Sediment Chamber was over 30 m3s−1, the discharge at Fonndal was used as an estimate of the subglacial discharge because both catchments share similar climatic conditions and a high glacier cover, and thus it is included in Figure 3B.
2.3. Results
Anti-correlated pressure variations between the load cells are a relatively common feature in the load cell record (Lefeuvre et al., 2015). The period of 13–31 July 2003 was chosen to investigate this phenomenon more closely. We especially focused on diurnal variations between 16 and 19 July (Figure 4). For a general description of the pressure variation in 2003 and correlation scores for this 18-day period, we refer to Lefeuvre et al. (2015).
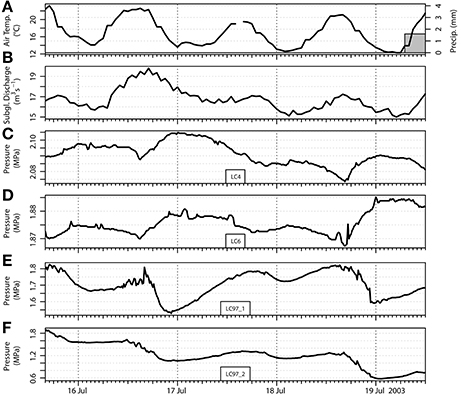
Figure 4. Enlargement of Figure 3 for the period 16–19 July 2003 showing the anti-correlated pressure between two pairs of load cells. (A) Hourly air temperature and daily precipitation at Glomfjord (30 m a.s.l.); (B) calculated subglacial discharge; (C–F) load cell pressure.
2.3.1. Hydro-Meteorological Data
Air temperature and precipitation were analysed to estimate surface melt, and discharge was used to assess the occurrence of pressurisation at the glacier base. Air temperature at the top of Engabreen (1,545 m a.s.l.) remained above 0°C during the study period as calculated from air temperature recorded at Glomfjord 18 km from Engabreen (30 m a.s.l.) and an assumed lapse rate of −6.5°C km−1 (Cuffey and Paterson, 2010). Hence there was melting over the entire glacier surface and the intensity of temperature variations and precipitation controlled the degree of surface melt.
The mean temperature increased gradually from 14°C on 13 July to 18°C on 15 July in Glomfjord. The temperature variations showed a strong diurnal signal that led to a similar although delayed response of the subglacial discharge. The intensity of the diurnal signal in air temperature and discharge was related, as shown by the decrease in air temperature and then discharge on 17 July (Figure 4). This diurnal response stopped on 20 July when there was precipitation recorded in Glomfjord and on 19 and 21 July when air temperature rapidly increased by 13 and 11°C, respectively.
Precipitation was continual from 19 July until 29 July although it remained modest with a daily mean of 3 mm and a daily maximum of 9 mm on 28 July. It is associated with a cooling and dampening of the diurnal signal in air temperature. These variations are reflected in the discharge signal between 22 and 25 July and between 27 and 29 July.
2.3.2. Pressure at the Glacier Bed
The pressure variations recorded at the two pairs of load cells LC4–LC6 and LC97_1-LC97_2 show the initiation and termination of the diurnal anti-correlated signal (Figures 3, 4), as well as a drop to atmospheric pressure at load cell LC97_2.
At the beginning of the studied period, the pressure at the load cells approximated the local overburden pressure and variations in pressure were correlated across the load cell network (Figures 3C,D). All load cells recorded a major pressure event on 14 July during which air temperature rose rapidly (Figure 3A). There was a drop in pressure followed by a peak and then a return to the background level on 15 July. The pressure drop highlighted with a vertical gray line in Figures 3C,D was concurrent with the maximum value of the subglacial discharge gradient (Figure 3B), a proxy for pressurisation in subglacial channels (Lappegard et al., 2006).
The pressure event on 14 July preceded daily variations in pressure at LC97_1 and LC97_2 from 15 to 20 July that were anti-correlated with a dampened diurnal signal at LC4 and LC6 (Figures 4C–F). The variations in pressure at LC97_1 and LC97_2 were correlated with hydro-meteorological data. The pressure at load cell LC97_2 decreased steadily between 15 and 20 July, while discharge steadily increased (Figures 4A,B). The diurnal peak in discharge lagged the peak in pressure at LC97_1 and LC97_2 by about 2 h, although the difference is at the limit of the temporal resolution of the discharge. The delay is not attributed to differences in discharge source or pathway as the subglacial drainage system is well-developed in July (Lefeuvre et al., 2015). Rather, this delay suggests that the maximum pressure at the glacier bed did not occur with the peak in discharge but with the peak in discharge gradient, and hence pressurisation in subglacial channels (Lappegard et al., 2006).
The amplitude of the pressure variations was greatest at load cell LC97_2 and decreased with distance. The average amplitude was 0.44 MPa at LC97_2, 0.17 MPa at LC97_1, 0.45 m upstream, and only 0.01 MPa at both LC4 and LC6, 21 m away from LC97_2 (Figures 2, 4C–F). The differences in amplitude suggest that the source of the anti-correlated pressure variation was downstream of LC97_1 and near LC97_2.
The pressure at LC97_2 fell to atmospheric pressure between 20 and 22 July, a period with relatively stable and cool weather (Figures 3A,D). On 20 July, the correlation between LC6 and the rest of the sensors became positive (Lefeuvre et al., 2015, LC97_1 in Figure 9). Atmospheric pressure indicates that the load cell was no longer in a pressurised system, and was instead located in an empty channel or cavity (see discussion in section 2.4). The other load cells (i.e., LC4, LC6, LC97_1) then showed little variation in pressure except on 21 July during a day of intense warming and subsequent surface melt. For LC97_1 installed 0.45 m upstream of LC97_2, the pressure remained higher than 1.3 MPa. The anti-correlation in pressure between the pairs LC4-LC6 and LC97_1-LC97_2 reappeared on 23 July.
The period of atmospheric pressure and anti-correlation between the sensor pairs then terminated on 29 July. This termination occurred gradually as air temperature dropped by nearly 15°C between 22 and 25 July and 10°C between 26 and 29 July. Meteorological conditions varied rapidly from day to day due to the succession of cold/warm fronts and rain (Figure 3A). The first sign of the termination was the rapid and then progressive rise in pressure at LC97_2 (Figure 3D). This period differed from that characterised by a diurnal signal as the pressure did not peak consistently in the afternoon. This may have been due to rain dominating both surface melt and runoff, as the contribution to water production of rain is not necessarily diurnal. The duration of the daily peaks in pressure as measured at LC97_1 and LC97_2 also became shorter after 25 July. On 29 July, the anti-correlation between the two pairs stopped, after two days with low temperatures and 4–9 mm of daily precipitation. After 29 July, a more stable high-pressure weather system prevailed with correspondingly strong diurnal fluctuations in temperature. The subglacial system returned to its initial state of 13 July and was characterised by pressure events detected at all load cells.
2.4. Data Interpretation
The most significant results of our observations are that both pairs of load cells respond to changes in glacier hydrology and that their anti-correlated variations in pressure demonstrate the role of stress redistribution in accommodating pressure changes at the glacier bed. Following Murray and Clarke (1995), we infer that these anti-correlated pressure variations identify a forcing-response relationship between the two pairs of load cells.
The variation in pressure at the first pair of load cells, LC97_1 and LC97_2, indicates the presence of a channel connected to the efficient drainage system and that the channel is located directly above one or both load cells. The presence of a channel explains the correlation of the pressure variations with discharge and temperature fluctuations between 15 and 20 July (Figure 4). During this period, the load cells LC97_1 and LC97_2 are assumed to be submerged in or in the proximity of a subglacial channel as the amplitude of their pressure variations was the greatest over the load cell network. Moreover, the decrease in pressure at LC97_2 from 15 July supports an increase in the capacity of the drainage system. This is corroborated later by the observation of atmospheric pressure at load cell LC97_2 when water was completely drained from the channel. Similar observations of atmospheric pressure were made when a subglacial cavity was artificially melted over them (Lappegard et al., 2006; Lefeuvre et al., 2015). Due to reduced melt input to the glacier base from 22 July onward, the channel contracted through ice creep and pressure returned to its background level. The channel at LC97_2 may also have migrated away from the load cells or been assimilated by a more efficient channel. Thus, this pair of load cells is inferred to have measured or responded to water pressure changes in a subglacial channel during 15–20 July and LC97_2 is assumed to have measured the forcing that caused the observed anti-correlation signal. The forcing showed diurnal pressure variations between 15 and 20 July as the meltwater input from the glacier surface was in balance with the subglacial drainage system. This equilibrium is common for stable summer conditions and leads to the daily pressurisation of the channelised drainage system.
In contrast, the load cell pair LC4 and LC6 was identified as isolated from the hydrological drainage system based on the anti-correlation in pressure with the pair LC97_1-LC97_2. The isolated drainage system was also determined from the high pressure, the general stability of the pressure signal, and the dampened response to changes in glacier hydrology (Murray and Clarke, 1995; Andrews et al., 2014). The response of the isolated system was caused by pressurisation of the channelised drainage system. Indeed, the start of the largest pressure events (e.g., 14, 19, 21, and 25 July) was linked to the peak in discharge gradient, a proxy for pressurisation. Pressurisation depends on meltwater input and the capacity of the drainage system. Days with successive diurnal melt (e.g., 15–20 July) showed an attenuated response of the bed, possibly due to the presence of more developed and stable channels that could accommodate the meltwater input. The pressure response at the load cell pair was also small when the channel was drained during the period with atmospheric pressure at LC97_2. The pressure at the pair of load cells LC4-LC6 was then considered to respond to the pressurisation in a channel located near LC97_1 and LC97_2.
The interpretation of the forcing-response relationship is that pressurisation in channels redistributes stress at the glacier bed and can reduce the load on the bedrock. This was particularly noticeable during 15–20 July when the pressure of the two pairs of load cells showed daily anti-correlated variations. There are different hypotheses on the effect of stress redistribution. Murray and Clarke (1995) showed a stress redistribution due to load transfer where channel pressurisation takes up the load of the overlying ice and from the channel surroundings, thus decreasing the nearby ice pressure. Another hypothesis for stress redistribution is that changes in ice dynamics can indirectly reduce the normal stress on the glacier bed (Iken and Truffer, 1997; Andrews et al., 2014). However, this hypothesis is less likely due to the orientation of load cells LC4 and LC6 parallel to the sliding direction, with one facing downwards and the other facing upwards (Lappegard et al., 2006). From our data, the pressurised channel seemed to cause the anti-correlated pressure response at the glacier bed. The pressure perturbation propagated laterally from the channel to the other load cells, although the forcing signal was dampened by a factor of 44 over a distance of only 21 m. Below we present results from numerical modelling which aims to reproduce (1) a subglacial channel that pressurises and redistributes stresses at the glacier bed, (2) the anti-correlation in pressure at different parts of the bed, and (3) the dampening of the intensity of the anti-correlation with distance.
3. Ice-Flow Model
The aim of the model was to reproduce the anti-correlated pressure variations observed at Engabreen assuming that anti-correlation is due to stress redistribution at the glacier bed. A full Stokes ice flow model is used to investigate the effect of daily pressurisation in a subglacial channel, represented as a pressure boundary condition, on the pressure response at the glacier bed.
3.1. Constitutive Equations
The dynamics of the glacier in response to channel pressure variations is described by the Stokes equations with velocity vector v and pressure p in the ice. The set of equations includes the conservation of mass for an incompressible fluid as well as the conservation of linear momentum:
where τ is the ice deviatoric stress tensor, ρice the density of ice and g the acceleration due to gravity.
The constitutive equation for ice is given by Glen's flow law:
where D is the strain rate tensor and η the effective viscosity, defined as:
The viscosity depends on the temperature dependent rate factor A and the flow law exponent n. The second invariant of the strain rate tensor is described as .
3.2. Boundary Conditions
The model setup consists of a 3D vertical slab of ice perpendicular to the main flow direction as shown in Figure 5. Atmospheric pressure at the glacier surface is neglected such that psurf = patm ≈ 0. The upstream and downstream boundaries extruded along the x-axis are periodic. The lateral boundary of the domain (y-axis) and above the channel are both constrained by a vanishing horizontal velocity, such that v·n|lat. = 0. This condition mimics a periodic boundary condition for the defined modelled geometry (see also section 3.3). A linear sliding law determines tangential sliding along the lateral and basal boundaries using a tuned and unique slip coefficient. Sliding at the bed and lateral margins is consistent with the ice at Engabreen being at the melting point, which reduces basal friction. Penetration of the ice into the bedrock is prevented by setting v·n|bed = 0. To simulate water pressure at the glacier base, an external pressure is imposed in the channel. The water pressure pwater varies from the overburden pressure with time t at a frequency f of one day as
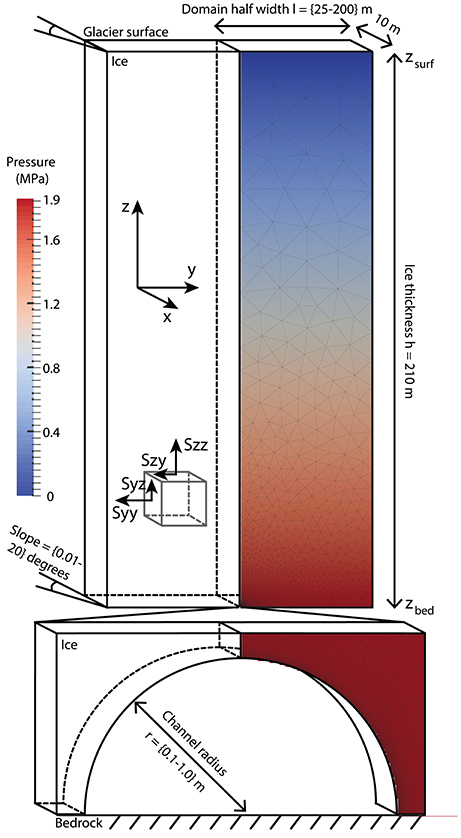
Figure 5. Geometry and discretisation of the model domain. Only one half of the subglacial channel and surrounding glacier ice is modelled due to symmetry. The colour represents pressure in the ice column for a constant water pressure in the subglacial channel that is equal to the balance hydrostatic pressure.
where Δp is the amplitude of the pressure variation relative to the overburden pressure pover, z is the elevation of the element and zbed is the elevation of the bed.
3.3. Numerical Setup
The model is solved numerically using the finite element method implemented in the Elmer/Ice software (e.g., Gagliardini et al., 2013). To reduce the complexity of the model, the surface and bed are uniform and have the same along-flow slope such that we consider only the interaction between the ice and a semi-circular Röthlisberger-type channel of radius r (Figure 5). To reduce computation time, only half of the semi-circular channel and glacier is modelled, which is justified by the symmetry of the domain at the channel centre. We have verified that modelling half the domain with the imposed symmetry condition is identical to results obtained with the whole domain. The relevant physical constants are given in Table 2.
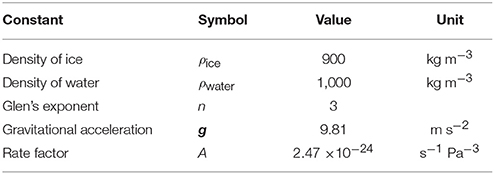
Table 2. Model constants.
The ice thickness h is equal to the thickness of Engabreen above the load cells, with bed elevation zbed = 0 m and surface elevation zsurf = h = 210 m. The lateral and basal boundary have essentially the same tangential sliding and no penetration conditions. The slip coefficient is tuned to reproduce the surface velocity above the load cells that is approximately 255 m year−1 (personal communication, Thomas Schellenberger). The coefficient is fitted for each domain width and slope and the values used are presented in Table 3. Engabreen is a temperate glacier, thus we use a constant rate factor A as shown in Table 2 (Cuffey and Paterson, 2010). In Equation (5), the pressure variation in the channel Δp is set to 0.1 MPa, which is the same order of magnitude as the forcing pressure variation measured by load cell LC97_2 (Figure 4) and frequency, f, is equal to 1 day−1. The applied time step is 15 min.
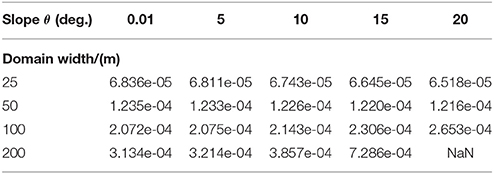
Table 3. Slip coefficient values in m Pa−1year−1 used to reproduce the surface velocity observed at Engabreen (section 3.3).
We investigate the effect imposed by the channel radius r, the bed/surface slope θ and the half domain width, l, which is the distance between the centre of the channel and the lateral boundary of the domain (Figure 5). The tested values are given in Table 4. The chosen range of channel radius is representative of observations in deglaciated forelands of alpine glaciers (Walder and Hallet, 1979), and of the same order of magnitude as those explored through glacier speleology (Gulley et al., 2012).
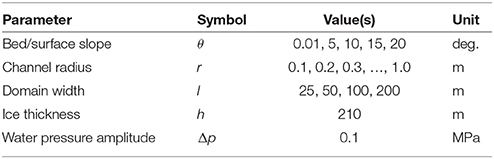
Table 4. Model parameters.
The irregular mesh has an element size of 20 m at the glacier surface, whereas at the lateral boundary of the bed the element size varies with the domain width l as l/20. The variation of the element size with distance enables the use of the same mesh geometry for different domain widths. The mesh is then extruded over a distance of 10 m along flow. Note that because of the periodic boundary condition, this distance has no influence on the results and that only one extruded element is necessary. The effect of the element spacing on the solution convergence is tested for 0.001–0.1 m at the channel boundary and 2.5–50 m at the lateral boundary of the domain. A consistent solution is obtained for an element size below 0.01 m although it may misrepresent the pressure on the exact edge of the channel due to a singularity problem (Ng, 2000). In order to correctly capture the channel geometry and the stress concentration, assuming a material that is continuous up to centimetre scales, an element width of 0.01 m is applied at the surface of the channel.
3.4. Results
We present the results of the model run with the time varying water pressure as given in Equation (5). The stress field and the profile of the normal stress at the glacier bed were investigated as a function of time and distance from the channel and for a large range of parameters as listed in Table 4. Figures 6–8 show four model results with a width of 50 and 200 m, a channel radius of 0.5 m and a bedrock/surface slope of 0.01 deg. (“flat bed”) and 5 deg. (“inclined bed”). The load cell observations show that the anti-correlation occurred over a distance of 21 m, so results are displayed for the first 50 m only of the modelled domains. All models reproduce the anti-correlation pattern at the glacier bed although the anti-correlation occurs near the lateral boundary for a flat bed and near the channel for an inclined domain (Figure 6).
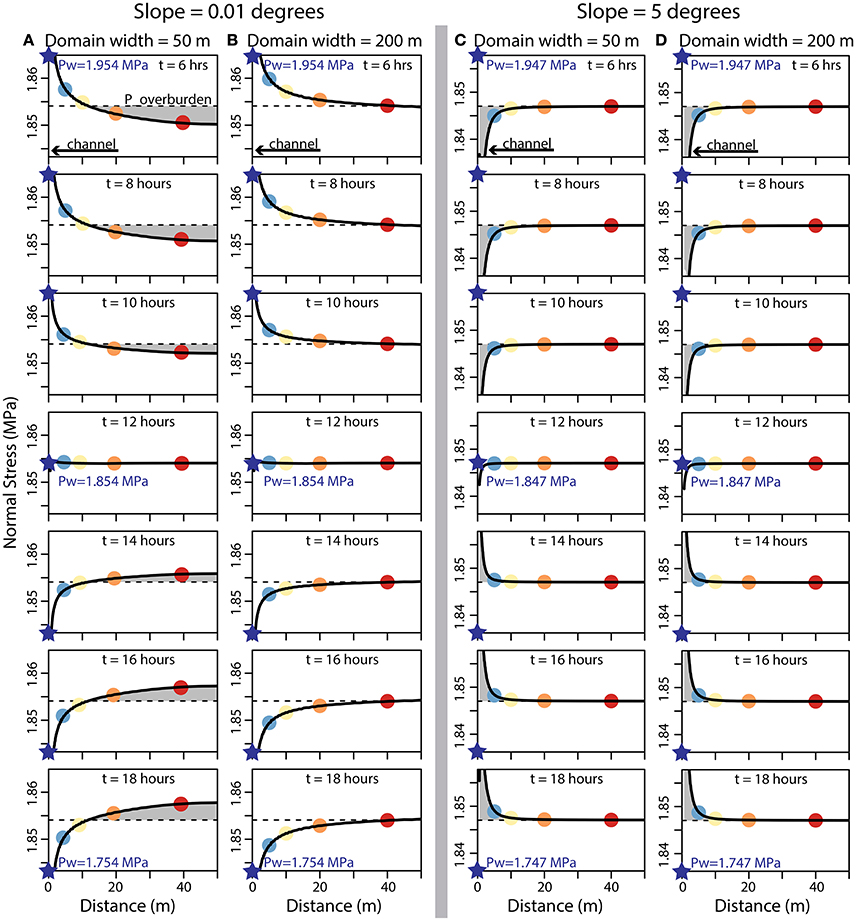
Figure 6. Normal stress profile at the glacier bed from 6 to 18 h after initialisation for a flat bed with (A) a domain width of 50 m and (B) 200 m and (C,D) for a bed slope of 5 degrees with the same domains. The anti-correlation between the water pressure (blue star) in the channel (radius of 0.5 m) and a point on the bed is shaded in grey. Points in blue, yellow, orange, and red highlight the normal stress at 5, 10, 20, and 40 m from the channel centre, respectively and are plotted over time in Figure 7.
At the first time step, water pressure is equal to the ice overburden pressure and presents the same characteristics as shown in Figure 6 at t = 12 h when pwater = pover and in Figure 8A. The model displays surface velocities close to 255 m year−1 and some perturbation in the stress field on the order of 1–10 kPa near the subglacial channel. This small difference in the stress field near the channel is caused by a singularity problem (Ng, 2000; Lappegard, 2006), as well as a slight deviation in water pressure from the balance pressure inside the channel (Gagliardini et al., 2007). However, this effect is negligible and the normal stress at the glacier bed is thus considered to be approximately equal to the overburden pressure.
For a flat bed, the normal stress is correlated with the forcing close to the channel (Figures 6A,B) and anti-correlated near the lateral boundary (Figures 7A–C). Sliding dominates surface velocity and plug-flow of the glacier occurs. At the edge of the channel, the normal stress returns rapidly from the correlated water pressure to the overburden pressure of ≃1.854 MPa as shown in Figure 8B. Normal stress reaches the overburden at a point of contraflexure xflexure at 12 m for the 50 m domain (Figure 6A) and at 50 m for the 200 m domain (Figure 6B). The position of the point of contraflexure is related to the half domain width, l, such that xflexure~l/4 and is independent of the channel size. Beyond this point, the normal stress shows an anti-correlated response that increases in amplitude with distance. When water pressure is at its highest at t = 6 h, the normal stress in the 50 m domain reaches its lowest value, approximately 1.85 MPa, at the lateral boundary (Figure 6A). At t = 18 h, water pressure is at its minimum value of 1.754 MPa, and the normal stress is at its maximum of 1.858 MPa at 50 m. The anti-correlation also occurs in the 200 m domain but is strongly attenuated and at a greater distance from the channel (Figure 7A). In both models, the response in normal stress is synchronised with the forcing (i.e., water pressure) at any distance from the channel as shown in Figure 7A.
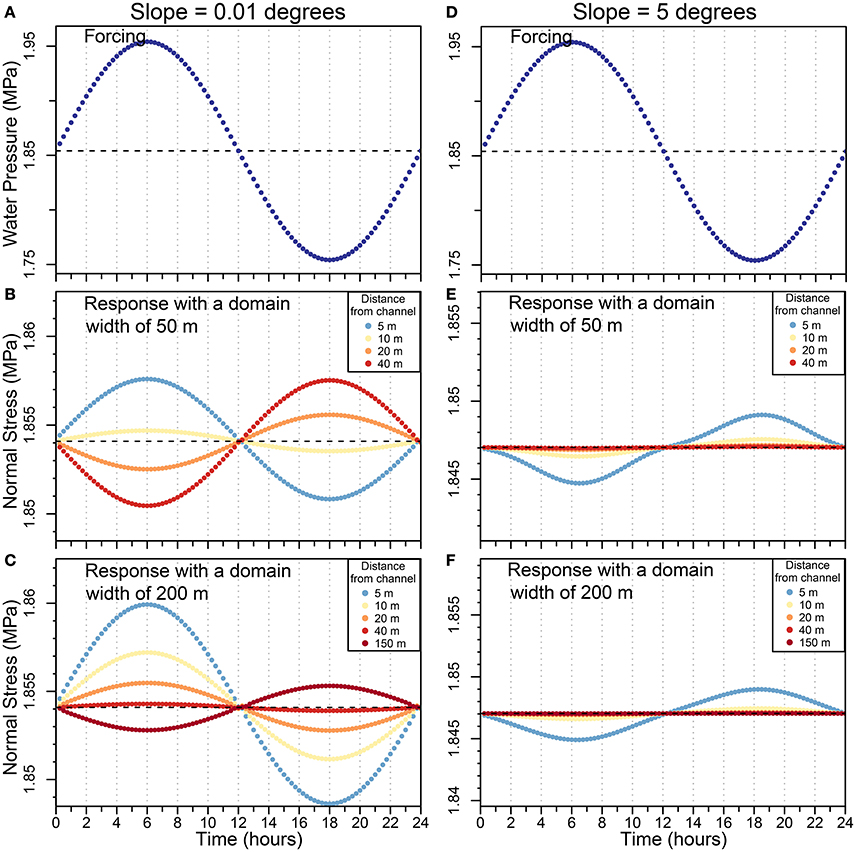
Figure 7. Temporal variation in normal stress at the glacier bed forced by (A–D) a varying water pressure inside a channel of 0.5 m radius for a period of 24 h and for slopes of (B,C) 0.01 degrees and (E,F) 5 degrees as well as two domain widths of (B–E) 50 m and (C–F) 200 m. Normal stresses are calculated at 5, 10, 20, 40, and 150 m from the channel centre.
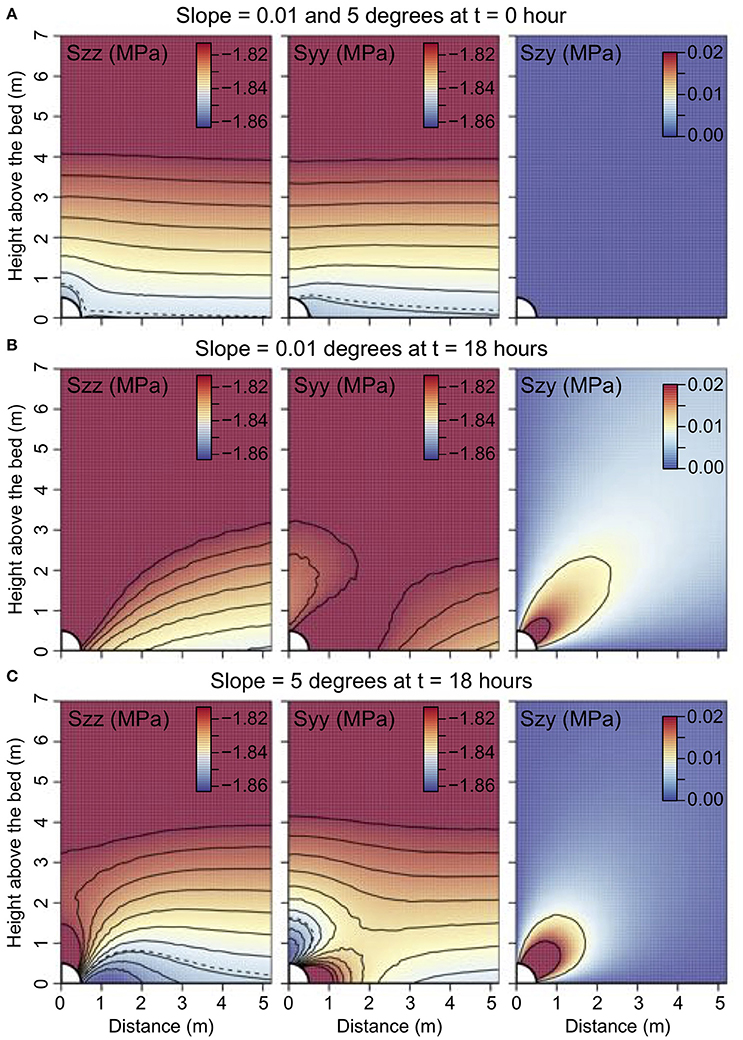
Figure 8. Components of the stress tensor Szz, Syy, and Szy near the channel for the timesteps (A) t = 0 h and (B,C) t = 18 h and for slopes of (A,B) 0.01 degrees and (A,C) 5 degrees (domain width is 50 m). The water pressure approximates the overburden pressure at t = 0 and is at its lowest pressure at t = 18. The dashed contour line in the panels Szz and Syy shows where stresses are equal to the overburden pressure if there was no channel. The anti-correlation occurs close to the channel (C), where the overburden contour lies above the bed. The figure covers only the first 7 m above and the first 5 m along the bed. The colour for the stresses is cut-off to highlight the variations at the bed.
To investigate the effect of the model domain on the anti-correlated pressure variations for a flat bed, a sensitivity test was conducted for channel radii of 0.1–1.0 m and domain widths of 25–200 m, as shown in Table 4. Figure 9A summarises the results for each combination by showing the maximum amplitude of the anti-correlation in normal stress on the bed. The amplitude of the anti-correlated pressure variations increases with channel radius and decreases with domain width. The anti-correlation vanishes as the domain width tends towards the ice thickness at Engabreen of ~210 m.
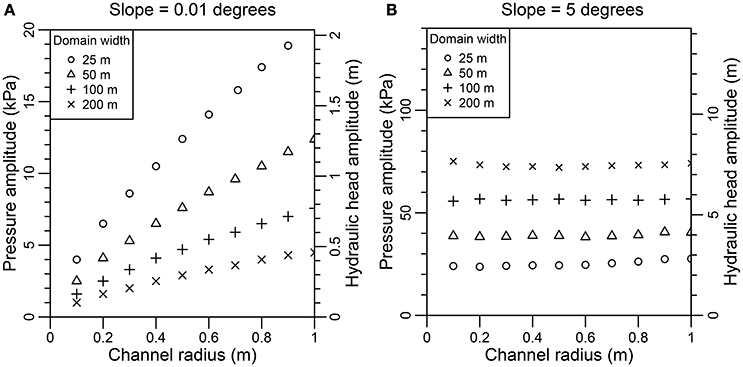
Figure 9. Maximum amplitude of the anti-correlated pressure variation on the bed as a function of subglacial channel radius and domain width for a bed/surface slope of (A) 0.01 degrees and (B) 5 degrees. The amplitude of the forcing or pressure in the channel is 200 KPa. The amplitude is given as pressure P (left-axis) and as hydraulic head h (right-axis) that is calculated using P = ρwatergh and assuming that the pressure at the bed is equal to the water pressure.
Compared with the flat bed results, the anti-correlation in pressure peaks closer to the channel for greater bed slope as seen in Figures 6C,D, 7E,F. The peak, anti-correlated with water pressure, rapidly returns to the overburden pressure at a distance of 10–20 m. As a result, the flat and inclined bed produce the opposite response at the same distance from the channel (Figures 8B,C). The amplitude of the peak increases slightly with slope as the amplitude of the water pressure variations Δp does not account for lower pressure on the bed with higher slope. It also increases for larger domain widths and, to some extent, larger channel diameters (Figure 9B). The pattern in anti-correlation is independent of the glacier width, however, as shown in Figures 6C,D. The transition between the two regimes in anti-correlation depends on the slope and appears to occur within a few degrees of the flat bed.
4. Discussion
The combination of data analysis and model results is essential in identifying the cause(s) of anti-correlation in pressure at the glacier bed. The model reproduces the general anti-correlation in normal stress at the glacier bed between a pressurised channel and the assumed isolated drainage system. The model results are consistent with the load cell observations, especially the amplitude of the daily fluctuations and correlation shown in Figure 4. We infer that the anti-correlated variations in normal stress are caused by pressurisation in channels and stress transfer, either vertically or laterally.
The model case with the flat bed or plug-flow shows lateral stress transfer. The anti-correlation depends on the proximity of the lateral boundary of the model domain to the channel. Indeed, the boundary location is shown to strongly affect the amplitude and location of the anti-correlation (Figure 9). This boundary condition appears to block the lateral flow of the ice induced by pressurisation in the channel. This compressive regime on the lateral boundary creates a stress bridging effect that supports the overlying ice and reduces the load on the bed. When the pressure in the channel becomes lower than the overburden pressure, the bed supports a greater ice load and normal stress on the bed increases.
The model case with an inclined bed shows that vertical stress transfer dominates the anti-correlated pressure. An inclined bed increases the lateral velocity gradient and the longitudinal stress, thus increasing ice deformation and leading to a reduction in the effective viscosity (Equation 4). High water pressure in the channel opposes the ice pressure above it and reduces the normal stress in the vicinity. The anti-correlation is closer to the channel for an inclined bed than for a flat bed, occurring over the first 10 m as opposed to at the edge of the model domain.
The observation of the anti-correlation at the load cells can be a result of both mechanisms. A lateral stress transfer is possible due to the complex 3D geometries at the glacier bed (i.e., cliff and overhang near the load cell pair LC4-LC6) and sliding dominating ice flow in the ice fall above the load cell. Nevertheless, pure plug flow is unlikely as the slope in the ice fall on Engabreen and longitudinal stress favour high deformation. The ratio of summer to winter velocity (personal communication, Thomas Schellenberger) and local sliding observations at the bedrock indicate that sliding represents a minimum of 53–60 % of the ice flow above the load cells. Lateral transfer may be more important in ice-streams where plug flow is more common, or in cold-based glaciers where velocity gradients are low and ice is stiffer. Vertical stress transfer is most likely the cause of the observed anti-correlated pressure variations at Engabreen, as it occurred for a larger range of ice deformation. The resulting short-range anti-correlation, however, may not cover the distance between the channel at the load cell pair LC97_1 and LC97_2 and the pair LC_6-LC_4. It may cover longer distances if there are several connected channels widely distributed at the glacier base. In other words, the signal recorded at the load cells is not unique, and can be caused by different channel configurations. At Engabreen, smaller channels exist due to complex bedrock geometry as observed in recently deglaciated terrains at the glacier front (Chapter 4 in Messerli, 2015), although the hydraulic potential forces water flow to converge near the subglacial intakes close to the location of the load cells (Figure 4.6 in Christianson, 2011).
The amplitude of the anti-correlated pressure variations observed at the pair LC4-LC6 (i.e., 10 kPa) is reproduced in the model, though the same amplitude can be obtained for several combinations of slope, channel radius and domain width (Figure 9). It is anticipated that it will also vary with the amplitude of the forcing/water pressure applied to the subglacial channel, the geometry of the channel, and the bedrock topography; although these parameters were not tested in this study. The greater the stress transfer due to these factors, the larger the amplitude.
The model also investigates a close to steady-state condition with a forcing of 200 kPa. In practice, the subglacial drainage system is usually not in steady-state (Bartholomaus et al., 2008; Schoof, 2010). More rapid pressurisation and water drainage may explain the 100 kPa anti-correlated pressure event as measured in the isolated drainage system on 19 July (load cell pair LC4-LC6). Nevertheless, the steady-state channel approach enables us to neglect complex mechanisms such as hydraulic jacking and flooding of areas adjacent to channels, and to concentrate on the effect of pressurisation on stress redistribution.
One drawback of the model is that it does not account for evolving geometry and lateral opening of the channel. This was omitted, as the inclusion of channel growth and migration made the model unstable because of too large deformation at the channel edge. The stability of the hydrological system may nevertheless be greater at the glacier bed because of the support of the ice on small-scale bedrock roughness as discussed in Creyts and Schoof (2009). The opening of the channel is also assumed to be small because the applied diurnal fluctuation in water pressure is small (Table 4) relative to the overburden pressure.
Ice deforms as a viscous material in the model (section 3.1). However, on short time scales from seconds to days, glaciers are known to accommodate some part of the stresses elastically (Sugiyama et al., 2007; Gudmundsson, 2011). The relaxation time τve after which the viscous component dominates the elastic component is obtained from the Maxwell relation that gives τve = η/μ with η the effective viscosity and μ = 9 × 10⁹ Pa the elastic modulus (Schulson and Duval, 2009, p. 59). The effective viscosity is computed based on with A the rate factor in Table 2 and for glacier ice at a stress of τe=100 kPa. The obtained relaxation time is 38 min, and thus viscous flow dominates ice flow over the studied hourly timescale. The importance of the viscous response is furthermore motivated by the observation of an exponential decrease in pressure after large pressure events (e.g., 14 July) that indicates viscous relaxation of the stresses at the glacier bed (Lefeuvre et al., 2015).
Other observations show an attenuation of the anti-correlated response between a pressurised subglacial channel and the isolated drainage system. Dampening by one order of magnitude of the anti-correlated response is observed from water pressure in boreholes in the Greenland ice sheet (Meierbachtol et al., 2013; Andrews et al., 2014) and alpine glaciers (Gordon et al., 1998; Schoof et al., 2014), although the difference in amplitude is sometimes small (Murray and Clarke, 1995; Dow et al., 2011). Capturing the spatial variation of this dampening can help to identify the origin of the anti-correlation and whether it is a response caused by ice dynamics or, as observed here, by the hydrological system. If the anti-correlation was due to ice dynamics, the dampening would occur over large scales (kilometres) and would depend on variation of sliding and small scale bedrock topography. Hoffman et al. (2016) developed a conceptual model of the isolated drainage system that may reproduce the spatial variation of the dampening according to the constitutive equation of the isolated drainage system although the spatial variation is not shown in their study. Observations in Greenland also show that boreholes can remain connected to an isolated drainage system over the entire melt season (Andrews et al., 2014), although the advection of boreholes due to ice flow can cause disconnection between the boreholes and subglacial cavities. In contrast to anti-correlation in pressure caused by expansion of cavities (indirectly) due to sliding, our observations and modelling of the dampening due to channel pressurisation show that anti-correlation is very local to the subglacial pressurised drainage system.
Another result of this analysis is that the load cells are found to mostly measure pressure in the isolated drainage system, although data presented here from July 2003 show that the more exposed load cell pair, LC97_1-LC97_2, also measures pressure in hydrologically connected channels. This interpretation of the isolated drainage system differs from that of Lappegard et al. (2006). They suggest that the correlation of the pressure variations at the load cells reflects pressurisation in the hydrological system and water seeping out of subglacial channels. This study assumes instead that pressurisation in the hydrological system causes stress redistribution at the glacier bed. The 20-year load cell data are therefore an archive of the response of the isolated drainage system.
5. Conclusions
Anti-correlated subglacial pressure variations from sensors installed at the base of Engabreen were studied using a 2-week period of observations when the effect was particularly well-represented. The load-cell data from two pairs of load cells situated 20 m apart were analysed to understand the effect and propagation of hydrological pressurisation on the glacier bed. Based on these direct subglacial observations, we identified a forcing-response relationship. The forcing pressure is recorded at one pair located in a pressurised subglacial channel. The other pair measures the pressure response in a hydrologically isolated part of the glacier bed. We hypothesise that stress redistribution caused by pressurisation in the channel explains the anti-correlated pressure response.
We tested this hypothesis using a full-Stokes ice-flow model with a simplistic geometry to investigate whether a pressurised channel could cause the observed anti-correlation in ice pressure normal to the bed. The model reproduces anti-correlation at different parts of the bed and the amplitude of the anti-correlation. The model shows that channel pressurisation causes lateral or vertical ice flow away from the channel that transfers stress supporting the load of the overlying ice and reduces normal stress on the bed. Conversely, decreasing pressure in the channel leads to an increase of the load on the bed. These mechanisms of stress redistribution exist when water pressure in subglacial channels either vertically supports the roof of the channel under high strain rate (“inclined bed”) or causes lateral ice flow obstructed by bedrock under a low strain rate (“flat bed”). The model demonstrates the dependence of the anti-correlated signal's amplitude on the slope, geometry of the glacier, and channel. The amplitude of the anti-correlation is thus site-dependent and an indication of the level of support occurring at the glacier base. The modelling results are significant because they show that there are mechanisms other than cavity expansion that can produce anti-correlated pressure.
Author Contributions
P-ML, TZ, and MJ: designed the study; GL and MJ: collected the load cell data; P-ML and MJ: analysed the data; P-ML, TZ, and OG: conducted the modelling work; P-ML: wrote the paper; All authors discussed the results and edited the manuscript.
Funding
This publication is contribution number 66 of the Nordic Centre of Excellence SVALI, “Stability and Variations of Arctic Land Ice”, funded by the Nordic Top-level Research Initiative (TRI). TZ's work was supported by the Nordic Centre of Excellence eSTICC, “eScience tools for investigating Climate Change in Northern High Latitudes”.
Conflict of Interest Statement
The authors declare that the research was conducted in the absence of any commercial or financial relationships that could be construed as a potential conflict of interest.
Acknowledgments
Climate data were provided by the Norwegian Meteorological Institute through their database, eKlima.no. The authors would like to thank Statkraft and NVE for providing discharge/load cell data, access and maintenance of the Svartisen Subglacial Laboratory. We would like to thank the Editor Shin Sugiyama and two reviewers for their help in significantly improving the quality of this manuscript.
References
Andreassen, L. M., Winsvold, S. H., Paul, F., and Hausberg, J. E. (2012). Inventory of Norwegian Glaciers. Technical Report 38, Norwegian Water Resources and Energy Directorate (NVE), Oslo.
Andrews, L. C., Catania, G. A., Hoffman, M. J., Gulley, J. D., Lüthi, M. P., Ryser, C., et al. (2014). Direct observations of evolving subglacial drainage beneath the Greenland Ice Sheet. Nature 514, 80–83. doi: 10.1038/nature13796
Bartholomaus, T. C., Anderson, R. S., and Anderson, S. P. (2008). Response of glacier basal motion to transient water storage. Nat. Geosci. 1, 33–37. doi: 10.1038/ngeo.2007.52
Christianson, K. A. (2011). Geophysical Exploration of Glacier Basal Processes and Grounding Line Dynamics. Ph.D. thesis, Pennsylvania State University.
Cohen, D. (2017). Rheology of ice at the bed of Engabreen, Norway. J. Glaciol. 46, 611–621. doi: 10.3189/172756500781832620
Cohen, D., Hooke, R. L., Iverson, N. R., and Kohler, J. (2000). Sliding of ice past an obstacle at Engabreen, Norway. J. Glaciol. 46, 599–610. doi: 10.3189/172756500781832747
Cohen, D., Iverson, N. R., Hooyer, T. S., Fischer, U. H., Jackson, M., and Moore, P. L. (2005). Debris-bed friction of hard-bedded glaciers. J. Geophys. Res. 110:F02007. doi: 10.1029/2004JF000228
Creyts, T. T., and Schoof, C. (2009). Drainage through subglacial water sheets. J. Geophys. Res. 114:F04008. doi: 10.1029/2008JF001215
Cuffey, K. M., and Paterson, W. S. B. (2010). The Physics of Glaciers, 4th Edn. Burlington, MA: Elsevier/Butterworth-Heinemann.
DiBiagio, E. (2003). “A case study of vibrating-wire sensors that have vibrated continuously for 27 years,” in 6th International Symposium on Field Measurements in GeoMechanics (Oslo: NGI; Taylor & Francis), 1–15.
Dow, C. F., Kavanaugh, J. L., Sanders, J. W., Cuffey, K. M., and MacGregor, K. R. (2011). Subsurface hydrology of an overdeepened cirque glacier. J. Glaciol. 57, 1067–1078. doi: 10.3189/002214311798843412
Fudge, T. J., Humphrey, N. F., Harper, J. T., and Pfeffer, W. T. (2008). Diurnal fluctuations in borehole water levels: Configuration of the drainage system beneath Bench Glacier, Alaska, USA. J. Glaciol. 54, 297–306. doi: 10.3189/002214308784886072
Gagliardini, O., Cohen, D., Råback, P., and Zwinger, T. (2007). Finite-element modeling of subglacial cavities and related friction law. J. Geophys. Res. 112:F02027. doi: 10.1029/2006JF000576
Gagliardini, O., Zwinger, T., Gillet-Chaulet, F., Durand, G., Favier, L., De Fleurian, B., et al. (2013). Capabilities and performance of Elmer/Ice, a new-generation ice sheet model. Geosci. Model Dev. 6, 1299–1318. doi: 10.5194/gmd-6-1299-2013
Gordon, S., Sharp, M., Hubbard, B., Smart, C., Ketterling, B., and Willis, I. (1998). Seasonal reorganization of subglacial drainage inferred from measurements in boreholes. Hydrol. Process. 12, 105–133. doi: 10.1002/(SICI)1099-1085(199801)12:1<105::AID-HYP566>3.0.CO;2-#
Gudmundsson, G. H. (2011). Ice-stream response to ocean tides and the form of the basal sliding law. Cryosphere 5, 259–270. doi: 10.5194/tc-5-259-2011
Gulley, J. D., Walthard, P., Martin, J., and Banwell, A. F. (2012). Conduit roughness and dye-trace breakthrough curves: why slow velocity and high dispersivity may not reflect flow in distributed systems. J. Glaciol. 58, 915–925. doi: 10.3189/2012JoG11J115
Hagen, J. O., Wold, B., Liestøl, O., Østrem, G., and Sollid, J. L. (1983). Subglacial processes at Bondhusbreen, Norway: preliminary results. Ann. Glaciol. 4, 91–98. doi: 10.3189/S0260305500005292
Hoffman, M. J., Andrews, L. C., Price, S. F., Catania, G. A., Neumann, T. A., Lüthi, M. P., et al. (2016). Greenland subglacial drainage evolution regulated by weakly connected regions of the bed. Nat. Commun. 7:13903. doi: 10.1038/ncomms13903
Hubbard, B. P., Sharp, M. J., Willis, I. C., Nielsen, M. K., and Smart, C. C. (1995). Borehole water-level variations and the structure of the subglacial hydrological system of Haut Glacier d'Arolla, Valais, Switzerland. J. Glaciol. 41, 572–583. doi: 10.3189/S0022143000034894
Iken, A., and Truffer, M. (1997). The relationship between subglacial water pressure and velocity of Findelengletscher, Switzerland, during its advance and retreat. J. Glaciol. 43, 328–338. doi: 10.3189/S0022143000003282
IPCC (2013). Climate Change 2013: The Physical Science Basis. Contribution of Working Group I to the Fifth Assessment Report of the Intergovernmental Panel on Climate Change. Working Group I Contribution to the Fifth Assessment Report of the Intergovernmental Panel on Climate Change. Cambridge University Press, Cambridge, UK; New York, NY.
Jackson, M., Brown, I., and Elvehøy, H. (2005). Velocity measurements on Engabreen, Norway. Ann. Glaciol. 42, 29–34. doi: 10.3189/172756405781812655
Kamb, B. W. (1987). Glacier surge mechanism based on linked cavity configuration of the basal water conduit system. J. Geophys. Res. 92, 9083–9100.
Kingslake, J., and Ng, F. S. L. (2013). Modelling the coupling of flood discharge with glacier flow during jökulhlaups. Ann. Glaciol. 54, 25–31. doi: 10.3189/2013AoG63A331
Lappegard, G. (2006). Basal Hydraulics of Hard-Bedded Glaciers: Observations and Theory Related to Engabreen, Norway. Ph.D. thesis, University of Oslo.
Lappegard, G., and Kohler, J. (2005). Determination of basal hydraulic systems based on subglacial high-pressure pump experiments. Ann. Glaciol. 40, 37–42. doi: 10.3189/172756405781813681
Lappegard, G., Kohler, J., Jackson, M., and Hagen, J. O. (2006). Characteristics of subglacial drainage systems deduced from load-cell measurements. J. Glaciol. 52, 137–148. doi: 10.3189/172756506781828908
Lefeuvre, P.-M., Jackson, M., Lappegard, G., and Hagen, J. O. (2015). Interannual variability of glacier basal pressure from a 20 year record. Ann. Glaciol. 56, 33–44. doi: 10.3189/2015AoG70A019
Meierbachtol, T. W., Harper, J. T., and Humphrey, N. F. (2013). Basal drainage system response to increasing surface melt on the Greenland ice sheet. Science 341, 777–779. doi: 10.1126/science.1235905
Meierbachtol, T. W., Harper, J. T., Humphrey, N. F., and Wright, P. J. (2016). Mechanical forcing of water pressure in a hydraulically isolated reach beneath Western Greenland's ablation zone. Ann. Glaciol. 57, 62–70. doi: 10.1017/aog.2016.5
Messerli, A. (2015). Surface Velocities and Hydrology at Engabreen: Observations from Feature Tracking and Hydro-meteorological Measurements. Ph.D. thesis, University of Copenhagen, Denmark.
Messerli, A., and Grinsted, A. (2015). Image georectification and feature tracking toolbox: ImGRAFT. Geosci. Instrum. Methods Data Syst. 4, 23–34. doi: 10.5194/gi-4-23-2015
Murray, T., and Clarke, G. K. C. (1995). Black-box modeling of the subglacial water system. J. Geophys. Res. Solid Earth 100, 10231–10245. doi: 10.1029/95JB00671
Ng, F. S. L. (2000). Coupled ice-till deformation near subglacial channels and cavities. J. Glaciol. 46, 580–598. doi: 10.3189/172756500781832756
Pimentel, S., and Flowers, G. E. (2011). A numerical study of hydrologically driven glacier dynamics and subglacial flooding. Proc. R. Soc. A 467, 537–558. doi: 10.1098/rspa.2010.0211
Röthlisberger, H. (1972). Water pressure in intra- and subglacial channels. J. Glaciol. 11, 177–203. doi: 10.3189/S0022143000022188
Schoof, C. (2010). Ice-sheet acceleration driven by melt supply variability. Nature 468, 803–806. doi: 10.1038/nature09618
Schoof, C., Rada, C. A., Wilson, N. J., Flowers, G. E., and Haseloff, M. (2014). Oscillatory subglacial drainage in the absence of surface melt. Cryosphere 8, 959–976. doi: 10.5194/tc-8-959-2014
Schulson, E. M., and Duval, P. (2009). Creep and Fracture of Ice. Cambridge: Cambridge University Press.
Sugiyama, S., Bauder, A., Weiss, P., and Funk, M. (2007). Reversal of ice motion during the outburst of a glacier-dammed lake on Gornergletscher, Switzerland. J. Glaciol. 53, 172–180. doi: 10.3189/172756507782202847
Keywords: subglacial processes, glacier hydrology, glacier mechanics, glacier modelling, Svartisen Subglacial Laboratory, Engabreen, stress redistribution, load cell
Citation: Lefeuvre P-M, Zwinger T, Jackson M, Gagliardini O, Lappegard G and Hagen JO (2018) Stress Redistribution Explains Anti-correlated Subglacial Pressure Variations. Front. Earth Sci. 5:110. doi: 10.3389/feart.2017.00110
Received: 27 March 2017; Accepted: 11 December 2017;
Published: 15 January 2018.
Edited by:
Shin Sugiyama, Hokkaido University, JapanReviewed by:
Tyler Jeffrey Fudge, University of Washington, United StatesSamuel Huckerby Doyle, Aberystwyth University, United Kingdom
Copyright © 2018 Lefeuvre, Zwinger, Jackson, Gagliardini, Lappegard and Hagen. This is an open-access article distributed under the terms of the Creative Commons Attribution License (CC BY). The use, distribution or reproduction in other forums is permitted, provided the original author(s) or licensor are credited and that the original publication in this journal is cited, in accordance with accepted academic practice. No use, distribution or reproduction is permitted which does not comply with these terms.
*Correspondence: Pierre-Marie Lefeuvre, p.m.lefeuvre@geo.uio.no