Archeomagnetic Intensity Spikes: Global or Regional Geomagnetic Field Features?
 Monika Korte
 Catherine G. Constable
- 1GFZ German Research Center for Geosciences, Potsdam, Germany
- 2Scripps Institution of Oceanography, University of California, San Diego, San Diego, CA, United States
Variations of the geomagnetic field prior to direct observations are inferred from archeo- and paleomagnetic experiments. Seemingly unusual variations not seen in the present-day and historical field are of particular interest to constrain the full range of core dynamics. Recently, archeomagnetic intensity spikes, characterized by very high field values that appear to be associated with rapid secular variation rates, have been reported from several parts of the world. They were first noted in data from the Levant at around 900 BCE. A recent re-assessment of previous and new Levantine data, involving a rigorous quality assessment, interprets the observations as an extreme local geomagnetic high with at least two intensity spikes between the 11th and 8th centuries BCE. Subsequent reports of similar features from Asia, the Canary Islands and Texas raise the question of whether such features might be common occurrences, or whether they might even be part of a global magnetic field feature. Here we use spherical harmonic modeling to test two hypotheses: firstly, whether the Levantine and other potential spikes might be associated with higher dipole field intensity than shown by existing global field models around 1,000 BCE, and secondly, whether the observations from different parts of the world are compatible with a westward drifting intense flux patch. Our results suggest that the spikes originate from intense flux patches growing and decaying mostly in situ, combined with stronger and more variable dipole moment than shown by previous global field models. Axial dipole variations no more than 60% higher than observed in the present field, probably within the range of normal geodynamo behavior, seem sufficient to explain the observations.
1. Introduction
Variations of the geomagnetic field prior to direct observations can be inferred from archeo- and paleomagnetic experiments. Investigations of past secular variation are relevant to understanding the geodynamo process in Earth's core. Seemingly unusual variations not seen in the present-day and historical field are of particular interest to constrain the full range of core dynamics. These include “geomagnetic intensity spikes,” characterized by very high field intensity values that are associated with rapid secular variation rates. They were first noted in the Levantine area by Ben-Yosef et al. (2009) and Shaar et al. (2011) at around 900 BCE. Subsequent studies from Turkey (Ertepinar et al., 2012) and Georgia (Shaar et al., 2013) confirm high regional intensities. Based on a careful quality assessment of new and previously published Levantine data Shaar et al. (2016) interpret the observations as an extreme regional geomagnetic high with at least two intensity spikes between the 11th and 8th centuries BCE.
Reported high intensity values from other parts of the world at similar times, however, raise the question whether similar features occurred more commonly or if they are even part of a global magnetic field feature. No clear definition of intensity spikes exists. High intensity values potentially related to spikes have recently been reported from the Canary Islands (de Groot et al., 2015; Kissel et al., 2015), Korea (Hong et al., 2013), eastern China (Cai et al., 2016), and Texas, United States of America (Bourne et al., 2016).
Livermore et al. (2014) investigated how core flow models might explain a localized spike and conclude that the reported rates of secular variation from the Levant are not compatible with commonly accepted core-flow dynamics under the assumption of no radial magnetic diffusion. However, the careful re-interpretation of the Levantine results by Shaar et al. (2016) revised the local maximum secular variation rates to slightly lower values as it eliminated some of the highest intensity values reported previously. Davies and Constable (2017) recently tested the hypothesis that the Levantine spike could be caused by a narrow localized intense flux patch at the core-mantle boundary (CMB). They conclude that the spike signature at the surface must span at least 60° in longitude and suggest that the source is a flux patch first growing in place and then migrating north- and westward.
Numerous global spherical harmonic based reconstructions of the geomagnetic field evolution through the past millennia have been developed over the last decade (see Constable and Korte, 2015; Korte et al., 2017, for reviews). None of them shows sharp intensity spikes. This is not surprising as both spatial and temporal resolution of such models are clearly limited compared to what is known from the present-day field, due to heterogeneous, sparse global data distribution and uncertainties in data and dating. Moreover, many of the recently reported high intensity values have not yet been included in global models.
Here we use spherical harmonic modeling to test the hypotheses that the Levantine and other potential spikes might be related to dipole field intensity around 1,000 BCE that is higher and more variable than previously thought, and whether the observations from different parts of the world are compatible with a westward drifting intense flux patch.
In section 2 we first provide an overview of recently published high intensity archeomagnetic data discussed in the context of geomagnetic spikes and other published data used in this study. We compare secular variation and potential westward drift rates around the reported spikes to maximum rates observed in high resolution field models based on recent magnetic observatory and satellite observations in section 3. We then (section 4) derive a suite of new global models to test if what we consider a physically reasonable model can explain the spike observations by invoking a higher dipole moment than seen in previous models and/or westward drift of an intense flux patch around 1,000 BCE, without degrading the fit to the other available archeomagnetic observations. We discuss our findings in section 5 before we briefly summarize our conclusions.
2. Data and Comparison of Reported Geomagnetic Spike Observations
Three compilations of data are considered in this study:
• Recently published data that has in some way or other been discussed in relation to geomagnetic spikes or unusually high field intensity around 1,000 BCE. For ease of terminology we refer to this subset of data as spike data in the following.
• Global archeomagnetic and volcanic data as included in the GEOMAGIA50.v3 (Brown et al., 2015) database by October 1, 2016. This larger subset of data is referred to as other archeomagnetic data in the following.
• A selection of sedimentary paleomagnetic records for comparison and modeling purposes.
The term “geomagnetic intensity spike” was coined by Ben-Yosef et al. (2009), who reported among other data two very high archeointensity results that yield values higher than 200 ZAm2 in terms of virtual axial dipole moment (VADM), and indicating very rapid field changes. Recently, Shaar et al. (2016) re-interpreted all data from the studies by Ben-Yosef et al. (2008a,b, 2009) and Shaar et al. (2011) using an automatic, and hence more objective, interpretation of the experimental results from the PmagPy Thellier GUI software by Shaar and Tauxe (2013) and applying very strict quality control in the acceptance criteria. They also find several high intensity values, but none exceeding 200 ZAm2. We consider only the revised Levantine data set by Shaar et al. (2016) and deleted the values from the Ben-Yosef et al. (2008a,b, 2009) and Shaar et al. (2011) studies from the global data set taken from GEOMAGIA50.v3. More recent work by Ben-Yosef et al. (2017), which had not yet been published when we carried out our study, further corroborates the Levantine data set without exceeding intensity amplitudes found by Shaar et al. (2016).
All recent studies forming our spike data set are listed in Table 1. Except for the work from Ertepinar et al. (2012) these studies had not been included in GEOMAGIA50.v3 in October 2016 and the data have been taken directly from the publications. Most of the data derive from archaeological material, with the exceptions of volcanic rocks in case of the Canary Islands and relative intensity results from cave sediments from Texas.
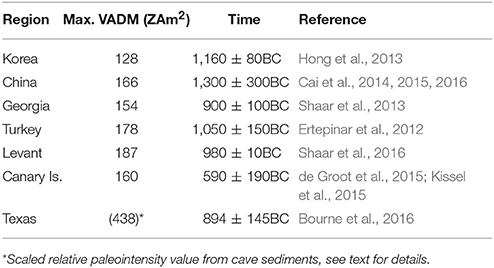
Table 1. Highest intensity values potentially related to geomagnetic spikes, converted to VADM, and their ages from East to West.
A limited number of sediment records have been selected from the compilation by Korte et al. (2011) to improve global data coverage. Selection criteria, in particular in areas with multiple available records, were availability of the full vector information and temporal resolution or sedimentation rate. Relative paleointensity (RPI) records do not always reliably reflect the geomagnetic signal (see e.g., Tauxe and Yamazaki, 2015), so as an additional simple criterion to ensure RPI reliability we only chose records, reflecting the general dipole moment trend with higher values between 1,000 BCE and 1,000 CE than at earlier or later times, which is clearly reflected in intensity variations on multi-millennial periods (see e.g., Figure 20 of Constable and Korte, 2015). These records, listed in Table 2, have been used with the uncertainty estimates provided by Panovska et al. (2015) following the method given by Panovska et al. (2012). A recently published new record from Lake Mavora, New Zealand (Turner et al., 2015) has been added. Uncertainty estimates for both this and the Texan cave sediment record included in our spike data set have also been determined following Panovska et al. (2012). Figure 1 shows the locations of the data from all three sets from the time interval 2,000–0 BCE. All spike data come from a latitudinal band between 28 and 42°N.
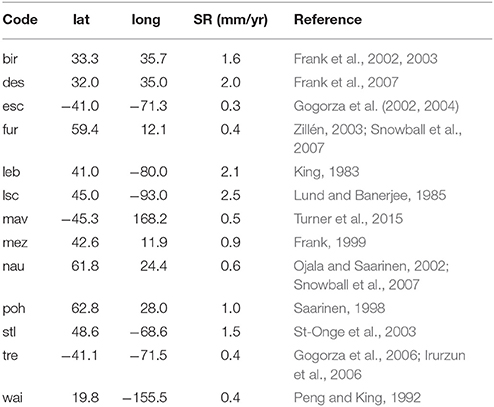
Table 2. Sediment records used in this study with their average sedimentation rate (SR).
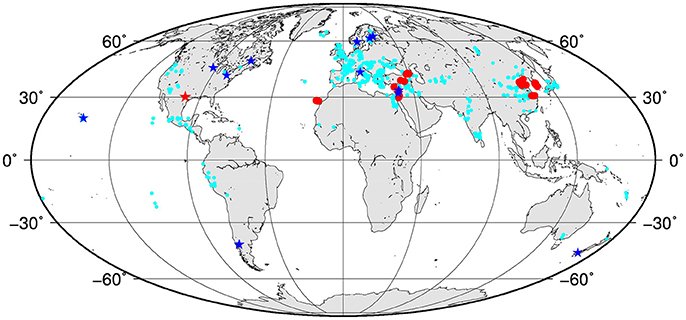
Figure 1. Locations of data used in this study from time interval 2,000-0 BCE: Recently published spike data (red dots and red star), other archeomagnetic and volcanic data (cyan dots) and selected Holocene high resolution sediment records (blue stars). See text for details of the three data sets.
To obtain an overview of potential spikes observed in the different regions we compare the recently published spike data among the different regions and to the other archeomagnetic data from nearby (Figure 2). The other data come from approximately 1,500 km radii around the spike data. The best documented spikes at present clearly are the two Levantine spikes at about 980 and 740 BCE. The Chinese spike appears considerably older, but its age uncertainties are significant and partly overlap with the 980 BCE Levantine spike data. Similarly, the Canary Island spike appears clearly younger, but age uncertainties extend to the times of the 800 BCE Levantine spike.
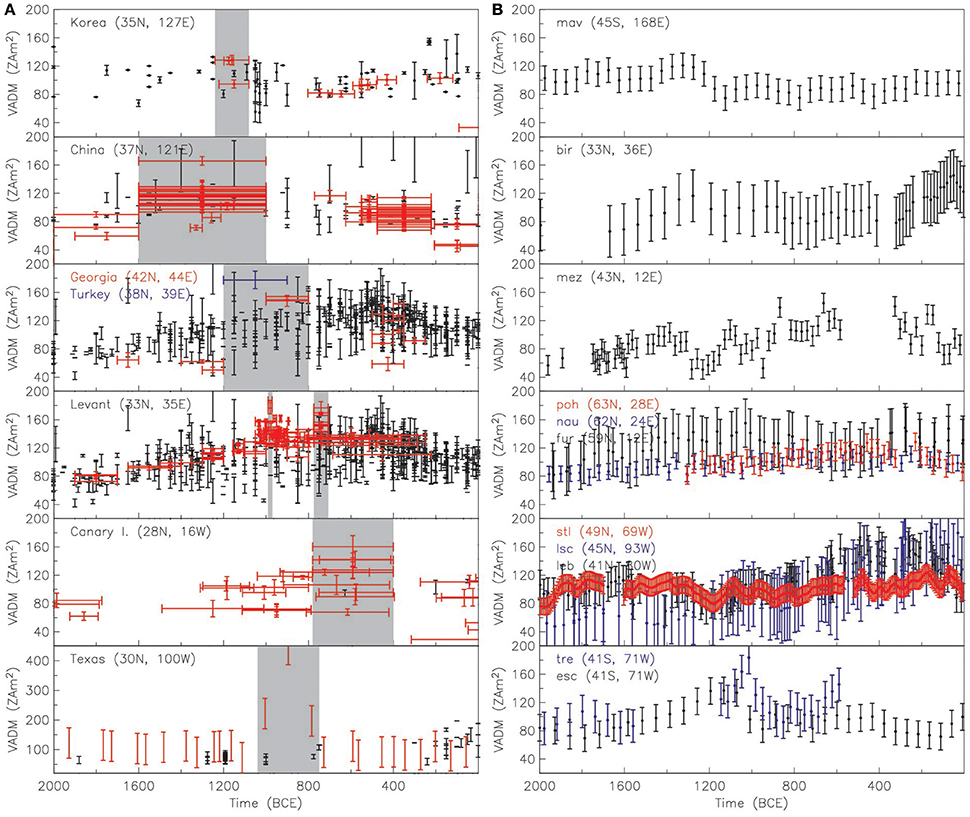
Figure 2. VADMs for the time interval 2,000 to 0 BCE (A) of spike data set (colored dots) from the regions listed in Table 1 with other archeomagnetic and volcanic data (black) from within 1,500 km radii around, and (B) of the sediment records used in this study. All data are ordered from east to west (top to bottom panels), sediment records within regional proximity are plotted in one panel. The approximate geographic coordinates for each region or record are given in the panels. Error bars indicate one standard error in magnetic data and age uncertainties as provided in the studies. Age errors of sediments and other archeomagnetic/volcanic data have been omitted for clarity of figures. All sediment data were calibrated by the ARCH10k.1 global model (see text). The gray intervals in (A) mark the approximate times of the discussed spikes by highest intensity values and their age uncertainties. Note the different ordinate scale in the bottom left panel.
The Chinese and Canary Island data sets most clearly show how age uncertainties hamper the detailed investigation of high intensity spikes: Several data are only known to lie within the same age range and are assigned the same central age. Small data uncertainties may suggest that the data come from different ages within the age interval, but any time series or spatial interpolation will tend to consider them at the same time and average the values, not even trying to fit the maximum values closely.
The few new Korean data around 1,200 BCE are high, but do not clearly characterize a spike. The Texan cave sediments, on the other hand, give an exceptionally high value at about 890 BCE, which exceeds 400 ZAm2 when the whole RPI time series is scaled by a global model. The feature shows more than double the intensity seen elsewhere, yet is supported by only three data points so far. It should be regarded with caution until confirmed by future data. Previous absolute intensity data from the region are sparse.
The relatively abundant other data around the Levant, Turkey and Georgia indicate another factor complicating the derivation of a clear spatio-temporal picture of the spike: the scatter in regional data is rather large (the occasionally also large age uncertainties are not even shown in Figure 2) with uncertainties not always overlapping, at least at one sigma level. Older studies did not consider tests and quality criteria developed only recently, yet rejecting all data without this information depletes the available information unreasonably. Most previous data are below the spike maxima, but a few individual very high intensity data are noted at different times, in the examples shown here in particular in previously published data from China. As shown in the work by Shaar et al. (2016) such values might not survive critical re-evaluation, but it also clearly seems unwarranted to discard them without examination. Unfortunately the raw data required for a re-assessment as performed by Shaar et al. (2016) is hardly ever available for older data. For this study we take all published data at face value and do not attempt to judge their quality in any way.
Concerning regional spike observations we also note that high intensity values reaching up to 200 ZAm2 and thus reminiscent of the presently discussed spikes have been found at 890 BC in Hawaiian lavas by Pressling et al. (2006, 2007).
Calibrated relative paleointensities from the sediment records considered in this study are included in Figure 2. Interestingly, both South American records (esc, tre) show a signature reminiscent of reported intensity spikes around 1,050 BCE, i.e., between the Asian and Levantine highs, and the Italian Lago di Mezzano (mez) record seems to reflect the two Levantine spikes.
The spatial distribution of all new spike reports permit different interpretations. Firstly, considering the age uncertainties there might have been only two spikes of large spatial extent between about 1,000 and 750 BCE. Secondly, there might have been at least four regionally confined spikes between about 1,400 and 500 BCE. Thirdly, considering that high intensities are observed earlier in Korea and China than in the Levant and later on the Canary Islands, all at similar mid-latitudes, westward drift of magnetic flux structure might be involved. Table 3 shows simple estimates of the order of core flow velocities required under the frozen flux assumption for this interpretation. The estimates were obtained by considering large-circle distances between the approximate centers of the regions, time differences between the highest intensity values as given in Table 1 and considering that with westward drift the spike should have occurred earlier in Korea than China (well possible within the Chinese age uncertainties), and 3481 km as radius of the outer core to obtain velocities at the CMB. The reported Canary island spike is younger than the Texas one, so they are incompatible with a westward drift explanation of a single flux patch causing one of the Levantine spikes. With 0.35 and 0.11°/year or 21 and 7 km/year at the CMB, for a feature drifting from Asia to the Levant and from there to the Canary Islands, respectively, these rates are well within core flow velocities deduced from the present-day field (e.g., Hulot et al., 2002; Livermore et al., 2014) which can reach values in the order of 0.9°/year or 55 km/yr. Typical present-day values for the large-scale flow are lower, in the order of 15 to 20 km/year (e.g., Holme, 2015), but the high-latitude circumpolar jet deduced by Livermore et al. (2017) to explain the accelerating westward drift of intense flux lobes over Canada and Siberia observed from satellite data reaches maximum speeds of 40 km/year. Based on simple considerations of paired records only the Levantine and Texan spike observations seem incompatible with a westward drifting flux patch, and even that would only require core flow velocities 33% higher than inferred from high resolution present-day field models.
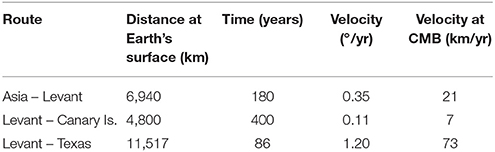
Table 3. Required core flow velocities if spike observations were related to westward drifting features.
3. Insights from Global Geomagnetic Field Models
In order to see how unusual the spikes appear in the context of known secular variation we perform some comparisons with global archeomagnetic and high resolution present-day field models. Shaar et al. (2016) pointed out that present-day regional deviations from the axial dipole moment range from 50 to 150%, while the Levantine spike exceeded the axial dipole moment at that time by a factor of two. This is reflected by global minimum and maximum VADM values tabulated for the International Geomagnetic Reference Field (IGRF Thébault et al., 2015) for 2015 in Table 4. The standard deviation obtained from a global grid of VADM values is 15 ZAm2, but note that they are not normally distributed. Despite the fact that the lowest values are <50% and the highest ones do not reach 150% the globally averaged VADM is slightly higher than the (tilted) dipole moment (DM). We do not know the actual DM strength at the times of the archeomagnetic spikes. Despite displaying the same general trends global archeo- and paleomagnetic models show differences in more detailed structures, and recovering the absolute DM strength is surprisingly challenging as it critically depends on the, globally seen, rather sparse absolute intensity information (Panovska et al., 2015). At times of their highest DM, within two centuries from the reported spikes, the three Holocene models ARCH10k.1, CALS10k.2, and HFM.OL1.A1 (Constable et al., 2016) reach maximum local VADM values of up to 143 ZAm2. These models include some of Levantine spike data, but all of them clearly underestimate the associated high intensity values. The lower VADM standard deviation and closer similarity of globally averaged VADM and DM compared to IGRF 2015 are indicative of the lower spatial resolution of these models. Considering all available data VADMs for a 300 year interval around the spikes yields maximum values higher than the revised Levantine results (Table 4) (which come from Hawaii in 890 BCE; Pressling et al., 2006, 2007) and an average value clearly higher than the maximum model global averages. The averaged data VADM is closer to the archeomagnetic model average if the recently published spike data are not included. All this might suggest that the actual DM was higher during the occurrence time(s) of the spikes, which might make the magnitude, although not necessarily the rates of change, reconcilable with present-day VADM deviation from (axial) DM.
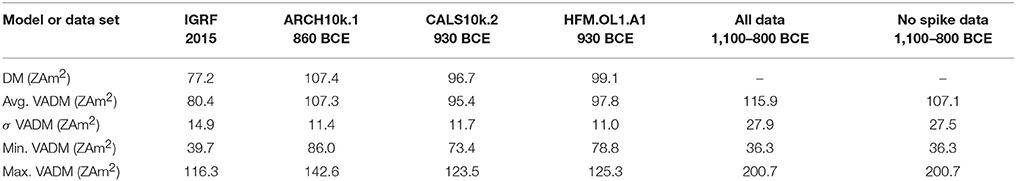
Table 4. Global VADM statistics from models and data compilations.
Not considering the Texas cave sediment data, the fastest rates of intensity changes related to archeomagnetic spikes seem to come from the Levant and China. In the former region, the fastest change seems related to the spike around 740 BCE, with age uncertainty interval 800–732 BCE. Assuming that the data all are correct within their data and age uncertainties, these values suggest a minimum rate of intensity or VADM change of 31 μT/century or 61 ZAm2/century, respectively. This is clearly lower than the rates estimated by Livermore et al. (2014) based on the originally published Levantine data. The Chinese values around 1,300 BCE have a rather large age uncertainty of ±300 years, giving an interval of 1,600 to 1,000 BCE. However, assuming that a low value dated at 1,328 ± 28 BC is correct and the highest values occurred at 1,000 BC the minimum required rate of change, again also considering data uncertainties, amounts to 15 μT/century in intensity or 30 ZAm2/century. These rates are tabulated in Table 5 together with several estimates based on models of the present and historical field, with gufm spanning the interval 1,590–1,990 based on historical and observatory geomagnetic data (Jackson et al., 2000). All values are given as change per century, but note that they have been calculated as first differences over the given time intervals, i.e., representing average changes over 5–400 years intervals. DM and axial dipole coefficient changes are not given for 400 years, because the axial dipole coefficient in gufm has been extrapolated back between 1,840 and 1,590 due to the lack of historical absolute intensity information. Nearly instantaneous and average changes are remarkably similar over the past ca. 200 years for field intensity and DM including similar rates of axial dipole change. Larger differences in VADM than F result from the latitude dependence in the conversion. The lower values of dF/dt over 400 years might indicate that steady monotonic rates of change did not persist over this time scale at any location on Earth. The Chinese field change is only slightly higher than and thus appears compatible with recent variation rates, but the Levantine field change indeed appears more than twice as fast.
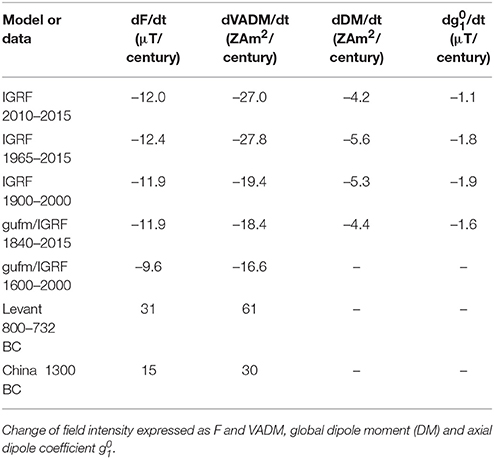
Table 5. Maximum rates of geomagnetic field intensity change in models compared to minimum estimates required to explain the observed spikes in China and the Levant.
4. Can Global Field Models Reproduce Rapid Spikes?
Presently available global geomagnetic field models do not reproduce rapid intensity variations, at least partly because they are strongly smoothed in space and time as a consequence of limited data coverage and, compared to present day observations, large data and dating uncertainties. In order to test how closely the spike data can be explained by physically reasonable models we derived a large number of test models. The modifications among these models mainly include, individually or in combination, variations of the data basis and weighting of sub-sets of data to enforce a closer fit to the spikes, and background models favoring westward drift over growth and decay of flux concentrations. Note that all these models clearly are not considered to be the best representations of the global field, but are designed to test two hypotheses: firstly, might the spikes be related to higher and more variable axial dipole contributions than shown in paleomagnetic models so far, and secondly, might the global distribution of the recently reported spikes be due to a westward drifting strong flux patch?
All our spherical harmonic models with time-dependent coefficients based on cubic B-splines follow the modeling strategy of the CALSxk and ARCHxk models (for details see, e.g., Korte et al., 2009; Panovska et al., 2015). They span the interval 4,000 BCE to 1,990 CE, but here we limit the analysis to 2,000–0 BCE. Linearisation was done by 15 iterations without outlier rejection. Space and time regularizations minimizing Ohmic dissipation (Gubbins, 1975) and the second derivative of the radial field were applied (see e.g., Jackson et al., 2000; Korte et al., 2009). The strength of regularizations was chosen by comparison to present-day geomagnetic power spectra of main field and secular variation. The influence of this regularization is discussed in more detail in section 5. We present our findings based on seven representative cases out of a larger range of test models studied. Their different characteristics are summarized in Table 6.
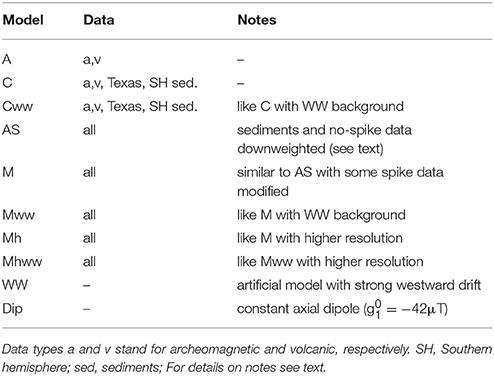
Table 6. Characteristics of test models.
Model A is a rather standard model based on archeomagnetic and volcanic data only, similar to e.g., SHA.DIF.14k (Pavón-Carrasco et al., 2014) or A_FM (Licht et al., 2013) and in particular differing from ARCH10k.1 (Constable et al., 2016) only in the addition of the spike data, weighting of data (see below) and resolution.
Model C additionally includes the Hall's cave (Texas) record and, in order to improve the global data coverage, the southern hemisphere sediment records.
Model AS includes all data, but all sediment and other archeomagnetic and volcanic data are downweighted compared to the spike data, in this case to 0.67 for directions and only 0.27 for all intensities. The weighting scheme used here is one example from a number of different schemes that we tried of giving more weight to the spike data in order to push the model to primarily fit these data.
For model M all data used were weighted similarly to model AS, but the main spikes' data (Levant, China, Canary Islands) were modified within their age uncertainties to avoid the contemporaneity of high and low values and represent a possible temporal field evolution within the age error interval and in relation to temporally adjacent values. In detail, these changes, depicted in Figure 3, aimed for least rapid variations and comprise the following: (i) The 980 BCE Levantine spike was broadened as far as possible by shifting the 977 and 974 BCE values to their youngest and the lower values at 985 BCE to their oldest possible age within the given age uncertainties. All values from the second spike given as 740 BCE were ordered by intensity and distributed to form a uniform slope toward the lower boundary of the highest values within their age uncertainty interval, with lowest values at 800 and highest at 732 BCE. There is a data gap between 732 and 621 BCE, allowing for a similar or less steep slope of this spike on its younger side. (ii) For China, motivated by two low VADM values with small uncertainties at 1328 and 1,256 BCE and models like AS that suggest an intensity maximum closer to 1,000 than 1,300 BCE we shifted all the 1,300 BC values to form a uniform slope toward the highest value at 1,000 BCE, the youngest end of the given age uncertainty interval. Again, a data gap between that time and 697 BCE allows for a similarly gentle slope of the spike toward the younger side. (iii) Five values were shifted within their age uncertainties in the Canary Island data set, namely from 667 to 867 BCE, from 575 to 450 BCE, from 579 to 440 BCE, from 615 to 420 BCE and from 590 BCE to 730 (see Figure 3).
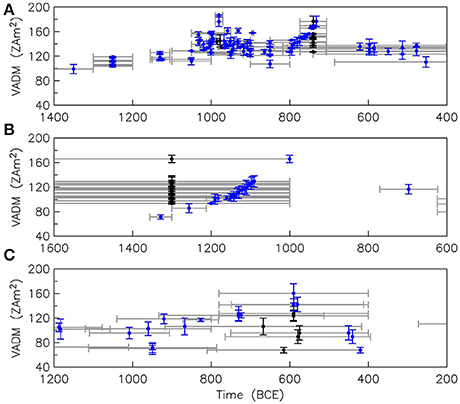
Figure 3. Spike data from the Levant (A), China (B), and the Canary Islands (C) with modified ages (blue) to represent approximately least rapid variations conceivable within the uncertainty limits, compared to the original data (black) with data and original age (gray) uncertainties. Age uncertainties of modified data are not shown.
Model WW is used as a background model to test if the data are compatible with westward drifting flux features. It was designed using SH degrees and orders 1–4 from ARCH10k.1 at 980 BCE together with degrees and orders 5 to 10 from gufm at an arbitrary time (here 1,810 CE) for higher spatial resolution. This time-slice, showing a strong normal flux patch under the Levant area, was then rotated to give a westward drift of 0.32°/year over the whole model time, resulting in a full rotation of the flux pattern around the Earth in 1.125 kyr.
Models Cww and Mww use the same data and weighting as C and M, respectively, but the regularization is applied around background model WW. The regularization in these cases trades off between fit to the data and the westward drifting features shown by the WW model, i.e., if the westward drift is not preserved in the resulting model it is not compatible with (parts of) the data.
Models Mh and Mhww are higher resolution versions of models M and Mww. The only differences are relaxed regularization constraints, i.e., weaker regularization factors somewhat subjectively chosen to better fit the data, in particular the spike signatures, at the cost of containing more (secular variation) spectral power compared to the present-day field than the other models. In the case of Mhww this means that the imposed drift is stronger than in Mww.
Model Dip is a pure, constant axial dipole included here for comparison of deviation of the data from any of the models. Its strength of −42 μT was chosen empirically as giving the smallest root mean square (RMS) misfit for the archeomagnetic and volcanic data in the time interval 2,000–0 BCE.
Table 7 lists the root mean square misfit of the models to the original data set, weighted by the data uncertainties. Note that here we take a different approach for weighting from previous models which were aimed at best reflecting the geomagnetic field evolution all over the globe. Instead of setting relatively large but in our opinion more realistic minimum data uncertainties, we here only consider uncertainties smaller than α95 = 1.7° (equal to 1° in inclination) and 1 μT as unrealistically small and use these values as minimum uncertainties. Missing uncertainty estimates were set to α95 = 3.4° and 5μT, values that commonly were used as minimum uncertainty estimates in previous models. For sediments we kept previous minimum and missing uncertainty assignments of α95 = 6° and 5μT.
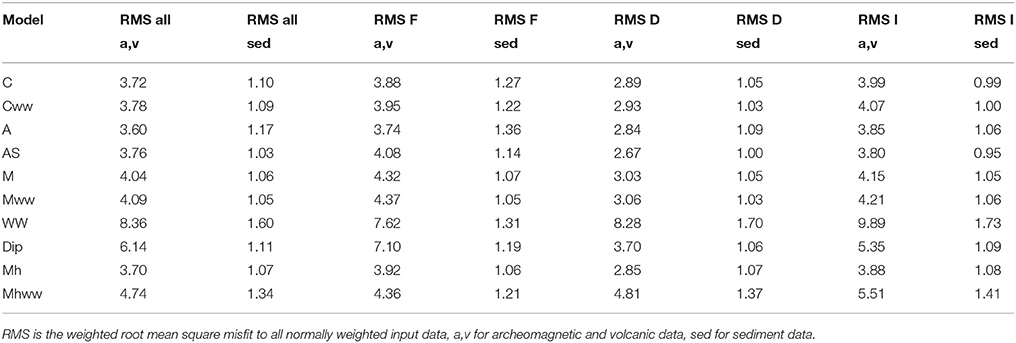
Table 7. Root mean square normalized misfit for time interval 2000–0 BCE.
The choice of sediment records and in particular the size of their estimated uncertainties leads to this data type being fit nearly within their uncertainties in all components, while archeomagnetic and volcanic data show much larger normalized misfits. This does not mean that individual features of sediment records are fit particularly well, as can be seen in the two southern hemisphere records included in Figure 4. In particular intensity maxima around 1,200 BCE in South America (record esc) and slighly earlier in New Zealand (record mav), which might have supported a global source of the Asian spike, are not represented by the models. However, the sediment uncertainties in fact are such that these data also are nearly fit to a weighted rms of 1 by a constant axial dipole (Table 7). For archeomagnetic and volcanic data all models, except the ones with strong enforced westward drift (WW, Mhww), show smaller misfits than a constant dipole e.g., ranging from 3.60 to 4.74 compared to 6.14 for all components, or 3.74 to 4.37 compared to 7.10 for intensity. The westward drifting background model WW is less compatible with all data than a constant axial dipole. If we allow more spatial complexity and in particular temporal variation we can find models (Mh, Mhww) that fit the Levantine intensity data more closely (Table 8), in particular visually appearing to describe the perceived spikes better in intensity (Figure 4). However, in the case of enforced westward drift (model Mhww compared to Mww) this comes at the expense of higher rms misfit to data from, on average, all other regions, in particular including all the rest of the world (Tables 7, 8). In the unconstrained case (model Mh compared to M) the average misfit to the archeomagnetic and volcanic data is smaller, but the opposite is true for the sediments. These findings do not change notably if we consider both data and age uncertainties when evaluating the misfit.
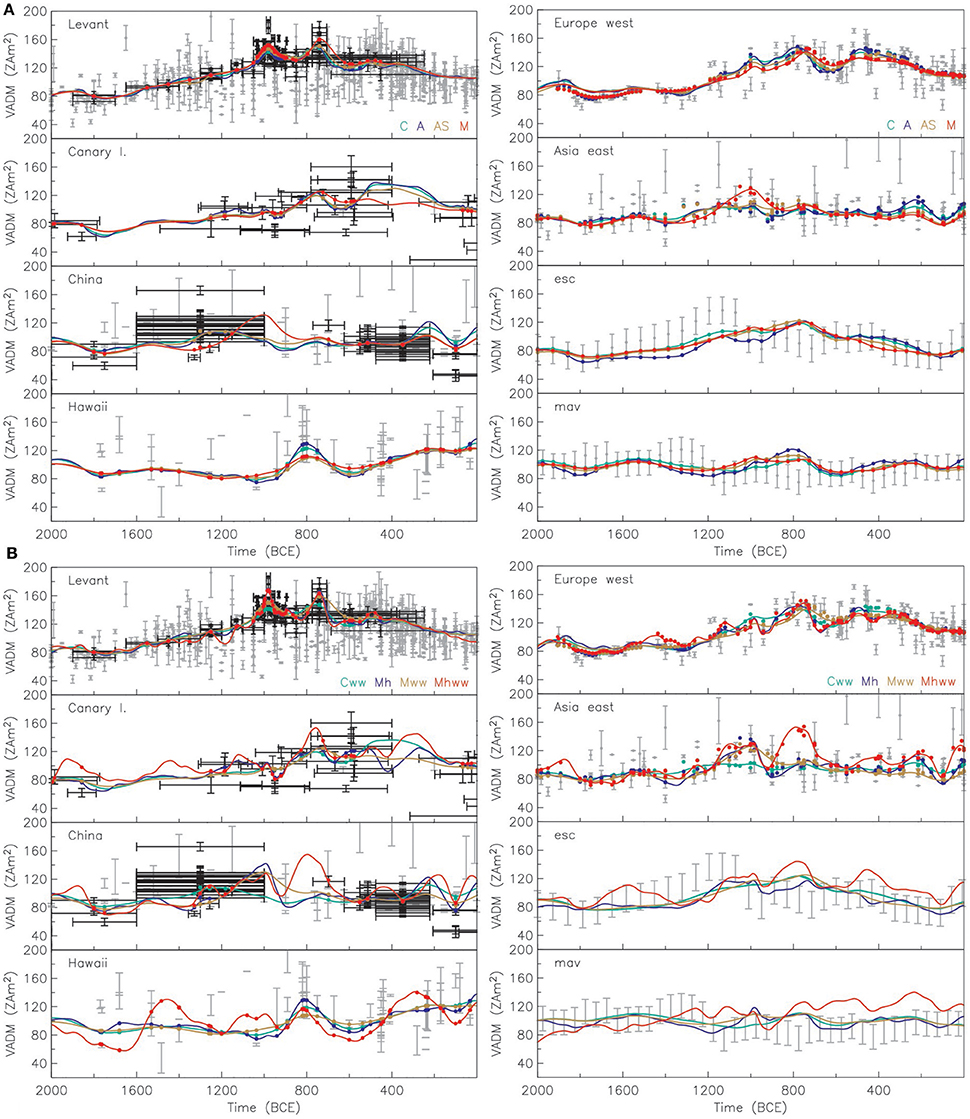
Figure 4. Comparison of VADM from several models to regional data. The solid lines show predictions from models (A) C, green; A, blue; AS, brown; M, red; and (B) Cww, green; Mh, blue, Mww, brown; Mhww, red; see Table 6. Black dots with data and age error bars are recently published spike data sets, gray dots with data error bars only are from six regions with ~1,500 km radius and lakes Escondido (Argentina, esc) and Mavora (New Zealand, mav). Colored dots mark model predictions for the actual data locations, while the solid line is the continuous prediction for the center of a region.
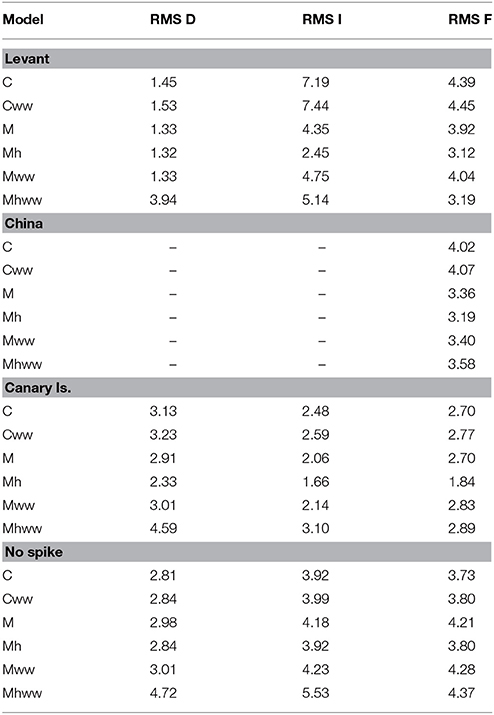
Table 8. Weighted root mean square (rms) misfit of the global models to the three modified regional archeomagnetic and volcanic data sets and to the rest of these data types.
Additionally, three ensembles of 9,000 bootstrap models were created based on the data underlying model C by varying the archeomagnetic and volcanic data by data and age uncertainties. Two of the ensembles use a westward drifting background model, with weaker and stronger regularization, respectively. The three ensembles thus have been labeled “no ww,” “ww,” and “ww2” for no, weakly and strongly enforced westward drift, respectively. More details about these models are given in the Supplemental Material.
Within the bootstrap ensemble models we find realizations of the data that can be fit closer by models with similar spatial and temporal complexity to the original data set (Table 8 and Table S1, model C compared to no ww models and model Cww compared to ww models). Only in the case of more strongly enforced westward drift does model Mhww show a closer fit to the original Levantine data than found in the ensemble for the same region (model Mhww, Table 8 compared to models ww2 in Table S1). Although our ensembles might be too small to cover the absolute best fit cases, this rather seems to be a consequence of lower temporal resolution in the ensemble models than model Mhww (see secular variation spectra in Figure 6 compared to Figure S3). Our ensembles do not include any models that give close to minimum misfit for all three spike regions in the same realization (Figure S1). Again this does not necessarily reflect too small ensemble sizes, but might also be an indication that incompatible data exist in the data set even when data and age uncertainties are considered.
Models from the ensemble representing the best compromise fit to the spike data from the Levant, China and the Canary Islands were chosen as realizations with smallest misfit to both the Chinese and Canary Island data from the 50 models with minimum misfit to the Levantine data (Figure S1). These provide better fits to the Levantine and Chinese data than the comparable original models, except for the ww2 version (Table 8 and model versions 4 in Table S2).
Considering the spectral power distribution the standard models show a lack of main field resolution starting from SH degree 6 (Figures 6A,C). Models built on westward drifting background models show similar spatial complexity to present-day models. All models indicate that the dipole moment was clearly higher than over the past 115 years, and probably played a role for the observed features by varying more strongly than at present (Figures 6B,D). Interestingly, this applies more to the younger of the two Levantine spikes in several of the models (Figure 5A). The two higher resolution models display a much stronger secular variation in large scales than all other models (Figure 6D). Models with double the rate of axial dipole change observed since 1,840 show indications of the Levantine spikes (Figure 5A) without fitting the maximum values. This can be achieved with comparable axial dipole acceleration as seen in the historical field (see gufm variability in the Figure 5), although large values would have to persist on somewhat longer time-scales. The minimum misfit bootstrap ensemble models give similar results (Figure S3). A very close (visual) fit of the Levantine spikes is only obtained with higher temporal resolution models, which display more than five times larger rates of axial dipole change and require nearly three times higher acceleration of the axial dipole than the maximum found in the historical field.
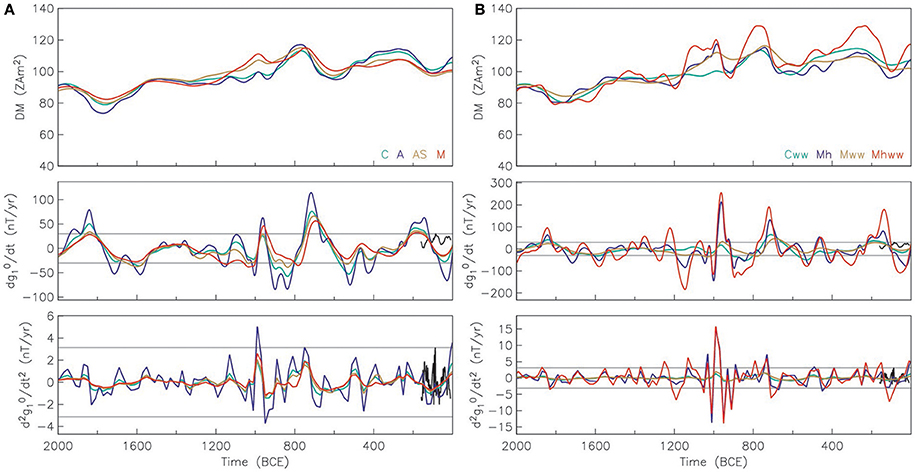
Figure 5. Dipole moment (top), secular variation (middle), and acceleration (bottom) of the axial dipole coefficient of several models, (A) C, green; A, blue; AS, brown; M, red; (B) Cww, green; Mh, blue, Mww, brown; Mhww, red; see Table 6. Gray lines indicate maximum absolute value found in the 400 year gufm model, shown with positive and negative sign. Black line shows gufm variability for 1840 to 1990 AD plotted in time interval 160–10 BCE for comparison.
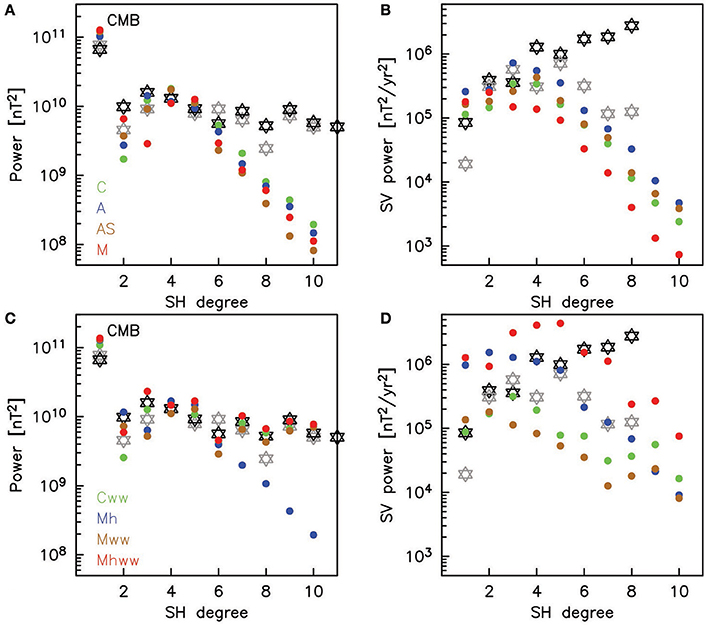
Figure 6. Geomagnetic power (A,C) and secular variation (B,D) spectra at the core-mantle boundary (CMB) averaged from 1,100 to 900 BCE, for models (A,B) C, green; A, blue; AS, brown; M, red; (B,D) Cww, green; Mh, blue, Mww, brown; Mhww, red. Gray stars are the spectra from IGRF 1900, black from IGRF 2015.
Time-longitude plots of the radial field component at the CMB for 32°N are shown in Figure 7. None of the models suggests that westward drift of a strong flux patch connects the spike observations from Asia and the Levant. Only when fit to the global data is compromised for a closer agreement with the westward drifting background model (model Mhww) is this movement largely preserved. All other models suggest that a strong flux patch related to the Levantine spikes grows and weakens mostly in place, perhaps moving slightly west during a weakening phase around 600 BCE. Similarly, time-latitude plots for the Levant area (35°E) do not indicate any clear latitudinal drifts of flux patches (Figure 8). Some of the models (C,A,AS,Cww) suggest that some slight northward drift and extension of the patch might have occurred. Again the best fit bootstrap ensemble models show similar results (Figures S4, S5).
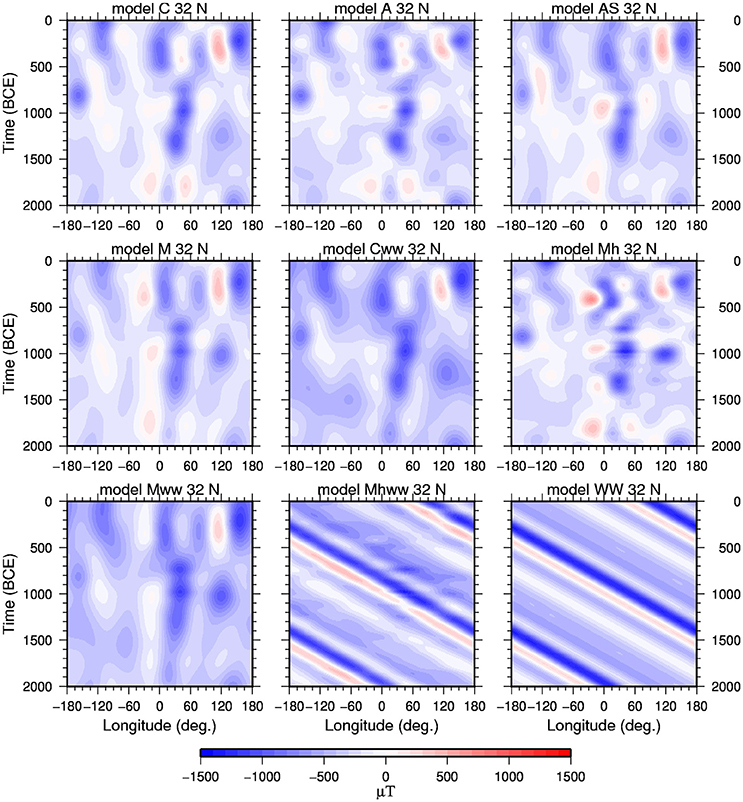
Figure 7. Time-longitude plots of the radial field component Br at the CMB for the discussed models at 32N. Sloping stripes indicate westward drift.
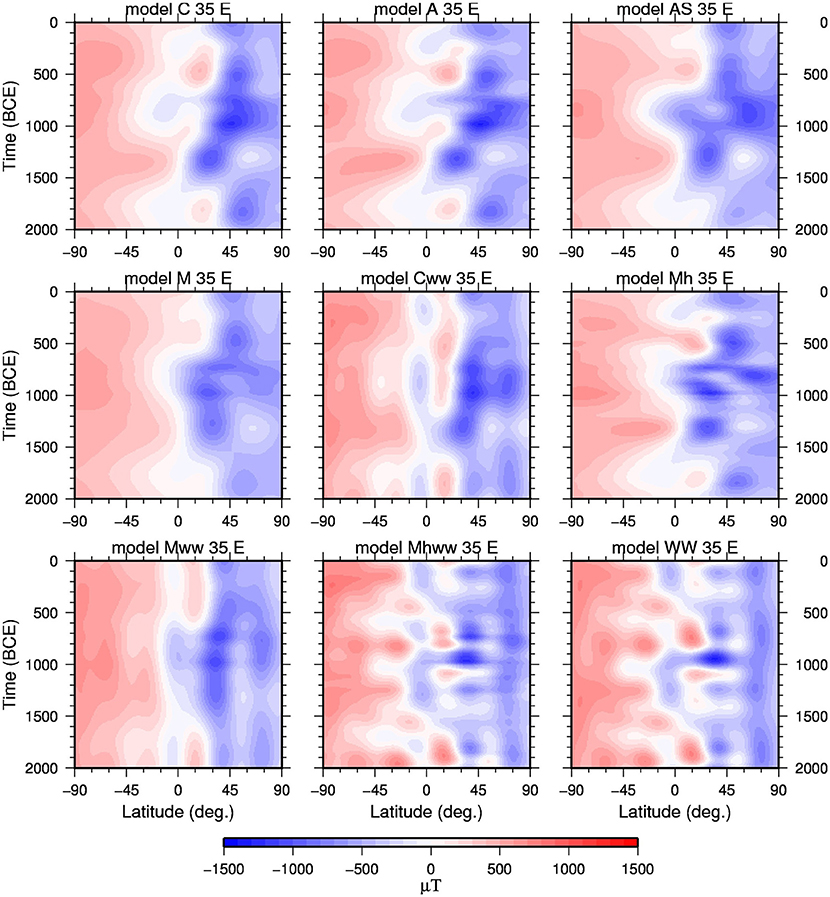
Figure 8. Time-latitude plots of the radial field component Br at the CMB for the models discussed in the main text at 35E.
5. Discussion
Our modeling results indicate that the dipole moment, particularly the axial dipole strength is more closely correlated with spike features than previously thought, by being both higher and more variable than predicted by previous models. Geomagnetic field models gufm (Jackson et al., 2000) and the International Geomagnetic Reference Field IGRF (Thébault et al., 2015) indicate that the power in dipole variation has changed notably over the past 115 years and was lower by about 75% in 1900 than 2015 (Figure 6). Having no good reason to believe that maximum possible field variation occurs today it seems quite conceivable that the dipole variability was higher by 53% at times in the past, which is enough to find global field models that account for more than 80% of the observed overall spike intensity (model M in Figures 4, 5).
Note that the models and in particular their power spectra depend strongly on the applied regularizations in space and time, which were chosen such that main field power of degrees two and higher appears close to a white spectrum dropping off for higher degrees at the CMB and that low secular variation degrees (high degrees for the two higher resolution models) are of similar magnitude to the present-day field. We considered these assumptions reasonable to obtain physically realistic fields. Our models do not include the option that the geodynamo process was drastically different from what it is today. The shape of the secular variation spectrum is strongly determined by the regularization norm, which essentially damps short-term variations more strongly than longer term variations by some function of spherical harmonic degree. We used the Ohmic heating norm in space and second derivative of the radial field in time, and did not find any norm that provided a closer resemblance of the spectral shape to the present-day field among a range from simple power laws to other field quantities like horizontal gradients. Using global basis functions and a global regularization it is not possible to obtain arbitrarily detailed structure in certain regions that are much better constrained by dense data with low uncertainties than others. The main field and secular variation spectra (Figure 6) show that all models that are not artificially constrained by westward drift lack small scale (~SH degree 5 and higher) spatial and temporal resolution. Considering that in the present-day field SH degrees of 5 and higher contribute to the field intensity at the Earth's surface by up to 3.7 μT regionally this can explain part of the missing amplitude fit to the spikes without having to invoke drastic differences in geodynamo processes.
This conclusion is supported by the fact that models with strongly westward drifting patches do nearly fit the amplitudes and rates of change of the spikes. The spatially and temporally localized small-scale structure of these models might represent the field morphology producing the spikes. The fact that these models show much higher secular variation power combined with worse fit to other globally distributed data might again be a consequence of the global nature of basis functions and regularization. Nevertheless, the fact that a full westward drift of a strong flux patch from China all the way to the Levant is not preserved in a model with comparatively weak regularization toward a westward drifting background suggests that this field behavior is not compatible with some other data.
Results from an ensemble of 9,000 models with underlying data varied within their magnetic and age uncertainties mainly confirm these findings. The highest intensity values and perceived rapid changes are fit less well by the minimum misfit models out of the ensemble than by some individual realizations (Figure S6 and Figure 4). Interestingly, the minimum misfit ensemble models suggest a slightly different interpretation of the Chinese high intensity data around 1,200 BCE. In contrast to the individual models that in general show one maximum around that time most of the ensemble realizations displayed in Figure S6 show two maxima between 1,600 and 1,000 BCE. Nine thousand realizations do not sample every possible combination of data points and the coeval data will tend to be distributed to both sides within the large age uncertainties (Figure S7), so this result should be considered with caution. For other regions the individual and ensemble models shown give broadly similar predictions (Figure S5 and Figure 4). The maximum in the south American data of the same age as the Chinese high intensity values is not reflected by any of the models. An inspection of how the data underlying the minimum misfit ensemble models were shifted (Figure S7) does not reveal any clear patterns, except that the best fit to the Chinese data is obtained when the highest intensity occurred at the somewhat younger age of about 1,100 BCE instead of 1,300 BCE.
6. Conclusions
We have compared observations of so-called archeomagnetic intensity spikes reported from several regions around the world and investigated potential causes. Age differences between spike observations in Asia, the Canary Islands and the Levant are compatible with a westward drifting intense flux patch as a common cause, but global field models constrained specifically to test this hypothesis indicate that this explanation is not compatible with other field observations. On the contrary, these and additional test models suggest that the observed spikes are linked to individual flux patches, more or less growing and decaying in situ with only slight westward drift.
The spikes are clearly not global phenomena, but higher dipole moment than shown by previous models in particular around the times of the two Levantine spikes (980 and 740 BCE) facilitates explaining the spikes as normal non-dipole, regional intensity variation on top of a higher background field. Our test models suggest that this can be reconciled with other available data. However, this would require rather high dipole variability, with rates of change greater by more than 50% than directly observed in the last 180 years. This might still be within the normal range of geodynamo processes.
The recently published archeomagnetic and volcanic data reporting on spikes have been obtained following extremely strict quality criteria and, in particular in the case of the Levantine data could be confined to very low uncertainties in both data and age. The full available global data compilation contains other high intensity values at different ages and locations that might reflect similar geomagnetic field features, which are not as well constrained. Future re-assessments of previously published data in combination with new high quality data will indicate how rare or common archeointensity spike occurrences were in the past. It will then be interesting to test whether high dipole strength and variability are as relevant in other cases as they seem to be for the Levantine spikes. However, as long as the worldwide data distribution remains strongly inhomogeneous a clear description of such features in geomagnetic field models can only be obtained by models that do not rely on global basis functions in the way available spherical harmonic models do.
Author Contributions
MK intially designed the study and carried out the analyses, adapting it iteratively following discussions of obtained preliminary results with CC. MK drafted the first version of the manuscript which was subsequently improved and agreed upon by contributions from both authors.
Funding
The collaboration was greatly facilitated by an extended research visit of MK to UCSD funded by the Alexander von Humboldt-Foundation. CC acknowledges NSF funding under grant number EAR 1623786.
Conflict of Interest Statement
The authors declare that the research was conducted in the absence of any commercial or financial relationships that could be construed as a potential conflict of interest.
Supplementary Material
The Supplementary Material for this article can be found online at: https://www.frontiersin.org/articles/10.3389/feart.2018.00017/full#supplementary-material
References
Ben-Yosef, E., Millman, M., Shaar, R., Tauxe, L., and Lipschits, O. (2017). Six centuries of geomagnetic intensity variations recorded by royal Judean stamped jar handles. Proc. Nat. Acad. Sci. U.S.A. 114, 2160–2165. doi: 10.1073/pnas.1615797114
Ben-Yosef, E., Ron, H., Tauxe, L., Agnon, A., Genevey, A., Levy, T. E., et al. (2008b). Application of copper slag in geomagnetic archaeointensity research. J. Geophys. Res. Solid Earth 113, B08101. doi: 10.1029/2007JB005235
Ben-Yosef, E., Tauxe, L., Levy, T. E., Shaar, R., Ron, H., and Najjar, M. (2009). Geomagnetic intensity spike recorded in high resolution slag deposit in Southern Jordan. Earth Planet. Sci. Lett. 287, 529–539. doi: 10.1016/j.epsl.2009.09.001
Ben-Yosef, E., Tauxe, L., Ron, H., Agnon, A., Avner, U., Najjar, M., et al. (2008a). A new approach for geomagnetic archaeointensity research: insights on ancient metallurgy in the Southern Levant. J. Archaeol. Sci. 35, 2863–2879. doi: 10.1016/j.jas.2008.05.016
Bourne, M. D., Feinberg, J. M., Stafford, T. W., Waters, M. R., Lundelius, E., and Forman, S. L. (2016). High-intensity geomagnetic field ‘spike’ observed at ca. 3000 cal BP in Texas, USA. Earth Planet. Sci. Lett. 442, 80–92. doi: 10.1016/j.epsl.2016.02.051
Brown, M. C., Donadini, F., Korte, M., Nilsson, A., Korhonen, K., Lodge, A., et al. (2015). Geomagia.v3: 1. general structure and modifications to the archeological and volcanic database. Earth Planet Space 67:83. doi: 10.1186/s40623-015-0232-0
Cai, S., Chen, W., Tauxe, L., Deng, C., Qin, H., Pan, Y., et al. (2015). New constraints on the variation of the geomagnetic field during the late Neolithic period: archaeointensity results from Sichuan, southwestern China. J. Geophys. Res. Solid Earth 120, 2056–2069. doi: 10.1002/2014JB011618
Cai, S., Jin, G., Tauxe, L., Deng, C., Qin, H., Pan, Y., et al. (2016). Archaeointensity results spanning the past 6 kiloyears from eastern China and implications for extreme behaviors of the geomagnetic field. Proc. Nat. Acad. Sci. U.S.A. 114, 39–44. doi: 10.1073/pnas.1616976114
Cai, S., Tauxe, L., Deng, C., Pan, Y., Jin, G., Zheng, J., et al. (2014). Geomagnetic intensity variations for the past 8 kyr: new archaeointensity results from eastern China. Earth Planet. Sci. Lett. 392, 217–229. doi: 10.1016/j.epsl.2014.02.030
Constable, C., and Korte, M. (2015). “Centennial- to millennial-scale geomagnetic field variations,” in Treatise on Geophysics, Vol. 5, ed G. Schubert (Oxford: Elsevier), 309–341.
Constable, C., Korte, M., and Panovska, S. (2016). Persistent high paleosecular variation activity in southern hemisphere for at least 10000 years. Earth Planet. Sci. Lett. 453, 78–86. doi: 10.1016/j.epsl.2016.08.015
Davies, C., and Constable, C. (2017). Geomagnetic spikes on the core-mantle boundary. Nat. Commun. 8:15593. doi: 10.1038/ncomms15593
de Groot, L. V., Béguin, A., Kosters, M. E., van Rijsingen, E. M., Struijk, E. L. M., Biggin, A. J., et al. (2015). High paleointensities for the Canary Islands constrain the Levant geomagnetic high. Earth Planet. Sci. Lett. 419, 154–167. doi: 10.1016/j.epsl.2015.03.020
Ertepinar, P., Langereis, C. G., Biggin, A. J., Frangipane, M., Matney, T., Ökse, T., et al. (2012). Archaeomagnetic study of five mounds from Upper Mesopotamia between 2500 and 700 BCE: further evidence for an extremely strong geomagnetic field ca. 3000 years ago. Earth Planet. Sci. Lett. 357, 84–98. doi: 10.1016/j.epsl.2012.08.039
Frank, U. (1999). Rekonstruktion von Säkularvariationen des Erdmagnetfeldes der letzten 100.000 Jahre - Untersuchungen an Sedimenten aus dem Lago di Mezzano und dem Lago Grande di Monticchio, Italien. PhD thesis, University of Potsdam.
Frank, U., Nowaczyk, N. R., and Negendank, J. F. W. (2007). Palaeomagnetism of greigite bearing sediments from the Dead Sea, Israel. Geophys. J. Int. 168, 904–920. doi: 10.1111/j.1365-246X.2006.03263.x
Frank, U., Schwab, M. J., and Negendank, J. F. W. (2002). A lacustrine record of paleomagnetic secular variation from Birkat Ram, Golan Heights, (Israel) for the last 4400 years. Phys. Earth Planet. Inter. 133, 21–34. doi: 10.1016/S0031-9201(02)00085-7
Frank, U., Schwab, M. J., and Negendank, J. F. W. (2003). Results of rock magnetic investigations and relative paleointensity determinations on lacustrine sediments from Birkat Ram, Golan Heights (Israel). J. Geophys. Res. 108:B8. doi: 10.1029/2002JB002049
Gogorza, C. S. G., Irurzun, M. A., Chaparro, M. A. E., Lirio, J. M., Nunez, H., Becoff, P. G., et al. (2006). Relative paleointensity of the geomagnetic field over the last 21,000 years BP from sediment cores, Lake El Trébol (Patagonia, Argentina). Earth Planets Space 58, 1323–1332. doi: 10.1186/BF03352628
Gogorza, C. S. G., Lirio, J. M., Nuñez, H., Chaparro, M., Bertorello, H. R., and Sinito, A. M. (2004). Paleointensity studies on Holocene-Pleistocene sediments from Lake Escondido, Argentina. Phys. Earth Planet. Inter. 145, 219–238. doi: 10.1016/j.pepi.2004.03.010
Gogorza, C. S. G., Sinito, A. M., Lirio, J. M., Nuñez, H., Chaparro, M., and Vilas, J. F. (2002). Paleosecular variations 0-19,000 years recorded by sediments from Escondido Lake (Argentina). Phys. Earth. Planet Inter. 133, 35–55. doi: 10.1016/S0031-9201(02)00086-9
Gubbins, D. (1975). Can the Earth's magnetic field be sustained by core oscillations? Geophys. Res. Lett. 2, 409–412. doi: 10.1029/GL002i009p00409
Holme, R. (2015). “Large-scale flow in the core,” in Treatise on Geophysics, Vol. 8, ed G. Schubert (Oxford: Elsevier), 91–113.
Hong, H., Yu, Y., Lee, C. H., Kim, R. H., Park, J., Doh, S.-J., et al. (2013). Globally strong geomagnetic field intensity circa 3000 years ago. Earth Planet. Sci. Lett. 383, 142–152. doi: 10.1016/j.epsl.2013.09.043
Hulot, G., Eymin, C., Langlais, B., Mandea, M., and Olsen, N. (2002). Small-scale structure of the geodynamo inferred from Oersted and Magsat satellite data. Nature 416, 620–623. doi: 10.1038/416620a
Irurzun, M. A., Gogorza, C. S. G., Chaparro, M. A. E., Lirio, J. M., Nuñez, H., Vilas, J. F., et al. (2006). Paleosecular variations recorded by Holocene-Pleistocene sediments from Lake El Trébol (Patagonia, Argentina). Phys. Earth Planet. Inter. 154, 1–17. doi: 10.1016/j.pepi.2005.06.012
Jackson, A., Jonkers, A. R. T., and Walker, M. R. (2000). Four centuries of geomagnetic secular variation from historical records. Phil. Trans. R. Soc. Lond. A 358, 957–990. doi: 10.1098/rsta.2000.0569
King, J. K. (1983). Geomagnetic Secular Variation Curves for Northeastern North America for the Last 9000 Years. PhD thesis, University of Minnesota.
Kissel, C., Laj, C., Rodriguez-Gonzales, A., Perez-Torrado, F., Carracedo, J. C., and Wandres, C. (2015). Holocene geomagnetic field intensity variations: contributions from the low latitude Canary Island site. Earth Planet. Sci. Lett. 430, 178–190. doi: 10.1016/j.epsl.2015.08.005
Korte, M., Brown, M., Frank, U., Senftleben, R., and Nowaczyk, N. (2017). “Global geomagnetic field reconstructions from centuries to excursions,” in Magnetic Fields in the Solar System, eds H. Lühr, J. Wicht, S. Gilder, and M. Holschneider (Springer International Publishing), 83–110. Available online at: http://www.springer.com/de/book/9783319642918
Korte, M., Constable, C., Donadini, F., and Holme, R. (2011). Reconstructing the Holocene geomagnetic field. Earth Planet. Sci. Lett. 312, 497–505. doi: 10.1016/j.epsl.2011.10.031
Korte, M., Donadini, F., and Constable, C. (2009). Geomagnetic field for 0-3ka: 2. a new series of time-varying global models. Geochem. Geophys. Geosys. 10:Q06008. doi: 10.1029/2008GC002297
Licht, A., Hulot, G., Gallet, Y., and Thébault, E. (2013). Ensembles of low degree archeomagnetic field models for the past three millennia. Phys. Earth Planet. Inter. 224, 38–67. doi: 10.1016/j.pepi.2013.08.007
Livermore, P. W., Fournier, A., and Gallet, Y. (2014). Core-flow constraints on extreme archeomagnetic intensity changes. Earth Planet. Sci. Lett. 387, 145–156. doi: 10.1016/j.epsl.2013.11.020
Livermore, P. W., Hollerbach, R., and Finlay, C. C. (2017). An accelerating high-latitude jet in Earth's core. Nat. Geosci. 10, 62–68. doi: 10.1038/ngeo2859
Lund, S. P., and Banerjee, S. K. (1985). Late Quaternary paleomagnetic field secular variation from two Minnesota lakes. J. Geophys. Res. 90, 803–825. doi: 10.1029/JB090iB01p00803
Ojala, A. E. K., and Saarinen, T. (2002). Palaeosecular variation of the Earth's magnetic field during the last 10000 years based on on the annually laminated sediment of Lake Nautajärvi, central Finland. Holocene 12, 391–400. doi: 10.1191/0959683602hl551rp
Panovska, S., Finlay, C. C., Donadini, F., and Hirt, A. M. (2012). Spline analysis of Holocene sediment magnetic records: uncertainty estimates for field modeling. J. Geophys. Res. 117:B02101. doi: 10.1029/2011JB008813
Panovska, S., Korte, M., Finlay, C. C., and Constable, C. G. (2015). Limitations in paleomagnetic data and modelling techniques and their impact on Holocene geomagnetic field models. Geophys. J. Inter. 202, 402–418. doi: 10.1093/gji/ggv137
Pavón-Carrasco, F. J., Osete, M. L., Torta, J. M., and De Santis, A. (2014). A geomagnetic field model for the Holocene based on archeomagnetic and lava flow data. Earth Planet. Sci. Lett. 388, 98–109. doi: 10.1016/j.epsl.2013.11.046
Peng, L., and King, J. W. (1992). A late Quaternary geomagnetic secular variation record from Lake Waiau, Hawaii, and the question of the Pacific nondipole low. J. Geophys. Res. 97, 4407–4424. doi: 10.1029/91JB03074
Pressling, N., Brown, M. C., Gratton, M. N., Shaw, J., and Gubbins, D. (2007). Microwave palaeointensities from Holocene age Hawaiian lavas: Investigation of magnetic properties and comparison with the thermal palaeointensities. Phys. Earth Planet. Inter. 162, 99–118. doi: 10.1016/j.pepi.2007.03.007
Pressling, N., Laj, C., Kissel, C., Champion, D., and Gubbins, D. (2006). Palaeomagnetic intensities from 14C-dated lava flows on the Big Island, Hawaii: 0-21 kyr. Earth Planet. Sci. Lett. 247, 26–40. doi: 10.1016/j.epsl.2006.04.026
Saarinen, T. (1998). High-resolution palaeosecular variation in northern Europe during the last 3200 years. Phys. Earth Planet. Inter. 106, 299–309. doi: 10.1016/S0031-9201(97)00113-1
Shaar, R., Ben-Yosef, E., Ron, H., Tauxe, L., Agnon, A., and Kessel, R. (2011). Geomagnetic field intensity: How high can it get? How fast can it change? Constraints from Iron age copper slag. Earth Planet. Sci. Lett. 301, 297–306. doi: 10.1016/j.epsl.2010.11.013
Shaar, R., and Tauxe, L. (2013). Thellier GUI: an integrated tool for analyzing paleointensity data from Thellier-type experiments. Geochem. Geophys. Geosys. 14, 677–692. doi: 10.1002/ggge.20062
Shaar, R., Tauxe, L., Gogichaishvili, A., Rathert, M. C., Devidze, M., and Licheli, V. (2013). Absolute geomagnetic field intensity in Georgia during the past 6 millennia. Latinmag Lett. 3, 1–4. Available online at: http://www.geofisica.unam.mx/LatinmagLetters/LL13-03-SP/A/PA07.pdf
Shaar, R., Tauxe, L., Ron, H., Ebert, Y., Zuckerman, S., Finkelstein, I., et al. (2016). Large geomagnetic field anomalies revealed in Bronze to Iron Age archeomagnetic data from Tel Megiddo and Tel Hazor, Israel. Earth Planet. Sci. Lett. 442, 173–185. doi: 10.1016/j.epsl.2016.02.038
Snowball, I., Zillén, L., Ojala, A., Saarinen, T., and Sandgren, P. (2007). FENNOSTACK and FENNORPIS: varve dated Holocene palaeomagnetic secular variation and relative palaeointensity stacks for Fennoscandia. Earth Planet. Sci. Lett. 255, 106–116. doi: 10.1016/j.epsl.2006.12.009
St-Onge, G., Stoner, J. S., and Hillaire-Marcel, C. (2003). Holocene paleomagnetic records from the St. Lawrence Estuary, eastern Canada: centennial- to millennial-scale geomagnetic modulation of cosmogenic isotopes. Earth Planet. Sci. Lett. 209, 113–130. doi: 10.1016/S0012-821X(03)00079-7
Tauxe, L., and Yamazaki, T. (2015). “Paleointesities,” in Treatise on Geophysics, Vol. 5, ed G. Schubert (Oxford: Elsevier), 461–509.
Thébault, E., Finlay, C. C., Beggan, C. D., Alken, P., Aubert, J., Barrois, O., et al. (2015). International geomagnetic reference field: the 12th generation. Earth Planets Space 67:79. doi: 10.1186/s40623–015–0228–9
Keywords: archeomagnetism, paleomagnetism, intensity spike, secular variation, global magnetic field models
Citation: Korte M and Constable CG (2018) Archeomagnetic Intensity Spikes: Global or Regional Geomagnetic Field Features? Front. Earth Sci. 6:17. doi: 10.3389/feart.2018.00017
Received: 07 November 2017; Accepted: 16 February 2018;
Published: 07 March 2018.
Edited by:
Greig A. Paterson, Institute of Geology and Geophysics (CAS), ChinaReviewed by:
Chuang Xuan, University of Southampton, United KingdomPhilip Livermore, University of Leeds, United Kingdom
Copyright © 2018 Korte and Constable. This is an open-access article distributed under the terms of the Creative Commons Attribution License (CC BY). The use, distribution or reproduction in other forums is permitted, provided the original author(s) and the copyright owner are credited and that the original publication in this journal is cited, in accordance with accepted academic practice. No use, distribution or reproduction is permitted which does not comply with these terms.
*Correspondence: Monika Korte, monika@gfz-potsdam.de