Imprints of Climate Signals in a 204 Year δ18O Tree-Ring Record of Nothofagus pumilio From Perito Moreno Glacier, Southern Patagonia (50°S)
 Jussi Grießinger1*
  Lukas Langhamer2
  Christoph Schneider3
  Björn-Lukas Saß1
  David Steger3 Pedro Skvarca4
  Matthias H. Braun1
  Wolfgang J.-H. Meier1
  Ana M. Srur5
  Philipp Hochreuther1
- 1Institute of Geography, Friedrich-Alexander-Universität Erlangen-Nürnberg, Erlangen, Germany
- 2Institute of Atmospheric and Cryospheric Sciences, University of Innsbruck, Innsbruck, Austria
- 3Geography Department, Humboldt Universität zu Berlin, Berlin, Germany
- 4Glaciarium Centro de Interpretación de Glaciares, El Calafate, Argentina
- 5Instituto Argentino de Nivología, Glaciología y Ciencias Ambientales, CONICET, Mendoza, Argentina
A 204 year-long record of δ18O in tree-ring cellulose of southern beech (Nothofagus pumilio) from a site near Perito Moreno Glacier (50°S) in Southern Patagonia was established to assess its potential for a climate reconstruction. The annually resolved oxygen isotope chronology is built out of seven individual tree-ring δ18O series with a significant mean inter-series correlation (r = 0.61) and is the first of its kind located in Southern America south of 50°S. Over a common period from 1960 to 2013 of available stationary and high-resolution gridded CRU TS v. 4.01 data, the δ18O chronology exhibits a strong sensitivity toward hydroclimatic as well as temperature parameters as revealed by correlation analyses. Among these, positive correlations with maximum temperature in the first part of the summer season (CRU rONDJ = 0.51, p < 0.01) and negative correlations with precipitation in the latter half of the vegetation period (CRU rONDJ = −0.54, p < 0.01) show the highest sensitivities. A strong supra-regional influence of the Southern Annular Mode (SAM) is clearly recorded in this chronology as indicated by significant positive correlations during the vegetation period (rONDJ = 0.62, p < 0.01). This indicates that the presented δ18O-chronology shows great promise to reconstruct the influence and variability of the SAM within the last two centuries in southern South America. The modulation of positive and negative anomalies within this series can be interlinked to changes in moisture source origin as revealed by backward trajectory modeling. Additionally, these anomalies can be directly associated to positive or negative phases of the Antarctic Oscillation Index (AAOI) and therefore the strength of the Westerlies. Aligned by the analysis on the influence of different main weather types on the δ18O chronology it is shown that such time-series hold the potential to additionally capture their respective influence and change during the last centuries.
Introduction
The climate of southern South America (40–55°S) is mainly determined by its location within the belt of the Southern Hemisphere Westerlies. As a consequence of only minor annual changes within the dominant pressure systems, strong westerly winds are prevailing throughout the year clearly influencing the seasonal distribution of temperature and rainfall in this area (Villalba et al., 2003). The mainly N-S directed mountain ridges of the southern Andes form one of the sharpest zonal transitions of climate in the world (Schneider et al., 2003). The latitudinal arranged high-mountain orography close to the Pacific coastline leads to a large-scale uplift of moist air masses, resulting in strong orographic precipitation on the windward western fringes of the Andes (Garreaud et al., 2009, 2013). In contrast, the east-facing side of the Andean crests is characterized by typical orographically induced lee-effects resulting in a steep gradient of decreasing precipitation from West to East with increasing distance from the Andean crest line (Garreaud et al., 2013). As a consequence, the evolution of the zonal vegetation has adapted to this gradient resulting in a transition from deciduous forests accompanying the humid Andean ridges toward the steppe vegetation of the semi-arid south-eastern part of Patagonia (Paruelo et al., 1998).
Since the 1930's, the southern part of South America was subject to a substantial increase in near-surface air temperatures (Rosenblüth et al., 1997; Carrasco et al., 2002; Villalba et al., 2003). For the recent decades, a general increase in temperature cannot be clearly verified for the southern Andean region and is therefore under debate (Vuille et al., 2015). Likely coupled to general changes within large-scale circulation patterns, a profound glacier retreat and surface lowering for the Northern (NPI) and Southern Patagonian ice fields (SPI) is reported for the same period (Willis et al., 2012; Malz et al., 2018), mainly leading to substantial changes in the hydrosphere (Vuille et al., 2015). Hence, especially the core areas and surroundings of both, NPI and SPI are stated as key regions for analyzing the course, extent and effects of climate change on the Southern Hemisphere (Rignot et al., 2003). Unfortunately, a general challenge for a verifiable quantification of climate change in the region between 45 and 55°S is the still underrepresented existence of long-term high-resolution climate datasets. Since the available station network is sparsely distributed and contains mainly short time-series with prevalent data gaps, a substantial analysis on the spatiotemporal magnitude and impact of this change is hampered and yet challenging. In contrast, reliable data for understanding processes on the dynamics and responses of the glaciers of the SPI are urgently needed (Casassa et al., 2002; Stuefer et al., 2007).
The use of diverse proxy archives recording environmental conditions on different time-scales can help to attenuate the assessment of climate change. Especially tree-rings with their annual resolution contain a high potential to interlink recent changes with conditions in the past. Studies on the use of oxygen isotope ratios in tree rings have proven the importance of this proxy as a valuable tool for palaeoclimatic research. In a sensu stricto palaeoclimatic context, they have been successfully applied globally for the reconstruction of different atmospheric parameters like precipitation (Danis et al., 2006; Treydte et al., 2006, 2007; Reynolds-Henne et al., 2007; Grießinger et al., 2011), temperature (Edwards et al., 2008; Lavergne et al., 2016), relative air humidity (Edwards et al., 2008; Grießinger et al., 2017), cloud cover (Liu et al., 2012, 2014), extreme weather events or droughts (Miller et al., 2006; Berkelhammer and Stott, 2008; Sano et al., 2017) as well as supra-regional atmospheric circulation patterns (Welker et al., 2005; Brienen et al., 2012; Saurer et al., 2012; Hochreuther et al., 2016). Such diversity of reconstructible parameters highlights the complexity of oxygen isotope signals in tree rings and underline the difficulty for an evident identification of a single climate parameter triggering the respective δ18Otree−ring signal (McCarroll and Loader, 2004). Nevertheless, the main advantage of δ18O as the target within the variety of existing tree-ring parameters lies within its ability to interlink different natural archives and geospheres via the water cycle.
Nothofagus pumilio is a widely distributed, dominant broadleaved tree-species forming pure or mixed forests in the mountainous areas in South America. Its natural distribution reaches from the coastal-near lowlands on the western margins of the Chilean Andes up to the sub-alpine vegetation belt on the western as well as eastern flanks of the Andean crests (Mathiasen and Premoli, 2010). Due to its wide geographical distribution, several studies on Nothofagus pumilio have been previously carried out clearly indicating the high potential of tree-ring width to reconstruct past climate variability (e.g., Villalba et al., 2003; Lara et al., 2005). In comparison to other geographical areas, accompanying studies on stable isotopes in tree-rings in southern South America are still scarce. Recently, the works by Lavergne et al. (2016, 2017a,b) revealed the high potential of such studies on tree-ring δ18O and therein reflected informations on (past) climate variability in northern Patagonia. However, research on δ18O in tree-rings from the areas in Patagonia south of 50°S are up to now not existing for comparable research.
Within this study, we aim at evaluating the general potential of δ18O in tree-ring cellulose of Nothofagus pumilio for the use as a climate proxy at a glacier-near site close to the Perito Moreno Glacier as part of the SPI (50°S). In doing so, we want (i) to evaluate to which extent our annually resolved tree-ring oxygen isotope time series is sensitive to local climate conditions, (ii) to decipher the possible influence of supra-regional phenomena influencing southern South America like the Southern Annular Mode (SAM) or ENSO on variations of tree-ring δ18O, and (iii) analyse the influence of differing moisture origins and changing frequencies in the appearance of main weather types on δ18O variations in Nothofagus pumilio during years of noticeable positive or negative deviations from the long-term mean.
Materials and Methods
Study Site and Sampling
As part of the Southern Patagonian Ice Field, the Perito Moreno Glacier (PMG) is a typical calving glacier on the eastern margin of the Southern Patagonian Icefield (Figure 1). In contrast to other surrounding glaciers, its extent within the last decades is characterized by only minor fluctuations of the glacier front (Stuefer et al., 2007). Assumable general minor variations in the absolute glacier extent during the last century led to the establishment of Nothofagus forests in the former glaciated areas and along the elder lateral and terminal moraines (Aniya and Skvarca, 2012) (Figure 2).
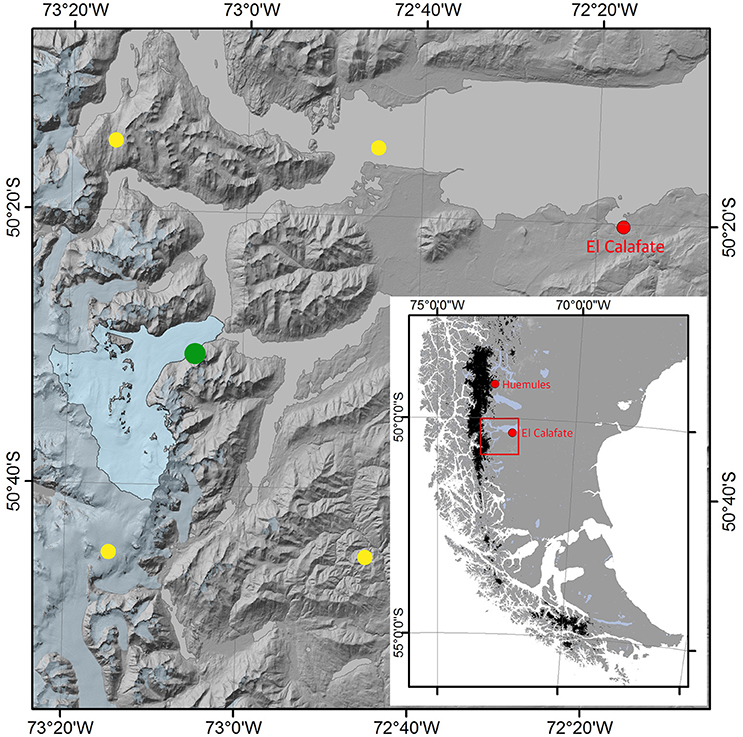
Figure 1. Digital Elevation Model (SRTM) of Southern Patagonia overviewing the investigation area of this study. Bright blue area: Extent and catchment of the Perito Moreno Glacier. Green Circle: location of tree-ring sampling site. The yellow circles represent the four nearest 0.5° grid points of the CRU TS v. 4.01 dataset. Inlay: Blackened areas in the Inlay mark locations of glaciated areas in South America. Dark blue area: Actual extent of glaciated areas of the Southern Patagonia Ice Field (SPI). Red dots: location of the nearest meteorological stations in El Calafate and Los Huemules (Inlay).
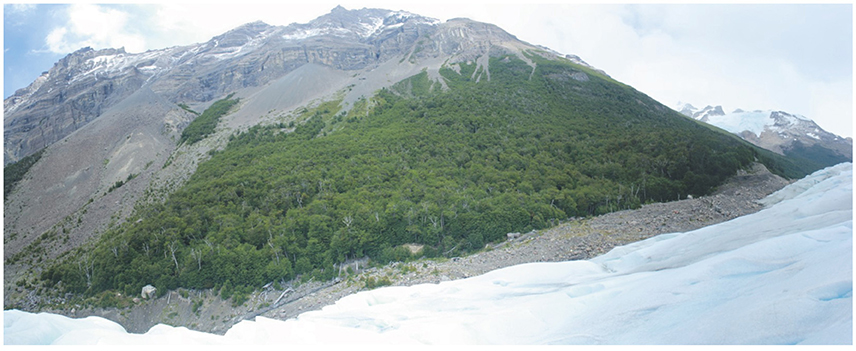
Figure 2. Panoramic overview on the location of the sampled forest site on the Perito Moreno Glacier lateral moraine. Picture taken by B.L. Saß.
Local climate as reflected by the closest meteorological station in El Calafate (198 masl) is characterized by an annual precipitation of 200 mm and a mean annual temperature of 7.5 °C being characteristic for a steppe climate (Figure 2). Relatively cold winters (TJJA = 1.4°C, PrecipJJA = 45 mm) alternate with warm and dry summers (December to February; TDJF = 13.0°C, PrecipDJF = 27 mm). Months with a maximum amount of rainfall are April (18 mm) and May (20 mm). As stated by Garreaud et al. (2009), the region is characterized by a steep gradient in decreasing precipitation. Therefore, we additionally used a 10 year dataset from a climate station at Estancia Los Huemules (49.1°S/7.6°W), located 140 km north of our sampling site at an elevation of approx. 460 masl. The obtained values indicate similar results for temperature (TYear = 7.4°C; TDJF = 12.9°C, TJJA = 1.9°C) but are displaying substantial differences in the respective amount in annual and seasonal precipitation (PrecipYear = 931 mm, PrecipDJF = 230 mm, PrecipJJA = 212 mm). Although the time-series from Los Huemules is too short for a substantial and statistically sound analysis of climate-proxy relationships, we consider especially the apparent differences in precipitation obviously caused by elevational and distance effects as relevant for a latter discussion.
Tree-ring samples of southern Beech (Nothofagus pumilio) were collected during a field campaign at Parque Nacional Perito Moreno in the austral spring (November 2014). Sampling was performed on the southern lateral moraine of Perito Moreno Glacier at elevations between 500 and 600 masl (Figures 1, 2). The sampling design focused on mainly undisturbed and mature trees with a distinct distance from depressions. In addition, well drained slope stands with inclinations higher than 30° were preferred to minimize the influence of stagnant or ground water on our sampled trees. In total, 96 (paired) cores from 48 tree individuals were extracted using a 5 mm diameter MORA increment borer.
Dating and Evaluation of δ18OTRC
Ring widths of the collected samples were measured using a Lintab 6 system (Rinntech, Heidelberg, Germany) with an accuracy of 0.01 mm to exactly date each increment core. Regarding the convention by Schulman (1956) the calendar year overlap of the austral vegetation period (September of the actual year to May of the following year) has to be taken into account for the termination of the exact end-date of our tree-ring series. In this case, the last completely formed tree-ring is of 2013 (with the respective vegetation period from September 2012 to May 2013), while the ring of 2014 was not completely formed when sampling took place, yet. Although in parts visible and measurable, the year 2014 was therefore truncated off our series to avoid a bias in our annual values. Following standard methods by Cook and Kairiukstis (1990) and Fritts (1976), after the visual and statistical cross-dating all individual ring-width series were averaged into a mean tree-ring width chronology spanning the period 1809–2013 using the TSAP-Win Software (RINNTECH).
For the analysis of the ratio of oxygen isotopes in tree-ring cellulose (thereafter expressed as δ18OTRC), we selected seven cores from different tree individuals out of the sample pool, exceeding the usually accepted minimum sample depth of four to five cores per investigation site to ensure a representative and reliable oxygen isotope chronology (Leavitt, 2010). In comparison to other studies, the individual tree analysis of δ18OTRC was not only assigned to the years of available stationary climate date (usually the last 50–60 years), but was moreover applied for the complete available period from 1809 to 2013 (204 years). Hence, pooling of samples was avoided to preserve occurring (high-)frequency variabilities within the individual δ18OTRC-series. All cores chosen for the oxygen isotope analyses met the criteria of: (1) a similar maximum tree age of at least 170 years to avoid possible signal-biasing juvenile effects within the last decades, (2) no missing rings or plateaus of depressed growth with extremely narrow rings (< 0.3 mm) to ensure sufficient material for the isotope analysis (3) similar growth trends for the selected individual trees.
As the initial step for the δ18O tree-ring analysis, dated growth rings were cutted under a binocular using a razor blade. Afterwards, following the method described by Wieloch et al. (2011), α-cellulose was extracted for all seven trees to avoid a signal biasing contamination with resins and lignin. The resultant α-cellulose samples were homogenized using an ultrasonic sound system described by Laumer et al. (2009) and subsequently freeze-dried in a lyophilization unit (M. Christ Ltd.). Individual cellulose samples of ~200 μg were weighted and packed into silver capsules and stored prior the isotope measurement for minimum 48 h in a vacuum oven to avoid a possible hygroscopically caused exchange with ambient air. The final analysis of the cellulose 18O/16O ratio (expressed as δ18O) was determined using a continuous flow Delta V Advantage Isotope Ratio Mass Spectrometer (Thermo Fisher Scientific Inc.) coupled to a HEKATech pyrolysis reactor. Measurements were calibrated to periodically interposed internal and international laboratory standards resulting in an analytical precision better than 0.2‰.
Climate Data and Examination of Proxy-Climate Relationships
For a profound and statistically as well as climatologically reproducible quantitative analysis of climate-proxy relationships, a survey of available representative (regional) climate datasets is required. Especially in high mountain areas and/or remote areas like Patagonia, this is a critical step since meteorological datasets by rain gauges are frequently not representative compared to the climate at the sampling sites due to larger distance and differing altitudes of the climate stations. To quantify the proxy-climate relationships of our δ18OTRC series, we first performed Pearson's correlations with temperature and precipitation data from the nearest climate station in El Calafate with the longest available measuring period in the region (Figure 1).
For the period from 1960 to 2013, common data for temperature (Tmean, Tmin, Tmax) and precipitation is available. Since the general availability of meteorological stations on the eastern margins of the Andes south of 45°S that (i) comprise records spanning more than 30 years, (ii) show a continuously recording with no data gaps, and (iii) provide a sufficient spatial density to gain the possibility to build regional means is scarce, we additionally applied analyses with gridded datasets from the four nearest 0.5° CRU TS 4.01 gridpoints (Harris and Jones, 2017, data from https://crudata.uea.ac.uk/cru/data/hrg/cru_ts_4.01/, cf. Figure 1 overview map). The respective CRU time-series cover a maximum period from 1901 to 2016 and have the advantage to contain a wide range of (hydro)climatic variables including data on cloud cover, diurnal temperature range, frost day frequency, potential evapotranspiration, precipitation, Tmean, Tmin, Tmax, vapor pressure and wet day frequency (rain days per month).
To evaluate possible influence of supra-regional climate phenomena influencing our time-series, we additionally performed statistical analyses with datasets of the Southern Annular Mode (SAM, or Antarctic Oscillation AAO) and the Oceanic Nino Index (ONI). The SAM describes the pattern of climate variability in the southern Hemisphere and reflects in southern South America the latitudinal distribution on the strength and distribution of rainfall, demonstrably even throughout the last Millennium (Abram et al., 2013). For areas in Patagonia south of 40°S, it is reported for the determination of long-term climate variability by triggering surface air temperatures (Garreaud et al., 2009). Hence, it is expected to be of great relevance for tree-growth in Patagonia (Villalba et al., 2012). The recently developed ONI-Index from the NOAA is a novel ENSO indicator for monitoring the contrasting patterns of El Niño and La Niña phases responsible for substantial changes in weather patterns over South America. Therefore both, the SAM (https://climatedataguide.ucar.edu/climate-data/marshall-southern-annular-mode-sam-index-station-based) and the ONI Indices (http://origin.cpc.ncep.noaa.gov) were chosen for testing their respective influences on our δ18OTRC series.
Moisture Source Detection by Backward Trajectory Modeling
As stated, the δ18O in natural archives is known as an applicable parameter for the reconstruction of moisture history, variability, and hydroclimate in general. However, recent studies demonstrated the importance of including analyses on the moisture transport history for a thorough interpretation of δ18O signals in trees especially on sites affected by surrounding high mountain belts or seasonally distinctive differing moisture sources (Berkelhammer and Stott, 2008; Brienen et al., 2012; Wernicke et al., 2017). Demonstrably, the alteration of the δ 18O signal in precipitation during its transportation across the southern Andes is triggered by isotope fractionation effects like an amount, distance and altitude effect (Vogel et al., 1975; Stern and Blisniuk, 2002). As stated by Stern and Blisniuk (2002), precipitation in this region is predominantly derived of moisture sources originating from the Pacific Ocean.
In general, the δ18O content of tree-ring cellulose is stated to be controlled by (i) the isotopic composition of the source water, (ii) an evaporative enrichment of 18O on leaf level during gas exchange, and (iii) a plant-internal alteration through fractionation effects during cellulose synthesis (Barbour, 2007; Gessler et al., 2014; Treydte et al., 2014). Since substantial changes in the moisture origin of precipitation will lead to changes in the δ18O source water signal (Dansgaard, 1964), differences in the annual origin of air masses are expected to also alter our respective δ18OTRC value as reported by other studies (Johnson and Ingram, 2004; Dayem et al., 2010; Wernicke et al., 2017). By taking into account possible influences of these effects on our δ18OTRC time series, the analysis of backward trajectory modeling for selected years seems to be an appropriate approach to disentangle the influence of differing moisture signal of differing atmospheric water pools on our time series.
The use of trajectories enables to visualize movement patterns of air parcels in the free atmosphere. In doing so, backward trajectory calculations provide insights into the analysis on the origin of air parcels. By neglecting possible mixture effects with neighboring air parcels and cloud condensation effects, the modification of specific humidity along a trajectory within a certain time step is the result of moisture uptake (evaporation) or moisture loss (precipitation) (Stohl and James, 2004). A verified method to determine moisture origins using backward trajectories was developed by Sodemann et al. (2008). Therein, once a trajectory absorbs moisture within the mixed and turbulent planetary boundary layer, a moisture source is detected. Those moisture sources are then corrected to their respective proportion to the precipitation in the target area, including rain-out effects during the transportation pathway of the air parcels. The starting points of the respective backward trajectories are located on the intersections of a latitudinal/longitudinal 0.75° × 0.75° grid. The starting points of the respective backward trajectories expands between 74.25° to 72.75°W and 48.0° to 51.75°S framing the target region. In the vertical the grid is separated into 11 equidistant levels starting from the surface to the 500 hPa level. This leads to a total amount of 198 starting points. Their location is chosen as such to detect the complete range of the potential rainfall in the surroundings of the SPI. Calculations of trajectories were carried out using the Lagrangian Analysis Tool LAGRANTO (Wernli and Davies, 1997) applied to ERA-Interim data (www.ecmwf.int; Dee et al., 2011). Every 6 h on each starting point an individual 18 day backward trajectory calculation starts. At any time, a trajectory hits land surface, it is artificially lifted by 10 hPa. Subsequently, the resulting moisture sources were projected on earth surface with a 1.5° resolution.
In a first approach, we tested a possible recording of moisture source origins in the δ18OTRC by focusing on the analysis of selected years during the common period of available proxy and ERA-Interim data from 1979 to 2013. In addition to the information gained by the analyses on proxy-climate-relationship, we tried to disentangle and quantify possible influences of a changing source water/precipitation 18O signal on our δ18OTRC chronology. Hence, we selected for further analyses in each case for 2 years, that are characterized by a markedly positive (1999, 2008) or negative deviation (2000, 2002) from the long-term δ18OTRC mean.
Weather Type Classification
While analyzing differences monthly precipitation data, changing or dominant influences of Mesoscale Weather Types (Grosswetterlagen/GWL) can be one driving factor for diverging monthly or even seasonal amounts of annual precipitation at the same location. On annual as well as decadal scale, shifts in the individual frequency of occurrence of a given GWL may therefore lead to substantial influences on regional ecosystems e.g., through an improvement or deterioration of plant available water during the vegetation period. To additionally test this influence of mesoscale climate effects on our δ18OTRC during recent decades, we investigated possible effects of weather types for the period 1979–2013.
The presented GWL classifications are calculated for a period of common data spanning from 1979-2013 using daily mean sea level pressure (MSLP) reanalysis data from the ERA-Interim dataset (www.ecmwf.int; Dee et al., 2011) with the same spatial resolution of 0.75° × 0.75° as used for the backward trajectory modeling. The temporal resolution is 12 h (0 a.m., 12 p.m. UTC). Applied for the area 10° to 80°S and 40° to 110°W, the data frame covers most of South America and the Antarctic Peninsula. The choice of the area as well as MSLP as weather classification variable are selected with reference to weather type classifications used by Frank (2002), Schneider et al. (2003) and Weidemann et al. (under review). We applied the cost733class-1.2 software (http://cost733.geo.uni-augsburg.de/cost733class-1.2) originally designed to classify circulation type patterns in Europe (Philipp et al., 2014b). The optimal number of classes is obtained by a k-means cluster algorithmic evaluation focusing on explained cluster variance (ECV) with increasing cluster numbers. The number of ten weather types was found to be optimal as there was no significant increase in ECV with higher cluster numbers. This is in accordance to the weather type classification by Frank (2002), used by Schneider et al. (2003) and both, earlier synoptic weather interpretation by Endlicher (1991) and the weather type classification based on empirical orthogonal functions presented by Compagnucci and Salles (1997). We applied the automated classification map-pattern scheme by Lund (1963) based on MSLP which makes use of so-called leader patterns. It constitutes a low computational cost predecessor of later cluster algorithms (Hartigan, 1975; Murtagh, 1985). Within the LUND-algorithm, in a first run a leader is identified as the one observation showing most matching cases (observations) of correlations that succeed a pre-defined threshold with all other observations (Lund, 1963; Philipp et al., 2014a). After removing the generated leader class, e.g., all Pearson correlation coefficient threshold succeeding correlations including the leader itself, the remaining class leaders are called in similar iterative processes (Lund, 1963; Philipp et al., 2014a). Following the assignment of all leaders, weather types are determined by returning all daily observations to the data pool and assigning each one to the nearest leader based on linear correlation (Lund, 1963; Philipp et al., 2014a). The threshold used in this study is set to a Pearson correlation coefficient of 0.85. Advantage of the Lund classification scheme is based on the fact, that it underlines the prevalence of weather types with westerly air flow. Subsequently, further significantly different but scarce weather types are detected. In contrast, k-mean leader algorithms tend to define balanced classes by equalizing the centroid size (Philipp et al., 2014b) resulting in a principally unilateral representation of similar weather types of westerly airflow. As a result, ten main weather types were acquired by our classification scheme.
Results and Discussion
Characteristics of the δ18OTRC Time-Series
With a mean inter-tree correlation coefficient of r = 0.61, the seven individual Nothofagus pumilio δ18OTRC time series were significantly correlated between each other. This supports our use of the mean site δ18OTRC chronology for all subsequent analyses. The resulting oxygen isotope series covers the period from 1809 until 2013 (204 years) and represents one of the longest available, annually resolved tree-ring oxygen isotope time series in southern South America. In particular, the chronology thus covers the climatically interesting final phase of the Little Ice Age, allowing future comparisons with past regional glacier fluctuations. As given in Table 1, the δ18OTRC time-series is characterized by a low autocorrelation (AC1 = 0.23) and a high signal-to-nose-ratio (SNR = 5.512). The standard deviation is quite low (SD = 0.51), with a maximum range of 2.6‰ between the minimum in 1976 (25.27‰) and the maximum in 1961 (27.89‰), respectively. Reflected by the Expressed Population Signal (EPS) threshold of EPS > 0.85 in Figure 3, the chronology can be considered as being reliable and representative starting from the year 1833.
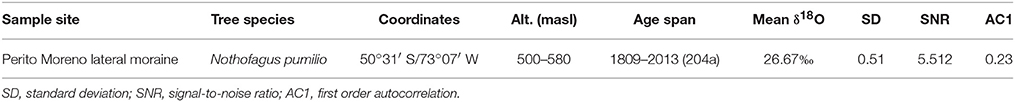
Table 1. General site characteristics and δ18OTree−ring-chronology statistics of the Perito Moreno Glacier sampling site.
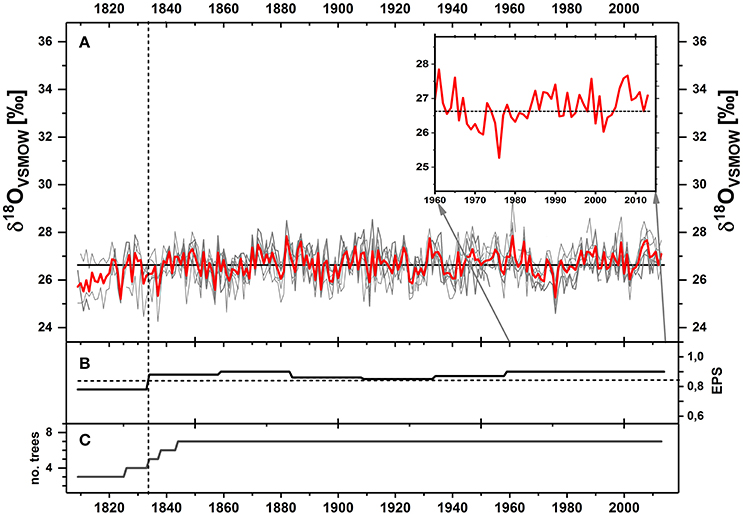
Figure 3. (A) 204 year δ18OTree−ring chronology (1809–2013) of Nothofagus pumilio trees from the Perito Moreno Glacier. Gray curves reflect the seven individual δ18OTRC time-series, bold red line the respective annual δ18OTRC mean of all trees. Bold horizontal black line: long-term mean of averaged time series. Vertical dotted line indicates the year, when threshold of EPS > 0.85 is reached (1833). Inlay shows δ18OTRC chronology (red curve) and long-term mean (horizontal line) for the period 1960–2013. (B) Expressed Population signal (EPS) calculated for a 50 year window with an 25 year overlap. Dotted horizontal line indicates 0.85 threshold. (C) Sample depth indicating the number of trees during the respective period.
However, the year-to-year variability within our time-series is noticeably high, expressed by years with remarkable positive and negative deviation from the long-term mean. Especially within the recent decades, the number of such (mainly positive) extreme values with a deviation of more than 1.5 SD (σ) seems to increase (Figure 3). Compared to the mean time-series value of 26.68‰, decadal phases of lowered oxygen isotope values are apparent for the periods 1920–1930 and 1960–1980. Periods of comparably higher isotope values can be observed during 1900 to 1920 and from 1940 to 1965. Since the beginning of the 1980's, a general increasing trend in δ18OTRC of +0.8‰ can be detected, only intermitted by a few years with more negative values. We assume that this reflects a general tendency to warmer and drier local climate conditions as reported by Garreaud et al. (2009) leading to a higher amount of heavier 18O isotopes stored in the tree-rings of Nothofagus pumilio.
Imprints of Climate Signals in δ18OTRC From Perito Moreno
Figure 4 displays results of correlations between our mean series and values of the climate station in El Calafate during the period 1960–2013. It is apparent, that the δ18OTRC variations are mostly sensitive to parameters reflecting hydroclimate within the vegetation period. Unfortunately, in the year 2001 the location of the meteorological station in El Calafate was moved several kilometers eastwards to the new local airport. This resulted in a necessary analytical split-up to account for possible coupled distance effects. Since this mainly influences the precipitation values, we separately analyzed (i) Period 1 from 1960 to 2000 and (ii) Period 2 from 2001 to 2013 (both not illustrated). However, to test the transferability of mean values for a possibly resultant climate reconstruction, we additionally checked correlations with the overall period spanning the years 1960–2013 (Figure 4). At first view, the resulting analysis of proxy-climate relationships reveal similar results. In both of the splitted time periods, a consistent (negative) influence of summer precipitation is apparent. The most significant influences on our δ18OTRC series result with the summer season mean from December to February (period 1: rDJF = −0.48, p < 0.01; period 2: rDJF = −0.48, p < 0.05) and for the main part of the vegetation period (period 1: rONDJF = −0.42, p < 0.01; period 2: rONDJF = −0.42, p < 0.05). Interestingly, for the overall period from 1960 to 2013 this relationship is shown to be dampened (r = −0.38, p < 0.05, Figure 4). Calculations with temperature data reveal a strong and significant positive influence on maximum temperature of March (rMarch = 0.43, p < 0.05 for period 1 and rMarch = 0.54, p < 0.5 for period 2). Even for the common period from 1960 to 2013, this positive relationship is consistent, but also slightly lowered as seen for the precipitation data (rMarch = 0.47, p < 0.01).
Since the station of El Calafate is located 80km east of our study site (Figure 1) and an obvious change in vegetation from Nothofagus forests at Perito Moreno moraine and steppe vegetation in El Calafate exists, we expect a substantial bias for calculations with this precipitation dataset. We assume that especially the available rainfall datasets from El Calafate station have to be considered not to be representative for our study site. In this context, the fundamental discrepancy of more than 700 mm between the yearly sum of rainfall measured in El Calafate compared to Los Huemules is an additional indicator of this assumed lack of representativeness (Figure 5). In the context of a general decrease in precipitation with increasing distance from the main Andean crests as reported by Garreaud et al. (2013), precipitation values recorded at stations like Los Huemules in terms of geographical location and elevation seem to be more appropriate for reflecting actual local climate conditions (Figure 5). This assumption is underlined by the results of a test with the corresponding temperature and precipitation datasets (figure not shown). Although due to the short overlap between the proxy and climate station series of only 7 years, significances of the results have to be regarded with caution. Despite, in parts substantial contrasting results are apparent. This applies without exception to the correlations between proxy and precipitation values, which consistently show in contrast to El Calafate positive correlations between the different autumn and summer seasonal means and the respective δ18OTRC (e.g., rMAR−APR = 0.71, p < 0.05; rJAN−APR = 0.69, p < 0.05).
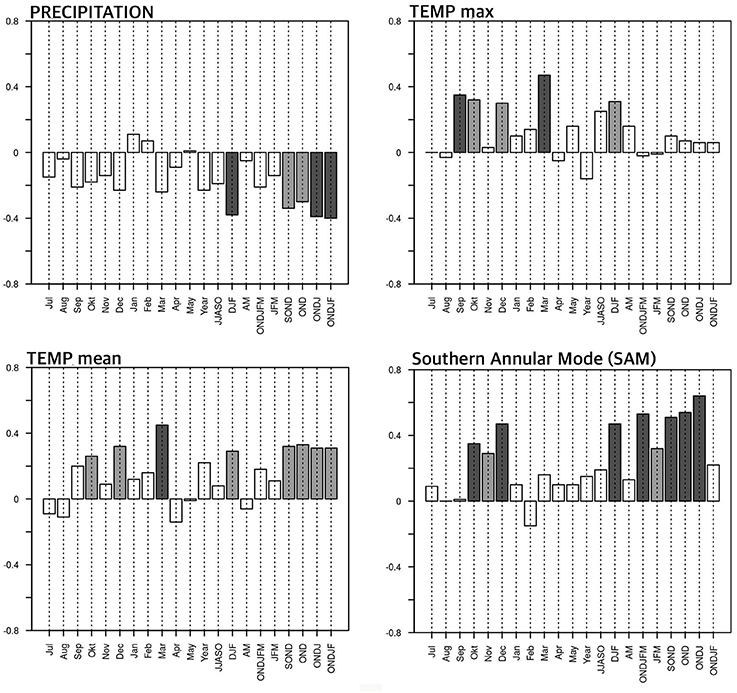
Figure 4. Climate-Proxy-Relationships between the δ18OTRC time series and selected climate parameters of the climate station in El Calafate. In addition, results of calculations with the Southern Annular Mode (SAM) are shown. Light gray bars indicate correlations reaching the p < 0.05 level of significance, dark gray bars correlations exceeding the p < 0.01 level of significance.
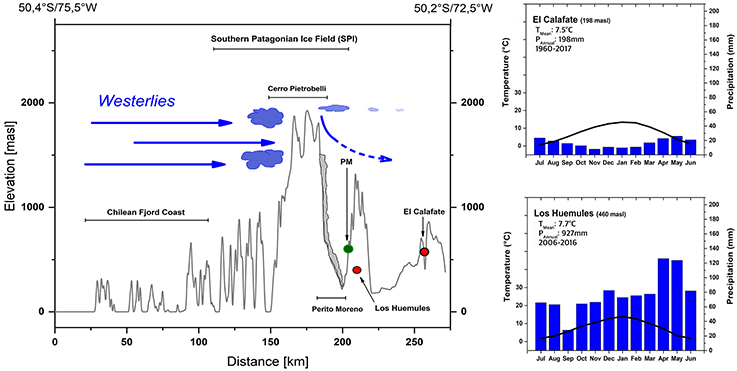
Figure 5. (Left) Elevation profile from the Pacific Ocean across the Andes and the Southern Patagonian Ice Field to El Calafate. Green circle indicates geographical setting of the sampling site at Perito Moreno Glacier southern lateral moraine (PM). Red circles indicate location of the AWS in El Calafate and the comparable geographical location (elevation, distance from main Andean ridge) of the AWS in Los Huemules. (Right) Climate diagrams of meteorological stations in El Calafate and Estancia Los Huemules.
Therefore, additional analyses with CRU TS 4.01 data for a corresponding period from 1960 to 2013 were performed to test their respective representativeness for our study site (Figure 6). Best results were obtained by building a regional mean of the nearest four grid points (cf. Figure 1). Mentionable, individual examination of climate-proxy relationships for all grid points constantly reveal almost identical responses. Like the calculations with the data from El Calafate, the obtained results indicate a strong (negative) influence of precipitation during the vegetation period from October to January (rONDJ = −0.54, p < 0.01) on our time-series. The sensitivity to precipitation is further underlined by significant negative correlations within the frequency in wet days during the vegetation period (rSOND = −0.55, p < 0.01; rOND = −0.55, p < 0.01). Supporting the results with station data from El Calafate, relationships between δ18OTRC values and different temperature parameters (Tmean, Tmax, Tmin) stay either consistent or were significantly stronger. Most significant positive correlations prevail with maximum temperatures during selected seasonal means of the vegetation period (rONDJ = 0.51, p < 0.01 and rSOND = 0.49, p < 0.01). Almost no significant relationships were found for the parameters number of frost days, minimum temperature, cloud cover or vapor pressure (not displayed). By combining these findings, phases with warmer and drier conditions and therefore higher evapotranspiration within the vegetation period should lead to the implementation of heavier 18O isotopes in the tree-ring cellulose of Nothofagus pumilio. This may be caused by the effect of enhanced leaf-water fractionation in favor of the implementation of heavier 18O isotopes during such phases (Barbour, 2007).
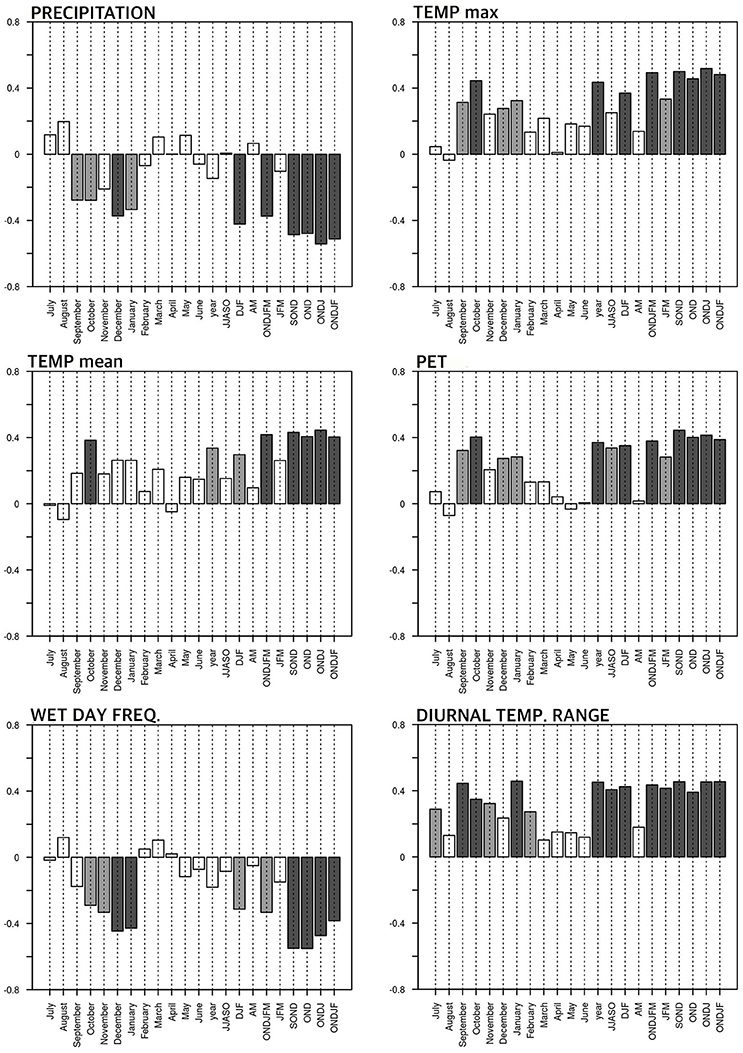
Figure 6. Climate-proxy-relationship between our δ18OTRC time series and the six most sensitive climate parameters of the calculated regional mean CRU 4.02 data. Light gray bars indicate correlations reaching the p < 0.05 level of significance, dark gray bars correlations exceeding the p < 0.01 level of significance.
Our analyses with the station-based Marshall Southern Annular Mode Index (SAM) led to even better results indicating a strong influence of seasonal modulations of the SAM on our δ18OTRC -variations (Figure 5). Highly significant positive values are apparent for the whole or parts of the vegetation period, indicating a consistent signal of the SAM. Best results with highest positive correlations can be obtained for a seasonal mean combining spring and summer months (rONDJ = 0.62, p < 0.01) or early summer (rOND = 0.56; p < 0.01), respectively. Additional correlations with the ENSO-related ONI-Index also reveal a positive influence on the δ18OTRC during the beginning of the vegetation period, however with a lower significance (rASO = 0.41, p < 0.05).
In summary, calculations with the regional mean of a CRU TS 4.01 dataset imply, that the seasonal amount of rainfall as well as the maximum temperature during the vegetation period have the largest influence on our δ18OTRC time-series. The consistent and significant relationships between local temperature and selected seasonal precipitation values for both, instrumental as well as CRU TS 4.01 data are encouraging. This tendency of positive correlations with temperature and negative correlations with precipitation were also reported by Lavergne et al. (2016), who studied the usability of δ18O in Nothofagus and Fitzroya species in northern Patagonia. The detected strong SAM signals in our δ18OTRC chronology are in good accordance to existing studies on a spatially consistent influence of the SAM on tree growth in southern South America (Villalba et al., 2012). It is therefore obvious, that our oxygen isotope time series contains valuable amounts of this supra-regional signal. Demonstrably, it can serve as a valuable proxy for SAM variability and therefore regional climate variability within the last two centuries.
Atmospheric Moisture Sources and δ18OTRC
Analysis of moisture source detection was applied for the seasons with highest significant correlations as revealed by proxy-climate relationships. Since our δ18OTRC values have an annual scale time-resolution, we focused on the analysis of moisture sources during the whole or parts of the vegetation period. Figure 7 shows the resulting maps of moisture sources during the period September–March for the years 1999 and 2000 (positive anomalies), as well as 2000 and 2002 (negative anomalies). In all 4 years, the maximum of moisture uptake is located in a spatially small region just off the Pacific coast line of the Southern Patagonian Icefield. Moisture sources, which contributed more than 1 mm/month, extend to the subtropics and highlight the role of subtropical moist air injections for the SPI region. Small recognizable differences in moisture sources for the chosen positive or negative years during the extremes are apparent.
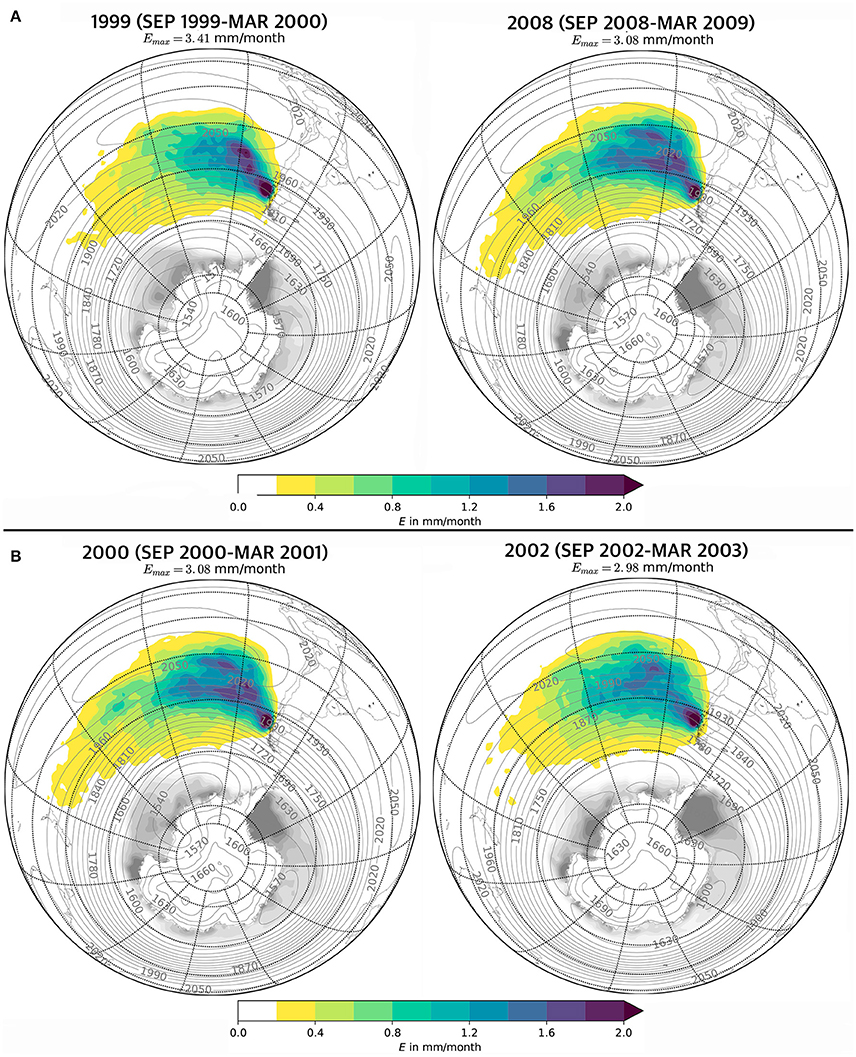
Figure 7. Mean moisture sources (colored area, in mm/month) of the Southern Patagonia Icefield for the chosen (A) positive and (B) negative extreme years. The individual maximum moisture source exceeding the colorbar legend (Emax) is indicated for orientation. Gray lines indicate the average 800 hPa geopotential height and the gray shaded area the average sea ice cover during the respective time period. Interval of the Meridians is 30°, of the Parallels 15°.
Differences between the selected years and the average conditions of the selected time period from 1979 to 2017 are given as an anomaly plot in Figure 8. It is apparent, that a higher amount of moisture originates from an area around 90°W and 40°S. In the selected positive extreme years of 1999 and 2008, more moisture comes from subtropical regions. For the vegetation period in the year 2008, our dataset indicated enhanced Westerlies in the mid latitude section. We assume, that this could have resulted in a shorter and probably faster moisture transport to the target area, associated with lowered fractionation effects leading to more positive δ18OTRC values. In contrast, the negative extreme year of 2000 showed an enhanced moisture uptake in the subpolar region. Positive geopotential height anomalies around Antarctica weakened the influence of the westerly wind belt. As a result, cold and dry descending air masses (katabatic winds) from Antarctica triggered the convection over the ice free pacific planetary boundary layer and led to an increase in moisture uptake from 45°S polewards (Drüe and Heinemann, 2001). A reduction in the moisture contribution off the Pacific coastline is also apparent in both, the vegetation period 2000 and 2002, although the general anomaly patterns show only little similarities. For instance, the vegetation period 2002 is characterized by an enhanced moisture uptake also in the subtropical region, with up to 0.15 mm/month more moisture originating from the South American continent (Figure 7). The associated moisture source recycling could then alter the respective δ18OTRC value and might result in a more negative δ18OTRC.
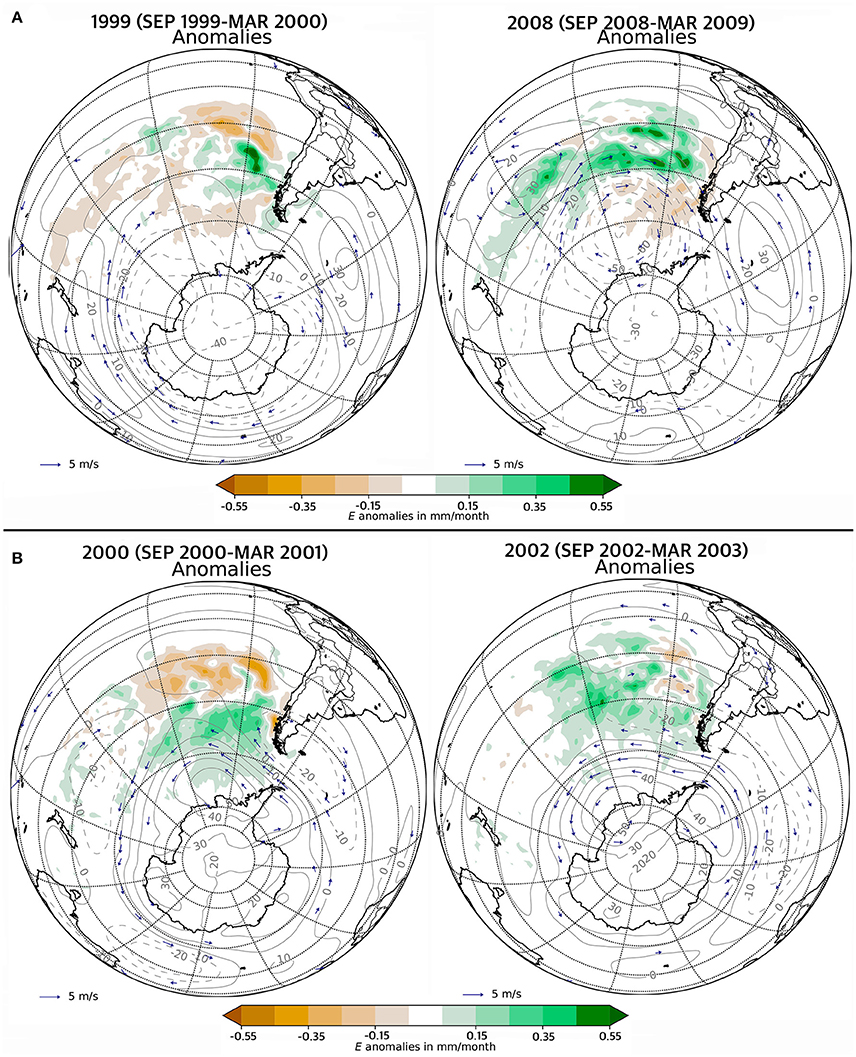
Figure 8. Mean moisture source anomalies in mm/month for the chosen (A) positive and (B) negative extreme years. Orange areas highlight a moisture source deficit and green areas a surplus during the respective period. The anomalies of the 800 hPa geopotential height and wind field anomalies exceeding 1.5 m/s are depicted as well. Interval of the Meridians are 30°, of the Parallels 15°.
As described, the negative extreme years can be linked to weaker westerlies around 60°S. Thereby motivated, we tried to disentangle a possible linkage between our extreme years and calculated means for the Antarctic Oscillation Index (AAOI) derived from the NOAA. Interestingly, the negative amplitudes in our two chosen years 2000 and 2003 can be associated to a negative Antarctic oscillation Index (AAOI; AAOI2000 = −0.45; AAOI2002 = −0.49), whereas on the contrary a positive AOI is reported during the positive extremes in 1999 and 2008 (AAOI1999 = 0.91; AAOI2008 = 0.74). Despite the up to now insufficient data assignment, we nevertheless assume a stored AAOI signal within our δ18OTRC which underlines the importance of such time series for a retrospective analysis of extremes or the identification of tipping points on a spatially and/or temporally changing influence of the AOI in South America (Gong and Wang, 1999).
Since we only selected 4 years for our analyses, we are aware that the obtained results at this point certainly cannot be regarded as significant and certainly have to be regarded as provisional. For example, an additional cross-validation with measured precipitation values is necessary, but remains at this point difficult since substantial comparisons are heavily biased due to the assumed problematic precipitation values from the existing meteorological stations. In addition, our results would benefit from a further comparison and cross-validation with data from the Global Network of Isotopes in Precipitation (GNIP). However, this is unfortunately not possible and prevented (i) by generally very sparse, short and incomplete datasets in the area of southern South America or (ii) due to their non-representative location and/or highly faulty and missing data. Notably in an upcoming study, especially regional moisture dynamics caused by the influence of typical lee-effects at orographic barriers have to be therefore accounted (Jiang, 2003; Mölg et al., 2009). However, we can state in accordance to existing studies (Wernicke et al., 2017), that the influence of differing moisture pools might have a high impact on our tree-ring δ18O.
Main Weather Types and δ18OTRC
By comparing the seasonal variations in the respective frequencies of all ten weather types with our time series during the period 1979–2013, four types were identified to have the highest influence on our chronology (Figure 9). Most promising results were obtained with the influence of main weather type 8 (GWL 8, Table 2). For the effect of GWL 8 on our site, we assume comparatively more warm but moist influx from the North and a less pronounced Foehn-effect compared to the regular and typical westerly patterns of GWL 1–3. Highest (negative) correlations between the δ18OTRC and GWL 8 are apparent for late autumn (March to April, rMAR−APR = −0.52, p < 0.01), the latter half of the vegetation period from January to April (rJFMA = −0.43, p < 0.05) and the vegetation period (rSEP−APR, r = −0.42, p < 0.05) (Table 2). Calculations with a combination of GWL 6 and 8 (both with similar inflow conditions) also reveal for the same periods a general similar and consistently negative relationships. The combined influence of the combined GWL 6+8 indicate their highest correlation also for late autumn (rMAR−APR = −0.46, p < 0.01). These findings are in general consistent with the analysis of weather station and SAM data since they reveal that GWL's which do not trigger the typical Foehn-type situations (GWL 6 and GWL 8) tend to either increase precipitation or decrease air temperature (or both in parallel) at our sampling site. The sampling site appears to be situated well-sheltered to the east of the mountain range, and to be low enough to substantially profit from Foehn-effects during regular westerly air flow (approx. on 54% of all days; cf. Weidemann et al., under review). This is also indicated by prevailing positive, but weak correlations between δ18OTRC and GWL 1 (not shown here).
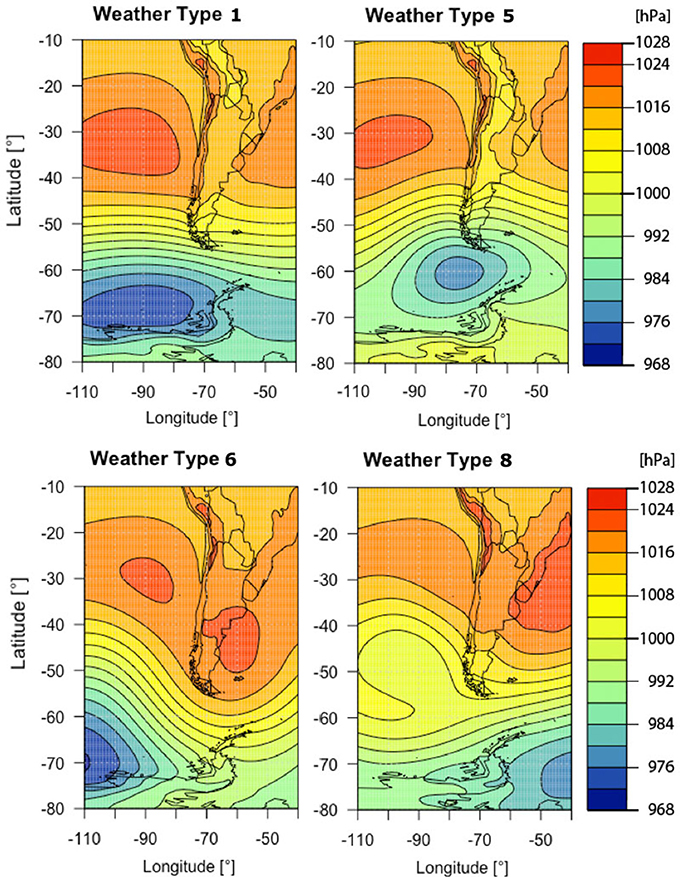
Figure 9. Most relevant main weather types (GWL's) for this study as defined by Weidemann et al. (under review) for South America.
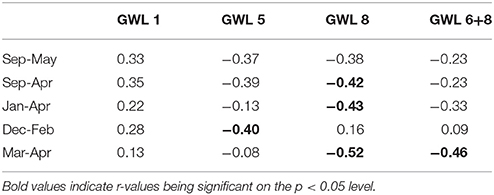
Table 2. Correlation coefficients (r) between δ18OTRC and selected main weather types (Grosswetterlagen, GWL).
Results on the analysis of main weather type 5 (GWL 5) on our time-series also reveal continuous negative correlations, which in parts reach the p < 0.05 threshold of significance (e.g., December to February, rDEC−FEB = −0.40, p < 0.05; Table 2). In general, an influence of GWL 5 points to southwesterly inflow under rather cyclonic conditions. The flow might be channelized into a more southerly flow along the Andes and therefore should result in overall colder and (possibly due to a reduced Foehn effect) more moist conditions at our sampling site. Negative correlations with the frequency occurrence of GWL 5 would in this respect be consistent with the findings in regard to the results of a strong SAM influence and derived moisture source origins.
It has to be stated, that prevailing influences of the weather type GWL 8 and a combination of GWL6 and GWL 8 with synoptically similar effects on our site are clearly recognizable in our time series. Especially in the latter half of the vegetation period, these weather types and their resulting conditions at our sampling site obviously trigger the regional climate and therefore the δ18OTRC values. For a substantial spatial analysis about the extent and/or a quantification of regional effects or even general trends of such GWL's in Southern Patagonia, more sites and longer datasets for comparisons are needed. Additional combined analyses on moisture sources associated to the most influencing GWL's could also be of great benefit for disentangling individual extreme events or even past variations in the occurrence of weather types. As mentioned, main challenges for a substantial interpretation are posed by the location of our study site close to the Perito Moreno Glacier and associated local-scale effects like the influence of katabatic winds possibly biasing supra-regional signals.
Conclusions
Within this study we established an annually resolved record of tree-ring δ18OTRC from Nothofagus pumilio trees at Perito Moreno Glacier. The resulting time-series covers the period 1809–2013 and is the first of its kind in Southern Patagonia south of 50°S. Within the scope of this study, we carried out multiple analyses on proxy-climate relationships to disentangle the imprints of regional to supra-regional climate signals on our δ18OTRC. Results from the proxy-climate calibration indicate a highly significant sensitivity of our time-series on the variability of the Southern Annular Mode (SAM) during the summer season. This signal in its absolute correlation value is much higher than any correlations with climate parameters from local station data or interpolated climate data from the CRU is TS 4.01 datasets. Hence, our calibration study demonstrates, that the obtained δ18OTRC series is a suitable proxy for the reconstruction of the SAM influence in this region.
Correlations with local station data as well as CRU v. 4.01datasets show a clear and stable relationship with temperature and precipitation for selected seasonal means during the vegetation period. Among these, particularly positive correlations with late autumn temperature in March (station data), maximum temperatures in the early vegetation period (October to January, CRU data) and negative correlations with precipitation data for different parts of the vegetation period (e.g., December to February, CRU data) were apparent. Despite the characteristically steep gradient in precipitation from West to East and coupled changes in vegetation from Nothofagus forests at our sample site to the steppe vegetation in El Calafate, we assume that the strong relationships between our proxy and the CRU datasets display a common long-term trend which possibly can be further quantified in an upcoming climate reconstruction. Obviously, the interpolated and gridded CRU-datasets are a more suitable record better displaying climate conditions at our sample site whereas station data from El Calafate tends to especially underestimates actual precipitation conditions.
A promising approach to disentangle the influence of changing source water pools in precipitation lies in the use of backward trajectories for the determination of moisture sources. In doing so, we were able to interlink years with prominent deviations from the long-term mean in our time-series to varying moisture pools in the Pacific Ocean. Additionally, these years can be directly linked to positive or negative AAOI-phases. An extension of such analyses to the period before 1979 by the use of other ERA datasets with possibly similar spatial resolution would be of great interest to further evaluate this relationship back in time.
Demonstrably, the influence of selected main weather types on our sample site is recorded in our δ18OTRC series. In general, the analysis on changing frequencies of mean weather types can help to identify and explain causes for extremes or abrupt shifts in the absolute values of a multi-century δ18OTRC time series. If these shifts can be coupled to changes in synoptic regimes primarily during a reasonable period when the respective proxy is directly recording environmental changes (e.g., during the vegetation period), such time-series can help to understand and decipher phases of stable and/or changing climate conditions in the past.
A main advantage on the choice of glacier-near sites for investigations on δ18OTRC lies within a possible linkage between different archives linked through the hydrological cycle. Such coupled information derived from the biosphere and observed responses in the cryosphere could lead to a better understanding of interactions and connections within the hydrosphere or atmosphere. Specifically, a possible outcome in further studies could be the comparison of mass balance time-series with local δ18OTRC series.
Author Contributions
JG: Performed the statistical analyses and drafted the manuscript; JG, PS, B-LS, and MB: Contributed to the conception and design of the study; WM, PH, LL, CS, and DS: Performed individual data analyses. All authors jointly contributed to submitted version of the manuscript.
Funding
This study was funded by the joint CONYCET-BMBF research project GABY-VASA (grant no. 01DN15020).
Conflict of Interest Statement
The authors declare that the research was conducted in the absence of any commercial or financial relationships that could be construed as a potential conflict of interest.
Acknowledgments
We thank I. Burchardt, A. Beyer, and R. Höfner-Stich (University of Erlangen-Nuremberg) for their support during sample preparation and oxygen isotope analyses.
References
Abram, N. J., Mulvaney, R., Vimeux, F., Phipps, S. J., Turner, J., and England, M. H. (2013). Evolution of the Southern Annular Mode during the past millennium. Nat. Clim. Change 4, 564–569. doi: 10.1038/nclimate2235
Aniya, M., and Skvarca, P. (2012). Little Ice Age advances of Glaciar Perito Moreno, Hielo Patagónico Sur, South American. Bull. Glaciol. Res. 30, 1–8. doi: 10.5331/bgr.30.1
Barbour, M. M. (2007). Stable oxygen composition in plant tissue: a review. Funct. Plant Biol. 34, 83–94. doi: 10.1071/FP06228
Berkelhammer, M., and Stott, L. (2008). Recent and dramatic changes in Pacific storm trajectories recorded in δ18O from Bristlecone Pine tree ring cellulose. Geochem. Geophys. Geosyst. 9, 1525–2027. doi: 10.1029/2007GC001803
Brienen, R. J., Helle, G., Pons, T. L., Guyot, J. L., and Gloora, M. (2012). Oxygen isotopes in tree rings are a good proxy for Amazon precipitation and El Nino-Southern Oscillation variability. Proc. Natl. Acad. Sci. 109, 16957–16962. doi: 10.1073/pnas.1205977109
Carrasco, J., Casassa, G., and Rivera, A. (2002). “Meteorological and climatological aspect of the Southern Patagonia Icefield,” in The Patagonia Icefields, eds G. Casassa, F. Sepulveda and M. Sincler (New York, NY: Kluwer-Plenum), 29–41.
Casassa, G., Rivera, A., and Aniya, M. (2002). “Current knowledge of the Southern Patagonia Icefield,” in The Patagonian Ice Fields: A Unique Natural Laboratory for Environmental and Climate Change Studies, eds G. Casassa, F. V. Sepúlveda and R. Sinclair (New York, NY: Kluwer Academic/Plenum Publishers), 67–83.
Compagnucci, R. H., and Salles, M. A. (1997). Surface pressure patterns during the year over southern South America. Int. J. Climatol. 17, 635–653.
Cook, E., and Kairiukstis, L. (1990). Methods of Dendrochronology, 1st Edn. Dordrecht; Boston; London: Springer.
Danis, P. A., Masson-Delmotte, V., Stievenard, M., Guillemin, M. T., Daux, V., Naveau, P., et al. (2006). Reconstruction of past precipitation δ18O using tree-ring cellulose δ18O and δ13C: A calibration study near Lac d'Annecy, France. Earth Planet. Sci. Lett. 243, 439–448. doi: 10.1016/j.epsl.2006.01.023
Dayem, K. E., Molnar, P., Battisti, D. S., and Roe, G. H. (2010). Lessons learned from oxygen isotopes in modern precipitation applied to interpretation of speleothem records of paleoclimate from eastern Asia. Earth Planet. Sci. Lett. 295, 219–230. doi: 10.1016/j.epsl.2010.04.003
Dee, D. P., Uppala, S. M., Simmons, A. J., Berrisford, P., Poli, P., Kobayashi, S., et al. (2011). The ERA-Interim reanalysis: configuration and performance of the data assimilation system. Q. J. R. Meteorol. Soc. 137, 553–597. doi: 10.1002/qj.828
Drüe, C., and Heinemann, G. (2001). Airborne investigation of arctic boundary-layer fronts over the marginal ice zone of the Davis Strait. Bound-Layer Meteorol. 101, 261–292. doi: 10.1023/A:1019223513815
Edwards, T. W. D., Birks, S. J., Luckman, B. H., and MacDonald, G. M. (2008). Climatic and hydrologic variability during the past millennium in the eastern Rocky Mountains and Northern Great Plains of western Canada. Q. Res. 70, 188–197. doi: 10.1016/j.yqres.2008.04.013
Endlicher, W. (1991). Zur Klimageographie und Klimaökologie von Südpatagonien. 100 Jahre Klimatologische Messungen in Punta Arenas [Climate-Geography and Climate-Ecology of Southern Patagonia. Hundred Years of Climate Measurements in Punta Arenas]. Vol 32. Freiburg: Univ. Freiburg; Department of Physical Geography, Freiburger Geographische Hefte, 181–211.
Frank, A. (2002). Semi-Objektive Klassifikation und Statistische Auswertung von Wetterlagen Südpatagoniens [Semi-Objective Classification and Statistical Analysis of Weather Types of South Patagonia], Master Thesis, Univ. Freiburg.
Fritts, H. (1976). Tree Rings and Climate. London, UK; San Francisco, CA; New York, NY: Academic Press Inc.; Elsevier Inc.
Garreaud, R. D., Vuille, M., Compagnucci, R., and Marengo, J. (2009). Present-day south American climate. Palaeogeogr. Palaeoclimatol. Palaeoecol. 281, 180–195. doi: 10.1016/j.palaeo.2007.10.032
Garreaud, R., Lopez, P., Minvielle, M., and Rojas, M. (2013). Large-scale control on the Patagonian climate. J. Clim. 26, 215–230. doi: 10.1175/JCLI-D-12-00001.1
Gessler, A., Ferrio, J. P., Hommel, R., Treydte, K., Werner, R. A., and Monson, R. K. (2014). Stable isotopes in tree rings: towards a mechanistic understanding of isotope fractionation and mixing processes from the leaves to the wood. Tree Physiol. 34, 796–818. doi: 10.1093/treephys/tpu040
Gong, D., and Wang, S. (1999). Definition of Antarctic oscillation index. Geophys. Res. Lett. 26, 459–462. doi: 10.1029/1999GL900003
Grießinger, J., Bräuning, A., Helle, G., Thomas, A., and Schleser, G. (2011). Late Holocene Asian summer monsoon variability reflected by δ18O in tree-rings from Tibetan junipers. Geophys. Res. Lett. 38:L03701. doi: 10.1029/2010GL045988
Grießinger, J., Helle, G., Hochreuther, P., Schleser, G. H., and Bräuning, A. (2017). Late Holocene relative humidity history on the southeastern Tibetan plateau inferred from a tree-ring δ18O record: recent decrease and conditions during the last 1,500 years. Q. Int. 430, 52–59. doi: 10.1016/j.quaint.2016.02.011
Harris, I. C., and Jones, P. D. (2017). CRU TS4.01: Climatic Research Unit (CRU) Time-Series (TS) version 4.01 of high-resolution gridded data of month-by-month variation in climate (Jan. 1901- Dec. 2016). Centre Environ. Data Anal.
Hartigan, J. (1975). Clustering Algorithms. Wiley Series in Probability and Mathematical Statistics. John Wiley & Sons.
Hochreuther, P., Wernicke, J., Grießinger, J., Mölg, T., Zhu, H., Wang, L., et al. (2016). Influence of the Indian Ocean Dipole on tree-ring δ18O of monsoonal Southeast Tibet. Clim. Change 137, 217–230. doi: 10.1007/s10584-016-1663-8
Jiang, Q. (2003). Moist dynamics and orographic precipitation. Tellus 55a, 301–316. doi: 10.1034/j.1600-0870.2003.00025.x
Johnson, K., and Ingram, B. (2004). Spatial and temporal variability in the stable isotope systematics of modern precipitation in China: implications for paleoclimate reconstructions. Earth Planet. Sci. Lett. 220, 365–377. doi: 10.1016/S0012-821X(04)00036-6
Lara, A., Villalba, R., Wolodarsky-Franke, A., Aravena, J. C., Luckman, B. H., and Cuq, E. (2005). Spatial and temporal variation in Nothofagus pumilio growth at tree line along its latitudinal range (35°40'-55°S) in the Chilean Andes. J. Biogeogr. 32, 879–893. doi: 10.1111/j.1365-2699.2005.01191.x
Laumer, W., Andreu, L., Helle, G., Schleser, G. H., Wieloch, T., and Wissel, H. (2009). A novel approach for the homogenization of cellulose to use micro-amounts for stable isotope analyses. Rapid Commun. Mass Spectromet. 23, 1934–1940. doi: 10.1002/rcm.4105
Lavergne, A., Daux, V., Villalba, R., Pierre, M., Stievenard, M., and Srur, A. M. (2017a). Improvement of isotope-based climate reconstructions in Patagonia through a better understanding of climate influences on isotopic fractionation in tree rings. Earth Planet. Sci. Lett. 459, 372–380. doi: 10.1016/j.epsl.2016.11.045
Lavergne, A., Daux, V., Villalba, R., Pierre, M., Stievenard, M., Vimeux, F., et al. (2016). Are the oxygen isotopic composition of Fitzroya cupressoides and Nothofagus pumilio cellulose promising proxies for climate reconstructions in northern Patagonia? J. Geophys. Res. 121, 767–776. doi: 10.1002/2015JG003260
Lavergne, A., Gennaretti, F., Risi, C., Daux, V., Boucher, E., Savard, M. M., et al. (2017b). Modelling tree ring cellulose δ18O variations in two temperature-sensitive tree species from North and South America. Clim. Past 13, 1515–1526. doi: 10.5194/cp-13-1515-2017
Leavitt, S. (2010). Tree-ring C-H-O isotope variability and sampling. Sci. Total Environ. 408, 5244–5253. doi: 10.1016/j.scitotenv.2010.07.057
Liu, X., An, W., Treydte, K., Shao, X., Leavitt, S., Hou, S., et al. (2012). Tree-ring δ18O in southwestern China linked to variations in regional cloud cover and tropical sea surface temperature. Chem. Geol. 291, 104–115. doi: 10.1016/j.chemgeo.2011.10.001
Liu, X., Xu, G., Grießinger, J., An, W., Wang, W., Zeng, X., et al. (2014). A shift in cloud cover over the southeasternTibetan plateau since 1600: evidence from regional tree-ring δ18O and its linkages to tropical oceans. Quat. Sci. Rev. 88, 55–68. doi: 10.1016/j.quascirev.2014.01.009
Lund, I. (1963). Map-pattern classification by statistical methods. J. Appl. Meteorol. 2, 56–65. doi: 10.1175/1520-0450(1963)002<0056:MPCBSM>2.0.CO;2
Malz, P., Meier, W., Casassa, G., Jana, R., Skvarca, P., and Braun, M. H. (2018). Elevation and mass changes of the Southern Patagonia Icefield derived from TanDEM-X and SRTM Data. J. Remote Sens. 10:188. doi: 10.3390/rs10020188
Mathiasen, P., and Premoli, A. C. (2010). Out in the cold: genetic variation of Nothofagus pumilio (Nothofagaceae) provides evidence for latitudinally distinct evolutionary histories in austral South America. Mol. Ecol. 19, 371–385. doi: 10.1111/j.1365-294X.2009.04456.x
McCarroll, D., and Loader, N. J. (2004). Stable isotopes in tree rings. Quat. Sci. Rev. 23, 771–801. doi: 10.1016/j.quascirev.2003.06.017
Miller, D. L., Mora, C. I., Grissino-Mayer, H. D., Mock, C. J., Uhle, M. E., and Sharp, Z. (2006). Tree-ring isotope records of tropical cyclone activity. Proc. Natl. Acad. Sci. U.S.A. 103, 14294–14297. doi: 10.1073/pnas.0606549103
Mölg, T., Chiang, J. C. H., Gohm, A., and Cullen, N. J. (2009). Temporal precipitation variability versus altitude on a tropical high mountain: Observations and mesoscale atmospheric modelling. Q. J. R. Meteorol. Soc. 135, 1439–1455. doi: 10.1002/qj.461
Paruelo, J., Beltran, A., Jobbagy, E., Sala, O., and Golluscio, R. (1998). The climate of Patagonia: general patterns and controls on biotic processes. Ecologia Austral. 8, 85–101
Philipp, A., Beck, C., Esteban, P., Kreienkamp, F., Krennert, T., and Lochbihler, K. et al. (2014a). cost733class-1.2 - User Guide. Available online at: http://cost733.geo.uni-augsburg.de/cost733class-1.2
Philipp, A., Beck, C., Huth, R., and Jacobeit, J. (2014b). Development and comparison of circulation type classifications using the cost 733 dataset and software. Int. J. Climatol. 36, 2673–2691. doi: 10.1002/joc.3920
Reynolds-Henne, C. E., Siegwolf, R. T. W., Treydte, K., Esper, J., Henne, S., and Saurer, M. (2007). Temporal stability of climate-isotope relationships in tree rings of oak and pine (Ticino, Switzerland). Glob. Biochem. Cycles 21:GB4009. doi: 10.1029/2007GB002945
Rignot, E., Rivera, A., and Casassa, G. (2003). Contribution of the Patagonia Icefields of South America to Sea Level Rise. Science 302, 434–437. doi: 10.1126/science.1087393
Rosenblüth, B., Fuenzalida, H. A., and Aceituno, P. (1997). Recent temperature variations in southern South America. Int. J. Climatol. 17, 67–85.
Sano, M., Dimri, A. P., Ramesh, R., Xu, C., Li, Z., and Nakatsuka, T. (2017). Moisture source signals preserved in a 242-year tree-ring δ18O chronology in the western Himalaya. Glob. Planet. Change 157, 73–82. doi: 10.1016/j.gloplacha.2017.08.009
Saurer, M., Kress, A., Leuenberger, M., Rinne, K. T., Treydte, K. S., and Siegwolf, R. T. W. (2012). Influence of atmospheric circulation patterns on the oxygen isotope ratio of tree rings in the Alpine region. J. Geophys. Res. 117:D05118. doi: 10.1029/2011JD016861
Schneider, C., Glaser, M., Kilian, R., Santana, A., Butorovic, N., and Casassa, G. (2003). Weather observations across the Southern Andes at 53°S. Phys. Geogr. 24, 97–119. doi: 10.2747/0272-3646.24.2.97
Schulman, E. (1956). Dendroclimatic Change in Semiarid America. Tucson, AZ: University of Arizona Press.
Sodemann, H., Schwierz, C., and Wernli, H. (2008). Interannual variability of Greenland winter precipitation sources: Lagrangian moisture diagnostic and North Atlantic Oscillation influence. J. Geophys. Res. Atmos. 113:D03107. doi: 10.1029/2007JD008503
Stern, L. A., and Blisniuk, P. M. (2002). Stable isotope composition of precipitation across the southern Patagonian Andes. J. Geophys. Res. 107, ACL 3-1–ACL 3-14. doi: 10.1029/2002JD002509
Stohl, A., and James, P (2004). A Lagrangian analysis of the atmospheric branch of the global water cycle: Part 1: method description, validation, and demonstration for the August 2002 flooding in central Europe. J. Hydrometeorol. 5, 656–678. doi: 10.1175/1525-7541(2004)005 < 0656:ALAOTA>2.0.CO;2
Stuefer, M., Rott, H., and Skvarca, P. (2007). Glaciar Perito Moreno, Patagonia: climate sensitivities and glacier characteristics preceding the 2003/04 and 2005/06 damming events. J. Glaciol. 53, 3–16. doi: 10.3189/172756507781833848
Treydte, K., Boda, S., Graf Pannatier, E., Fonti, P., Frank, D., Ullrich, B., et al. (2014). Seasonal transfer of oxygen isotopes from precipitation and soil to the tree ring: source water versus needle water enrichment. New Phytol. 202, 772–783. doi: 10.1111/nph.12741
Treydte, K., Frank, D., Esper, J., Andreu, L., Bednarz, Z., Berninger, F., et al. (2007). Signal strength and climate calibration of a European tree-ring isotope network. Geophys. Res. Lett. 34:L24302. doi: 10.1029/2007GL031106
Treydte, K., Schleser, G. H., Helle, G., Esper, J., Frank, D. C., Winiger, M., et al. (2006). The twentieth century was the wettest period in northern Pakistan over the past Millennium. Nature 440, 1179–1182. doi: 10.1038/nature04743
Villalba, R., Lara, A., Boninsegna, J. A., Masiokas, M., Delgado, S., Aravena, J. C., et al. (2003). Large-scale temperature changes across the southern Andes: 20th-century variations in the context of the past 400 years. Clim. Change 59, 177–232. doi: 10.1023/A:1024452701153
Villalba, R., Lara, A., Masiokas, M. H., Urrutia, R., Luckman, B. H., Marshall, G. J., et al. (2012). Unusual Southern Hemisphere tree growth patterns induced by changes in the Southern Annular Mode. Nat. Geosci. 5, 793–798. doi: 10.1038/ngeo1613
Vogel, J. C., Lerman, J. C., and Mook, W. G. (1975). Natural isotopes in surface and groundwater from Argentina. Hydrological Science Bulletin 20, 203–220.
Vuille, M., Franquist, E., Garreaud, R., Lavado, W., and Caceres, B. (2015). Impact of the global warming hiatus on Andean temperature. J. Geophys. Res. 120, 3745–3757. doi: 10.1002/2015JD023126
Welker, J. M., Rayback, S., and Henry, G. H. R. (2005). Arctic and North Atlantic Oscillation phase changes are recorded in the isotopes (δ18O and δ13C) of Cassiope tetragona plants. Glob. Change Biol. 11, 997–1002. doi: 10.1111/j.1365-2486.2005.00961.x
Wernicke, J., Hochreuther, P., Grießinger, J., Zhu, H., Wang, L., and Bräuning, A. (2017). Air mass signals in δ18O of tree-ring cellulose revealed by back-trajectory modeling at the monsoonal Tibetan plateau. Int. J. Biometeorol. 61, 1109–1124. doi: 10.1007/s00484-016-1292-y
Wernli, H., and Davies, H. C. (1997). A Lagrangian-based analysis of extratropical cyclones. I: the method and some applications. Q. J. R. Meteorol. Soc. 123, 467–489.
Wieloch, T., Helle, G., Heinrich, I., Voigt, M., and Schyma, P. (2011). A novel device for batch-wise isolation of α-cellulose from small amount wholewood samples. Dendrochronologia 29, 115–117. doi: 10.1016/j.dendro.2010.08.008
Keywords: tree-ring δ18O, Nothofagus pumilio, Southern Patagonia, Perito Moreno Glacier, Southern Annular Mode (SAM), backward trajectory modeling, main weather types
Citation: Grießinger J, Langhamer L, Schneider C, Saß B-L, Steger D, Skvarca P, Braun MH, Meier WJ-H, Srur AM and Hochreuther P (2018) Imprints of Climate Signals in a 204 Year δ18O Tree-Ring Record of Nothofagus pumilio From Perito Moreno Glacier, Southern Patagonia (50°S). Front. Earth Sci. 6:27. doi: 10.3389/feart.2018.00027
Received: 29 January 2018; Accepted: 14 March 2018;
Published: 03 April 2018.
Edited by:
Davide Tiranti, Agenzia Regionale per la Protezione Ambientale (ARPA), ItalyReviewed by:
Bao Yang, Cold and Arid Regions Environmental and Engineering Research Institute (CAS), ChinaLi Wu, Anhui Normal University, China
Copyright © 2018 Grießinger, Langhamer, Schneider, Saß, Steger, Skvarca, Braun, Meier, Srur and Hochreuther. This is an open-access article distributed under the terms of the Creative Commons Attribution License (CC BY). The use, distribution or reproduction in other forums is permitted, provided the original author(s) and the copyright owner are credited and that the original publication in this journal is cited, in accordance with accepted academic practice. No use, distribution or reproduction is permitted which does not comply with these terms.
*Correspondence: Jussi Grießinger, jussi.griessinger@fau.de