Physical Responses of Convective Heavy Rainfall to Future Warming Condition: Case Study of the Hiroshima Event
 Kenshi Hibino
 Izuru Takayabu
 Yasutaka Wakazuki
 Tomomichi Ogata
- 1Institute of Industrial Science, University of Tokyo, Kashiwa, Japan
- 2Atmospheric Environment and Applied Meteorology Research Department, Meteorological Researth Institute, Tsukuba, Japan
- 3College of Science, Ibaraki University, Mito, Japan
- 4Application Laboratory, Japan Agency for Marine-Earth Science and Technology, Yokohama, Japan
An extreme precipitation event happened at Hiroshima in 2014. Over 200 mm of total rainfall was observed on the night of August 19th, which caused floods and many landslides. The rainfall event was estimated to be a rare event happening once in approximately 30 years. The physical response of this event to the change of the future atmospheric condition, which includes a temperature increase on average and convective stability change, is investigated in the present study using a 27-member ensemble experiment and pseudo global warming downscaling method. The experiment is integrated using the Japan Meteorological Research Institute non-hydrostatic regional climate model. A very high-resolution horizontal grid, 500 m, is used to reproduce dense cumulonimbus cloud formation causing heavy rainfall in the model. The future climate condition determined by a higher greenhouse gas concentration is prescribed to the model, in which the surface air temperature globally averaged is 4 K warmer than that in the preindustrial era. The total amounts of precipitation around the Hiroshima area in the future experiments are closer to or slightly lower than in the current experiments in spite of the increase in water vapor due to the atmospheric warming. The effect of the water vapor increase on extreme precipitation is found to be canceled out by the suppression of convection due to the thermal stability enhancement. The fact that future extreme precipitation like the Hiroshima event is not intensified is in contrast to the well-known result that extreme rainfall tends to be intensified in the future. The results in the present study imply that the response of extreme precipitation to global warming differs for each rainfall phenomenon.
1. Introduction
In August 2014, a heavy rainfall event happened around Hiroshima city (34.39°N, 132.46°E), Japan. The total amount of precipitation was observed to be over 200 mm in the northern part of Hiroshima city, and floods and landslides happened due to the intense precipitation, and 75 people were killed by these disasters (Hirota et al., 2016). Although such heavy rainfall events do not happen frequently, they can cause severe disasters. How extreme precipitation changes in the future, particularly influenced by the anthropogenic global warming due to an increase in the concentration of greenhouse gases (GHGs), is of great concern for society.
As the IPCC AR5 (Stocker et al., 2013) reported that the extreme precipitation has intensified in many regions in the world, the assessment of its future change has become more important. There are two types of studies concerning the future change in extreme precipitation: one focusing on statistical or climatological change and one dealing with changes in individual meteorological phenomena, i.e., case studies, which should be distinguished. The latter type of studies is superior to the former type in that it enables us to analyze the actual mechanism with which meteorological phenomena respond to global warming, but is inferior in that any changes of case studies do not necessarily imply the climatological change in similar precipitation events, e.g., no information concerning a change in the frequency of extreme precipitation. The two types of researches should be integrated to overcome the weaknesses of each individual type.
Many studies have been done focusing mainly on the general and statistical characteristics (first type) of future change in extreme precipitation (e.g., Kharin et al., 2013; Ban et al., 2015; Mizuta et al., 2016). Almost all of them concluded that the amount of extreme precipitation has increased, which is consistent with the deduction that more moisture is converted into precipitation in a warmer atmosphere according to the Clausisus Clapeion (C-C) relationship: an increase of approximately 7 % per degree of warming. However, the precipitation amount does not necessarily follow the C-C relation completely (e.g., Prein et al., 2017) since it is affected by other factors, such as circulation pattern changes or moisture availability. In addition, when considering heavy rainfall phenomena in small spatial scales, the poor resolution of current climate models deteriorates the ability to reproduce them and evaluate their strength with high reliability (Wehner et al., 2010; Volosciuk et al., 2015).
There are also various studies focusing on a particular meteorological phenomenon relating heavy rainfall and investigating the effect of future climate change on it (e.g., Pall et al., 2017). Takayabu et al. (2015) examined typhoon Haiyan and showed that its expected strength has been intensified by global warming from pre-industrial period until the current day. A similar approach was applied to heat wave events to elucidate the effect of anthropogenic global warming (e.g., Shiogama et al., 2014).
To investigate the future change of a specified meteorological phenomenon, environmental condition involving the meteorological phenomenon needs to be changed as what is expected in the future. One of the methods is the pseudo global-warming downscaling (PGWD) method (Kimura and Kitoh, 2007; Takayabu et al., 2015), in which the climatological change of temperature is superimposed to the current atmospheric or ocean conditions. The global warming level is usually obtained from general circulation models, e.g., Coupled Model Intercomparison Project Phase 5 (CMIP5) (Stocker et al., 2014), or prescribed with an arbitrary level e.g., 4.0 degree warming from the pre-industrial level (Mizuta et al., 2016).
Atmosphere warming accompanies an increase in the air moisture level providing that the other atmospheric conditions, such as circulation and stratification, are the same as before. The moisture increase does not only increase the total amount of precipitation linearly but also can change the flow field of particular meteorological phenomena, e.g., intensification of tropical cyclones (Takayabu et al., 2015), which suggests the possibility that more moisture from the surrounding areas is provided and converted to rainfall (Kanada et al., 2017). Therefore, in the case of tropical cyclones, the associated precipitation amount is expected to increase over the C-C relation. However, there is a possibility that extreme precipitation derived from other types of meteorological phenomena does not increase so much, i.e., under the C-C relation, or even decreases due to the different physical response to the future atmospheric warming from that of tropical cyclones. Although Utsumi et al. (2016) examined the future changes in three types of meteorological phenomena (tropical cyclones, extratropical cyclones including fronts, and others), their analyses were performed from the global point of view, and thus the rainfall events that are smaller-scale but intense enough to cause disasters have not been fully investigated.
Therefore, the target meteorological event in the present study is the Hiroshima heavy rainfall event explained before. In section 2, a detailed explanation of our ensemble simulation is given. The results of the simulations are shown in section 3. A discussion regarding the effect of future atmospheric environment change (temperature and moisture) on extreme precipitation and the conclusion of the present study are given in section 4.
2. Methodology
First, the extreme precipitation in Hiroshima is simulated in the current climate condition; this experiment is referred to as the current experiment. After checking the performance of the experiments to reproduce the precipitation amount and its spatial pattern, future experiments with warmer environmental conditions are performed using the PGWD method. The precise simulation of the precipitation event is vital for its comparison in the current and future environments.
The numerical model in the present study is the Meteorological Research Institute non-hydrostatic regional climate model (MRI-NHRCM) (Sasaki et al., 2008) in the Japan Meteorological Agency (JMA), and the computational domain is shown in Figure 1. The horizontal grid resolution is 500 m, and there are 50 vertical grids with irregular intervals starting from the surface to 21,801 m. Because of the high resolution, no convection scheme is necessary, and precipitation output is determined through the cloud microphysics scheme by Ikawa et al. (1991), in which mixing ratios of water vapor, cloud water, cloud ice, snow, rain, and graupel are calculated. The simulation period is 15 h: from 1800 Japan Standard Time (JST) on August 19th to 0900 JST on August 20th, 2014, which includes the heaviest rainfall period in the current experiments. The initial and boundary conditions of the model are obtained from the JMA meso-scale analysis data of every 3 h with 5 km horizontal resolution.
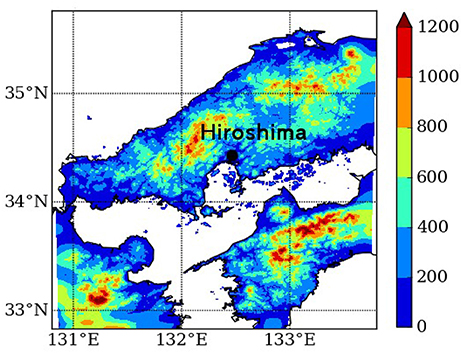
Figure 1. Spatial distribution of altitude in the simulation domain.
The heavy rainfall in the Hiroshima event was caused by a back-building type rain-band (Bluestein and Jain, 1985), which involves consecutively formed cumulonimbus on the windward side. Because the terrain of mountainous region to the north of Hiroshima at which heavy rainfall was observed is complex (Figure 1), small perturbations in terms of environmental conditions can cause large differences in the precipitation amount. In addition, the generation of cumulonimbus is sensitive to the small initial perturbations due to its chaotic nature. Therefore, ensemble simulation is performed to cover such uncertainties and to find robust characteristics regarding the future change in the Hiroshima event.
For the ensemble members for the experiment, we use the ensemble meteorological data in the One-week Ensemble Prediction System (hereinafter called “weekly ensemble”), which is distributed operationally by JMA (Sakai, 2009). The perturbation of the weekly ensemble is calculated based on the singular vector method (Buizza and Palmer, 1995), which has a maximum growth rate for a prescribed optimization time: 48 h for the Northern hemisphere and 24 h for the tropics. We select the weekly ensemble generated at the time 0900 JST on August 19th and used its growing perturbation at the simulation starting time, i.e., 1800 JST of the same day, to construct the initial condition of the simulations. The variables from the weekly ensemble dataset are wind, temperature, pressure, and specific humidity. Because the horizontal resolution of the weekly ensemble is approximately 40 km and much coarser than that of the model in the present study (500 m), only the perturbations of weekly ensemble members, the number of which is 26, are used and superimposed to the initial condition derived form the JMA meso-scale analysis with a higher resolution. The experiment free from the weekly ensemble perturbations is referred to as the control experiment, and thus the total number of ensemble experiment members in the present study is 27.
For the three variables except specific humidity: wind, temperature, and pressure, weekly ensemble perturbation is added to each variable. If specific humidity perturbation is added similarly, the relative humidity exceeds 100% and artificial saturation and cloud formation can happen. To avoid this problem and to reproduce the heavy rainfall event with a small lead time, atmospheric humidity is converted to the modified relative humidity (MRH) (Wakazuki, 2013). The values of humidity in the control experiment and the weekly ensemble perturbations are both converted to MRH and summed, which is re-converted afterward to the specific humidity used in the simulations. Finally, 27 ensemble experiment members with different initial and boundary conditions are performed.
The PGWD method to change the environmental condition in the Hiroshima event to a future one is adopted with the temperature vertical profile change δT. Although there are various types in the PGWD method, horizontally-uniform temperature increase i.e., δT(z) is used to avoid changing the wind patterns according to the thermal wind relation. This PGWD method helps maintain the environment condition in which heavy rainfall tends to occur, and the direct effect of the environmental warming can be analyzed. The value of δT is obtained from huge climate dataset d4PDF (Mizuta et al., 2016), which has order thousands of samples. The d4PDF dataset is constructed by the ensemble experiments of past periods (1951–2011) based on observation and future periods whose climate condition determined by a higher greenhouse gas concentration is prescribed to the model, in which the surface air temperature globally averaged is 4 K warmer than that in the preindustrial time. The difference between future and past experiments averaged in August and over the computational region in the present study is extracted as the future change δT and averaged over the whole d4PDF simulation years and over all d4PDF ensemble members. The red line in Figure 2A shows the vertical profile of δT and is added to the current temperature on whole model grids to change the current environment to a future one. In addition, the future change in the sea surface temperature and land surface temperature is homogeneous horizontally, the value of which is adopted from the lowest layer of δT(z) i.e., 4 K to avoid the temperature discontinuity between sea or land surface and atmosphere in the future experiments.
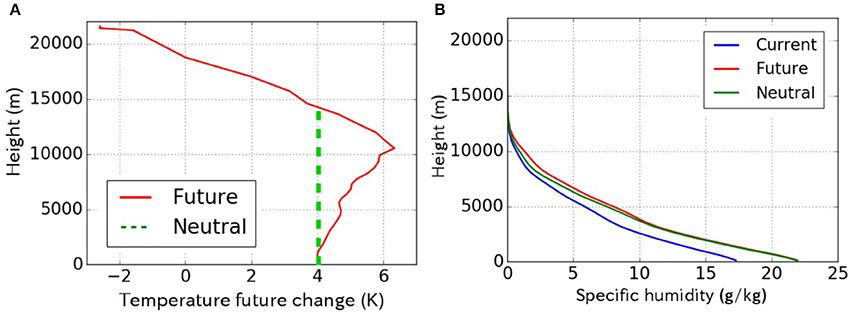
Figure 2. (A) Future change (red line) of temperature vertical profile δT (K) obtained from d4PDF dataset, and temperature profile for the neutral experiments (green dashed line). (B) Vertical profiles of specific humidity (g/kg) in current (blue), future (red), and neutral (green) experiments, which are obtained by averaging the specific humidity over the whole computation domain, simulation periods, and ensemble experiment members.
The relative humidity in the future is the same as the current conditions to simulate the future moisture increase in the atmosphere according to the degree of the warming. Figure 2B shows the vertical profiles of specific humidity in the (blue) current and (red) future experiments, which are an averaged over the whole computational domain, simulation period, and ensemble members in our experiments. Future environment humidity is largely increased due to the atmospheric warming, although the humidity is concentrated in the troposphere, i.e., below 10,000 m.
The total precipitation accumulated in 6 h from 0000 JST to 0600 JST on August 20th and is area-averaged indicated by the red box in Figure 3B is calculated as an indicator to represent the rainfall intensity of the Hiroshima event. Hereafter, the total precipitation, analysis period, and analysis domain are referred to as AP6h, the target period, and the target domain, respectively. The target period includes the most intense precipitation timing (Figure 4), and the domain covers almost all fluctuations of heavy rainfall location in all ensemble experiment members (Figures S1–S3). The change in AP6h between current and future climates is also examined.
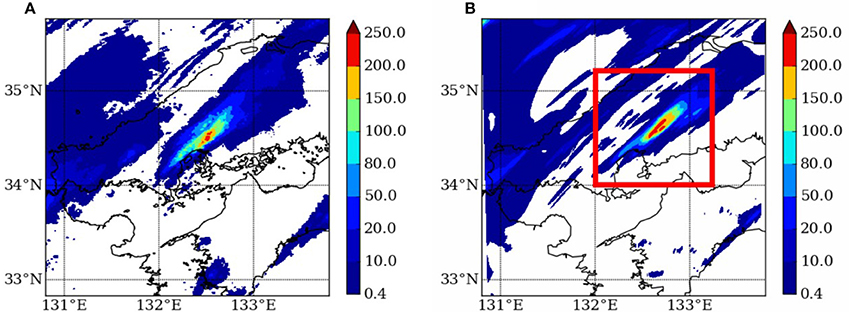
Figure 3. Geographical distribution of the total precipitation (mm) from 0000 JST to 0006 JST on August 20th obtained from (A) the Radar-AMeDAS observation data and (B) the current control experiment. This figure domain is identical to the simulation domain, and the red square region is the target domain to calculate the value of AP6h.
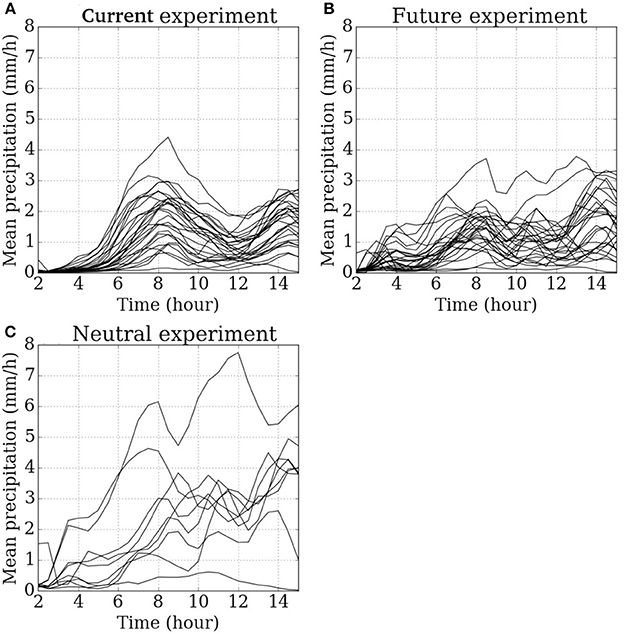
Figure 4. Time series of the precipitation amount averaged in the target domain. The values are hourly cumulative precipitation until that time. Each line represents the result of each ensemble member in (A) the current experiments, (B) the future experiments, and (C) the neutral experiments. The simulation period is 15 h from 1800 Japan Standard Time (JST) on August 19th to 0900 JST on August 20th.
3. Results
In the observed precipitation event in Hiroshima, total precipitation over 200 mm through this event was observed in the northern part of the city. Figure 3A shows the spatial pattern of Radar-AMeDAS precipitation, which is a combined observation product based on the Automated Meteorological Data Acquisition Systems (AMeDAS) rain gauge data and radar precipitation (Makihara et al., 1996). This intense precipitation is reproduced in the current control experiment, as shown in Figure 3B; the results except for the control case are provided in Figure S1 for current experiments and Figure S2 for future experiments. Comparing the observation and model results, the high reproducibility of our model is revealed; their spatial patterns and the intensity of precipitation are quite similar, although the peak of precipitation in the model is located in a slightly north-eastward position.
Next, we examined the moisture inflow into the heavy rainfall region around Hiroshima. According to the report by MRI in Japan (MRI, 2014), one of the significant factors causing this heavy rainfall was the large southerly moisture inflow near the ground to the region around Hiroshima. The large amount of moisture over the ocean was transported to the mountainous region to the north of Hiroshima and lifted to form the cumulonimbus clouds and the rain-band. This moisture inflow is also represented in the current control experiment as shown by the moisture flux intensity at 975 hPa in the beginning of the target period, i.e., 0000 JST on 20th (Figure 5A). Leaving the vicinity of the ground, south-easterly wind blows at the lower troposphere, the height of 850 hPa, (Figure 5B), and the rain-band formed is extended in the north-eastward direction along the wind at this level, which is consistent with the explanation by MRI (2014).
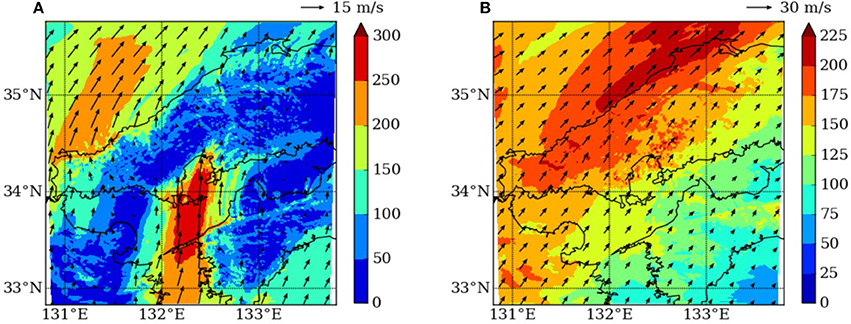
Figure 5. Geographical distribution of the moisture flux intensity (shaded) and wind field (arrows) (A) near the ground (975 hPa) and (B) at the lower troposphere (850 hPa) obtained from the current control experiment.
With these comparisons between the current control experiment and observation in terms of total precipitation amount, spatial pattern of heavy rainfall, and moisture inflow, we can conclude that the heavy precipitation event at Hiroshima was reproduced realistically by the model. Because similar results are obtained for the other ensemble members (Figures S1, S4, and S5), the mechanism causing the heavy rainfall can be suitable for most of the ensemble members, but the small environmental differences among the members determine rainfall severity. Note that the Hiroshima event has an aspect of orographic precipitation since moist air over the ocean is transported onto land and the mountainous region around Hiroshima, generating heavy rainfall.
From now on in this paper, we show the values of AP6h to investigate the intensity of extreme precipitation in the Hiroshima event (Figure 6). The values of AP6h in current and future experiments are closely correlated to each other ranging from very small precipitation (nearly 0 mm/6 h) to large precipitation (approximately 20 mm/6 h). The intensity of the heavy rainfall events is found to be mainly determined by the difference of ensemble members or large-scale flow pattern prescribed by the weekly ensemble perturbation and to have large prediction uncertainty or spread. The value of the Radar-AMeDAS observation is 12.68, as shown in Figure 6, which is included in the uncertainty of the current climate experiments.
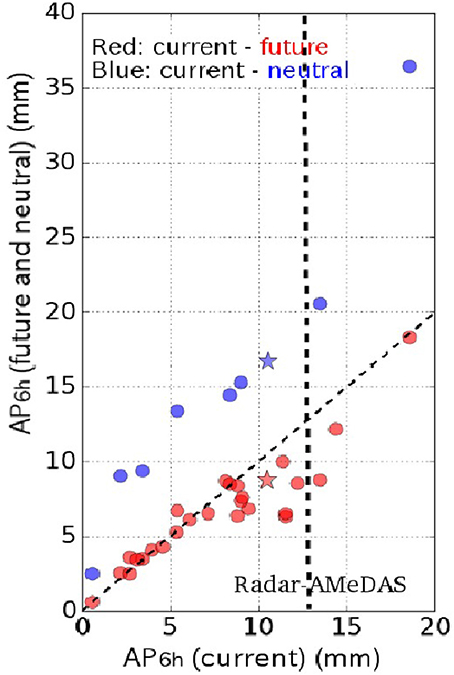
Figure 6. Scatter diagram of the values of AP6h showing the relation between the current experiments (x-axis) and future (y-axis; red points) and neutral (y-axis; blue points) experiments. The results from the control experiments are shown as stars. The black inclined dashed line is a line of y = x, the points on which show that the future or neutral experiments yield the same amount of precipitation intensity as that of current experiments. The value of AP6h of Radar-AMeDAS precipitation is 12.68 and shown by a black vertical line.
Comparing the current and future values of AP6h in Figure 6, most of the ensemble member results lie on the diagonal line showing AP6h(future) = AP6h(current), which implies that the future rainfall of the Hiroshima event is not intensified. This result looks contradictory to the fact that humidity in the future atmosphere has increased, as shown in Figure 2B. If the whole atmospheric motion including both horizontal and vertical velocities is identical between the current and future experiments, the resulting precipitation should be larger in the future model by the amount of additional water vapor due to the atmospheric warming. Seeing the time series of spatially-averaged precipitation in the target domain (Figure 4), clear intensification of precipitation in the future is not obtained, although the time variations are somewhat different between the current and future experiments; rainfall in the future experiments (Figure 4B) initiates earlier, and shows no clear peak time around t = 8, unlike the current experiments (Figure 4A).
To investigate the reason that the future precipitation in the Hiroshima event does not increase in a moister atmosphere, we examine the stabilizing effect of future temperature change profile δT in the troposphere (see Figure 2A). The value of δT increases with height corresponding to the decrease in the temperature lapse rate (Tett et al., 1996), which is based on the fact that the moist adiabatic lapse rate decreases with atmosphere warming. The characteristic regarding vertical temperature structure was found to reduce the non-extreme precipitation in mid-latitudes (Kröner et al., 2016). To evaluate the depression effect on extreme precipitation like the Hiroshima event, we performed additional ensemble experiments that we call “neutral experiments.” In the neutral experiments, the profile of future temperature increase δT is changed from the actual future one; the new profile is shown by the green dashed line in Figure 2A as well as the profile of the specific humidity by the green line in Figure 2B. The temperature change over a height of approximately 14,000 m and the other model settings are the same as those of future experiments. Because the profile of the neutral experiments has a neutral effect on the convective instability of the troposphere, the comparison between the results of future and neutral experiments is expected to evaluate the stabilizing effect of δT in the future. We perform 9 member experiments due to the computational limit, which covers as much uncertainty as possible in terms of the rainfall intensity AP6h, shown by the blue points in Figure 6.
All of the values of AP6h in the neutral experiments are increased from those of the current and future experiments when comparing them in terms of each ensemble member; the intensification of rainfall in the neutral experiments is also revealed with its time series result (Figure 4C). Because the difference in the environmental conditions between the future and neutral experiments is only the temperature warming profile, the large decrease in precipitation in the future experiments compared with the neutral experiments is caused by the effect of thermal stability enhancement.
To analyze the future and neutral experiments' differences in greater detail, the strength of vertical or convective motion in the heavy rainfall region is examined. Figure 7 is a scatter diagram of the maximum vertical velocity at 500 hPa plains (x-axis) of the target domain and the target period relating to the values of AP6h (y-axis). Before extracting the maximum value, a running mean over 9 x 9 grids of vertical velocity is performed to smooth out the very small-scale noisy pattern. Such maximum velocity values precisely represent the convection strength, as its correlation to precipitation intensity AP6h is actually higher than that without the smoothing operation; the correlation coefficient is 0.742 in Figure 7.
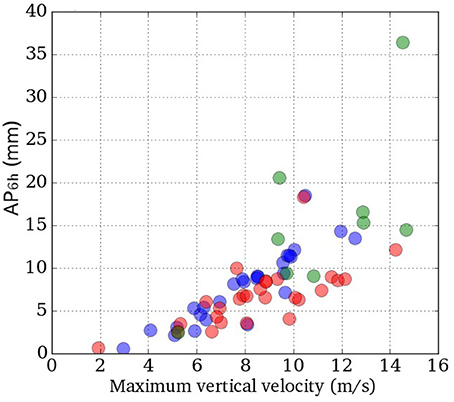
Figure 7. Scatter diagram showing the relation between the extreme precipitation index in the present study, AP6h and the maximum vertical velocity at a height of 500 hPa, which are obtained for the target domain (red square region in Figure 3B) and the target period (from 0000 JST to 0600 JST on August 20th). Blue, red, and green points represent the results of current, future, and neutral experiments, respectively.
At the middle troposphere heights of 500 hPa, current and future results are scattered in close proximity, while the results of neutral experiments are separated from those of the current and future experiments. The statistical significance of the results is verified by the Mann–Whitney U-test (Wilks, 2011): 1% level significance between the results of the current and neutral experiments, but the significance even for the level of 10 % cannot be obtained between the results of current and future experiments. Thus, the convection in the current and future experiments has approximately the same strength and yields a closer amount of precipitation as a result. On the other hand, the neutral experiments show strong convection and large precipitation, which implies that the vertical motion is accelerated due to the condensation heating of the increased moisture in the atmosphere.
In the future experiments, the convective clouds in their early stage of growing yield the larger precipitation compared with the current experiments due to the large amount of moisture in the atmosphere, which is shown by an earlier increase in the AP6h values (Figure 4B) and spatial distribution of precipitation in the early period, e.g., t = 4 (Figures S6, S7). However, the vertical acceleration associated with the condensation heating is suppressed by the stabilizing effect of the change in the temperature profile in the troposphere. As a result, the convection and precipitation in the future experiments are not intensified and are thus closer to the current experiments.
4. Discussion and Conclusion
In this study, we examined the future change in the heavy rainfall event happened at Hiroshima by performing numerical experiments with the pseudo global warming downscaling method. There have been no previous studies using the ensemble experiment with very-high resolution, such as 500 m to investigate the future change in extreme precipitation event. The very-high resolution simulation in the present study demonstrates the high reproducibility of the heavy convective rainfall, and robust results regarding the future change in extreme precipitation are obtained thanks to the ensemble experiment. The main conclusion in the present study is that the extreme precipitation in the event is not increased even in the 4 K warmer environmental condition accompanying larger amounts of water vapor. This result looks contradictory to the many previous studies showing the intensification of extreme precipitation in the future (e.g., Kharin et al., 2013; Ban et al., 2015; Mizuta et al., 2016). Our main conclusion is derived from the cancellation between the destabilizing effect of a water vapor increase and the stabilizing effect of a temperature lapse rate decrease in future environmental conditions.
Kröner et al. (2016) showed that a future decrease in the temperature lapse rate reduces the non-extreme precipitation in Europe and Northern Africa. The present study shows that the similar precipitation suppression is effective for extreme precipitation to the extent that it can offset the thermodynamic aspect of a moisture increase. Because the decrease in the temperature lapse rate or the stabilizing characteristic is projected to be dominant from tropics to mid-latitudes in the future (IPCC AR5, Stocker et al., 2013), the suppression of extreme precipitation we found is expected to prevail in these regions.
In the Hiroshima event, thunderstorms with continuously generated cumulonimbus caused the heavy rainfall (MRI, 2014). The fact that this rainfall system is not intensified is in marked contrast to the previous studies focusing on the effect of global warming on tropical cyclones (e.g., Kanada et al., 2017), which revealed that tropical cyclones and associated rainfall intensify in the future. This difference strongly suggests that the physical responses of meteorological phenomena causing heavy rainfall to a warmer climatic condition differ depending on their types and physical mechanisms. One of the hypotheses that tropical cyclones can be strengthened against the stabilization effect of temperature profile change but the rainfall of the Hiroshima event cannot is that tropical cyclones have a strong non-linear mechanism in which increased water vapor due to atmosphere warming enables them to gather more water vapor from the surrounding atmosphere. This characteristic of tropical cyclones amplifies the effect of a moisture increase in terms of convective instability and enables them to grow by overcoming the stabilizing effect of stratification. On the other hand, the extreme precipitation event at Hiroshima bearing the aspect of orographic precipitation does not have such a strong nonlinear effect, in other words, the thunderstorms and cumulonimbus systems in this event only perturb the flow field and do not change the environmental condition determining the severity of rainfall due to their relatively small spatial scale of the phenomena.
The present study cannot provide any knowledge concerning the future change in frequency of appearance of thunderstorms causing extreme precipitation because of the limitation of a case study. However, the possibility that these thunderstorm events cannot be intensified even in the warmer and wetter conditions due to the temperature lapse rate change in the troposphere leads to the further studies combined with climatological or statistical studies focusing on the frequency of extreme precipitation.
Author Contributions
KH played a major role for the present study, including model simulation, analyses, and writing the paper. IT proposed the analysis of future change of the Hiroshima heavy rainfall event using pseudo global-warming downscaling method and coordinated the whole study. YW introduced the concept of “modified relative humidity” for our experiments and also determined the model setting and model initial condition with KH. TO gave the perspective based on interactions between large and small scale meteorological phenomena. He also made an analysis of synoptic-scale flow field including our simulation domain, the results of which are not used directly in the paper but affected our research.
Conflict of Interest Statement
The authors declare that the research was conducted in the absence of any commercial or financial relationships that could be construed as a potential conflict of interest.
Acknowledgments
This research was supported by SOUSEI and TOUGOU Programs of Ministry of Education, Culture, Sports, Science, and Technology of Japan.
Supplementary Material
The Supplementary Material for this article can be found online at: https://www.frontiersin.org/articles/10.3389/feart.2018.00035/full#supplementary-material
References
Ban, N., Schmidli, J., and Schär, C. (2015). Heavy precipitation in a changing climate: does short-term summer precipitation increase faster? Geophys. Res. Lett. 42, 1165–1172. doi: 10.1002/2014GL062588
Bluestein, H. B., and Jain, M. H. (1985). Formation of mesoscale lines of precipitation: severe squall lines in Oklahoma during the spring. J. Atmos. Sci. 42, 1711–1732.
Buizza, R., and Palmer, T. (1995). The singular-vector structure of the atmospheric global circulation. J. Atmos. Sci. 52, 1434–1456.
Hirota, N., Takayabu, Y. N., Kato, M., and Arakane, S. (2016). Roles of an atmospheric river and a cutoff low in the extreme precipitation event in Hiroshima on 19 August 2014. Month. Weather Rev. 144, 1145–1160. doi: 10.1175/MWR-D-15-0299.1
Ikawa, M., Mizuno, H., Matsuo, T., Murakami, M., Yamada, Y., and Saito, K. (1991). Numerical modeling of the convective snow cloud over the sea of japan. J. Meteorol. Soc. Jpn. Ser. II 69, 641–667.
Kanada, S., Takemi, T., Kato, M., Yamasaki, S., Fudeyasu, H., Tsuboki, K., et al. (2017). A multimodel intercomparison of an intense typhoon in future, warmer climates by four 5-km-mesh models. J. Clim. 30, 6017–6036. doi: 10.1175/JCLI-D-16-0715.1
Kharin, V. V., Zwiers, F., Zhang, X., and Wehner, M. (2013). Changes in temperature and precipitation extremes in the CMIP5 ensemble. Clim. Change 119, 345–357. doi: 10.1007/s10584-013-0705-8
Kimura, F., and Kitoh, A. (2007). Downscaling by Pseudo Global Warming Method. The Final Report of ICCAP, 4346. Research Institute for Humanity and Nature (RIHN), Kyoto.
Kröner, N., Kotlarski, S., Fischer, E., Lüthi, D., Zubler, E., and Schär, C. (2016). Separating climate change signals into thermodynamic, lapse-rate and circulation effects: theory and application to the european summer climate. Clim. Dyn. 48, 3425–3440. doi: 10.1007/s00382-016-3276-3
Makihara, Y., Uekiyo, N., Tabata, A., and Yoshiyuki, A. (1996). Accuracy of radar-AMeDAS precipitation. IEICE Trans. Commun. 79, 751–762.
Mizuta, R., Murata, A., Ishii, M., Shiogama, H., Hibino, K., Mori, N., et al. (2016). Over 5000 years of ensemble future climate simulations by 60 km global and 20 km regional atmospheric models. Bull. Am. Meteorol. Soc. 98, 1383–1398. doi: 10.1175/BAMS-D-16-0099.1
MRI (2014). The Generation Mechanism of Extreme Precipitation Event at Hiroshima in 20th August, 2014 - Rainband Stagnation and Accumulation of Water Vapor in Bungo Channel (in Japanese). Press release, 26. Available online at: http://www.mri-jma.go.jp/Topics/H26/260909/Press_140820hiroshima_heavyrainfall.pdf
Pall, P., Patricola, C. M., Wehner, M. F., Stone, D. A., Paciorek, C. J., and Collins, W. D. (2017). Diagnosing conditional anthropogenic contributions to heavy colorado rainfall in september 2013. Weather Clim. Extrem. 17, 1–6. doi: 10.1016/j.wace.2017.03.004
Prein, A. F., Rasmussen, R. M., Ikeda, K., Liu, C., Clark, M. P., and Holland, G. J. (2017). The future intensification of hourly precipitation extremes. Nat. Clim. Change 7, 48–52. doi: 10.1038/nclimate3168
Sakai, R., Kyouda, M., Yamaguchi, M., and Kadowaki, T. (2008). A New Operational One-Week Ensemble Prediction System at Japan Meteorological Agency. CAS/JSC WGNE research activities in atmospheric and oceanic modelling, 38.
Sasaki, H., Kurihara, K., Takayabu, I., and Uchiyama, T. (2008). Preliminary experiments of reproducing the present climate using the non-hydrostatic regional climate model. SOLA 4, 25–28. doi: 10.2151/sola.2008-007
Shiogama, H., Watanabe, M., Imada, Y., Mori, M., Kamae, Y., Ishii, M., et al. (2014). Attribution of the June-July 2013 heat wave in the southwestern United States. SOLA 10, 122–126. doi: 10.2151/sola.2014-025
Stocker, T., Qin, D., Plattner, G., Tignor, M., Allen, S., Boschung, J., et al. (2013). IPCC, 2013: Climate Change 2013: The Physical Science Basis. Contribution of Working Group I to the Fifth Assessment Report of the Intergovernmental Panel on Climate Change.
Stocker, T. F., Qin, D., Plattner, G. K., Tignor, M., Allen, S. K., Boschung, J., et al. (2014). Climate Change 2013: The Physical Science Basis. Cambridge, UK; New York, NY: Cambridge University Press.
Takayabu, I., Hibino, K., Sasaki, H., Shiogama, H., Mori, N., Shibutani, Y., et al. (2015). Climate change effects on the worst-case storm surge: a case study of Typhoon Haiyan. Environ. Res. Lett. 10:064011. doi: 10.1088/1748-9326/10/8/089502
Tett, S. F., Mitchell, J. F., Parker, D. E., and Allen, M. R. (1996). Human influence on the atmospheric vertical temperature structure: detection and observations. Science 274:1170.
Utsumi, N., Kim, H., Kanae, S., and Oki, T. (2016). Which weather systems are projected to cause future changes in mean and extreme precipitation in cmip5 simulations? J. Geophys. Res. 121, 10,522–10,537 doi: 10.1002/2016JD024939
Volosciuk, C., Maraun, D., Semenov, V. A., and Park, W. (2015). Extreme precipitation in an atmosphere general circulation model: impact of horizontal and vertical model resolutions. J. Clim. 28, 1184–1205. doi: 10.1175/JCLI-D-14-00337.1
Wakazuki, Y. (2013). Modified relative humidity based on the Johnson's SB distribution function. SOLA 9, 111–114. doi: 10.2151/sola.2013-025
Wehner, M. F., Smith, R. L., Bala, G., and Duffy, P. (2010). The effect of horizontal resolution on simulation of very extreme US precipitation events in a global atmosphere model. Clim. Dyn. 34, 241–247. doi: 10.1007/s00382-009-0656-y
Keywords: extreme precipitation, future change, ensemble experiment, pseudo global-warming downscaling method, convective instability, modified relative humidity, temperature lapse rate
Citation: Hibino K, Takayabu I, Wakazuki Y and Ogata T (2018) Physical Responses of Convective Heavy Rainfall to Future Warming Condition: Case Study of the Hiroshima Event. Front. Earth Sci. 6:35. doi: 10.3389/feart.2018.00035
Received: 04 January 2018; Accepted: 03 April 2018;
Published: 19 April 2018.
Edited by:
Jing-Jia Luo, Bureau of Meteorology, AustraliaReviewed by:
Rosmeri Porfirio Da Rocha, Universidade de São Paulo, BrazilDaoyi Gong, Beijing Normal University, China
Copyright © 2018 Hibino, Takayabu, Wakazuki and Ogata. This is an open-access article distributed under the terms of the Creative Commons Attribution License (CC BY). The use, distribution or reproduction in other forums is permitted, provided the original author(s) and the copyright owner are credited and that the original publication in this journal is cited, in accordance with accepted academic practice. No use, distribution or reproduction is permitted which does not comply with these terms.
*Correspondence: Kenshi Hibino, khibino@iis.u-tokyo.ac.jp