An Overview of the Dynamics of the Volcanic Paroxysmal Explosive Activity, and Related Seismicity, at Andesitic and Dacitic Volcanoes (1960–2010)
 Vyacheslav M. Zobin
- Centro Universitario de Estudios Vulcanológicos, Universidad de Colima, Colima, Mexico
Understanding volcanic paroxysmal explosive activity requires the knowledge of many associated processes. An overview of the dynamics of paroxysmal explosive eruptions (PEEs) at andesitic and dacitic volcanoes occurring between 1960 and 2010 is presented here. This overview is based mainly on a description of the pre-eruptive and eruptive events, as well as on the related seismic measurements. The selected eruptions are grouped according to their Volcanic Explosivity Index (VEI). A first group includes three eruptions of VEI 5-6 (Mount St. Helens, 1980; El Chichón, 1982; Pinatubo, 1991) and a second group includes three eruptions of VEI 3 (Usu volcano, 1977; Soufriere Hills Volcano (SHV), 1996, and Volcán de Colima, 2005). The PEEs of the first group have similarity in their developments that allows to propose a 5-stage scheme of their dynamics process. Between these stages are: long (more than 120 years) period of quiescence (stage 1), preliminary volcano-tectonic (VT) earthquake swarm (stage 2), period of phreatic explosions (stage 3) and then, PEE appearance (stage 4). It was shown also that the PEEs of this group during their Plinian stage “triggered” the earthquake sequences beneath the volcanic structures with the maximum magnitude of earthquakes proportional to the volume of ejecta of PEEs (stage 5). Three discussed PEEs of the second group with lower VEI developed in more individual styles, not keeping within any general scheme. Among these, one PEE (SHV) may be considered as partly following in development to the PEEs of the first group, having stages 1, 3, and 4. The PEEs of Usu volcano and of Volcán de Colima had no preliminary long-term stages of quiescence. The PEE at Usu volcano came just at the end of the preceding short swarm of VT earthquakes. At Volcán de Colima, no preceding swarm of VT occurred. This absence of any regularity in development of lower VEI eruptions may refer, among other reasons, to different conditions of opening of the magmatic conduit during these eruptions.
Introduction
Understanding volcanic paroxysmal explosive activity requires the knowledge of many associated processes. Paroxysmal volcanic eruption is defined in “Geological dictionary” (Paffengoltz, 1978) as “particularly violent eruption of the volcano, which is the most dangerous and tense stage of this eruptive cycle, at which the whole cavity of the crater is opened”. An overview on the dynamics of six paroxysmal explosive eruptions (PEEs) at andesitic and dacitic volcanoes, occurring between 1960 and 2010, is presented here. The selected eruptions are grouped according to their Volcanic Explosivity Index (VEI, Newhall and Self, 1982).
The paroxysmal explosive eruption (PEE) of the first group with VEI 5-6 (height of plume more than 25 km; volume of ejecta 109-1011 m3) can significantly destroy the volcano and affect the atmosphere, and the environment in the overall. For example, as a result of the paroxysmal 27 August 1883 explosion of Krakatau volcano, the northern two-thirds of the Krakatau Island, which is situated between Java and Sumatra Islands (Figure 1), collapsed beneath the sea, generating series of devasting pyroclastic flows, which traveled for the runout distances up to 40 km across the Sunda Strait, and immense tsunamis that ravaged adjacent coastlines. The explosions and tsunamis killed 36,417 persons, devastating 165 villages. The ash cloud rose 60 km above the volcano. Millions of tons of dust were hurled into the atmosphere and stratosphere around the world, for many years producing exotic colors in the sky, halos around the sun and moon, and a spectacular array of anomalous sunsets and sunrises. Acoustic waves from this explosion had traveled around the Earth seven times (Winchester, 2003; http://volcano.si.edu/volcano.cfm?vn=262000).
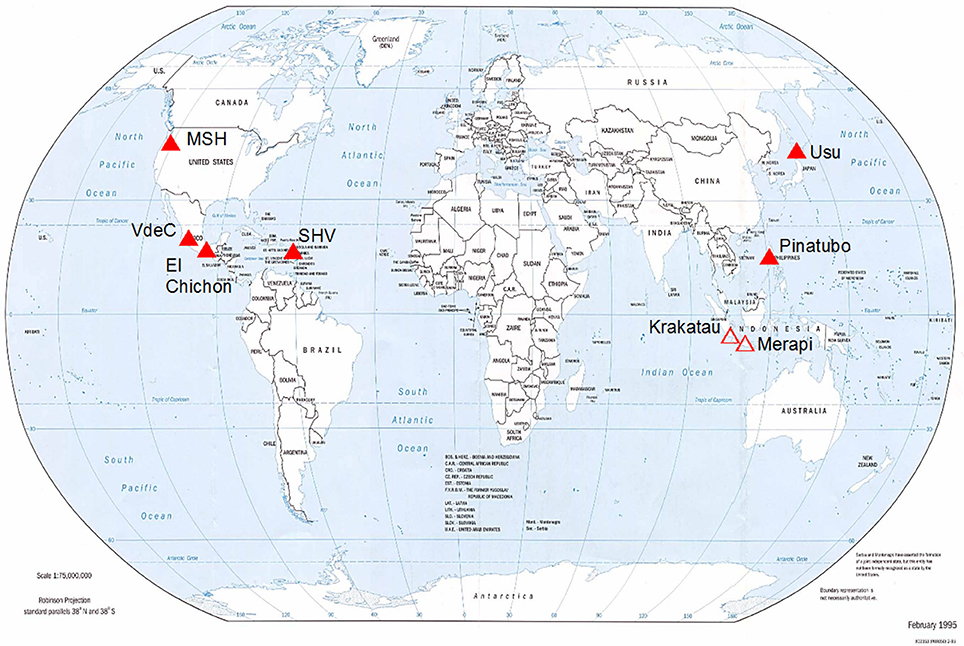
Figure 1. Index map with positions of volcanoes discussed in the article. Open triangles, volcanoes mentioned in Introduction; filled triangles, volcanoes discussed in the article. MSH, Mount St. Helens volcano; VdeC, Volcán de Colima; SHV, Soufriere Hills volcano. The geographical map is taken from the site http://www.lib.utexas.edu/maps/world.html.
The paroxysmal explosive eruption of the second group with VEI 3-4 (height of plume from 3 to 25 km; volume of ejecta 107-109 m3) may destroy the summit of volcano, or lava dome in the crater, or crater sectors by Vulcanian explosions, emplacing pyroclastic current densities (PCDs) that may affect the nearest settlements and threaten aviation. The 4–5 November 2010 PEEs at Merapi volcano, Java Island (Figure 1), represent an example of this type. The explosion sequence destroyed the large lava dome, and the summit crater had enlarged to a diameter of 300–400 m. Ash column that ascended to 17 km altitude was produced emplacing a pyroclastic flow that traveled for runout distance of about 16 km. The PCDs and related surges of 4–5 November destroyed numerous villages over broad area of the upper slopes of the volcano. More than 300,000 habitants were evacuated; 386 deaths were recorded. Residents in the towns up to 240 km away reported that “heavy gray ash” blanketed trees, cars, and roads (Surono et al., 2012).
In this review article, we present the case studies of PEEs of andesitic and dacitic volcanoes that occurred during 50 years, from 1960 to 2010, to show the development and effects of PEEs and to highlight any regularity in their dynamics during the eruptive cycles.
Here we selected six PEEs of andesitic and dacitic volcanoes with VEI 3-6 (http://volcano.si.edu/) that occurred during this period. The first group of PEEs includes three VEI 5-6 paroxysmal explosive events of andesitic and dacitic type recorded during the period of study (Mount St. Helens, 1980; El Chichón, 1982; and Pinatubo, 1991). The forth event that occurred during this period, the VEI 5 1963 Agung eruption, had no detailed observations for discussion. Three events of the second group (VEI 3) are selected from the long list of eruptions as the only having the detailed observations and seismic monitoring comparable with the information obtained for the three events of the first group (Usu, 1977; Soufriere Hills volcano, 1996; and Volcán de Colima, 2005).
The case descriptions are represented by two groups of information. The Research Topic of this Special Issue is concerned with the Exploring Volcanic Paroxysmal Explosive Activity from Magma Source to Ground and Atmosphere. According to this definition of the topic, “from magma source to ground and atmosphere,” the first group of information includes the geological, visual, and satellite observations.
For a long time, including the period of our reviewed eruptions, the only tool that allowed reconstructing in details the dynamics of eruptions was seismic monitoring of the volcanoes. So we discuss the seismic information within the second group of information. We use the catalogs of seismic events recorded during the eruptive cycles of selected volcanoes together with the descriptions of these events to reconstruct the main stages in the development of their paroxysmal eruptive activity. Earthquake location catalogs are not an exact representation of the true earthquake locations. The most important source of systematic errors in earthquake locations is the inherent dependence of earthquake locations on the assumed seismic velocity structure of the Earth's crust, the number of seismic stations and configuration of the seismic network. Within this article, we consider the accuracy of earthquake locations by the local seismic networks around volcanoes as ±1-3 km for epicenters and ± 2–4 km for hypocenters.
The magnitudes of earthquakes used in the article were taken from the original catalogs.
Dynamics of Paroxysmal Explosive Eruptions of the First Group (VEI 5-6)
In this section, three paroxysmal explosive eruptions of the first group (VEI 5-6) at volcanoes Mount St. Helens, El Chichon, and Pinatubo, seismically monitored during eruptive activity, are discussed. The main data about these eruptions are collected in Table 1.
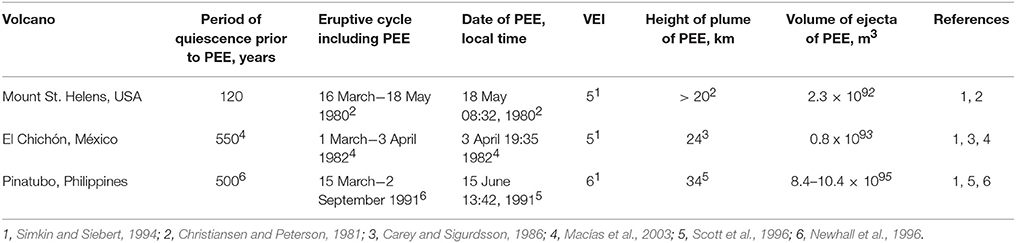
Table 1. List of paroxysmal explosive eruptions (PEEs) of the first group (VEI 5-6).
Mount St. Helens, Cascades, USA, 1980
Mount St. Helens (MSH) is a stratovolcano of 2,950 m of height. It is situated within the Cascade Range in the state of Washington, U.S.A. The eruptive history of MSH began about 40,000 years ago with dacitic volcanism. The products of eruptive activity during the past 2,500 years were represented mainly by dacite-andesite-dacites. The volcano had been apparently dormant since 1857 (Mullineaux and Crandell, 1981).
Paroxysmal Eruption of 18 May 1980, Its Prelude and Its Effects
The eruption cycle of re-awakening of Mt. St. Helens volcano, that included the paroxysmal explosive eruption of 18 May 1980, began on 16 March 1980 with a preliminary swarm of volcano-tectonic earthquakes (Figure 2). The first phreatic eruption from its summit crater was observed on March 27, and was followed then by a sequence of small phreatic explosive eruptions up to the climactic eruption on the morning of 18 May (Mullineaux and Crandell, 1981).
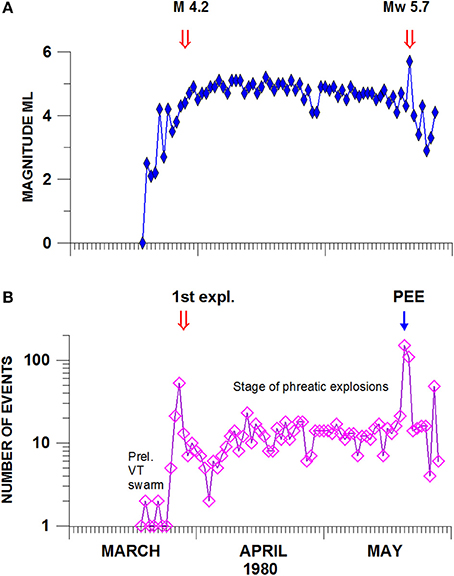
Figure 2. Variations in the daily maximum magnitude (A) and the number of earthquakes (B) located during the March-May 1980 seismo-volcanic activity at Mount St.Helens (MSH). The double and single arrows show eruptive and seismic events. The preliminary volcano-tectonic (VT) earthquake swarm and a stage of phreatic explosions are indicated. Data from the Pacific Northwest Seismic Network (PNSN) catalog.
According to a series of photos taken during the first minutes of the eruption (Voight, 1981), the eruption began with a large-scale collapse of the volcanic edifice which was followed by a directed blast eruption. The northward-directed lateral blast of the bulging north flank of the volcano erupted about 2 km3 of cold and juvenile material and devastated an area of nearly 600 km2. These events triggered a 9-hr magmatic eruption that drove a vertical Plinian column more than 20 km high. A new crater, with an area of 1.5 × 3.0 km2 and of depth of about 500 m, formed in the northern flank and summit of the volcano. The height of the volcano was reduced by about 400 m (Christiansen and Peterson, 1981).
The local effects of the 18 May eruption were observed within the 600-km2 devastated area. Fifty-seven people were killed and missing. Autopsies showed that most of the people killed in the eruption likely died from asphyxiation after inhaling hot ash (Bernstein et al., 1986). Civil infrastructures such as highways, railways, airports bridges, buildings, etc., immediately north of the volcano were almost completely destroyed by the lateral blast and debris avalanche (Schuster, 1981).
The 18 May eruption sent large amounts of dust and volcanic ash into the atmosphere. The plume spread quickly to the east, bringing darkness, and reduced visibility for the northern states of the USA (Robock, 1982). The dust cloud produced cooling of surface air temperatures during the daytime and warming at night. However, the amount of sulfur injected into the stratosphere was low, and thus had no impact on climate (Robock, 1981).
Seismic History of the Mt. St. Helens's PEE
Figure 2 shows temporal variations in daily number of volcano-tectonic seismic events, recorded by the regional Pacific Northwest Seismic Network (PNSN, https://pnsn.org/pnsn-data-products/earthquake-catalogs), and their maximum magnitudes during two stages of activity: pre-eruptive and before the great 18 May PEE. The 1980 swarm of volcano-tectonic shallow earthquakes began on 16 March with small events; the first significant ML 4.2 event was recorded beneath Mount St. Helens on 20 March. The number and magnitude of earthquakes sharply increased starting 25 March with peak number on 27 March, when the first phreatic explosion occurred. After the beginning of the eruption, the number of earthquakes gradually decreased during one month; then their number was more or less stable up to 18 May. The magnitudes of volcano-tectonic earthquakes of this period were rather high; seven April earthquakes were in the range of ML between 5.0 and 5.2. During period from 1 to 16 May, the maximum magnitudes of earthquakes decreased, six of them were in the range of ML between 4.3 and 4.7.
The pre-eruptive 93 earthquakes, occurring before the 27 March explosions, were located within the area of about 10 × 20 km2 along the NW-SE structure, including MSH in its NW part (Figure 3A). These seismic events formed two clusters: a shallow one, at the depth range of 0 to 5 km, and a deep one, at the depth range from 18 to 25 km (Figure 3B). During the active period, from 27 March and until the PEE of 18 May, totally 627 located earthquakes occurred around the volcanic edifice, mainly within the depth range from 0 to 10 km; the deeper pre-eruption cluster disappeared.
Figure 3. Epicenters (A) and hypocenters (B) of earthquakes located during March to May 1980 at MSH. The earthquakes located before 27 March, when the first explosion occurred, are shown by circles (1); the earthquakes located from 27 March until the 18 May PEE are shown by crosses (2); the sequence of the magnitude 4.0–4.5 earthquakes that occurred during last 4 h of the Plinian stage is shown by diamonds (3). The location of the ML 5.7 earthquake of 18 May is shown with a star (4). The position of volcano MSH is shown by the 1,500 m contour. Data from the PNSN catalog.
The largest earthquake with ML 5.7 occurred on 18 May at 08:32:11.41 on the background of lower-level seismic activity, just before the great directed blast of the volcano that initiated at 08:32:21, about 10 s after the earthquake-trigger (Voight, 1981). This seismic event was located at the depth of 2.8 km beneath the NW flank of MSH (Figure 3). Study of its P-wave focal mechanism (Zobin, 1992) and its comparison with the CMT solution (Dziewonski et al., 1988) showed that this event represented initial left-lateral strike-slip along the NE-SW oriented fault that in a few seconds was transformed in a normal fault triggering a sector failure of volcanic edifice.
As mentioned by Christiansen and Peterson (1981), the Plinian phase of paroxysmal eruption continued for about 9 h. On the background of decreasing intensity of the Plinian phase, a 4-h sequence of 21 magnitude 4.0 and 4.5 events was recorded (Figure 3). The earthquake foci repeated mainly the distribution of the foci recorded during the stage before the 18 May PEE.
El Chichon Volcano, México, 1982
El Chichón Volcano (1,100 m a.s.l.) is located in the state of Chiapas, southern Mexico. All the magmas, produced during the past 370,000 years, are K-alkaline andesites. Before the 1982 eruption, the volcanic structure consisted of two nested andesitic lava domes inside the crater that have been repeatedly reactivated during the Holocene (Layer et al., 2009). The last dated Plinian eruption occurred in 1320–1433 A.D. (Macías et al., 2003), then the volcano was inactive.
Paroxysmal Eruptions of 3–4 April 1982, Their Prelude and Their Effects
The eruption cycle of re-awakening of El Chichón volcano, that included the PEEs of 3–4 April 1982, began on 1 March 1982 with a swarm of volcano-tectonic earthquakes (Havskov et al., 1983). Near mid-night (at 23:32) of 28 March El Chichón exploded abruptly and vigorously; the eruption then continued until ~ 06:00 the next morning. This powerful explosive eruption fed a 20-km high eruption column and produced heavy ashfalls. During next 6 days (29 March−3 April), the eruptive activity continued intermittently at much-reduced level, consisting of occasional small phreatic explosions. Then, in the evening of 3 April at 19:35 and early morning of 4 April at 05:22, the El Chichón's two paroxysmal eruptions (VEI 5) occurred. The Plinian eruption columns of the explosions that occurred during 3 April and 4 April were 24 km high, with volume of 0.8 × 10⁹ m3, and 22 km high, with volume of 0.8 × 10⁹ m3, respectively. While of shorter duration (each lasting < 2 h), both these eruptions were more powerful than the 28 March eruption. In addition to producing voluminous ashfalls, each eruption also generated pyroclastic flows and surges that swept all flanks of the volcano. As a result of this sequence of great explosions, a nearly complete excavation of El Chichón summit dome was performed, and the 1-km-wide crater formed in its place (Carey and Sigurdsson, 1986; Tilling, 2009).
Local effects of this eruption were tragic. Pyroclastic flows and surges obliterated some villages within a roughly 7 km radius of the volcano, killing about 2,000 people, and ashfalls downwind posed socio-economic hardships for many thousands of inhabitants of the states of Chiapas and Tabasco. The unexpected and vigorous eruption of 28 March caused hasty, confused evacuation of most villagers in the area. Eruptive activity greatly diminished during the next 5 days, and then the most powerful and lethal eruptions occurred 3–4 April—tragically, after many evacuees were allowed by authorities to return home (Tilling, 2009).
The stratospheric cloud, created by the eruption of El Chichón, was about 2.5 km wide and reached an altitude of 25 km; over 20 million tons of sulfur gases were emitted during this event. The stratospheric cloud quickly spread out, encircling the globe in about three week's time. A maximum drop of 0.2°C in the global temperature was measured within two months of the eruption (Vignola, 1999). A significant 10% ozone decrease was recorded in the north temperate regions of North America, Europe, and Asia within the atmospheric layers of 8–16 and 16–24 km during four seasons after the eruption (Angell, 1998).
Seismic History of the El Chichon's PEEs
The eruption was preceded by a 28-day seismic swarm of volcano-tectonic earthquakes (Figures 4, 5), which began on 1 March 1982. Seismic activity was fortuitously recorded by the 14-station seismic network of Comisión Federal de Electricidad, installed by UNAM during 1979–1980 around the Chichoasén hydroelectric plant (~ 50 km south of the volcano's summit; Havskov et al., 1983; Jiménez et al., 1999). Totally 270 events with magnitude Mc ≥ 2 of the 1 March - 4 April swarm were located (Figure 5).
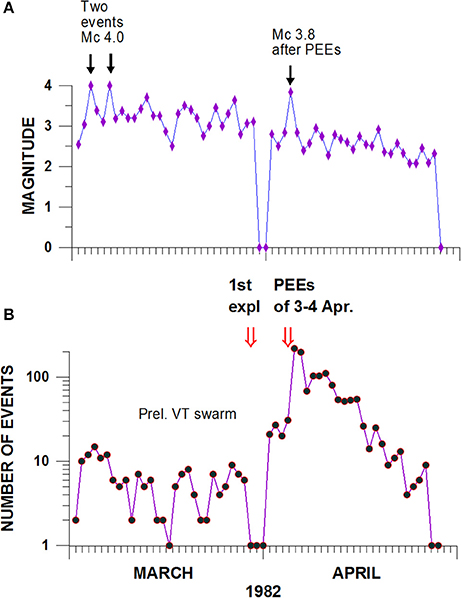
Figure 4. Daily distribution of maximum magnitudes (A) and the number of earthquakes (B) associated with the 1982 eruption of El Chichón volcano. Double arrows show appearance of the first explosion of 28 March and two PEEs explosions of 3–4 April; single arrows show the moments of the magnitude 4.0 earthquakes and after-PEEs Mc 3.7 earthquake. Data from the catalog of UNAM.
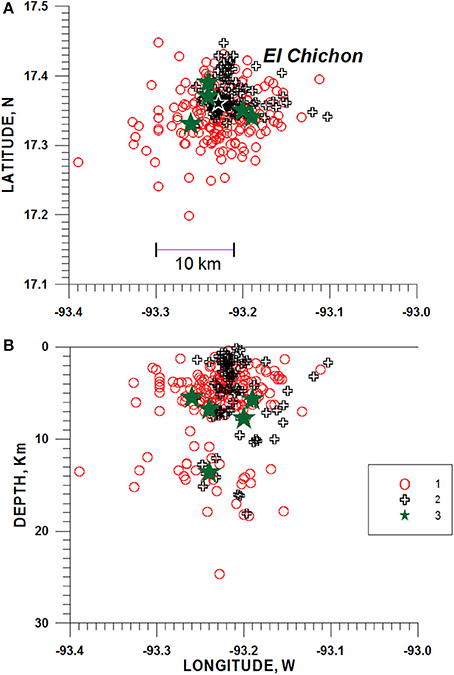
Figure 5. Epicenters (A) and hypocenters (B) of the earthquakes associated with the 1982 eruption of El Chichón volcano. Open circles indicate the foci of earthquakes that occurred before the first explosion of 28 March (1); crosses indicate the earthquakes recorded from 1 to 4 April (2); a seismic sequence of magnitude 3.7–3.8 that occurred in 5 h after the PEE during the final of Plinian stage is shown by filled stars (3). The position of El Chichón volcano is shown by the open star. Data from the catalog of UNAM.
The swarm began with a sharp increase in the number of earthquakes during the first 6 days of activity. Two maximum magnitude events (Mc 4) of the swarm were recorded on 3 and 6 March. Then a gradual decrease in the seismic activity in number and magnitudes of events was observed during the next 2 weeks. The activity increased again beginning from 19 March. The majority (~80%) of earthquakes, preceding the first explosion of 28 March, occurred within an area of 10 × 20 km2 having the volcano in the center of this area, ranging within depths from 0 to 25 km (Figure 5B).
Just after the explosion of 28 March seismic activity disappeared but 2 days prior to the PEEs of 3–4 April, the number of earthquakes with Mc ≥ 2 began to increase. After the first explosion of 28 March and before and during the two PEE events of 3 and 4 April, the earthquake foci had filled a vertical N-S oriented volume beneath the volcano at the depth interval from 0 to 8 km (Figure 5B).
The PEE of 4 April (05:35) was followed by a sequence of five intermediate-size (Mc 3.7–3.8) earthquakes that occurred beginning from 07:53 during 5 h on the background of decreasing intensity of the Plinian activity of the volcano (Figure 5). The earthquake foci were distributed around and beneath the focal volume filled during the stage before the 3–4 April PEEs.
Pinatubo Volcano, Luzon Island, Philippines, 1991
Mount Pinatubo is a composite volcano of 1,745 m elevation and is situated in the Luzon volcanic arc (Figure 1). Pre-1991 eruption, Mount Pinatubo represented a dacite-andesite dome complex and stratovolcano that was surrounded by an extensive apron of pyroclastic-flow and lahar deposits from large explosive dacitic eruptions. Large, late-stage dome, filling the crater before the 1991 eruption, was left by the penultimate Plinian eruption that occurred about 500 year before the recent eruption (Newhall et al., 1996).
Paroxysmal Eruption of 15 June 1991, Its Prelude and Effects
The eruption cycle of re-awakening of Pinatubo volcano, which included the paroxysmal explosive eruption of 15 June 1991, began in March 1991 (Figure 6A). Citizens of small communities on the lower northwest flank of Mount Pinatubo felt earthquakes beginning from 15 March, 1991. On 2 April, 1991, during or just after phreatic explosions, vigorous steam vents opened on the upper north slope of the volcano.
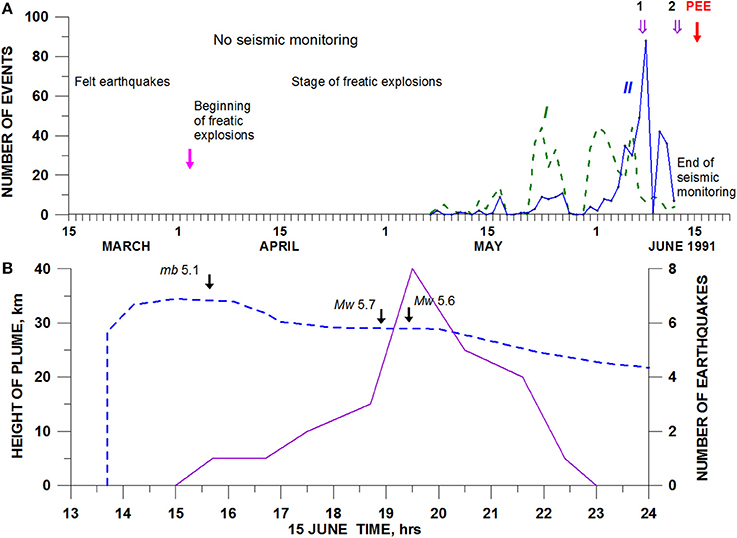
Figure 6. (A) Temporal variations in the daily number of earthquakes located from 7 May to 12 June 1991 at a distance of about 5 km to NW from the volcano (I) and beneath the Pinatubo volcano (II). Double arrows show eruptive events; single arrows show the beginning of phreatic explosions and the moment of the PEE of 15 June. Data from the catalog prepared by USGS. (B) Variations of the seismic activity (solid line) during the 9-h activity of the PEE's explosive plume of 15 June (dashed line). Graph of the plume was modified from Wolfe and Hoblitt (1996). Seismic data taken from (https://earthquake.usgs.gov). Arrows with magnitudes indicate important moments of seismic activity.
From 2 April to late May, steam jetted to heights of 300 to 800 meters. Sometimes these jets were accompanied by ash emissions that reached heights of 1,500 to 3,000 meters. By 9 June, continuous ash emission and occasional small explosions produced ash clouds dense enough to flow slowly down the volcano's western slopes. A new lava dome began to grow in the crater from 9 June. Then a series of strong explosive eruptions began on 12 June, 1991. These culminated in the violent climactic Plinian eruption (VEI 6) of 15 June at 13:42 (L.T.) which caused the collapse of the volcano summit and lasted ~9 h. This eruption produced about 10 km3 of porous, pumiceous deposits, and formed a caldera of 2.5 km in diameter (Sabit et al., 1996; Wolfe and Hoblitt, 1996).
Local effects of this paroxysmal eruption were significant. Pyroclastic flows that were emplaced from the Plinian column during the 15 June paroxysmal eruption traveled as much as 12 to 16 km from the vent in all sectors, impacted directly an area of almost 400 km2, and profoundly altered the landscape (Scott et al., 1996). The successive forecasting of the eruptive events and their effects enabled Philippine civil leaders to organize massive evacuations, including the evacuation of Clark Air Base (U.S. Air Force), which was located just east of the volcano. Those evacuations saved thousands of lives. Nonetheless, the climactic eruption coincided with a typhoon on June 15 that caused 200 to 300 deaths and extensive property damage, owing to an extraordinarily broad distribution of heavy, wet tephra-fall deposits (Wolfe and Hoblitt, 1996).
From about 13:40 to about 22:30 on 15 June, Mount Pinatubo produced the largest stratospheric SO2 cloud ever observed by modern instruments, and the major stratospheric aerosol event since Krakatau exploded in 1883. The giant umbrella cloud covered an area of 300,000 km2 at 19:40 and was sustained and growing during the whole 9 h climax, eventually reaching >1,100 km in diameter. The altitude of umbrella cloud was estimated as 25 km at the eastern edge and 34 km at its center for the 15:40 image. The stratospheric cloud was observed by the TOMS satellites to encircle the Earth in about 22 days (Self et al., 1996). After the 1991 Pinatubo eruption, the globally averaged stratospheric temperature rose by about 2°C for about 2 years (Robock, 2000). It was noted also that the sulfuric aerosols, released before and during the eruption, circled the Earth within 3 weeks and remained in the atmosphere for 3 years, reflecting enough sunlight to cool the entire planet by half a degree Celsius during that time (Wendel and Kumar, 2016).
Seismic History of the Pinatubo PEE
As it was noted, the citizens of small communities on the lower northwest flank of Mount Pinatubo felt earthquakes beginning on 15 March, 1991 but the local seismic observations began by the USGS seismologists only on 7 May (Figure 6A). Therefore, the earthquake swarm prior to the 2 April initial re-awakening of the volcano was not instrumentally recorded. At the same time, no events with magnitude ≥ 4.5 were located by the worldwide seismic survey of USGS (https://earthquake.usgs.gov) in the region of the volcano during March-May.
Figures 6A, 7 show the development of the seismic activity beginning from 7 May, when the local network was installed, and until 12 June, 1991, when the seismic network was destroyed by large explosions. Volcano-tectonic seismic events were recorded within two clusters (Figure 7A): at a distance of about 5 km NW of the summit (I) and just beneath the summit (II). The first cluster of seismic events developed mainly within the depth range from 7 to 3 km while the second group of events was shallower, forming a vertical column within the depth range from 4 km b.s.l. to 1 km a.s.l. This shift of earthquake foci from cluster I to cluster II supposedly indicated the migration of seismicity to the surface beneath the volcano along the fault shown with a dashed line in Figure 7A.
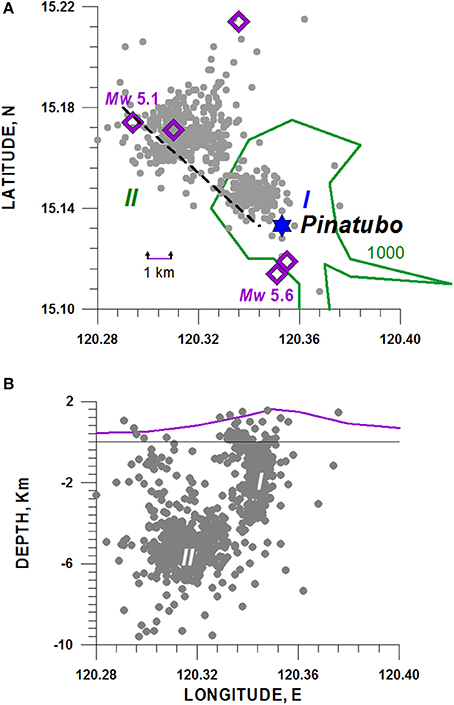
Figure 7. Epicenters (A) and hypocenters (B) of earthquakes located from 7 May to 12 June 1991 near Pinatubo volcano, Philippines. I and II mark data from two clusters of earthquakes. Data from the catalog prepared by USGS. Diamonds show epicenters of the earthquakes recorded during the paroxysmal explosive sequence of 15 June (taken from https://earthquake.usgs.gov). The hypocenters of the 15 June earthquakes are not shown in (B) (See text). The 1,000-m contour of the volcano's relief, zero-line of sea-level depth, and profile of volcanic edifice are shown. The fault is shown with a dashed line.
The events from the distant zone I dominated from 21 May to 5 June. Then seismicity of zone II beneath the volcano began to increase its activity, and the intensive swarm of low magnitude (from 0 to 1; largest magnitude 1.5) events was recorded there during 6 to 7 June (Figure 6A). This swarm culminated in the 7 June lava dome extrusion. Just after the beginning of the lava dome growth, the number of earthquakes sharply decreased, and the strong 12 June explosion occurred on the background of low-level seismicity for both seismic zones.
During the culminated stage of great explosions, which occurred from June 12 to 15, the local seismic network was out of service, and the only information about seismic activity was obtained from the worldwide seismic survey of USGS (https://earthquake.usgs.gov) at the level of magnitudes ≥ 4.5. This suggests that the 9-h climactic sequence of explosions of 15 June that began at 13:42 was accompanied by a swarm of earthquakes “triggered” by the explosion (Figure 6B).
During the 9-h climactic sequence of explosions, totally 25 earthquakes of magnitude range from 4.5 to 5.7 were recorded. They were located within Luzon island to the north and north-east of the volcano (note that during March−14 June no seismic events of this magnitude range were recorded there). Epicenters of five of these earthquakes, located within the area of the seismic swarms occurring 7 May−12 June, are shown in Figure 7A. The precision of the depths estimations of these events is very low, and for all of them the USGS survey took the depths simply as 10 km that means “shallower than 33 km” (https://earthquake.usgs.gov/earthquakes/eventpage/terms.php). Therefore, they are not shown in the distribution of hypocenters of Figure 7B.
The comparative 9-h development of the eruption plume and of the seismic activity is shown in Figure 6B. The first earthquakes of this sequence, with magnitude mb 5.1, occurred at 15:39, about 2 h after the beginning of the explosion sequence (Figure 6B). The number of events and magnitudes of the swarm reached a maximum on the background of decrease in the plume height 5–6 h after the beginning of the explosion. Earthquake with magnitude Mw 5.7 was recorded at 18:41; earthquake with magnitude Mw 5.6 was recorded at 19:15.
Dynamics of Paroxysmal Explosive Eruptions of the Second Group (VEI 3-4)
In this section, three PEEs of the second group (VEI 3-4) of volcanoes Usu, Soufriere Hills and Volcán de Colima are discussed. They were selected from the database of the Global Volcanism Program (http://volcano.si.edu/) as the most detailed described with the field observations and having continuous seismic monitoring. The main data about these eruptions are collected in Table 2.
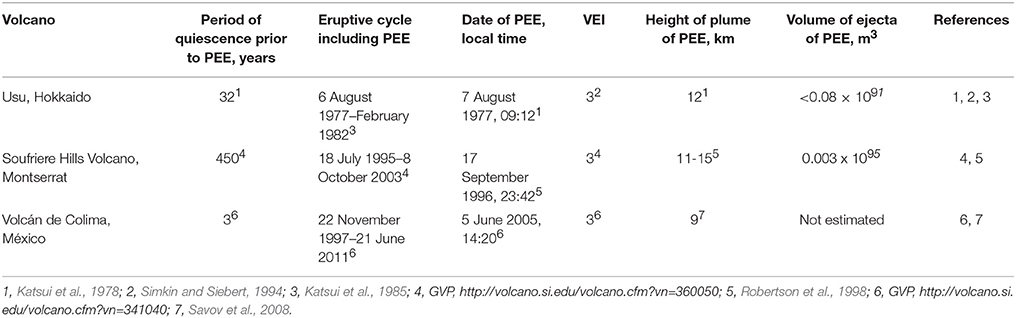
Table 2. List of paroxysmal explosive eruptions (PEEs) of the second group (VEI 3-4).
Usu Volcano, Hokkaido, Japan, 1977
Usu Volcano is located on the southern rim of the Toya Caldera, Hokkaido (Figure 1). It is a truncated stratovolcano with the highest peak of about 700 m above sea level (a.s.l.) crowned with a small caldera, 1.8 km across and about 500 m deep (Figure 8B). Within the summit caldera there are two lava domes, Ko-Usu and Oo-Usu. The historic activities commenced in 1663 with a Plinian eruption of rhyolitic pumice. Characteristic eruptions of dacitic magma including nuee ardente and lava dome or cryptodome building have been repeated every 30 to 50 years. The eruptions occurred both from the summit and the northeastern base of Usu Volcano (Niida et al., 1980; Yokoyama et al., 1981; Katsui et al., 1985).
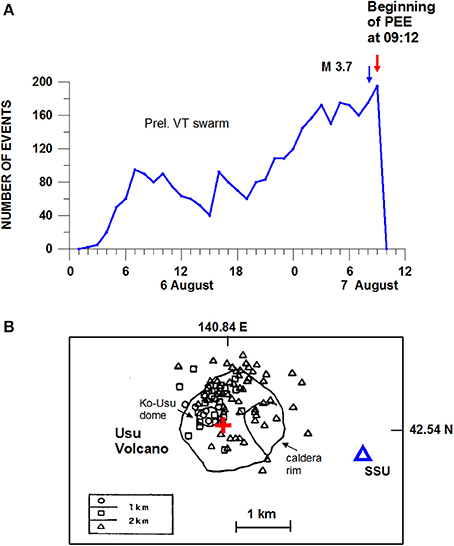
Figure 8. (A) Variations in the hourly number of volcano-tectonic earthquakes prior to the 7 August 1977 PEE at Usu volcano; (B) Epicenters of these earthquakes. In (B), red cross indicates crater 1 opened during the 7 August eruption; triangle indicates the seismic station SSE. Figure prepared based on data modified from Yokoyama et al. (1981).
Paroxysmal Eruption of 7 August 1977, Its Prelude and Effects
The eruption cycle of Usu volcano, which included the paroxysmal explosive eruption of 7 August 1977, began on 6 August 1977 after 32 years of quiescence (Table 2). A major pumice eruption of hypersthene dacite occurred from the summit after 32-h preceding earthquake swarm. Large eruptions lasted for a week from August 7 to 14, opening craters 1–4, each about 100 m across.
The first explosion in this sequence was paroxysmal. An ash-laden gray cloud rose from the southeastern base of Ko-Usu beginning from 09:12 of 7 August without notable explosion sounds. The eruption column grew rapidly, and at 10:30 rose up to a maximum height of 12 km in elevation. The eruption lasted about 2.5 h and ceased at 11:40. A new crater (Crater I), about 100 m across, opened at the southeastern base of the Ko-Usu lava dome (Figure 8B; Katsui et al., 1978, 1985).
Large volume of pumice and ash was ejected and transported to the southeast of the volcano by the westerly wind. The pumice and ash showers caused destruction of cultivated fields and forests around the volcano. The alarm was issued by the Japan Meteorological Agency before the beginning of eruption (Yokoyama et al., 1981), and no one was killed or injured seriously by the eruption activity, though some damage was caused not only to cultivated lands and forests by the ejecta, but also to some buildings, underground constructions and others by the subsequent crustal movements (Katsui et al., 1978).
Seismic History of the Usu PEE
The first earthquake of the premonitory swarm of volcano-tectonic earthquakes occurred at 01:09 on 6 August (Figure 8A). Beginning from 03:30, the earthquakes were strong enough to be felt in the whole area around the Usu Volcano, up to about 8 km from the volcano, but no damage was caused. Rapid increase in frequency of earthquakes occurred about 01:00 on 7 August and continued to the time of beginning of PEE eruption (Figure 8A; Suzuki and Kasahara, 1979; Katsui et al., 1985).
The earthquake swarm consisted of about 3,000 small (magnitude 1-2) volcano-tectonic earthquakes that were located beneath the summit crater at a depth from 0 to 2 km (Figure 8B). The new eruptive Crater 1 (shown as a cross in Figure 8B) was situated within the epicentral zone of earthquakes. The maximum magnitude M 3.7 earthquake was observed half an hour before the beginning of eruption (Yokohama and Seino, 2000).
During the PEE, volcano-tectonic earthquakes disappeared but volcanic tremor accompanied the total process of the volcanic column growth. Figure 9 shows the temporal variations in the height of the eruption column together with the variation in the amplitudes of tremor observed at the seismic station SSU (2.5 km from Crater 1). There is a good correlation between these parameters. The amplitude of tremors reached maximum values when the eruption cloud reached its maximum height (Suzuki and Kasahara, 1979).
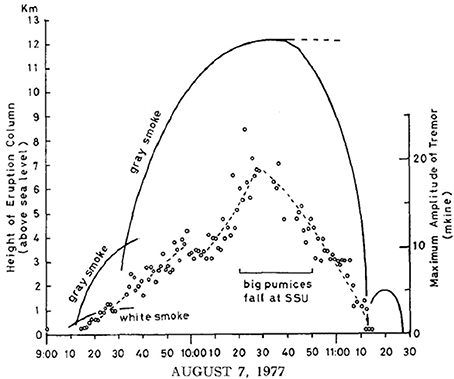
Figure 9. Temporal (every minutes) variations in the 7 August 1977 volcanic cloud height (solid lines; data from Katsui et al., 1978) and amplitude of volcanic tremor (dashed lines; data of station SSU, see Figure 8B) at Usu volcano. From Suzuki and Kasahara (1979). The Figure was reproduced with the permission of the copyright holder Prof. Minoru Kasahara.
Soufriére Hills Volcano, Montserrat, 1996
Andesitic stratovolcano Soufriére Hills (SHV) with the height of 915 m is situated in the southern part of Montserrat Island, West Indies (Figure 1) and represents a Peleean lava dome complex constructed largely of hornblende andesite. The SHV edifice consists of four andesite lava domes and a fan of associated pyroclastic flow deposits. Its summit crater was likely formed c. 4,000 years ago. Castle Peak Dome, a small andesitic lava dome, partially filled the crater about 450 years ago (Young et al., 1998; http://volcano.si.edu/volcano.cfm?vn=360050).
Paroxysmal Eruption of 17 September 1996, Its Prelude and Effects
The eruption cycle of Soufriere Hills volcano (SHV), which included the paroxysmal explosive eruption of 17 September 1996, began with phreatic explosion on 18 July 1995 after 450 years of dormancy without any preliminary seismic activity beneath the volcano (http://volcano.si.edu/volcano.cfm?vn=360050). Several steam vents formed a NNW line across the Castle Peak Dome. Phreatic explosions with associated steam and ash columns rose to 3 km in height. The largest explosion occurred on 21 August. These explosions continued for four months and gave a way to continuous eruption of juvenile andesitic magma in the form of lava dome and lava flows that began around 15 November 1995 and continued until the PEE of 17 September 1996 (Young et al., 1998).
On 17 September 1996, the SHV started a 9-h period of dome collapse. This collapse began at 11:30 and was followed by pyroclastic flows generation involving totally 11.7 × 10⁶m3 (Dense Rock Equivalent, DRE) in which 40% of the dome collapsed. After 2.5 h of quiescence, a paroxysmal explosive eruption occurred at 23:42. Explosive activity continued for about 50 min. A large crater-like depression 210 m deep formed in the dome open to the east. The height of plume reached 11-15 km, the volume of ejecta was estimated as 3.2 × 10⁶ m3 (DRE). Pumice and lithic lapilli fell widely across southern Montserrat and houses were destroyed in the nearest village (Robertson et al., 1998).
The image of 4-band Advanced Very High Resolution Radiometer (AVHRR) multispectral data, provided from the NOAA polar-orbiting satellite series, shows that the cloud, elongating from Montserrat about 1 h after the 17 September PEE, was 175 km long E-W and 75 km wide N-S. The image, taken later in about 5 h, shows that with a distance from the island the cloud quickly became very diffuse (http://www.geo.mtu.edu/volcanoes/west.indies/soufriere/govt/images).
Seismic History of the Soufriere Hills Volcano PEE
We use the catalog of volcano-tectonic earthquakes prepared by (Aspinall et al., 1998; Miller et al., 1998). This catalog included about 600 volcano-tectonic earthquakes with magnitudes from −0.5 to 2.4 that were located from 28 July 1995 (10 days after beginning of the eruption on 18 July) to the end of February 1997. Gardner and White (2002) wrote that the 18 July vent opened without notable accompanying seismicity.
The pre-PEE July 1995-September 1996 volcano-tectonic earthquakes occurred within three epicentral zones (Figure 10A): beneath St. George Hill (SGH), that is situated about 5 km to the NW from the volcano (I), along the structure extending to the NE of the volcano (II), and beneath Soufriére Hills volcano (III).
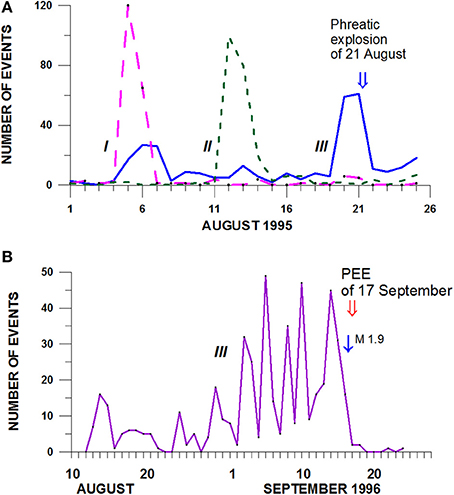
Figure 10. Variations in daily earthquake numbers before the 21 August 1995 phreatic explosion (A) and before the magmatic PEE of 17 September 1996 (B) at Soufriére Hills volcano. I, II, and III are the earthquake sequences that occurred beneath St. George Hill (SGH) (I); within the NE extent of the volcano (II), and beneath the volcano (III). In (A), the moment of phreatic explosion of 21 August is shown by double arrow. In (B), the largest preliminary earthquake is shown by single arrow; the moment of PEE of 17 September is shown by double arrow. Data from the catalog of MVO.
As noted before, the eruption developed into two main stages: phreatic and magmatic, separated by a long (about 1 year) stage of the construction of lava dome and emplacement of associated lava flows. We describe here the variations in seismic activity associated with the stage of phreatic explosions that reached its peak on 21 August 1995 and the stage of occurrence of magmatic PEE that occurred on 17 September 1996.
Increase in seismic activity before the phreatic explosion of 21 August began with a 2-day swarm of earthquakes along the NE extent of the SHV (Zone II) from 5 to 6 August, then a new two-day swarm was recorded beneath SGH (Zone I) that continued from 12 to 13 August (Figures 10A, 11A,C). These seismic events occurred at the depth range from 6 to 3 km b.s.l. Beginning from 20 August the seismic foci migrated upward to the surface filling the volume III beneath the volcano. During 2 days, 20 and 21 August, about 140 earthquakes with magnitudes between −0.5 and 0.4 were recorded. The seismic events recorded beneath the volcano clustered within a vertical column shape volume extending from 3 km b.s.l. to the summit of the volcano.
The explosion occurred at 08:03 of 21 August (B. Voight, personal communication, 2002) during the maximum level of seismic activity within zone III beneath the volcano. Just after the explosion, the number of seismic events sharply decreased.
The magmatic PEE of this SHV's eruptive cycle occurred 1 year later, on 17 September 1996. The seismic activity that preceded this paroxysmal explosion from 10 August is shown in Figures 10B, 11B,D. The zones I and II, that were active before the 21 August 1995 phreatic explosion, now were calm. The earthquake foci were clustered mainly beneath the SHV (zone III) forming a vertical column rising from the depth of 3 km b.s.l. to the summit of the volcano.
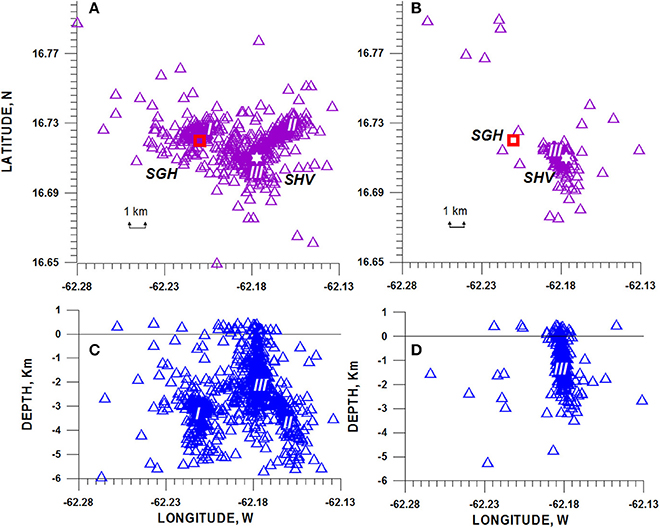
Figure 11. Distribution of epicenters and hypocenters of earthquakes (triangles) located at Soufriére Hills volcano before the 21 August 1995 phreatic explosion (A,C) and before the magmatic PEE of 17 September 1996 (B,D). I, II, and III are the earthquake sequences that occurred beneath St. George Hill (SGH) (I); within the NE extent of the volcano (II), and beneath the volcano (III). The square marks SGH, the star marks Soufriére Hills volcano (SHV). Zero-line of sea-level depth is shown. Data from the catalog of MVO.
The swarm of earthquakes had no clear beginning (Figure 10B); it occurred on the background of continuous seismic activity due to the process of partial collapsing of the dome that began in July 1996. Nevertheless, we can mark the gradual increase in earthquake numbers beginning from 29 August; therefore, the swarm continued for about 23–24 days. The earthquakes were of low magnitudes between 0 and 1.9; the largest event with magnitude 1.9 occurred on 17 September at 10:01, just before the 9-h crater collapse preceding the PEE. The explosion occurred during the apparent decrease in number of seismic events. After the PEE event, the number of earthquakes sharply decreased.
Volcán de Colima, México, 2005
Andesitic stratovolcano Volcán de Colima (height of 3,860 m) is the most active in Mexico (Figure 1). Eruptions of Volcán de Colima during the last 480 years involved a wide spectrum of eruption styles, including small phreatic explosions, major block-lava emissions, and large explosive events including Plinian, sub-Plinian and Vulcanian eruptions (Bretón González et al., 2002). The 1997–2011 cycle, discussed below, was preceded 3 years earlier by a short episode on 13–21 July 1994 culminated in the phreatic explosion of 21 July. The explosion destroyed the 1991 crater dome and produced avalanches and ash fall. It formed a shallow crater approximately 140 m in diameter and 50 m in depth (Jiménez et al., 1995).
Paroxysmal Eruption of 5 June 2005, Its Prelude and Effects
The eruption cycle of Volcán de Colima, which included the 2004–2005 episode with paroxysmal explosive eruption of 5 June 2005, began on 22 November 1997 with 1-year sequence of volcano-tectonic earthquake swarms. Beginning from 20 November 1998, sequence of four endogenous episodes of lava dome construction and three episodes of lava domes destructed by Vulcanian explosions, was recorded. The most intense Vulcanian explosions (VEI 3) were recorded during the 2004–2005 episode of lava dome construction-destruction. The extrusions of andesitic magma, which occurred during September-November 2004, had formed a new lava dome filling the active crater. The March 2005 explosions destroyed the 2004 lava dome. The repetitive building of new small-size domes was then observed during the April to July, 2005 explosive activity; each of them was destroyed by the following explosions. Finally, a crater ~ 260 m across and ~ 30 m deep was left (Zobin et al., 2010). A photo, taken on 16 June from the southern side of the volcano (Zobin et al., 2010), shows the erosion channel at the summit, which was formed by pyroclastic flows related to the recent explosions. Many small impact craters formed on the floor of the crater.
The explosion, which occurred on 5 June 2005 at 14:20, was the largest in this sequence and may be considered as the paroxysmal event of the 2004–2005 episode as well as the total 1997–2011 cycle. This PEE blasted an ash plume which reached 9 km a.s.l. and had a length of 222 km. The time duration of the PEE, considering the time of explosion column growth and development, was not estimated but it continued during less than half of hour. The eruption column collapse was followed by emplacement of pyroclastic density currents with runout of 5.1 km and volume of 2.3 × 10⁵ m3. Fall of ash was observed in the nearest villages. The local airport canceled all flights for a day. After the explosion of 5 June, evacuation was carried out of the village of Juan Barragan located nearest to the volcano (Zobin et al., 2016; http://volcano.si.edu/volcano.cfm?vn=341040).
Seismic History of the Volcán de Colima PEE
The 1998–2013 sequence of the lava dome constructions-destructions was preceded by a swarm of volcano-tectonic earthquakes only before the first 1998–1999 episode. The third episode of the cycle that developed during September 2004 to December 2005 (http://volcano.si.edu/volcano.cfm?vn=341040) was not preceded by any volcano-tectonic seismicity. As it can be seen in Figures 12, 13, the seismic activity before and during the episode was produced by numerous rockfalls, pyroclastic flows, and small explosions. Their daily number sharply increased during the lava dome extrusion occurring from the end of September 2004 to the beginning of November 2004 and stayed at a level of 200–300 rockfall events and 50–60 small explosions. Before the beginning of and during the sequence of the March-April 2005 large explosions, the number of the seismic signals of rockfalls and small explosions was at low level, between 1 to 5 daily events. The number of the seismic events of both types began to increase until 10-20 daily earthquakes in the middle of May. The beginning of June, before the 5 June PEE, was characterized by a sharp decrease of small explosions but also increase in the number of rockfalls (Figure 12). Another type of the seismic activity before the PEE was represented by microearthquakes that sharply increased in their number about 12 h before the PEE (Figure 13B). These microearthquakes, clearly seen on the seismogram recorded at a distance of 1.6 km from the crater (Figure 13A), were identified as micro-explosions and micro-rockfalls (Zobin et al., 2010).
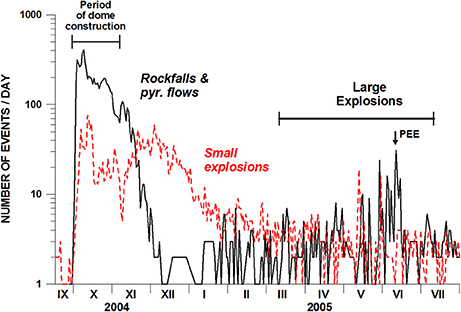
Figure 12. The number of daily earthquakes ascribed to rockfalls and pyroclastic flows (solid line) and to small explosions (dashed line) at Volcán de Colima during September 2004–July 2005. The September-November 2004 period of the lava dome construction and the period of the March–July 2005 large explosions are labeled. Arrow shows the moment of the 5 June PEE. Modified from (GVP, http://volcano.si.edu/volcano.cfm?vn=341040).
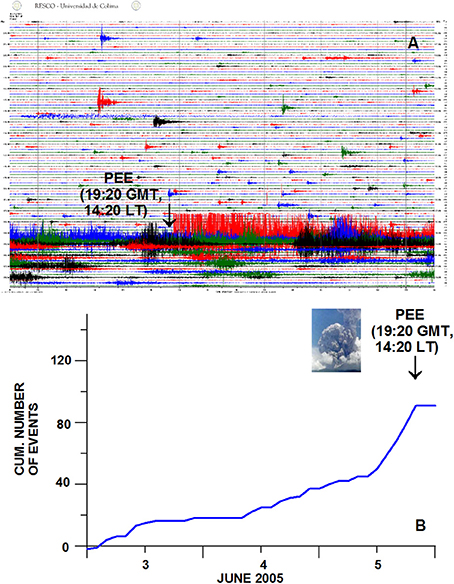
Figure 13. Twenty-four-hours seismogram of 5 June 2005, recorded by a short-period seismic station at a distance of 1.6 km from the crater of Volcán de Colima, showing the microearthquake seismicity before the 5 June PEE, (A), and variations in cumulative number of microearthquakes during 3 to 5 June before the 5 June PEE (B). Arrows in (A,B) indicate the moment of PEE. Insert in (B) shows the photo of the 5 June explosion taken by Televisa (http://noticieros.televisa.com). Data from catalog of Colima Volcano Observatory.
Discussion
Now let us discuss the dynamics of paroxysmal explosive activity of andesitic and dacitic volcanoes presented in this article. At first, we consider the dynamics of PEEs of the first group (VEI 5-6) that occurred at the volcanoes of Mount St. Helens, El Chichon, and Pinatubo. The following main stages of their dynamics may be formulated:
1. Stage of quiescence. It may continue from 120 years (MSH) till 500–550 years (Pinatubo, El Chichón).
2. Stage of re-awakening. This stage is characterized by appearance of swarms of volcano-tectonic earthquakes in the surroundings of the volcano and beneath the volcano indicating the arrival of a new portion of magma. It may continue from 11 days (MSH) till 28 days (El Chichón).
3. Stage of phreatic explosions. This stage reflects the rise of magma. The foci of volcano-tectonic earthquakes form a vertical column beneath the volcano suggesting the progressive rise of magma. Decoupling between this magma and the faster rising pressurized gases may be the cause for the observed phreatic eruptions. This stage was observed before the PEE at MSH during 54 days; at Pinatubo, during 51 days. At El Chichón volcano, the stage of phreatic activity began after the 28 March large explosion, and the foci of volcano-tectonic earthquakes formed a vertical column beneath the volcano during the period of 4 days, just until the PEE of 3 April. The stage may culminate with the largest earthquakes of the swarm preceding the PEE, as it was recorded just before the directed blast at MSH (MW 5.7).
4. Stage of PEE. The PEEs may occur as a directed blast (MSH), if associated with a sector collapse, or as a vertical eruptive column with collapse of the edifice summit (El Chichón and Pinatubo).
5. Stage of co-PEE seismo-reaction. Swarms of earthquakes appeared during decreasing intensity of the Plinian activity of PEEs. At MSH, a sequence of 21 magnitude 4.0–4.5 events was recorded during 4 h; at El Chichon, a 5-h sequence of five intermediate-size (Mc 3.7–3.8) earthquakes was recorded; at Pinatubo, a sequence of 25 earthquakes of magnitude range from 4.5 to 5.7 was recorded during 7 h.
Let us discuss the nature and significance of these stages in development of eruption process. The stage of re-awakening, represented by the swarms of volcano-tectonic (VT) earthquakes, may indicate the input of new magma in the system of magma reservoirs beneath the volcano. This process covers areas significantly exceeding the area of volcanic structures and occurs within the depths between 10 and 25 km and the surface.
When magma reaches the volcanic edifice, the volcanic conduit filling begins. The foci of VT earthquakes cluster within a vertical volume just beneath the crater indicating magma ascent. The process of volatile exsolution from the melt as well as gas expansion during the stage of phreatic explosions promotes stress accumulation within the volcanic structure for initiation of the PEE.
During the PEEs, a great volume of volcanic rocks ejects, liberating space in the interiors beneath the volcano. It causes collapse of the upper magmatic system and, as a consequence, the swarms of “triggered” earthquakes whose magnitude may reach up to 5.7. The observations, obtained at our three PEEs of the first group (See Table 1 and text), show that the maximum magnitude of “triggered” earthquakes, Mmax, has a tendency of log-linear dependence on the volume of ejecta, V, during PEEs (Figure 14).
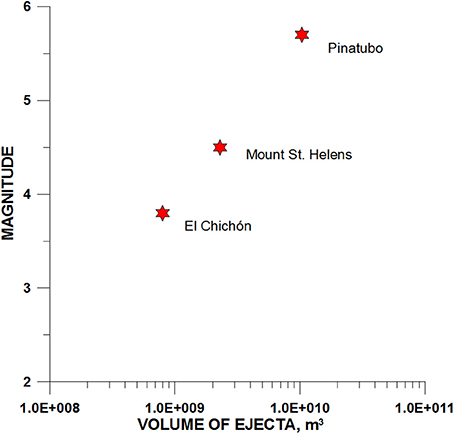
Figure 14. Dependence of the maximum magnitude of the “triggered” VT earthquakes on the volume of ejecta erupted during the PEEs of the first group (VEI 5-6).
The appearance of these “triggered” seismic events during the PEEs indicates the partial emptying of the magma reservoirs, possibly also associated with the reactivation of regional tectonic structures. The areas of activation of post-eruption seismicity allow locating these magma reservoirs (Zobin, 2017).
In the case of MSH, the 50 km long regional structure within Cascade Range was activated to the north and to the south of the volcano, in addition to outward dipping fault zones merging below the volcano (Scandone and Malone, 1985). The depths of earthquakes reached 20 km (Weaver et al., 1981). In the case of El Chichón, the earthquake foci filled the depth interval from 0 to 25 km beneath the volcano (Jiménez et al., 1999). In the case of Pinatubo, the zone beneath the volcano spread to the west within volcanic edifice and occupied all beneath-volcano space filling it up to the depths of 25 km, about 20 km deeper than before the 15 June explosion. The seismicity also showed a clustering along outward dipping fault zones merging just below the volcanic edifice (Mori et al., 1996).
The dynamics of three selected PEEs of the second group (VEI 3), Usu volcano, SHV and Volcán de Colima, was out of the above-mentioned scheme. The dynamics of the PEE development at SHV was the only that partly kept within the main phases of the PEEs of the first group. At first, it was re-awakening volcano having stage 1 of quiescence during 450 years before the 1995-1996 cycle of eruption. The stage 2 was absent; no preliminary volcano-tectonic activity was recorded. At the same time, as was noted by Aspinall et al. (1998), the spatial separation of some of the hypocenters into two clusters, one under SGH and another under the SHV, recorded during a phreatic stage (stage 3 for SHV) was reminiscent of pre-eruption activity (Stage 2) recorded in 1991 at Pinatubo volcano (compare Figures 7, 11). Stage 5 was absent; probably due to low ejecta volume (two-three orders of volume less than ejected during the PEEs of the first group; see Tables 1, 2), no “triggered” earthquakes were recorded during the 50-min plume development.
The appearance of PEEs at Usu volcano and Volcán de Colima was out of the proposed stage schemes. The preliminary VT swarm at Usu volcano was short, and lasted only for 32 h. No phreatic explosion stage was observed before the PEE. Probably due to low ejecta volume, no “triggered” earthquakes were recorded during the 2-h plume development, only volcanic tremor accompanied the PEE (See Figure 9).
The PEE appearance at Volcán de Colima was developed as standard lava dome construction-destruction. No preliminary VT swarm was recorded, only seismic signals associated with rockfalls and small explosions suggested such a process. The PEE simply “cleaned” the crater, removing the lava dome, without any destruction of the crater.
This absence of any regularity in the development of lower VEI eruptions of the second group may refer, among other reasons, to different conditions of opening of the magmatic conduit during these eruptions. All three PEEs of the first group were preceded by a stage of quiescence that continued from 120 years (MSH) until 500–550 years (Pinatubo, El Chichón). This indicates the similar plugged conditions of their conduits and, as a result, the similar 5-stage development of eruptions. Among the PEEs of the second group, only SHV, having a stage of quiescence that continued for about 370 years, may be considered as a plugged conduit volcano. As we see, the build-up of its eruption was characterized by at least three of five stages noted for the PEEs of the first group. The two other PEEs, at Usu and Volcán de Colima, were supposedly developed in the conditions of open or semiplugged conduit, as suggested by their recent pre-PEE activity.
Therefore, this study confirms that eruptions with higher VEI are more likely to be related to a plugged magmatic conduit, whereas eruptions with lower VEI are usually more associated to open conduit conditions.
Conclusions
Review of the dynamics of PEEs development at andesitic and dacitic volcanoes during 1960–2010 was made for two groups of PEEs, of VEI 5-6 and VEI 3-4. The first group included three eruptions of VEI 5-6 and the second group included three eruptions of VEI 3. The PEEs of the first group have similarity in their development: long (more than 120 years) period of quiescence, preliminary VT swarm, period of phreatic explosions and then, PEE appearance. It was shown that the PEEs during their Plinian stage “triggered” the earthquake activity beneath the volcanic structures with the maximum magnitude of earthquakes proportional to the volume of ejecta of PEEs. For these PEEs of the first group, a 5-stage scheme of development process is proposed. The three discussed PEEs of the second group developed in more individual styles, probably resulting from the different conditions of opening or plugging of the magmatic systems. Therefore, this study confirms that eruptions with higher VEI are more likely to be related to a plugged magmatic conduit, whereas eruptions with lower VEI are usually more associated to open conduit conditions.
Author Contributions
The author confirms being the sole contributor of this work and approved it for publication.
Conflict of Interest Statement
The author declares that the research was conducted in the absence of any commercial or financial relationships that could be construed as a potential conflict of interest.
The reviewer, SC, and handling editor declared their shared affiliation.
Acknowledgments
The comments of V. Acocella, A. Bonaccorso, S. Calvari, and two reviewers helped to improve the manuscript. N. Stalboun helped to improve our English grammar. The catalogs of volcano-tectonic earthquakes were provided by Z. Jiménez (El Chichon volcano), J. Mori (Pinatubo volcano), and W. Aspinall (Soufriere Hills Volcano) and taken from the WEBsite https://pnsn.org/pnsn-data-products/earthquake-catalogs (Mount St. Helens) and https://earthquake.usgs.gov (Pinatubo volcano).
Footnotes
1. ^Here and later in the article, local time for all volcanic events was used.
References
Angell, J. K. (1998). Impact of El Chichon and Pinatubo on ozonesonde profiles in north extratropics. Geophys. Res. Lett. 25, 4485–4488. doi: 10.1029/1998GL900224
Aspinall, W. P., Miller, A. D., Lynch, L. L., Latchman, J. L., Stewart, R. C., White, R. A., et al. (1998). Soufriere Hills eruption, Montserrat, 1995–1997: volcanic earthquake locations and fault plane solutions. Geophys. Res. Lett. 25, 3397–3400. doi: 10.1029/98GL00858
Bernstein, R. S., Baxter, P. J., Falk, H., Foster, L., and Frost, F. (1986). Immediate public health concerns and actions in volcanic eruptions: lessons from the Mount St. Helens eruptions, May 18-October 18, 1980. Am. J. Public Health 76(Suppl.) 25–38.
Bretón González, M., Ramírez, J. J., and Navarro, C. (2002). Summary of the historical eruptive activity of Volcán de Colima, México 1519–2000. J. Volcanol. Geotherm. Res. 117, 21–46. doi: 10.1016/S0377-0273(02)00233-0
Carey, S. N., and Sigurdsson, H. (1986). The 1982 eruptions of El Chichón volcano, Mexico (2): Observations and numerical modeling of tephra fall distribution. Bull. Volcanol. 48, 127–141. doi: 10.1007/BF01046547
Christiansen, R. L., and Peterson, D. W. (1981). “Chronology of the 1980 eruptive activity,” in The 1980 Eruptions of Mount St. Helens. Geol. Surv. Prof. Paper, eds P. W. Lipman and D. R. Mullineaux (Washington).
Dziewonski, A. M., Ekstrom, G., and Franzen, J. E. (1988). Global seismicity of 1980: centroid-moment tensor solutions for 515 earthquakes. Phys. Earth Planet. Int. 50, 125–154. doi: 10.1016/0031-9201(88)90003-9
Gardner, C. A., and White, R. A. (2002). “Seismicity, gas emission and deformation from 18 July to 25 September 1995 during the initial phreatic phase of the eruption of Soufriere Hills Volcano, Montserrat,” in The eruption of Soufriere Hills Volcano, Montserrat from 1995 to 1999, eds T. H. Druitt, and B. P. Kokelaar (London; Memoirs: Geological Society), 567–581.
Havskov, J., De la Cruz-Reyna, S., Singh, S. K., Medina, F., and Gutiérrez, C. (1983). Seismic activity related to the March-April, 1982 eruption of El Chichón volcano, Chiapas, México. Geophys. Res. Lett. 10, 293–296. doi: 10.1029/GL010i004p00293
Jiménez, Z., Espíndola, V. H., and Espíndola, J. M. (1999). Evolution of the seismic activity from the 1982 eruption of El Chichon Volcano, Chiapas, Mexico. Bull. Volcanol. 61, 411–422 doi: 10.1007/s004450050282
Jiménez, Z., Reyes, G., and Espíndola, J. M. (1995). The July 1994 episode of seismic activity at Colima volcano, México. J. Volcanol. Geotherm. Res. 64, 321–326. doi: 10.1016/0377-0273(94)00118-Z
Katsui, Y., Komuro, H., and Uda, T. (1985). Development of faults and growth of Usu-Shinzan cryptodome in 1977–1982 at Usu volcano, North Japan. J. Fac. Sci. Hokkaido Univ. 21, 339–362.
Katsui, Y., Oba, Y., Suzuki, T., Kondo, Y., Watanabe, T., Niida, K., et al. (1978). Preliminary report of the 1977 eruption of Usu Volcano. J. Fac. Sci. Hokkaido Univ. 18, 385–408.
Layer, P. W., García-Palomo, A., Jones, D., Macías, J. L., Arce, J. L., and Mora, J. C. (2009). El Chichón Volcanic complex, Chiapas, México: stages of evolution based on field mapping and 40Ar/39Ar geochronology. Geofis. Int. 48, 33–54.
Macías, J. L., Arce, J. L., Mora, J. C., Espíndola, J. M., Saucedo, R., and Manetti, P. (2003). A 550-year-old Plinian eruption at El Chichón Volcano, Chiapas, México: explosive volcanism linked to reheating of the magma reservoir. J. Geophys. Res. 108:2569. doi: 10.1029/2003JB002551
Miller, A. D., Steward, R. C., White, R. A., Luckett, R., Baptie, B. J., Aspinall, W. P., et al. (1998). Seismicity associated with dome grows and collapse at Soufriére Hills volcano, Montserrat. Geophys. Res. Lett. 25, 3401–3404.
Mori, J., White, R. A., Harlow, D. H., Okubo, P., Power, J. A., Hoblitt, R. P., et al. (1996). “Volcanic earthquakes following the 1991 climactic eruption of Mount Pinatubo: strong seismicity during a waning period,” in Fire and Mud. Eruptions and lahars of Mount Pinatubo, Philippines eds C. G. Newhall and R. S. Punongbayan (Seattle,WA: University of Washington Press), 339–350.
Mullineaux, D. R., and Crandell, D. R. (1981). “The eruptive history of Mount St. Helens,” in The 1980 Eruptions of Mount St. Helens, eds P. W. Lipman, and D. R. Mullineaux (Washington, DC: Geological Survey Professional Paper 1250), 3–15.
Newhall, C. G., Daag, A. S., Delfin, F. G. Jr., Hoblitt, R. P., McGeehin, J., Pallister, J. S., et al. (1996). “Eruptive history of Mount Pinatubo,” in Fire and Mud. Eruptions and Lahars of Mount Pinatubo, Philippines, eds C. G. Newhall and R. S. Punongbayan (Seattle, WA: University of Washington Press), 165–196.
Newhall, C. G., and Self, S. (1982). The volcanic explosivity index (VEI): an estimate of explosive magnitude for historical volcanism. J. Geophys. Res. 87, 1231–1238. doi: 10.1029/JC087iC02p01231
Niida, K., Katsui, Y., Suzuki, T., and Kondō, Y. (1980). The 1977–1978 eruption of Usu volcano. J. Fac. Sci. Hokkaido Univ. 19, 357–394.
Robertson, R., Cole, P., Sparks, R. S. J., Harford, C., Lejeune, A. M., McGuire, W. J., et al. (1998). The explosive eruption of Soufriere Hills Volcano, Montserrat, West Indies, 17 September 1996. Geophys. Res. Lett. 25, 3429–3432. doi: 10.1029/98GL01442
Robock, A. (1981). The Mount St. Helens volcanic eruption of 18 May 1980: minimal climatic effect. Science 212, 1383–1384.
Robock, A. (2000). Volcanic eruptions and climate. Rev. Geophys. 38, 191–219. doi: 10.1029/1998RG000054
Robock, A., and Mass, C. (1982). Mount St. Helens volcanic eruption of 18 May 1980: large short-term surface temperature effects. Science 216, 628–630. doi: 10.1126/science.216.4546.628
Sabit, J. P., Pigtain, R. C., and de la Cruz, E. G. (1996). “The west-side story: observations of the 1991 Mount Pinatubo eruptions from the west,” in Fire and Mud. Eruptions and lahars of Mount Pinatubo, Philippines, eds C. G. Newhall and R. S. Punongbayan, (Seattle, WA: University of Washington Press), 445–456.
Savov, I. P., Luhr, J. F., and Navarro-Ochoa, C. (2008). Petrology and geochemistry of lava and ash erupted from Volcán Colima, Mexico, during 1998–2005. J. Volcanol. Geotherm. Res. 174, 241–256. doi: 10.1016/j.jvolgeores.2008.02.007
Scandone, R., and Malone, S. (1985). Magma supply, magma discharge and readjustment of the feeding system of Mount St Helens during 1980. J. Volcanol. Geotherm. Res. 23, 239–262. doi: 10.1016/0377-0273(85)90036-8
Schuster, R. L. (1981). “Effects of the eruptions on civil works and operations in the Pacific Northwest,” in The 1980 Eruptions of Mount St. Helens. Geol. Surv. Prof. Paper, eds P. W. Lipman and D. R. Mullineaux (Washington).
Scott, W. E., Hoblitt, R. P., Torres, R. C., Self, S., Martinez, M. L., and Nillos, T. Jr. (1996). “Pyroclastic flows of the June 15, 1991, climactic eruption of Mount Pinatubo,” in Fire and Mud. Eruptions and lahars of Mount Pinatubo, Philippines, eds C. G. Newhall and R. S. Punongbayan (Seattle, WA: University of Washington Press), 545–570.
Self, S., Zhao, J., Holasek, R. E., Torres, R. C., and King, A. J. (1996). “The atmospheric impact of the 1991 Mount Pinatubo eruption,” in Fire and Mud. Eruptions and lahars of Mount Pinatubo Philippines eds C. G. Newhall and R. S. Punongbayan, (Seattle, WA: University of Washington Press), 1089–1115.
Surono Jousset, P., Pallister, J., Boichu, M., Buongiorno, M. F., Budisantoso, A., et al. (2012). The 2010 explosive eruption of Java's Merapi volcano—A ‘100-year’ event. J. Volcanol. Geotherm. Res. 241–242, 121–135. doi: 10.1016/j.jvolgeores.2012.06.018
Suzuki, S., and Kasahara, M. (1979). Seismic activity immediately before and in the early stage of the 1977 eruption of Usu volcano, Hokkaido, Japan. J. Fac. Sci. Hokk. Univ. Ser. VII 6, 239–254.
Tilling, R. (2009). El Chichón's “surprise” eruption in 1982: lessons for reducing volcano risk. Geofis. Int. 48, 3–19.
Vignola, F. (1999). “Impact of aerosols from the eruption of El Chichón on beam radiation in the Pacific Northwest,” in Pacific Northwest Solar Radiation Data (Eugene: UO Solar Monitoring Lab), 27–32.
Voight, B. (1981). “Time scale for the first moments of the May 18 eruption,” in The 1980 Eruptions of Mount St. Helens, Geol. Surv. Prof. Paper, eds P. W. Lipman and D. R. Mullineaux (Washington).
Weaver, C. S., Grant, W. C., Malone, S. D., and Endo, E. T. (1981). “Post-May 18 seismicity: volcanic and tectonic implications,” in The 1980 Eruptions of Mount St. Helens, Geol. Surv. Prof. Paper, eds P. W. Lipman and D. R. Mullineaux (Washington).
Wendel, J., and Kumar, M. (2016). Pinatubo 25 years later: eight ways the eruption broke ground. EOS 97.
Wolfe, E. W., and Hoblitt, R. P. (1996). “Overview of the eruptions,” in Fire and Mud. Eruptions and lahars of Mount Pinatubo, Philippines, eds C. G. Newhall and R. S. Punongbayan (Seattle, WA: University of Washington Press), 3–20.
Yokohama, Y., and Seino, M. (2000). Geophysical comparison of the three eruptions in the 20th century of Usu volcano, Japan. Earth Planets Space 52, 73–89.
Yokoyama, I., Yamashita, H., Watanabe, H., and Okada, H. M. (1981). Geophysical characteristics of dacite volcanism – The 1977–1978 eruption of Usu volcano. J. Volcanol. Geotherm. Res. 9, 335–358. doi: 10.1016/0377-0273(81)90043-3
Young, S. R., Sparks, R. S., Aspinall, W. P., Lynch, L., Miller, A. D., Robertson, R. E. A., et al. (1998). Overview of the eruption of Soufriere Hills volcano, Montserrat, 18 July 1995 to December 1997. Geophys. Res. Lett. 25, 3389–3392. doi: 10.1029/98GL01405
Zobin, V. M. (1992). Volcanotectonic significance of the large earthquake of May 18, 1980 on. Volcanol. Seismol. 3, 63–72.
Zobin, V. M. (2017). Introduction to Volcanic Seismology, 3rd Edn. Amsterdam; New York, NY; Tokyo: Elsevier.
Zobin, V. M., Carrasco-Nuñez, G., and Vargas-Gutiérrez, V. (2016). Field and seismic evaluation of the block-and-ash flows emplaced from eruption columns of the 2005 Vulcanian explosions at Volcán de Colima, México. Bull. Volcanol. 78:27. doi: 10.1007/s00445-016-1019-2
Keywords: volcano seismology, eruption dynamics, magma ascent dynamics, seismicity and tectonics, volcanoes andesitic and dacitic
Citation: Zobin VM (2018) An Overview of the Dynamics of the Volcanic Paroxysmal Explosive Activity, and Related Seismicity, at Andesitic and Dacitic Volcanoes (1960–2010). Front. Earth Sci. 6:46. doi: 10.3389/feart.2018.00046
Received: 07 September 2017; Accepted: 13 April 2018;
Published: 03 May 2018.
Edited by:
Alessandro Bonaccorso, Istituto Nazionale di Geofisica e Vulcanologia (INGV), ItalyReviewed by:
Sonia Calvari, Istituto Nazionale di Geofisica e Vulcanologia (INGV), ItalyLuca D'Auria, Instituto Volcanológico de Canarias, INVOLCAN, Spain
Paul Davis, UCLA Department of Earth, Planetary, and Space Sciences, United States
Copyright © 2018 Zobin. This is an open-access article distributed under the terms of the Creative Commons Attribution License (CC BY). The use, distribution or reproduction in other forums is permitted, provided the original author(s) and the copyright owner are credited and that the original publication in this journal is cited, in accordance with accepted academic practice. No use, distribution or reproduction is permitted which does not comply with these terms.
*Correspondence: Vyacheslav M. Zobin, vzobin@ucol.mx