Rapid Surface Lowering of Benito Glacier, Northern Patagonian Icefield
 Jonathan C. Ryan
 Martin Sessions
 Ryan Wilson4
  Alun Hubbard
- 1Institute at Brown for Environment and Society, Brown University, Providence, RI, United States
- 2Department of Geography, University of California, Los Angeles, Los Angeles, CA, United States
- 3Consultant, Martin Sessions and Associates, Amaroo, ACT, Australia
- 4Department of Geography and Earth Sciences, Aberystwyth University, Aberystwyth, United Kingdom
- 5Colibri Ventura, Coyhaique, Chile
- 6Centre for Arctic Gas Hydrate, Environment and Climate, Department of Geology, UiT The Arctic University of Norway, Tromsø, Norway
The Patagonian Icefields, which straddle the Andes below 46°S, are two of the most sensitive ice masses on Earth to climate change. However, recent mass loss from the icefields along with its spatial and temporal variability is not well-constrained. Here we determine surface elevation changes of Benito Glacier, a 163 km2 outlet glacier draining the western flank of the North Patagonian Icefield, using a combination of field and satellite-derived elevation data acquired between 1973 and 2017. Our results demonstrate that just below the equilibrium line the glacier dramatically thinned by 133 m in the past 44 years, equivalent to a mean rate of 3.0 ± 0.2 m a−1. We also find that surface lowering was temporally variable, characterized by a hiatus between 2000 and 2013, and a subsequent increase up to 7.7 ± 3.0 m a−1 between 2013 and 2017. Analysis of Benito Glacier's flow regime throughout the period indicates that the observed surface lowering was caused by negative surface mass balance, rather than dynamic thinning. The high rate of surface lowering observed over the past half a decade highlights the extreme sensitivity of mid-latitude glaciers to recent atmospheric forcing.
Introduction
With a combined area and ice volume of 17,467 and 5,562 km3, respectively, the Northern and Southern Patagonian Icefields (NPI and SPI) are the largest temperate ice masses in the Southern Hemisphere, outside of Antarctica (Warren and Sugden, 1993; Carrivick et al., 2016). Since the end of the Little Ice Age (~1870), the outlet glaciers of the two icefields have generally thinned and retreated in response to negative surface mass balance and ice flow acceleration (Rosenblüth et al., 1997; Rignot et al., 2003; Harrison et al., 2007; Rasmussen et al., 2007; Masiokas et al., 2009; Glasser et al., 2011; Davies and Glasser, 2012). Excluding the Greenland and Antarctic Ice Sheets (and their peripheral glaciers and ice caps), the shrinkage of the NPI and SPI contributed 16% of global sea-level rise attributed to the cryosphere between 2003 and 2010, making the icefields the largest contributors to global sea-level rise per unit area (Chen et al., 2007; Jacob et al., 2012). Rignot et al. (2003) estimated that the NPI and SPI contributed 0.042 ± 0.002 mm a−1 to global sea levels between 1975 and 2000. Between 1995 and 2000, this increased to 0.105 ± 0.011 mm a−1 (Rignot et al., 2003) before decreasing to 0.064 ± 0.025 mm a−1 between 2003 and 2010 (Jacob et al., 2012).
The NPI (or Hielo Patagonico Norte) is the smaller of the two icefields, with a present day area of 4,152 km2 and ice volume of 1,235 km3 (Carrivick et al., 2016), and has accounted for 27% of the total mass loss from both the icefields since 1975 (Rignot et al., 2003; Rivera et al., 2007). The NPI is drained by 70 land- or lake-terminating glaciers, except for San Rafael which calves into a tidal lagoon (Rivera et al., 2007; Willis et al., 2012; Carrivick et al., 2016). The west side of the NPI is characterized by high accumulation rates due to a combination of moisture-laden westerlies from the Pacific Ocean and orographic precipitation over the central Andean ridge (Warren and Sugden, 1993; Harrison and Winchester, 2000; Hubbard et al., 2005). The high accumulation rates sustain the NPI even though air temperatures are positive over much of the icefield for large parts of the year (Rasmussen et al., 2007; Koppes et al., 2011). However, the low elevation termini and rapid mass turnover rates make the west side of the NPI sensitive to air temperature, which determines not only surface melt but also the fraction of precipitation that falls as snow (Warren and Sugden, 1993; Rasmussen et al., 2007; Koppes et al., 2011).
Comparisons between historical aerial photography and contemporary satellite imagery have allowed changes in NPI outlet glacier extent over the past 50 years to be calculated (e.g., Glasser et al., 2011; Davies and Glasser, 2012; Aniya, 2017). However, volume changes for the NPI remain generally unconstrained primarily due to the sparsity of long-term mass balance observations. To address this shortcoming, several studies have calculated geodetic mass balance changes using Digital Elevation Models (DEMs) derived from aerial photography and satellite data [either from Shuttle Radar Topography Mission (SRTM) or Advanced Spaceborne Thermal Emission and Reflection Radiometer (ASTER)]. Rignot et al. (2003) estimated that the NPI lost 3.2 km3 a−1 of volume between 1975 and 2000, whilst Rivera et al. (2007) found a more rapid rate of 5.7 km3 a−1 over a similar timeframe. More recently, Willis et al. (2012), Jaber et al. (2016), and Dussaillant et al. (2018) calculated a volume loss of between 4.1 and 4.7 km3 a−1 between 2000 and ~2012. These volume loss observations are characterized by substantial surface lowering which averaged ~1.8 m a−1 across the ablation zone of the NPI between 1975 and 2000 (Rivera et al., 2007).
Whilst it is well-known that the mass balance of the NPI has been persistently negative in the last few decades, the significant (~43%) discrepancy between the Rignot et al. (2003) and Rivera et al. (2007) estimates fail to establish whether volume loss has increased or decreased during the early twenty-first century. The spread of estimates is likely attributed to sensor- and target-related uncertainties associated with interferometry and photogrammetry over mountainous terrain. For example, the SRTM DEM is thought to have a specified accuracy of ±7 m whilst DEMs from historical aerial photographs and ASTER are between ±12 and ±26 m, respectively (Bamber and Rivera, 2007; Rivera et al., 2007). These errors preclude the analysis of short-term variability and trends, limiting understanding of glacier mass balance in response to regional climate change.
To address this, we compare two ground surveyed surface elevation profiles of Benito Glacier acquired in 1973 and 2017 (Figure 1). Benito Glacier was chosen due to its proximity to Kelly Inlet in the Golfo de Penas where the British Joint Forces Expedition were based during an unsuccessful attempt to ascend Monte San Valentin (4,058 m a.s.l.) between 1972 and 1973. In 1973, a glacier surface elevation profile was measured using a “Dumpy” level and staff and, in 2017, a repeat survey was conducted using a geodetic GPS system. By precise geo-referencing of the fixed survey stations established in 1973, the level-based survey was successfully tied to the World Geodetic System (WGS) and subsequent rates of surface lowering over a 44 year observation period were calculated. These surveyed profiles are supplemented with two satellite-derived DEMs derived from the SRTM and TanDEM-X missions acquired in 2000 and 2013, respectively. The field and satellite data together enable us to evaluate previous estimates of surface lowering using remote sensing techniques and determine temporal variability of ice thinning, thereby constraining whether rates of mass loss from Benito Glacier increased or increased during the twenty-first century.
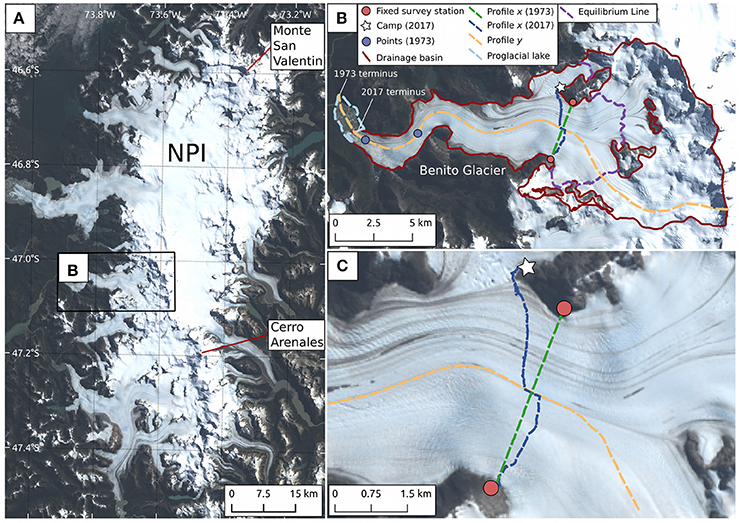
Figure 1. (A) True color Landsat 8 image of the Northern Patagonian Icefield on 12 March 2015. (B) Benito Glacier with location of the camp site, elevational profiles and fixed survey stations used in this study. The drainage basin was derived from the Global Land Ice Measurements from Space (GLIMS) database (Raup et al., 2007). (C) Zoomed location map showing location of the 1973 and 2017 elevation profiles and camp site.
Study Area
Benito Glacier has an area of 163 km2 making it the sixth largest outlet glacier in the NPI, after San Quintín, San Rafael, Glaciar Steffen, Colonia, and Acodado (Figure 1) (Carrivick et al., 2016). The main glacier trunk is fed by several small tributaries and is separated from the main NPI plateau by a semi-circular range of mountains in the vicinity of Cerro Arenales (3,437 m a.s.l.) (Figure 1B). Benito currently terminates into a fresh-water lake which has grown from ~1 km2 in 2001 to ~3 km2 in 2017. It has previously been identified as one of the most rapidly thinning glaciers in the NPI (Rignot et al., 2003; Rivera et al., 2007; Willis et al., 2012; Winchester et al., 2013) and the ablation zone of Benito was observed to have lowered by 3.0 m a−1 on average between 1975 and 2001 (Rivera et al., 2007). Between 1997 and 2011, surface lowering rates are thought to have remained constant (Willis et al., 2012). Thinning has though been shown to vary spatially, with mean thinning of 0.11 m a−1 determined within the accumulation zone between 2001 and 2011: an order of magnitude less than that observed in the ablation zone (Willis et al., 2012). In comparison, thinning near the glacier terminus proceeded at a rate of 4.3 m a−1 between 1973 and 2007 and 6.1 m a−1 between 2007 and 2011 (Winchester et al., 2013). In terms of area change, Benito Glacier experienced the most rapid shrinkage (0.33% a−1) between 1986 and 2001 but retreat was observed to slow markedly between 2007 and 2011 (Davies and Glasser, 2012; Aniya, 2017). Rivera et al. (2007) reported that the equilibrium line altitude (ELA) was 908 m a.s.l. in 2002, yielding an accumulation area ratio (AAR) of 0.57.
Methods
Field-Based Profiles 1973
In February 1973, the British Joint Forces Expedition surveyed an elevation profile of Benito Glacier between −47.0288°N, −73.7045°E, 833 m a.s.l. and −47.0629°N, −73.7227°E, 886 m a.s.l. using an NK01 “Dumpy” level. The profile was constructed through the measurement of 106 points at intervals between two fixed survey stations situated on the bedrock flanking the glacier (Figures 1B,C). The maximum distance between foresight and backsight was 80 m. Vertical accuracy of the measurements is based on the actual survey readings (± 0.1 m), together with possible navigation error of ± 5° over 80 m (± 0.5 m), and sinkage on compacted snow during sighting when related to the fixed end stations on rock (± 0.5 m). We estimate that our method has a relative accuracy of ± 0.7 m (√0.52 + 0.52 + 0.12). Additional uncertainty was involved when fixing the level-based survey to the WGS (next section) so we estimate that the uncertainty of the 1973 profile was ± 5.7 m (√5.02 + 0.72).
Field-Based Profiles 2017
In April 2017, the 1973 profile was re-traced and surveyed with two Trimble 5800 geodetic GPS receivers. One receiver was used as a base station at the field camp (Figures 1B,C) and was later tied to a permanent reference station called BN11 located the town of Coyhaique during post-processing. The other was attached to a backpack during a ~5 km traverse across the glacier (perpendicular to ice flow) in approximately the same location as the 1973 leveling profile [profile x (2017) in Figure 1C]. Measurements were recorded continuously at 5 s intervals during the traverse. We post-processed the points with RTKLIB and evaluate the accuracy of the survey to be ±50 cm. Extensive crevassing, which has developed since 1973, precluded following the precise route of the original survey across the glacier in 1973. To account for this source of uncertainty we adjusted our GPS measurements by calculating the distance between the two profiles using nearest neighbors and applying the glacier surface slope derived from TanDEM-X to calculate the vertical correction. Taking into account the accuracy of the elevation profile from TanDEM-X (± 2.1 m), we estimate that the April 2017 GPS survey had a vertical uncertainty of ± 2.6 m. Comparison between the 2017 and 1973 elevation profiles was achieved by tying the 1973 profile to the WGS using two fixed survey stations (cairns) erected in 1973 and subsequently identified in 2017 (Figures 1B,C). The fixed survey stations were resurveyed with the Trimble GPS for a minimum of 20 min with a sampling rate of 5 s. After post-processing, we estimate that these points have an uncertainty of ± 20 cm which is well within the relative uncertainty of the 1973 profile.
Satellite-Derived DEMs (2000 and 2013)
The field-based profiles were supplemented by two satellite-derived DEMs. The SRTM DEM was acquired from an 11-day flight in February 2000 and has a pixel resolution of 30 m. Bamber and Rivera (2007) found that the SRTM DEM has an absolute accuracy of ±7 m over the Patagonian Icefields. The TanDEM-X DEM (herein referred to just as TanDEM-X) has a pixel resolution of 12 m, which was subsequently resampled to 30 m for direct comparison with SRTM, and has a stated accuracy of less than ±10 m, although the validation is ongoing (Wessel, 2016). Comparison of the satellite-derived DEMs with GPS measurements at off-ice sites located on bedrock, yields a root-mean-square error (RMSE) of ±2.1 and ±19.4 m for the TanDEM-X and SRTM DEMs, respectively. The mean elevation of the SRTM DEM was systematically lower than the GPS survey with a median elevation difference of −15.2 m. We therefore added this offset to the SRTM DEM to reduce its error to ±4.2 m.
TanDEM-X pixel elevations are derived from two acquisitions from the same orbit, usually separated by a year. For high mountain areas, many acquisitions from multiple orbits are necessary to accurately fix pixel elevations. Four acquisitions were used to construct the DEM for Benito Glacier. We therefore included the earliest (January 2012) and latest (February 2014) acquisition dates when estimating the uncertainty of the surface lowering rates derived from TanDEM-X data (e.g., by dividing the magnitude of thinning between SRTM and TanDEM-X by 12 and 14 years) and used an average date for TanDEM-X acquisition time (i.e., February 2013). (Millan et al., 2015), found that TanDEM-X and a stereoscopic DEM derived from Pleiades showed good agreement over the French Alps, indicating that the X-band radar did not penetrate into ice, snow, or firn below 3500 m a.s.l. In addition, a recent study by Dussaillant et al. (2018) found no evidence for penetration of the SRTM C-band radar into NPI snow and firn below 2,900 m a.s.l.
To facilitate comparison between our surface lowering rates and previous studies, we calculated the mean rate of surface lowering across the ablation zone using additional surface elevation measurements acquired in 1973 (Figure 1B). The additional measurements were acquired at 2.1, 2.7, and 6.6 km from the glacier's 2017 snout using the same techniques described in the previous section [Field-Based Profiles 1973] and tied to the WGS in 2007 and 2011 (Winchester et al., 2013). We reconstructed the surface of the glacier in 1973 by fitting a third-order polynomial function through all the points measured in 1973. By differencing the polynomial profile from the SRTM and TanDEM-X DEMs we obtained an estimate for the average surface elevation change across the ablation zone of Benito Glacier (Table 1). Elevation changes from both field and satellite measurements were estimated in units of ice equivalent (Table 1).
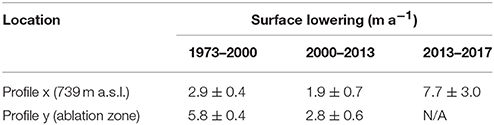
Table 1. Surface lowering rates for Benito Glacier between 1973 and 2017. Profiles x and y are located in Figure 1.
Satellite-Derived Surface Velocities
Glacier surface elevation changes can be attributed to net surface mass balance and/or mass flux redistribution due to ice flow (i.e., dynamic thinning or thickening). To determine if changes in ice flow were responsible for surface elevation changes, we measured surface velocity at three locations on Benito Glacier along Profile y (Figure 1B) by feature tracking 17 pairs of Level-1 Precision and Terrain corrected (L1TP) Landsat 7 and 8 images between March 2001 and April 2017 using the ImGRAFT toolbox (Messerli and Grinsted, 2015; available from http://imgraft.glaciology.net/home). The first site was located on the tongue of Benito Glacier < 1 km from the 2017 terminus position (Figure 1B). Another site was located ~4 km upstream of the terminus, in an area of the glacier where Willis et al. (2012) report a 0.6 m d−1 flow acceleration between 2007 and 2011. The third site was located at the center of profile x where the surface elevation profile was measured in 1973 and 2017 (Figure 1B). The Landsat image pairs were all ~1 year apart and, where possible, selected between January to April to maximize the area of bare ice exposure and trackable features. Square templates with widths of between 10 and 50 pixels were used depending on the time period between images and one pixel in every five was tracked. Strict correlation and signal-to-noise thresholds of 0.4 and 2 were used, respectively, to eliminate erroneous points and increase confidence in measured surface velocities. The uncertainty of the velocity measurements was estimated by sampling off-ice areas where we expected no horizontal movement. Over these areas, we calculate a mean off-ice horizontal displacement of ±0.04 m d−1. Additional validation was carried out by manually digitizing the movement of features such as medial moraines on the glacier surface. If the manually measured surface velocity was more than 0.5 m d−1 from the mean velocity derived from feature tracking, we discarded velocity measurements at that location.
Reanalysis Climate Data
The NCEP/NCAR Reanalysis product was used to investigate possible controls on surface lowering rates (Kalnay et al., 1996). Average monthly air temperature was extracted at 850 hPa for a region which completely encapsulates the NPI (50°S−40°S, 280°E−290°E). Air temperature at 850 hPa (~1,400 m a.s.l.) was chosen because it represents both large-scale atmospheric circulation patterns and local climate at interannual timescales and is therefore a useful indicator of not only the energy fluxes received by the glacier surface but also the fraction of precipitation falling as snow (Rasmussen et al., 2007; Garreaud et al., 2011; Koppes et al., 2011).
Results
The elevation profiles demonstrate that the surface of Benito Glacier, at 17 km from its terminus—just below the equilibrium line- lowered by 133 m between 1973 and 2017: equivalent to a mean rate of 3.0 ± 0.2 m a−1 (Table 1, Figure 2a). The magnitude of surface lowering is demonstrated by photographs taken in 1973 and 2017, where ice wastage and subsequent enlargement of rocky outcrops and areas of ice marginal bedrock are clearly depicted (Figure 3). However, surface lowering varies temporally, with thinning occurring at a rate of 2.9 ± 0.4 m a−1 between 1973 and 2000, 1.9 ± 0.7 m a−1 between 2000 and 2013, and 7.7 ± 3.0 m a−1 between 2013 and 2017 (Table 1, Figures 2a,c). Across the ablation zone, we estimate that the Benito Glacier had a mean thinning rate of 5.8 ± 0.4 m a−1 between 1973 and 2000 and 2.8 ± 0.6 m a−1 between 2000 and 2013 (Figure 2b). These rates are higher than those measured at our cross-profile transect because of the lapse rate between air temperature and elevation and the fact that ~70% of the ablation zone persists at elevations lower than 739 m a.s.l. (profile x in Figure 1A) (Table 1).
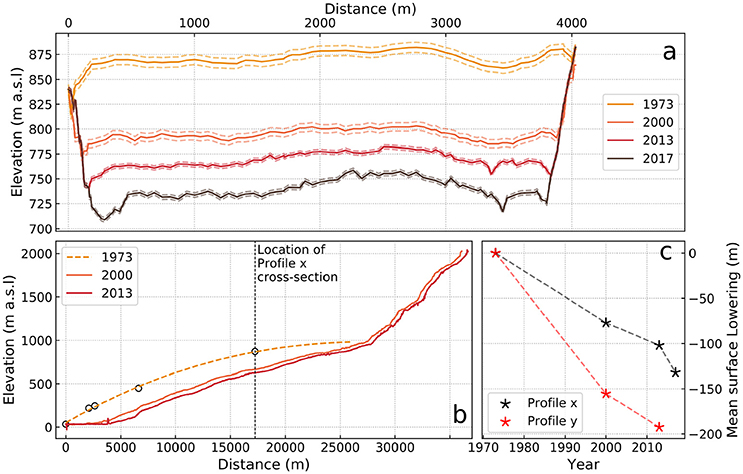
Figure 2. (a) Cross-sectional surface elevation across Profile x between 1973 and 2017. Dashed lines indicate uncertainty. (b) Same as (a) but for the longitudinal Profile y. The points used to construct the 1973 longitudinal profile are shown in Figure 1B. (c) Magnitude of surface lowering based on Profile x and y. The profiles are located in Figure 1B.
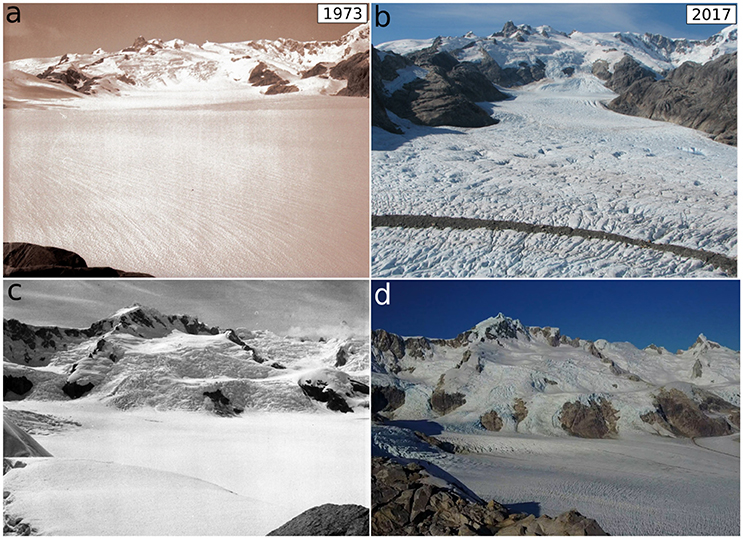
Figure 3. Photographs taken from the British Joint Forces Expedition in 1973 and again in 2017 demonstrate changes in glacier surface elevation. (a,b) Looking east-northeast at the northern tributary that flows into the main truck of Benito Glacier near our field camp (Figure 1B). (c,d) Looking directly east toward the semi-circular range of unnamed mountains that surround Benito Glacier.
The flow regime of Benito Glacier remained relatively stable between 2001 and 2017 (Figure 4). At the cross-sectional profile (profile x; Figure 1A), we find displacement rates of 0.53 to 0.78 ± 0.04 m d−1, which are very similar to those derived by Willis et al. (2012) from ASTER imagery acquired between 2001 and 2011. At the terminus, we find surface velocities of 0.36 to 0.47 ± 0.04 m d−1 (Figure 4) which agree with those observed by Winchester et al. (2013) who measured velocity with stakes near the tongue of Benito in 1973 and 2007. Finally, at 4 km from the terminus where the glacier is steepest, we determine ice flow to be between 0.72 and 0.89 ± 0.04 m d−1 (Figure 4). In this location, Willis et al. (2012) report a 0.6 m d−1 flow acceleration between 02 and 25 January 2011. However, this event appears to have been short-term, and possibly compensated by a subsequent flow deceleration, because we find no significant increase in flow between 04 March 2010 and 19 February 2011 or during the period between 2007 and 2011. Instead, our results indicate that the glacier tongue flowed at a relatively constant speed between 2001 and 2017, and is likely flowing at the same speed as it did in 1973 based on the results from Winchester et al. (2013).
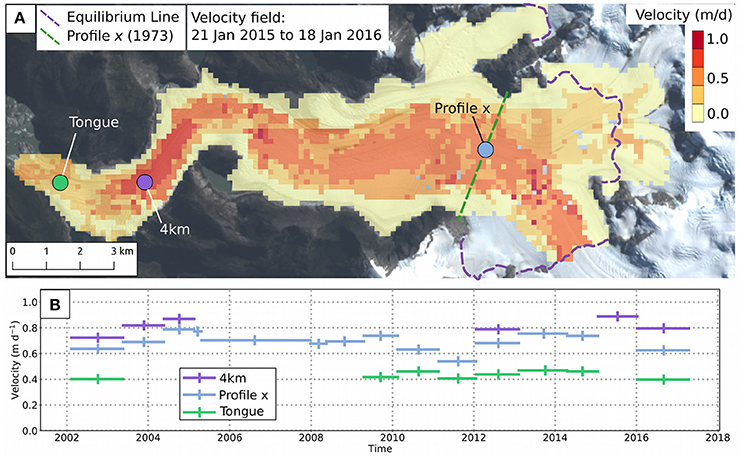
Figure 4. (A) Surface velocity field of Benito Glacier produced from two Landsat 8 images acquired on 21 January 2015 and 18 January 2016. Colored circles show the locations of the three sites where velocity was sampled between 2001 and 2017. The temporal changes in surface velocity at the three sites are displayed in (B). Horizontal bars represent the average velocity between two Landsat images. Uncertainties are represented by the vertical bars.
Discussion
Previous studies suggest that the general retreat and thinning of glaciers in Patagonia is a response to higher air temperatures (Rasmussen et al., 2007; Masiokas et al., 2008; Koppes et al., 2011) and/or ice flow acceleration due to the growth of proglacial lakes and increased calving rates (e.g., Harrison and Winchester, 2000; Rignot et al., 2003; Rivera et al., 2007; Willis et al., 2012). Despite Benito's proglacial lake increasing in area since 1973 (Figure 1), we discount the latter due to the lack of evidence for any significant increase in ice flow speed. Instead, the rapid surface lowering in the ablation zone of Benito Glacier between 1973 and 2017 appears to be predominantly controlled by surface mass balance. We find that average annual air temperatures at 850 hPa have increased at a rate of 0.2°C per decade since 1960 (Figure 5), which is in agreement with weather station and other reanalysis datasets (Rosenblüth et al., 1997; Rasmussen et al., 2007; Masiokas et al., 2008; Koppes et al., 2011). In particular, summer air temperatures have risen at 0.3°C per decade indicating that surface ablation is now more intense than it was half a decade ago (Figure 5). Whilst precipitation volume has remained constant between 1970 and 2000, warmer air temperatures will have increased the fraction of precipitation falling as rain, reducing accumulation rates (Rasmussen et al., 2007). Since 1979, we find that average winter air temperatures at 850 hPa have increased from −1.1 to −0.1°C. In addition, half the winters since 1979 have positive mean air temperatures (Figure 5). These results concur with microwave measurements which indicate consistently wet surface conditions over Benito Glacier during winter in the last decade (Willis et al., 2012). The wet surface conditions confirm ongoing melt during the winter, but also indicate a general loss of snowfall. It is therefore likely that a combination of processes have driven the rapid rates of surface lowering at Benito between 1973 and 2017. The negative surface mass balance of Benito Glacier is also reflected by the fact that it has one of the lowest AARs in the NPI, limiting its ability to sufficiently replenish mass during periods of higher than average snowfall (Figure 5) (e.g., Furbish and Andrews, 1984; De Angelis, 2014).
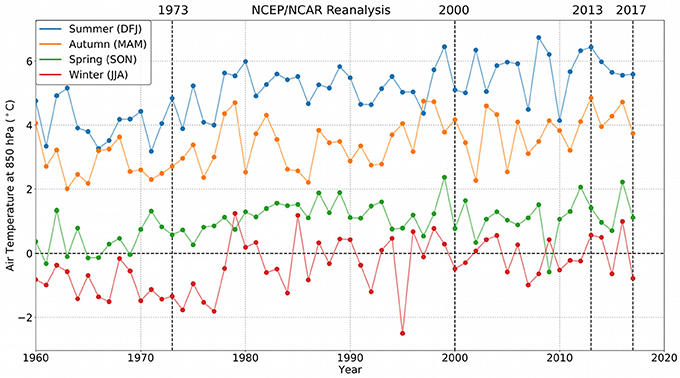
Figure 5. Seasonally averaged air temperatures at 850 hPa between 1960 and 2017 in the Patagonia region (50–40°S, 280–290°E) from the NCEP/NCAR Reanalysis product (Kalnay et al., 1996).
The inventories compiled by Rignot et al. (2003), Rivera et al. (2007), and Willis et al. (2012) indicate that other westward-flowing glaciers that drain the NPI, such as Gualas, HPN-1, and Acodado, have experienced similar magnitudes of surface lowering between the 1970s and 2010s. Hence, Benito Glacier may not be unique among other western NPI outlet glaciers which have also experienced rates of surface lowering similar to those identified in this study (Rignot et al., 2003; Rivera et al., 2007; Willis et al., 2012; Dussaillant et al., 2018). Rapid mass turnover rates allow these temperate glaciers to persist at low elevations. However, because the bulk of their area is located below the ELA (Rivera et al., 2007), the surface mass balance of these glaciers is extremely sensitive causing them to rapidly respond to changes in air temperature (De Angelis, 2014). Glaciers draining the eastern flank of the NPI, on the leeward side of the Andes, receive less than half the precipitation than those on the western flank and terminate at higher elevations (Warren and Sugden, 1993; Willis et al., 2012). Despite these differences, rates of surface lowering are actually quite similar (eastward-flowing glaciers averaged −1.8 m a−1 between 1975 and 2001, whilst westward-flowing glaciers averaged −2.3 m a−1) (Rivera et al., 2007). This similarity suggests that the outlet glaciers across the NPI are in substantial negative surface mass balance.
Whilst the sensitivity of NPI outlet glaciers to regional climate change has often been described, there has been little evidence for variability in surface lowering through time due to uncertainties associated with the use of remotely sensed DEMs (of around ±1 m a−1) and the multi-decadal intervals between them (Bamber and Rivera, 2007). For example, Rivera et al. (2007) suggested that Benito Glacier thinned by 3.0 m a−1 between 1975 and 2000, which is similar to the 3.0–3.2 m a−1 measured by Willis et al. (2012) between 1997 and 2011. Our study reveals that rates of surface lowering may be much more variable than previously thought. We find that Benito thinned by 2.9 ± 0.4 m a−1 between 1973 and 2000 and 1.9 ± 0.7 m a−1 between 2000 and 2013 (equivalent to 5.8 ± 0.4 m a−1 and 2.8 ± 0.6 m a−1 when averaged across the whole ablation zone, Figure 2b). The reduction in surface lowering between 2000 and 2013 coincides with slightly cooler average winter and spring air temperatures at 850 hPa (0.1 and 0.3°C, respectively) between 2000 and 2013 compared to the 1979–1999 period (Figure 5). Furthermore, Schaefer et al. (2013) report that this period was characterized by increased accumulation. The slight cooling and increased snowfall appears to have rapidly reduced rates of surface lowering between 2000 and 2013.
In the last 4 years (2013–2017), rates of surface lowering increased to 7.7 ± 3.0 m a−1: more than doubling in comparison to the 1973–2000 period and quadrupling in comparison to the 2000–2013 period (Figure 2c). This period was characterized by the highest average annual air temperatures in the reanalysis record (i.e., since 1960) including anomalously warm autumn and winter (0.6 and 0.2°C warmer than the 2000–2013 period, respectively) (Figure 5). Our results also demonstrate that variable surface lowering rates can occur without a change in flow regime, which highlights the sensitivity of Benito Glacier surface mass balance to atmospheric forcing. This behavior is similar to that identified by Gardner et al. (2011) for glaciers in the Canadian Arctic which experienced a similar episode of enhanced mass loss between 2004 and 2009 and contributes to a growing body of observational evidence demonstrating how vulnerable mountain glaciers and ice caps are to climate change (Arendt et al., 2002; Kaser et al., 2006; Zemp et al., 2009; Nuth et al., 2010). Modeling projections into the latter twenty-first century indicate that ablation will further increase and snowfall will decrease over the NPI due to higher temperatures (Schaefer et al., 2013). The Patagonian Icefields are therefore set to continue losing mass at an accelerating rate in the twenty-first century, and may become a leading contributor to the eustatic sea-level rise attributed to mountain glaciers and ice caps (e.g., Meier et al., 2007; Jacob et al., 2012; Gardner et al., 2013).
Conclusions
By combining direct field measurements with satellite-derived DEMs, we demonstrate that Benito Glacier has experienced rapid but temporally variable surface lowering between 1973 and 2017. Although there was a short hiatus in surface lowering between 2000 and 2013, our study finds that the glacier lowered at a faster rate in the last five years, well above the long-term (last ~50 years) average. The lack of any significant change in surface flow regime indicates that the surface lowering was predominantly controlled by negative surface mass balance, rather than dynamic thinning. It remains to be seen whether Benito is representative of other glaciers in the NPI, or whether these current rates are unprecedented, as there are relatively few direct measurements of surface lowering from other sectors of the icefield. To improve our knowledge of the processes driving these changes, further field studies and the installation of glacier and climate monitoring networks are required.
Author Contributions
JR assisted with field data collection in 2017, analyzed the satellite and field data, made the figures and wrote the manuscript; MS collected the field data in 1973, funded and co-led the 2017 field data collection, and edited the manuscript; RW provided conceptual advice and edited the manuscript; OW co-led the 2017 fieldwork and collected the GPS data, and edited the manuscript; AH provided supervision, conceptual advice and edited the manuscript.
Conflict of Interest Statement
The authors declare that the research was conducted in the absence of any commercial or financial relationships that could be construed as a potential conflict of interest.
Acknowledgments
JR is funded by the NASA Cryosphere Program grant NNX14AH93G. AH acknowledges support from the Centre for Arctic Gas Hydrate, Environment and Climate, funded by the Research Council of Norway through its Centres of Excellence (No. 223259). As part of the Glacial hazards in Chile: processes, assessment, mitigation and risk management project RW was jointly funded by the UK Natural Environment Research Council (NERC) (grant NE/N020693/1) and the Chilean Natural Commission for Scientific and Technological Research (CONICYT) (grant MR/N026462/1). Marcos Gómez Cole, Mark Sessions provided invaluable assistance at the 2017 field camp. Jammie Valdivia Cerda was integral to expedition planning and supported the 2017 expedition. We thank the TerraSAR-X/TanDEM-X Science Team for providing TanDEM-X data over our study area. The Landsat L1 products were retrieved from USGS EarthExplorer, courtesy of the NASA EOSDIS Land Processes Distributed Active Archive Center (LP DAAC), USGS/Earth Resources Observation and Science (EROS) Center, Sioux Falls, South Dakota, https://earthexplorer.usgs.gov/. Graham Hornsey of Coyhaique—XI Región Chile is thanked for equipment support. Gabriela Gómez, Guarda Parques de CONAF (Corporacion Nacional Forestal, Chile), Unidad Parque Nacional Laguna San Rafael provided sponsorship and approvals for fieldwork in the National Park. Salmones Cupquelan—a Cooke Aquaculture Company, especially Don Daniel Quiroz Gerente Técnico, Don Robinson Cárcamo, Don Diego Ulloa, and the crews of Reloncaví II and Saurak are thanked for providing transport to the base camp. Likewise, we thank Discovery Air Chile, especially our pilot Don Rodrigo Espinoza, for transport to field camp. From Joint Services Expedition to Chilean Patagonia, 1972-73, we thank the surveyors Teuch Brewer and Bill Skelson together with the leader Crispin Agnew and all other members of the expedition.
References
Aniya, M. (2017). Glacier variations of Hielo Patagónico Norte, Chile, over 70 years from 1945 to 2015. Bull. Glaciol. Res. 35, 19–38. doi: 10.5331/bgr.17R01
Arendt, A. A., Keith Echelmeyer, A., William Harrison, D., Craig Lingle, S., and Virginia Valentine, B. (2002). Rapid wastage of Alaska glaciers and their contribution to rising sea level. Science 297, 382–386. doi: 10.1126/science.1072497
Bamber, J. L., and Rivera, A. (2007). A review of remote sensing methods for glacier mass balance determination. Glob. Planet. Change 59, 138–148. doi: 10.1016/j.gloplacha.2006.11.031
Carrivick, J. L., Davies, B. J., James, W. H., Quincey, D. J., and Glasser, N. F. (2016). Distributed ice thickness and glacier volume in southern South America. Glob. Planet. Change 146, 122–132, doi: 10.1016/j.gloplacha.2016.09.010
Chen, J. L., Wilson, C. R., Tapley, B. D., Blankenship, D. D., and Ivins, E. R. (2007). Patagonia icefield melting observed by gravity recovery and climate experiment (GRACE). Geophys. Res. Lett. 34. doi: 10.1029/2007GL031871
Davies, B. J., and Glasser, N. F. (2012). Accelerating shrinkage of Patagonian glaciers from the Little Ice Age (~AD 1870) to 2011. J. Glaciol. 58, 1063–1084. doi: 10.3189/2012JoG12J026
De Angelis, H. (2014). Hypsometry and sensitivity of the mass balance to changes in equilibrium-line altitude: the case of the Southern Patagonia Icefield. J. Glaciol. 60, 15–28. doi: 10.3189/2014JoG13J127
Dussaillant, I., Berthier, E., and Brun, F. (2018). Geodetic mass balance of the Northern Patagonian Icefield from 2000 to 2012 using two independent methods. Front. Earth Sci. 6:8. doi: 10.3389/feart.2018.00008
Furbish, D. J., and Andrews, J. T. (1984). The use of hypsometry to indicate long-term stability and response of valley glaciers to changes in mass transfer. J. Glaciol. 30, 199–211. doi: 10.1017/S0022143000005931
Gardner, A. S., Moholdt, G., Cogley, J. G., Wouters, B., Arendt, A. A., Wahr, J., et al. (2013). A reconciled estimate of glacier contributions to sea level rise: 2003 to 2009. Science 340, 852–857. doi: 10.1126/science.1234532
Gardner, A. S., Moholdt, G., Wouters, B., Wolken, G. J., Burgess, D. O., Sharp, M. J., et al. (2011). Sharply increased mass loss from glaciers and ice caps in the Canadian Arctic Archipelago. Nature 473, 357–360. doi: 10.1038/nature10089
Garreaud, R., Lopez, P., Minvielle, M., and Rojas, M. (2011). Large-scale control on the patagonian climate. J. Clim. 26, 215–230. doi: 10.1175/JCLI-D-12-00001.1
Glasser, N. F., Harrison, S., Jansson, K. N., Anderson, K., and Cowley, A. (2011). Global sea-level contribution from the patagonian icefields since the little ice age maximum. Nat. Geosci. 4:303. doi: 10.1038/NGEO1122
Harrison, S., and Winchester, V. (2000). Nineteenth-and twentieth-century glacier fluctuations and climatic implications in the Arco and Colonia valleys. Hielo Patagónico Norte Chile Arct. Antart. Alp. Res. 32, 55–63. doi: 10.2307/1552410
Harrison, S., Winchester, V., and Glasser, N. (2007). The timing and nature of recession of outlet glaciers of Hielo Patagónico Norte, Chile, from their Neoglacial IV (Little Ice Age) maximum positions. Glob. Planet. Change 59, 67–78. doi: 10.1016/j.gloplacha.2006.11.020
Hubbard, A., Hein, A., Kaplan, M., Hulton, N., and Glasser, N. (2005). A modelling reconstruction of the last glacial maximum ice sheet and its deglaciation in the vicinity of the Northern Patagonian Icefield, South America. Geografiska Ann. 87, 375–391. doi: 10.1111/j.0435-3676.2005.00264.x
Jaber, W. A., Floricioiu, D., and Rott, H. (2016). “Geodetic mass balance of the Patagonian Icefields derived from SRTM and TanDEM-X data,” in International Geoscience and Remote Sensing Symposium (IGARSS) (Beijing).
Jacob, T., Wahr, J., Pfeffer, W. T., and Swenson, S. (2012). Recent contributions of glaciers and ice caps to sea level rise. Nature 482, 514–518. doi: 10.1038/nature10847
Kalnay, E., Kanamitsu, M., Kistler, R., Collins, W., Deaven, D., Gandin, L., et al. (1996). The NCEP/NCAR 40-year reanalysis project. B. Am. Meteorol. Soc. 77, 437–471. doi: 10.1175/1520-0477(1996)077<0437:TNYRP>2.0.CO;2
Kaser, G., Cogley, J. G., Dyurgerov, M. B., Meier, M. F., and Ohmura, A. (2006). Mass balance of glaciers and ice caps: consensus estimates for 1961–2004. Geophys. Res. Lett. 33:L19501. doi: 10.1029/2006GL027511
Koppes, M., Conway, H., Rasmussen, L. A., and Chernos, M. (2011). Deriving mass balance and calving variations from reanalysis data and sparse observations, Glaciar San Rafael, northern Patagonia, 1950–2005. Cryosphere 5, 791–808. doi: 10.5194/tc-5-791-2011
Masiokas, M. H., Rivera, A., Espizua, L. E., Villalba, R., Delgado, S., and Aravena, J. C. (2009). Glacier fluctuations in extratropical South America during the past 1000 years. Palaeogeogr. Palaeoclimatol. Palaeoecol. 281, 242–268. doi: 10.1016/j.palaeo.2009.08.006
Masiokas, M. H., Villalba, R., Luckman, B. H., Lascano, M. E., Delgado, S., and Stepanek, P. (2008). 20th-century glacier recession and regional hydroclimatic changes in northwestern Patagonia. Glob. Planet. Change 60, 85–100. doi: 10.1016/j.gloplacha.2006.07.031
Meier, M. F., Dyurgerov, M. B., Rick, U. K., O'Neel, S., Pfeffer, W. T., Anderson, R. S., et al. (2007). Glaciers dominate eustatic sea-level rise in the 21st century. Science 317, 1064–1067. doi: 10.1126/science.1143906
Messerli, A., and Grinsted, A. (2015). Image georectification and feature tracking toolbox: ImGRAFT. Geosci. Instrument. Methods Data Syst. 4, 23–34. doi: 10.5194/gi-4-23-2015
Millan, R., Dehecq, A., Trouvé, E., Gourmelen, N., and Berthier, E. (2015). “Elevation changes and X- band ice and snow penetration inferred from TanDEM-X data of the Mont-Blanc area,” in Analysis of Multitemporal Remote Sensing Images (Multi-Temp), 8th International Workshop on the 1-4 (IEEE).
Nuth, C. G., Moholdt, K. J., Hagen, J. O., and Kääb, A. (2010). Svalbard glacier elevation changes and contribution to sea level rise. J. Geophys. Res. 115:F01008. doi: 10.1029/2008JF001223
Rasmussen, L. A., Conway, H., and Raymond, C. F. (2007). Influence of upper air conditions on the Patagonia icefields. Glob. Planet. Change 59, 203–216. doi: 10.1016/j.gloplacha.2006.11.025
Raup, B. H., Racoviteanu, A., Khalsa, S. J. S., Helm, C., Armstrong, R., and Arnaud, Y. (2007). The GLIMS Geospatial Glacier Database: a new tool for studying glacier change. Glob. Planet. Change 56, 101–110. doi: 10.1016/j.gloplacha.2006.07.018
Rignot, E., Rivera, A., and Casassa, G. (2003). Contribution of the Patagonia Icefields of South America to sea level rise. Science 302, 434–437. doi: 10.1126/science.1087393
Rivera, A., Benham, T., Casassa, G., Bamber, J., and Dowdeswell, J. A. (2007). Ice elevation and areal changes of glaciers from the Northern Patagonia Icefield, Chile. Glob. Planet. Change 59, 126–137. doi: 10.1016/j.gloplacha.2006.11.037
Rosenblüth, B., Fuenzalida, H. A., and Aceituno, P. (1997). Recent temperature variations in southern South America. Int. J. Climatol. 17, 67–85. doi: 10.1002/(SICI)1097-0088(199701)17:1<67::AID-JOC120>3.0.CO;2-G
Schaefer, M., Machguth, H., Falvey, M., and Casassa, G. (2013). Modeling past and future surface mass balance of the Northern Patagonia Icefield. J. Geophys. Res. 118, 571–588. doi: 10.1002/jgrf.20038
Warren, C. R., and Sugden, D. E. (1993). The Patagonian Icefields: a glaciological review. Arct. Alp. Res. 25, 316–331. doi: 10.2307/1551915
Wessel, B. (2016). TanDEM-X Ground Segment - DEM Products Specification Document, EOC, DLR, Oberpfaffenhofen, Germany, Public Document TD-GS-PS-0021, Issue 3.1. Available online at: https://tandemx-science.dlr.de/
Willis, M. J., Melkonian, A. K., Pritchard, M. E., and Ramage, J. M. (2012). Ice loss rates at the Northern Patagonian Icefield derived using a decade of satellite remote sensing. Remote Sens. Environ. 117, 184–198. doi: 10.1016/j.rse.2011.09.017
Winchester, V., Sessions, M., Cerda, J. V., Wündrich, O., Clemmens, S., Glasser, N. F., et al. (2013). Post-1850 changes in Glacier Benito, North Patagonian Icefield, Chile. Geografiska Ann. 96, 43–59. doi: 10.1111/geoa.12027
Keywords: Northern Patagonian Icefield, Patagonia, mountain glaciers, climate change, remote sensing, surface mass balance, surface lowering, GPS
Citation: Ryan JC, Sessions M, Wilson R, Wündrich O and Hubbard A (2018) Rapid Surface Lowering of Benito Glacier, Northern Patagonian Icefield. Front. Earth Sci. 6:47. doi: 10.3389/feart.2018.00047
Received: 26 January 2018; Accepted: 13 April 2018;
Published: 01 May 2018.
Edited by:
Matthias Huss, ETH Zürich, SwitzerlandReviewed by:
Shun Tsutaki, The University of Tokyo, JapanNicholas Barrand, University of Birmingham, United Kingdom
Copyright © 2018 Ryan, Sessions, Wilson, Wündrich and Hubbard. This is an open-access article distributed under the terms of the Creative Commons Attribution License (CC BY). The use, distribution or reproduction in other forums is permitted, provided the original author(s) and the copyright owner are credited and that the original publication in this journal is cited, in accordance with accepted academic practice. No use, distribution or reproduction is permitted which does not comply with these terms.
*Correspondence: Alun Hubbard, abh@aber.ac.uk
Jonathan C. Ryan, jonathan_ryan@brown.edu