Single-Station Seismo-Acoustic Monitoring of Nyiragongo's Lava Lake Activity (D.R. Congo)
 Julien Barrière1*
  Nicolas d'Oreye1,2
  Adrien Oth1
  Halldor Geirsson3 Niche Mashagiro4 Jeffrey B. Johnson5
  Benoît Smets6
  Sergey Samsonov7 François Kervyn6
- 1European Center for Geodynamics and Seismology, Walferdange, Luxembourg
- 2National Museum of Natural History, Walferdange, Luxembourg
- 3School of Engineering and Natural Sciences, University of Iceland, Reykjavik, Iceland
- 4Seismology Department, Goma Volcano Observatory, Goma, Democratic Republic of Congo
- 5Boise State University, Boise, ID, United States
- 6Royal Museum for Central Africa, Tervuren, Belgium
- 7Natural Resources Canada, Ottawa, ON, Canada
Since its last effusive eruption in 2002, Nyiragongo has been an open-vent volcano characterized by the world's largest persistent lava lake. This lava lake provides a unique opportunity to detect pressure change in the magmatic system by analyzing its level fluctuations. We demonstrate that this information is contained in the seismic and infrasound signals generated by the lava lake's activity. The continuous seismo-acoustic monitoring permits quantification of lava lake dynamics, which is analyzed retrospectively to identify periods of volcanic unrest. Synchronous, high-resolution satellite SAR (Synthetic Aperture Radar) images are used to constrain lava lake level by measuring the length of the SAR shadow cast by the rim of the pit crater where the lava lake is located. Seventy-two estimations of the lava lake level were obtained with this technique between August 2016 and November 2017. These sporadic measurements allow for a better interpretation of the continuous infrasound and seismic data recorded at the closest station (~6 km from the crater). Jointly analyzed seismo-acoustic and SAR data reveal that slight changes in the spectral properties of the continuous cross-correlated low-frequency seismo-acoustic records (and not solely single events) can be used to track fluctuations of the lava lake level on a daily and hourly basis. We observe that drops of the lava lake and the appearance of significant long period (LP) “lava lake” events are a consequence of a probable deep lateral magma intrusion beneath Nyiragongo, which induces changes in its shallow plumbing system. In addition to contributing to understanding lava lake dynamics, this study highlights the potential to continuously monitor pressure fluctuations within the magmatic system using a single seismo-acoustic station located several kilometers from the vent.
Introduction
Nyiragongo volcano in North Kivu (D.R. Congo) is among the most active volcanoes on Earth (Wright et al., 2015), with a persistent lava lake from at least between 1928 and 1977 and since 2002 (Smets, 2016). The two last effusive eruptions occurred in 1977 and 2002 and consisted of flank eruptions with high-velocity lava flows to the south toward the city of Goma (see Figure 1A). During the eruption in 2002, which caused a major humanitarian crisis (Allard et al., 2002; Baxter and Ancia, 2002; Komorowski et al., 2004), the crater emptied of lava and its depth was evaluated between 600 and 800 m (e.g., Smets, 2016). About 4 months after the eruption, the crater filled up to reach a crater floor elevation of ~3050 m above sea level. Since then, the lava lake remains at high level (i.e., level of the inner crater floor, ~400 meters below the rim) with intermittent several decameter-scale rises or falls (see Figure 1B). As observed by Patrick et al. (2015) using tilt, GPS summit measurements and lava lake depth estimates from camera images for successive 2011 eruptive events on the East Rift Zone in Hawaii, Kilauea's lava lake acts as a piezometer for monitoring the magmatic reservoir. Inflation periods are associated with an increasing lake level while the deflation process due to magma escaping from the summit magma column (i.e., the eruptive event) is clearly visible through the drop of the lava lake level. A similar mechanism is thought to be responsible for the lateral drainage of magma from the lava lake at Nyiragongo during its last 2002 eruption (Wauthier et al., 2012). During short-term expeditions carried out since 2011, quantitative observations using close-range photogrammetry and a stereographic time-lapse camera (STLC) system have provided decisive insights into the recent lava lake level fluctuations of various amplitude and time scale (Smets et al., 2016). In order to use time-lapse camera observations in a monitoring context, the equipment requires a safe, permanent installation at the summit, adapted protections mostly against acid and humidity, and efficient data transfer capacity for real-time usage. At present, these requirements cannot be fulfilled at Nyiragongo and despite its strong potential, such a technique cannot yet be considered as a practicable monitoring tool for this volcano.
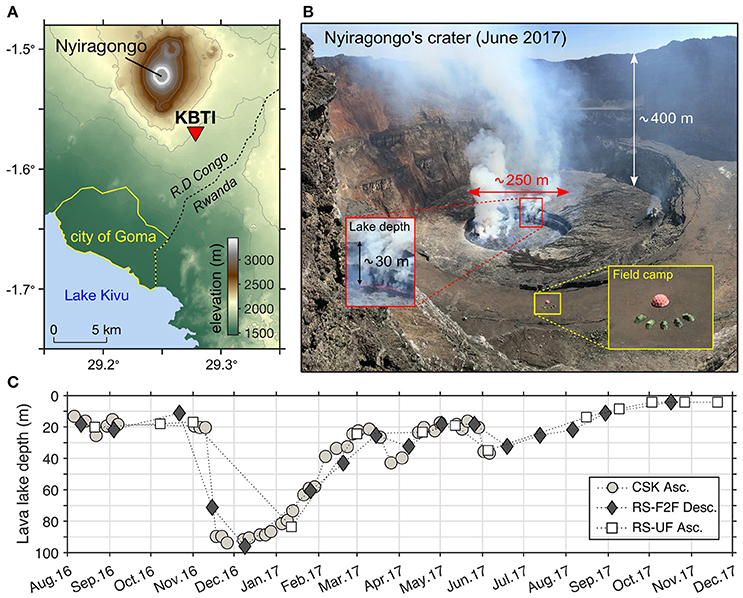
Figure 1. (A) Map depicting Nyiragongo volcano, the city limits of Goma and the station KBTI equipped with a broadband seismometer and infrasound sensors. (B) Picture of Nyiragongo's crater taken on 11 June 2017 (Nicolas d'Oreye). The zoom into the field camp (joint expedition with a BBC television team) allows to gauge the scale of the crater. The zoom into the lava lake depth corresponds to the height measured with the SAR technique. (C) Estimated lava lake depth from SAR processing using CosmoSkyMed (CSK) and RADARSAT (RS-F2F and RS-UF) images. “Asc” and “Desc.” refer to ascending and descending orbits, respectively.
Monitoring seismicity is probably the most common geophysical application used at volcanoes and more recently, studying volcano infrasound has gained considerable interest (Johnson and Ripepe, 2011; Garcés et al., 2013 and references therein). Combining these two approaches could bring important constraints on the studied sources processes, i.e., the so-called seismo-acoustic sources generated in the vicinity of the boundary between the solid Earth and the atmosphere (Arrowsmith et al., 2010). It is now well-known that variations of (near-) surface activity at active volcanoes, either effusive or explosive, can be efficiently monitored by analyzing the coupled infrasound and seismic signals (e.g., Matoza et al., 2009, 2010; Ichihara et al., 2012; Richardson and Waite, 2013; Ulivieri et al., 2013). The seismicity characteristics of Nyiragongo and, more generally, of the entire Virunga Volcanic Province (VVP), are not very well known because of the lack of a permanent, local monitoring infrastructure until recently (Pagliuca et al., 2009; Oth et al., 2017). There is very little knowledge of the seismic activity preceding the two last eruptions in 1977 and 2002, such as sequences of tremor and volcano-tectonic activity recorded by only two analog seismometers in 2001–2002, thus preventing the understanding and the detection of similar pre-eruptive processes (Kavotha et al., 2002; Komorowski et al., 2004). The most significant seismic studies for the area in the past decade are: the analysis of teleseismic events associated to Nyiragongo after the 2002 eruption (Shuler and Ekström, 2009); a first multi-method approach encompassing crustal seismic velocity structure, volcano seismicity and seismic hazard assessment in the Kivu rift (Mavonga et al., 2010); a review article on multidisciplinary monitoring of pre- and co-eruptive processes at Nyamulagira, a neighboring highly active volcano, including data from one short-period digital seismic station and one analog seismometer (Smets et al., 2014); and passive and active seismic surveys during temporary experiments for studying the eastern Kivu rift structure on the Rwandan side (Wood et al., 2015).
The progressive deployment of a new local broadband seismic network, mostly between 2015 and 2017, has already provided some important and new insights into seismicity patterns accompanying Nyiragongo's activity (Barrière et al., 2017; Oth et al., 2017). These first studies have notably allowed for the detection and location of a continuous background, low-frequency (< 1 Hz) seismic tremor source at Nyiragongo volcano, most likely related to spattering activity of the persistent lava lake such as observed at Kilauea volcano (Patrick et al., 2016). For the specific case of lava lake volcanoes, variations of the lake level should influence the acoustic resonance in the upper air column within the crater. This means that a deeper lava lake would decrease the infrasonic dominant frequency, as suggested for instance at Kilauea by Fee et al. (2010) using an acoustic Helmholtz resonator model at Halema'uma'u crater. Other type of flow-induced resonance was described at the neighboring Pu‘u O‘o crater complex by Matoza et al. (2010). Recently, Richardson et al. (2014) showed that the lava lake fluctuations at Villarrica volcano may be inferred by the joint analysis of long-period seismo-acoustic single events and continuous tremor. This observation is therefore particularly relevant in the case of Nyiragongo for studying the activity of its lava lake. Since late 2016, the increased number of highly similar, discrete, long-period (LP) seismic events and their infrasound counterparts have accompanied decameter-scale oscillations of the lava lake level, which relate to major pressure changes in the upper magmatic system and at least one probable intrusion event. In this study, we will exploit seismic and infrasound records collected at a single station (KBTI, see Figure 1A) in order to extract a reliable seismo-acoustic signature of the lava lake activity, the latter being mostly characterized by its level fluctuations estimated using a SAR-based method (Figure 1C). In addition to lava lake estimates on a daily basis, we show that the presented approach also allows for a rapid quantification of strong variations of the lava lake level on an hourly time scale.
Materials and Methods
Nyiragongo's Lava Lake Level Derived From High-Resolution Satellite Observations
No continuous and reliable terrestrial observations of the lava lake are available from the rim of the Nyiragongo main crater; however, satellite radar data may be used to recover the lava lake level. The idea behind this method consists of measuring the length of the SAR (Synthetic Aperture Radar) shadow cast on the lava lake surface by the edge of the pit crater hosting the lake (d'Oreye et al. in prep), similar to studies focusing on the retrieval of building shapes using SAR shadow (e.g., Bolter, 2000; Tison et al., 2004). The shadow length is measured in pixels on the amplitude (module) of the SAR image in radar geometry and converted to distance in meters, based on the spatial resolution of the image. The level of the lake with respect to the rim is then obtained by multiplying the shadow dimension and the cosine of the incidence angle for the SAR sensor's orbital path.
The intensity of the SAR amplitude may vary significantly depending on the surface reflectance and geometry. Activity at the surface of the lava lake, when animated by fountaining or intense convections, may blur the contrast between illuminated and shadow zones. To minimize that effect, the length of the shadows is measured along an average of at least 10 amplitude profiles in the range direction. The detection of the edges of the shadow is made by fitting a 3 steps Heaviside function to that average amplitude profile. The method has been validated with in situ measurements (e.g., Smets, 2016) and results are consistent with ground based observations (d'Oreye et al., 2017).
In the present study, we measured lava lake levels using RADARSAT images acquired in Fine (RS-F2F) and Ultra Fine (RS-UF) mode along descending and ascending orbits respectively and COSMO-SkyMed (CSK) images acquired in spotlight mode along ascending orbits (Figure 1C). The range resolution of these images is 4.73, 1.33, and 1.25 meters per pixel and look angles are 41.75, 37.38, and 38.34 degrees at zone of interest, respectively. We used a total of 72 SAR images spanning 2 August 2016 to 20 November 2017.
The uncertainty of the method is typically 1 pixel in normal conditions. However, an eruptive cone, which has opened in March 2016 at the bottom of the Nyiragongo main crater, 190 m east of the lava lake (see Figure 1B), has intermittently emitted lavas that flow from the cone back into the pit. This has two effects: the bottom of the main crater is higher on the side of the cone, and edges of the rim where lavas flow into the pit are rounded and smoothed instead of sharp. As a consequence, the asymmetry of the platform induces a 10-m lake level offset between measurements in ascending and descending orbits. A second effect is decreased contrast between illuminated and shadow areas, which leads to an underestimation of the length of shadow because it is cast from a lower point. This effect only concerns RS-F2F images acquired along descending orbit and cannot be mitigated. The comparison with ground observations shows that these measurements (dark diamonds in Figure 1C) are probably slightly underestimated by a few meters from the second half of 2017 (June-July to November).
Due to the SAR reflectance characteristics, or layover effects (Massonnet and Feigl, 1998; Pinel et al., 2014), it is conceivable that signal backscatter from the opposite crater wall can be received prior to that from the lava lake surface. Given the diameter of the pit crater hosting the lava lake and the average incidence angle of the SAR signals, the layover will prevent the measurements of depths larger that roughly 110 m below the bottom of the crater. So far, we have never observed such a depth, although it nearly reached it in November and December 2016.
Co-located Seismic and Infrasound Equipment Near Nyiragongo Volcano
The seismological station KBTI used in this study (Figure 1A) is part of the cross-border (D.R. Congo, Rwanda, Burundi) regional network KivuSNet (see Oth et al., 2017 for more details about the network). This site is equipped with a broadband seismometer (Nanometrics Trillium Compact 120 s−100 Hz) and a small-aperture array (20 m) of three infrasound sensors manufactured by Boise State University (e.g., Johnson and Ronan, 2015). These infrasound sensors use MEMS pressure transducers and capillary filters providing an approximate in-band frequency response that is flat between 0.04 Hz and Nyquist (Marcillo et al., 2012). In this study, we use both locally archived and transmitted seismic and infrasound data at sample rate of 50 Hz. Data are transmitted in real time by cellular data network, then acquired and archived using the SeisComP3 software, which is installed at local and international partner institutions (Goma Volcano Observatory—GVO, R.D Congo and European Center for Geodynamics and Seismology—ECGS, Luxembourg).
KBTI is the closest station to the volcano summit crater (ground distance of about 6 km to the lava lake) where a seismometer was installed in September 2015. The closest site prior to this date was located about 17 km away at the volcano observatory in Goma, the most populated city in the region with about 800,000 inhabitants (Michellier, 2017). The station KBTI is located at a ranger station of the Virunga National Park, which is the start of the track into the jungle leading to the summit. KBTI is the closest permanent safe site to the volcano summit where geophysical instruments can be deployed. Following 10 months of successful seismic data recording and real-time transmission between September 2015 and July 2016, an array of three infrasound sensors was further installed in August 2016 on the same datalogger (Nanometrics Centaur). Permanent telemetered equipment at the summit of Nyiragongo is under consideration, but technical and safety requirements remain a challenge.
Identification of Repetitive Long-Period (LP) Seismo-Acoustic Events
Since the full deployment (seismometer and infrasound sensors) of the station KBTI, we have detected a family of long-period seismic events generally associated with detectable infrasound transients, such as the example in Figure 2. As observed on the time-frequency representation, this seismic LP event and its associated infrasound signal have a dominant frequency around 0.5 Hz. This coupled seismic-acoustic signal suggests a common source near the surface, potentially coming from Nyiragongo's crater and attributable to the lava lake activity. This is supported by the retrograde ellipse motion of the seismic signals, which is typical of surface Rayleigh waves (Figure 3). Figure 4 shows two examples of back-azimuth determination of infrasound events at KBTI using the array of three sensors. We use a 2-D time-domain Fisher analysis as beamforming technique (e.g., Assink et al., 2008) consisting of a grid-search over the slowness vector of infrasound waves propagating across the array. This standard approach allows for the retrieval of the back-azimuth and apparent velocity of the event for the highest signal-to-noise power ratio, defined in this context as SNR2 = (F-1)/N, N being the number of sensors and F the Fisher ratio. The LP seismo-acoustic event depicted in Figures 4A,B, which shares similar characteristics as the one displayed in Figure 2 (i.e., dominant frequency around 0.5 Hz, general waveforms shapes, delay time between seismic and infrasound arrivals of about 10–15 s), occurred in the direction of Nyiragongo. For comparison with other coherent signals detected at KBTI, Figures 4C,D shows the analysis of an atmospheric explosion occurring at a different azimuth, which is characterized by a more impulsive waveform and very attenuated or weak seismic coupling. This last event, which was also audible and signalized by some of the co-authors during a descent from Nyiragongo's summit on 20 June 2017, was certainly of human origin while the previous one (Figures 4A,B) was originating from Nyiragongo's activity. We know from field observations that none of numerous fractures and adventive cones located along the direction of Nyiragongo are active (Smets, 2016). Although other sources cannot yet be definitively excluded based on this beamforming analysis only, such seismo-acoustic events are most probably related to Nyiragongo's lava lake. The three infrasound sensors at KBTI have only worked simultaneously on rare occasions due to several technical issues (e.g., lighting strikes, dysfunctional digitizer channels or sensors, destructions by monkeys, invasion by insects), a fact that prevented the continuous detection and back-azimuth determination of LP infrasound events since the deployment of the sensors. In the following analysis, we will use one in three channels (IS3 in Figures 2B, 4B,D), which has almost always been fully functional and can be analyzed in association with the seismic record.

Figure 2. (A) Vertical component seismogram of a seismic LP event recorded at KBTI and its continuous wavelet transform using a Morlet wavelet. The color scale corresponds to wavelet coefficients (magnitude), from low (white-blue) to high values (red). (B) Infrasound LP event associated with the seismic event in (A). There is a clear dominant, narrow frequency band around 0.5 Hz for both events.
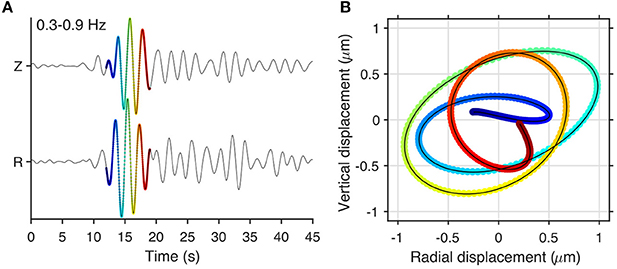
Figure 3. (A) Vertical and radial seismograms of the seismic event in the dominant frequency band (0.3–0.9 Hz) presented in Figure 2, assuming a source at Nyiragongo's lava lake. (B) Particle motion for the time window highlighted by the color scale blue-to-red in (A).
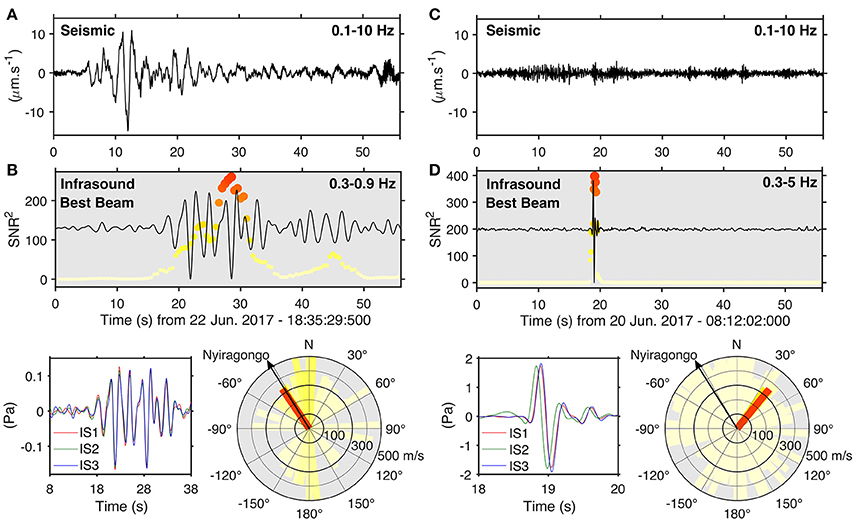
Figure 4. (A) LP seismic event and (B) associated LP infrasound event (best beam) in the dominant frequency band (0.3–0.9 Hz). Each round marker corresponds to a sliding window of 5 s where time domain Fisher analysis is performed. Overlapping is set to 90% and the size/color of the marker is proportional to the SNR2. Signals from the three channels (zoom in the coherent part for IS1, IS2 and IS3) and the corresponding polar plot to the infrasound best beam (back-azimuth and apparent velocity) are depicted below. (C,D) Same as (A,B), respectively, for an atmospheric explosion of human origin. Here, the duration of the sliding windows is 1 s. A high cutoff frequency of 5 Hz was chosen because it generally improved the detection capability of such an event.
Similarly to Matoza et al. (2009) at Mount St. Helens or Richardson and Waite (2013) at Villarica volcano, we look for similar events using a 3-components template matching procedure with the LP seismic event presented in Figures 2A, 3 as master event because it is visually representative of other LPs and has high signal-to-noise ratio. We select a window length of 24 s (corresponding to the interval [6:30] s in Figure 3A) and a threshold of 1.8 for the normalized correlation coefficient (i.e., 0.6 on average per channel). Almost 2500 highly reproducible seismic events are detected with this technique (Figure 5A). It is important to note that the first 500 events are detected during the first year (14 Sept. 2015 to 13 Nov. 2016), while about four times more occurred during the following year (13 Nov. 2016 to 20 Nov. 2017). Since the master event is associated with an infrasound counterpart, we also display the infrasound records for each detected time window in order to verify whether an infrasound event is consistently associated with such typical seismic LP events (Figure 5B). Single events with clear maxima are detected for the first hundred traces, then the infrasound LPs are less detectable with respect to the noise floor but still noticeable at a roughly constant timing about 10 s after the seismic arrival.
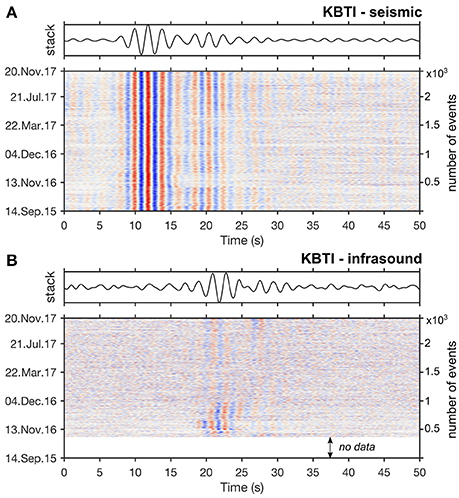
Figure 5. (A) Seismic LP events detected by a 3-components template matching procedure at KBTI using the master event illustrated in Figures 2A, 3 (vertical component shown here). The left ordinate shows dates for the waveforms and the right ordinate is the event number index (2,447 in total). (B) Associated infrasound LP records for each time window where a seismic LP is detected in (A). Infrasound signals have clear maximum amplitude for the first hundred events, then the infrasound LP events are less detectable with respect to the noise floor but still noticeable at a roughly constant timing (between 20 and 25 s). For both panels, amplitudes are normalized trace by trace and the stack of all traces (band-pass filtered in the dominant frequency band 0.3–0.9 Hz) is indicated on top.
The seismic and acoustic signals propagate in different media (solid Earth vs. atmosphere) and hence arrive at different times at KBTI. The changing activity of the lava lake, manifested by lake level variations (discussed later), is a possible explanation for the timing variation between seismic and infrasound phases, however it is unlikely to be solely responsible for the ±0.5 s observed variation for an estimated propagation time of about 20 s (see next section Identification of Repetitive Long-Period (LP) Seismo-Acoustic Events). The atmosphere between Nyiragongo and KBTI is prone to strong wind and temperature variations, similar to the situation at other volcanoes worldwide (e.g., Matoza et al., 2009; Lacanna et al., 2014), and reasonably expectable effective sound speed variations of about 2.5% (i.e., 330–340 m/s) would be in accordance with observations by Johnson et al. (2012) at Villarica volcano 8 km away from the crater. In the following section, we demonstrate that the mean delay time observed between the seismic and the infrasound arrivals is consistent with a source at Nyiragongo's crater by performing a 2-D numerical simulation of the elastic and acoustic wave propagation for a transect passing through the station KBTI.
2-D Numerical Simulation of the Seismo-Acoustic Propagation From a Point Source at Nyiragongo's Lava Lake
Seismo-acoustic source mechanisms at volcanoes are complex and numerical modeling can help to better understand such processes, as done for instance by Matoza et al. (2009) while studying the shallow source of coupled seismo-acoustic signals at Mount St. Helens. The aim of the wave propagation simulations presented below is not to create a model as realistic as possible of the acoustic and elastic wave fields from a point source at Nyiragongo's crater (i.e., a bubble explosion). This would notably require a more complex 3-D simulation with a detailed meshing of the volcano edifice, differentiating the lava lake from the surrounding material, which is far beyond the scope of this article. The simulation presented here should rather be viewed as an illustrative validation of a seismo-acoustic delay time consistent with the location of the source in Nyiragongo's crater (Figure 6).
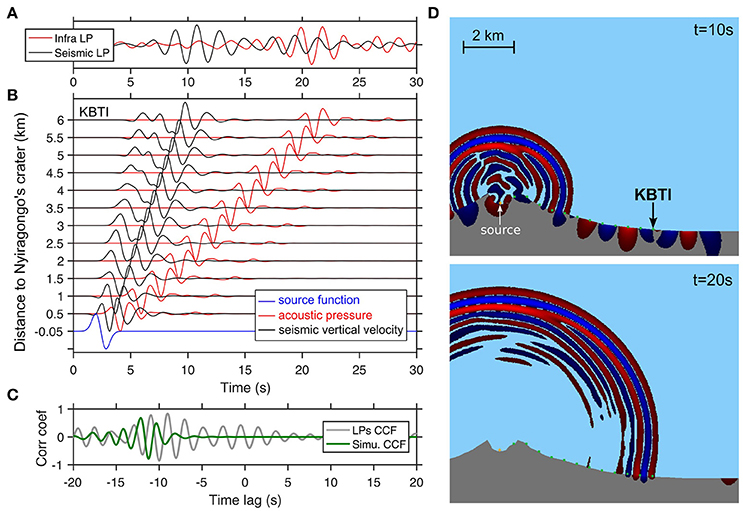
Figure 6. (A) Waveforms of the stacked seismic LP event (black line) and its associated infrasound record (red) (see also Figure 5). (B) 2–D elastic/acoustic numerical simulations of propagating waves from a point source at Nyiragongo. Two simulations using conjoint and nearly co-located sources (blue) are performed for recording the acoustic pressure (red) and the seismic vertical velocity (black) at specified radial distances along the profile between Nyiragongo's crater and station KBTI (6 km on y-axis) (see text for more details). Amplitudes are normalized by trace. (C) Cross-correlation functions (CCFs) of the observed (stacks in (A) light gray line) and simulated (green line) seismo-acoustic LP at KBTI. (D) Pressure wave field snapshots corresponding to the 2–D simulation in (B) (red lines). The computational domain is truncated for visualization purpose. Source and receivers locations (green squares) are indicated. The two snapshots illustrate the propagating acoustic wavefront, the air-ground conversion at the source that propagates faster in the solid Earth along the free surface (see KBTI at t = 10 s), and the local air-ground conversion near the free surface (see KBTI at t = 20 s).
We used the 2-D Specfem2D numerical code based on the spectral element method (Komatitsch and Vilotte, 1998; Tromp et al., 2008). A 20 × 20 km computational domain is gridded using 200 × 200 elements (641601 grid points) and PML (Perfect Matched Layers) absorbing boundary conditions. The 2-D topography (except inside the crater) is estimated from the NASA SRTM-3 DEM (Digital Elevation Model) with a resolution of about 90 m (Farr et al., 2007). The crater geometry is roughly modeled considering the mean diameter (1.2 km) and the depths of the two main inner platforms (see Figure 1B). Homogenous media are assumed for the solid (elastic) Earth (VP = 1,800 m.s−1, VS = 1,050 m.s−1, ρ = 2,000 kg.m−3) and for a non-advecting atmosphere (VP = 340 m.s−1, VS = 0 m.s−1, ρ = 1.2 kg.m−3). The rather low velocity values chosen for the Earth correspond to typical subsurface soft material and are in accordance with the travel-time curve obtained by Barrière et al. (2017) for surface waves generated by the continuous tremor at Nyiragongo. We define a line of 12 acoustic-seismic receivers spaced 500 meters along the topographic profile between the summit and KBTI. Each synthetic acoustic and seismic sensor is positioned 10 m above and below the free surface, inside an acoustic and an elastic element respectively.
We assume that the infrasound and seismic sources are co-located and conjoint in time. We perform two simulations for recording acoustic pressure and vertical seismic velocity using a source 50 m above the free surface (infrasound explosion) and 50 m below (seismic coupling to the lava lake's inner wall), respectively (Figure 6B). Decoupling both acoustic and elastic sources with two distinct simulations mitigates effects of epicentral or local air-ground conversions, but their close proximity maintains the timing and waveform shapes of the maximum amplitude seismic and acoustic arrivals (Rayleigh waves and direct sound waves, respectively). For both cases, the source time function is the time derivative of a Gaussian pulse with a central frequency of 0.5 Hz and located at the center of the lava lake. The sources correspond to a monopole pressure (infrasound) or a single force horizontally oriented (seismic).
Despite the fact that no clear onsets are detectable for the arrivals of the stacked (observed) seismo-acoustic LPs (Figure 6A), it seems that the delay time relative to the simulation is slightly longer (about 1–2 s) at KBTI. An efficient method for calculating the time shift between two related signals (here seismic and infrasound transients) is the computation of the cross-correlation function (CCF), which gives an estimation of the delay time at its maximum value. The shift of about 1–2 s is indeed confirmed by comparing the CCFs of the observed and simulated seismo-acoustic LPs (Figure 6C). However, considering the observed timing uncertainty as well as the simplified 2-D model (e.g., error in presumed sound or seismic wave speeds), the synthetic records provide a good estimation of the mean time shift between seismic and infrasound arrivals and confirm the origin of these seismo-acoustic LP events at Nyiragongo's lava lake. We will now compare their characteristics with the lava lake activity, which can be primarily described by its level fluctuations as estimated with the SAR shadow technique.
Results
Occurrence and Amplitude Properties of the Seismo-Acoustic LP Events
LP events occurrence, as detected at station KBTI, is correlated with the lava lake level estimations obtained with the SAR processing (Figures 7A,B). A strong increase in LPs is observed in November 2016 and correlates well with the biggest drop (about 80 meters) of the lava lake level. This lake level drop occurs very rapidly, i.e., in few hours (see section Discussion: a Relevant Short-Term Unrest Indicator). Sustained LP seismicity then accompanies the rise of the lava lake over several months. The last months between October and November 2017 are characterized by low LP seismicity and high lava lake level, which suggests similar behavior to the activity observed more than 1 year prior to the main November 2016 drop. Because the seismic LP events are repetitively associated with infrasound transients (Figure 5) and their occurrence exhibits a relationship with the lava lake level fluctuations (Figures 7A,B), we assume the same non-destructive surface source process as inferred by Richardson and Waite (2013) for Villarrica volcano, which also hosts a permanent lava lake. At Villarrica, large bubble bursting (i.e., the infrasound explosion) is thought to induce drag forces at the lava lake's walls responsible for seismic LP events. Such typical surface activity has been observed several times at Nyiragongo's lava lake during field expeditions (Smets, 2016; Smets et al., 2016).
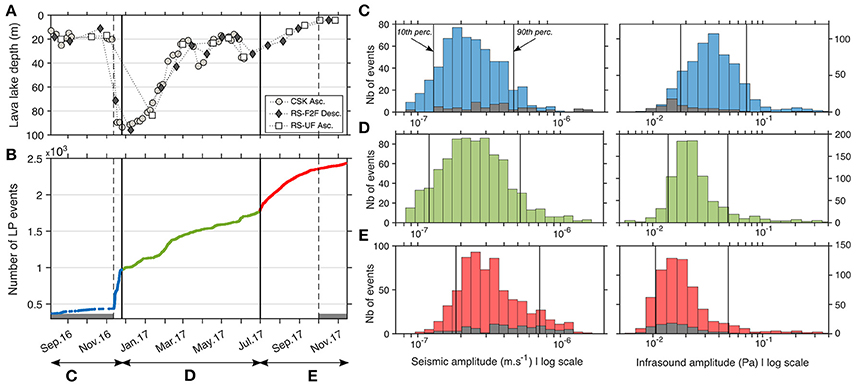
Figure 7. (A) Estimated lava lake depth from SAR processing using COSMO-SkyMed (CSK) and RADARSAT (RS-F2F and RS-UF) images. “Asc.” and “Desc.” refer to ascending and descending orbits respectively. (B) Temporal distribution of LP events detected by template matching (see Figure 5). The time series is divided into three consecutive time windows (blue, green, red) where maximum (zero-to-peak) seismic and infrasound amplitudes are plotted as histograms in sub-panels (C–E) respectively. The gray shading on the histograms (C) (blue) and (E) (red) correspond to the beginning and the end of the timeline respectively, both characterized by low LP seismicity (see B).
Histograms of event statistics, including peak seismic and infrasound amplitudes for the detected LP events, show significant trends (Figures 7C–E). The seismic amplitudes tend to slightly increase after the November-2016 drop, but the opposite trend is even more clear with the infrasound amplitudes. In other words, the swarm of seismo-acoustic LPs in November 2016 (more than 200 events between 13 and 14 November 2016) presents the highest acoustic-to-seismic (AS) amplitude ratio of the entire time period and then a decrease of this ratio is observed.
We interpret this changing AS amplitude ratio as analogous to the volcano acoustic-seismic ratio (VASR) parameter introduced by Johnson and Aster (2005). This non-dimensional parameter allows for an efficient characterization of some seismo-acoustic source properties at volcanoes. Johnson and Aster (2005) obtained high and stable VASR values at Erebus volcano and attributed this observation to the lava lake activity associated with repetitive source processes at the surface of a stable lava lake. The observed decrease of the AS amplitude ratio in the case of Nyiragongo is not in agreement with such a constant trend and is better explained by variable VASR as observed at Villarrica volcano by Richardson et al. (2014) during fluctuating lava lake episodes.
The highest rate of LP events and the highest AS amplitude ratio during the November 2016 drop could thus be interpreted as larger and more frequent bubble bursts in the lava lake. The ensuing decrease of the AS amplitude ratio might be related to a reduction of the spattering surface activity. This could be due to the decrease of bubble size as well as the deepening of the seismo-acoustic LPs within the lake, which in turn explain a better seismic coupling and a less effective acoustic transmission through the atmosphere. For the same period, the rate of seismo-acoustic LP events remains moderate (>1 and < 25 events/day); however, the occurrence rate of LP events seems to decrease at the time of writing (late 2017-early 2018) and could reflect the return to a more quiet lava lake activity and high level.
The amplitude analysis provides some important insights into the variations of the lava lake activity. Two further attributes are of significance with respect to the lava lake level, namely the delay time of the infrasound arrival with respect to the seismic one and the frequency content of the infrasound events (Richardson et al., 2014; Johnson et al., 2018). Unfortunately, the delay time information, which is potentially useful for measuring the level of lava in a conduit (Ripepe et al., 2002; Johnson, 2007) is particularly affected by 6 km of propagation through the atmosphere (see section Identification of Repetitive Long-Period (LP) Seismo-Acoustic Events). Moderate variations of the lava lake depth on the order of 80 m are probably not resolvable with the current seismo-acoustic station.
A more promising means to measure lava levels is afforded by the study of the acoustic resonance of the air column above the lava lake (Johnson et al., 2018). Several acoustic resonance models have been applied to other lava lake volcanoes (e.g., Bessel horn resonator at Villarrica in Richardson et al., 2014; Helmholtz resonator at Kilauea in Fee et al., 2010), the simplest one being the cylindrical geometry, or organ pipe, that could eventually fit to the shape of Nyiragongo's lava lake. However, the 1.2 km wide Nyiragongo crater is significantly more complex than a pipe or other standard geometries of resonators (see Figure 1B). In the following analysis, we do not intend to propose a physics-based model for the infrasonic frequency content but rather aim to use its variations as a direct proxy for the lava lake level since our expectation is that a deeper lava lake will lead to a graver infrasound dominant frequency.
Notably, we do not find any clear evidence of changing spectral properties of the LP infrasound events with respect to the fluctuations of the lava lake, even for the marked drop of about 80 meters in November 2016. This may imply that the variations during the studied time period are potentially too weak to be detected or have negligible effect on the resulting infrasound signal recorded at KBTI. On the other hand, these discrete acoustic LP events are not fully representative of the lava lake activity and have generally a low signal-to-noise ratio (see Figure 5B). At Villarrica volcano, Richardson and Waite (2013) suggest that the tremor recorded at greater distance from the volcano results from the superposition of single LPs distorted by path effects, which we consider also as the process responsible for the Nyiragongo continuous tremor as it shares the same dominant frequency band below 1 Hz (Barrière et al., 2017). Therefore, a more reliable acoustic signature from Nyiragongo's lava lake is potentially the continuous low-frequency seismic tremor associated with its spattering activity. We now investigate the infrasonic component of this tremor, which should be detectable at KBTI as well.
The Continuous Nature of the Seismo-Acoustic “Lava Lake” Source
Examples of seismic and infrasonic time records and corresponding spectrograms for three successive days in April 2017 at KBTI are displayed in Figure 8. No LP event was detected by template matching during this period characterized by a high lava lake level estimated around 20–30 m deep (see Figures 1C, 7A). On the seismic spectrogram (Figure 8A), the secondary microseismic peak is clearly dominant between 0.1 and 0.3 Hz. Above 0.3 Hz, the continuous harmonic volcanic tremor is well-detected, preferentially below 1 Hz among all seismic stations of the KivuSNet network (Barrière et al., 2017; Oth et al., 2017) but it could be also detectable until 1.5 to 2 Hz as observed here for KBTI. Higher frequency contents until 4–5 Hz are discernable during night periods. However, as stated previously, for security reason, KBTI station is located at a ranger station, close to a road in an inhabited area and only few km north of the heavily populated city of Goma. The effects of anthropogenic activity are clearly visible on both seismic and acoustic records. Such undesirable seismic noise dominates above 2 Hz during daytime (Figure 8A) and the infrasound records exhibits also high-amplitude human-related signals, which are broadband (i.e., cover the frequency band of interest below 1 Hz) and would strongly disturb the detection of any other signals of volcanic origin (Figure 8B). This is a critical drawback for the detection of potential infrasonic tremor from Nyiragongo's lava lake activity. Moreover, no clear patterns of continuous signals are detectable on the infrasonic spectrogram, which means that the acoustic component of the volcanic tremor recorded at KBTI would be near the noise floor such as observed for most of the discrete LP infrasound events (Figure 5B).
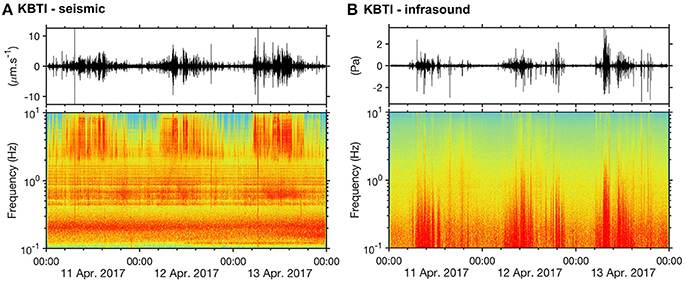
Figure 8. Examples of (A) seismic (vertical component) and (B) infrasound records in the frequency band 0.1–10 Hz during 3 days in April 2017. The corresponding spectrograms (Power Spectral Density expressed in dB/Hz) are depicted below using windows of duration 327.68s (214 samples) with 50 % overlapping. The color scale for both spectrograms corresponds to a relative dB range of 40 (between a raised minimum threshold in blue and the maximum PSD value in red).
Following these observations, we highlight the continuous nature of the seismo-acoustic signal by calculating the cross-correlation function (CCF) between the co-located seismic and infrasound waveforms at KBTI. A similar coherence analysis was for instance performed by Cannata et al. (2013) using cross wavelet transform for detecting explosive activity at Etna volcano. The principal difference with the present study lies in the usage of stations much closer to the active vent (~1–1.7 km) and the strong intensity of the explosive activity, the combination of which leads to high signal-to-noise ratio for both seismic and infrasonic records. In our case, even if the infrasound signal of interest is of very low amplitude, such a cross-correlation approach should allow to extract the acoustic component coherently associated with the seismic signals originating from the lava lake (Figure 9). The seismo-acoustic CCF is calculated for non-overlapping 1-h intervals and averaged over 1 day in the frequency band [0.1–10] Hz. Because the full records are cross-correlated without discarding undesirable noise, this approach leads to very low normalized correlation maxima (order of 10−2 on average); however, the daily averaging generally allows for the quantification of robust time lags (Figure 9A). The CCF daily maxima are found at a stable time shift of 10 s between seismic and infrasound arrivals in the dominant frequency band [0.3–0.9] Hz (Figure 9B). This is consistent with the simulation results (Figure 6C) and the good match between the CCF of the stacked seismo-acoustic LP events (LPs CCF) and the daily tremor CCF strongly suggests a similar source for LPs and tremor at Nyiragongo's lava lake (Figure 9C).
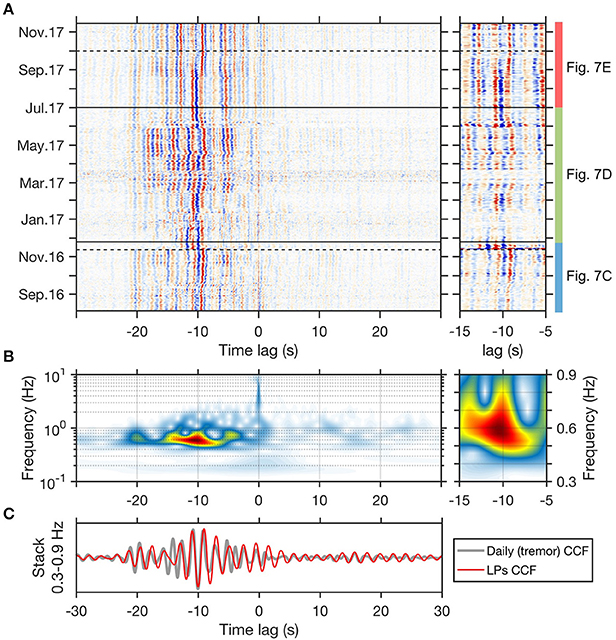
Figure 9. (A) Daily seismo-acoustic CCF in the frequency band (0.1–10) Hz. The clear maxima at negative time lag around 10 s (i.e., earlier seismic arrival than acoustic arrival) are an indication of continuous tremor originating from Nyiragongo (left: amplitudes normalized trace by trace; right: no normalization and zoom in the maxima). (B) Wavelet transform of the stacked CCF for the entire period highlighting the maximum correlation at −10 s. The color scale corresponds to wavelet coefficients (magnitude), from low (white-blue) to high values (red). The high-frequency correlation at zero lag is most likely due to coherent noise sources and air-ground coupling at KBTI. (C) Stack of the band-pass filtered CCF (dark gray line) in the dominant frequency band (0.3–0.9) Hz inferred from the time-frequency representation in (B).
Using these cross-correlation functions, we indirectly analyzed the variations of the infrasonic tremor frequency through analysis of the variations of the cross-spectrum between the seismic and infrasonic signals. Considering the remarkable stability of the seismic tremor source over the years (Barrière et al., 2017), we make the assumption that the frequency content of the seismo-acoustic cross-spectrum will be primarily affected by the infrasound component of the fluctuating lava lake activity. It is important to note that the infrasonic spectrum might be potentially influenced by path effects, such as those due to changing atmospheric conditions between day and night in atmospheric boundary layers (Fee and Garcés, 2007). However, such diurnal variations that can affect the acoustic propagation appear to be significant only at greater distance (in the diffraction or shadow zone) than for our station at ~6 km and the dominant lava lake signature contained in the infrasonic frequency spectrum would be preserved such as observed by Johnson et al. (2012) at Villarrica volcano. Nevertheless, we do note diurnal variations of the spectral amplitude, which are due to anthropogenic activity dominantly observed during the day (see Figure 8). The signature of this noise is visible on the time-frequency representation of the seismo-acoustic CCF displayed in Figure 9B at zero lag (>2 Hz, blue color). In this case, there is no delay time between the infrasound and the seismic coherent arrivals because of direct coupling of the acoustic waves to the ground. Similar coupling at the recording station has also been observed for explosive sources at volcanoes (Ichihara et al., 2012; Matoza and Fee, 2014). In the case of Nyiragongo, it is clear that the dominant low-frequency seismic signal, which precedes the correlated infrasound by ~10 s, does not come from local air-ground coupling, but originates from the propagation of Rayleigh waves generated in Nyiragongo's crater. We next analyze the spectral content of seismo-acoustic CCF and relate it to lake depth estimated by SAR processing.
Calibration Model Between the Lava Lake Depth and the Seismo-Acoustic Cross-Spectrum
The SAR-inferred lava lake depths are irregularly sampled (separated by 1–31 days), so they are linearly interpolated onto a regular daily time frame to compare with CCF spectral content. SAR data are then averaged over a ±10 days centered time window (Figure 10A), which incorporates at least 3 SAR images for most depth measurements (see later Figure 11A). For the calculation of the seismo-acoustic parameter (mean frequency of the daily CCF), a similar moving average is applied. The power spectra of each CCF are then calculated using a fixed-size time window for all selected days (Figure 10B). We use a 10% cosine tapered window of width determined automatically by selecting 75% of the total signal energy of the stacked tremor CCF displayed in Figure 9C (start at 12.5%, end at 87.5%). A correlation between CCF spectral content (lower frequencies) and deeper SAR-derived lava lake levels is apparent (Figure 10C).
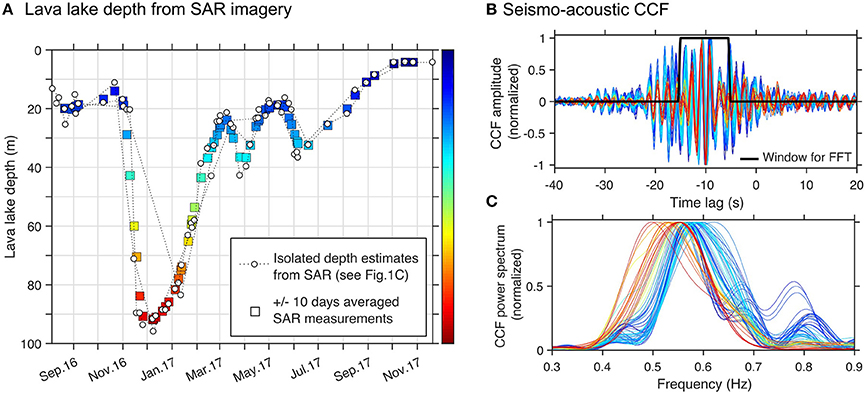
Figure 10. (A) Lava lake depth estimates using three sets of satellite images CSK, RS-F2F and RS-UF (round markers and dotted line, see also Figure 1C or Figure 7A). The initial estimations are irregularly sampled and have been linearly interpolated onto a regular daily frame, and then final depth estimates are obtained by applying a centered averaging window of ±10 days (colored squares). The color scale indicates relative lava lake depth. (B) Seismo-acoustic CCF for each selected day associated with the squares in (A) and using the same color code. The cosine-tapered window used for the computation of power spectra (C) is depicted as a solid black line. (C) Corresponding power spectra of the selected CCF waveforms in (B) plotted using the same color code.
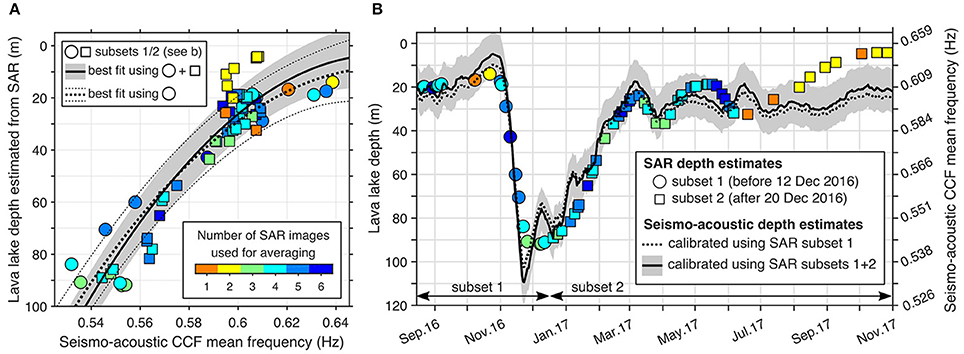
Figure 11. (A) Relationship between the lava lake depth estimated from SAR processing and the seismo-acoustic CCF mean frequency. The two best-fit power laws using the first 19 depth estimates (subset 1, round markers) and the full dataset (subsets 1+2, round and square markers) are represented as dashed and solid thick black line, respectively; gray area and dashed thin lines indicate estimates of one standard deviation error, respectively. Both SAR depth estimates and seismo-acoustic CCF mean frequency are averaged using a ±10 days centered moving average. Since the initial sampling of the SAR images is irregular (i.e., not daily), the number of images actually used for the averaging is also indicated (see text for details). (B) Daily seismo-acoustic “depth estimates” of Nyiragongo's lava lake computed using the two best-fit models in (A). The gray shading indicates estimates of one standard deviation error for the final calibration model (solid line, subsets 1 + 2).
The comparison between SAR estimates of the lava lake depth and the CCF mean frequencies shows a systematic relationship permitting an empirical calibration model (Figure 11A). We derived two best-fit power laws (in the least square sense) for a subset of the data (subset 1 = the first 19 lava lake depths) and for the full dataset (subsets 1 + 2 = 72 measurements). The subset 1 was chosen to be as limited as possible but also able to sample the full range of depths measured with the SAR technique (Figure 11B). In this way, we verified that this first test model (i.e., subset 1) gives similar predictions to the complete one (i.e., subsets 1 + 2), and thus that the empirical relationship between the lava lake depth and the seismo-acoustic mean frequency is applicable to additional new data (Figure 11B). The uncertainties of both models lie into a similar interval and are expressed as the standard deviation error of about ±10 m (Figures 11A,B). Overall, the daily depth estimates from the seismo-acoustic CCF mean frequency are highly consistent with the SAR observations.
The main discrepancy occurs for less well constrained SAR measurements made since June-July 2017 (see also section Nyiragongo's Lava Lake Level Derived From High-Resolution Satellite Observations). These points notably contribute to the minor difference between the two calibration models previously obtained at the highest frequencies, i.e., the shallowest lava lake levels (see Figure 11A). The fact that few SAR estimates are available for this period and acquired with the same satellite (RADARSAT) could partly explained this bias by considering these measurements as potential outliers. However, both descending and ascending modes are used and show consistent estimations of the lava lake level. Therefore, we rather tend to explain this discrepancy due to weak infrasound amplitudes (see section Daily Monitoring of Nyiragongo's Lava Lake Activity below). These slightly biased measurements represent a weak proportion of the available depth estimates and, for this reason, we chose the best fit curve using the full dataset as final calibration model (i.e., subsets 1 + 2).
Daily Monitoring of Nyiragongo's Lava Lake Activity
Nyiragongo's activity since August 2016 may be partly summarized in terms of lava lake depth estimated from its seismo-acoustic signature and the continuous AS (acoustic-to-seismic) amplitude ratio recorded at KBTI (Figure 12A). The relevance of this last parameter for characterizing the varying lava lake activity was discussed earlier during the analysis of the single LP events (section Occurrence and Amplitude Properties of the Seismo-Acoustic LP Events and Figure 7). Because the continuous infrasonic records at KBTI are disturbed by undesirable noise during daytime, we apply a similar smoothing procedure as the one applied for the seismo-acoustic CCF mean frequency for calculating a robust daily AS ratio. One-hour seismic and infrasonic RMS amplitude values are computed (with 50% overlapping) and smoothed over ±10 days using a median filter. In Figure 12A, this smoothed AS ratio is plotted together with the lava lake depth estimates. The highest AS ratio (i.e., high infrasonic amplitudes relative to the seismic ones) is obtained after the November 2016 drop when the lava lake reached its lowest levels. This conveys a strong spattering activity associated with high amplitude infrasound tremors. Then, as observed with the analysis of LP events (Figure 7), the acoustic component of the volcanic tremor exhibits lower amplitudes through time, notably for the last period starting in July 2017, indicating a progressive return to a quieter behavior. The lowest AS ratio is obtained for the period where the disagreement between SAR and seismo-acoustic depth estimates is the most significant. This effect is most likely responsible for the poorer characterization of the resonant frequency information retrieved at the station KBTI. This observation points out that, for obvious reasons, the seismo-acoustic method applied here needs a proper recording of the seismic and infrasonic tremors for estimating the lava lake level. In order to mitigate the effect of varying AS ratio (which conveys nonetheless some valuable information), this approach would perform best if these signals have high SNR, thus ideally recorded at a station as close to the crater as possible.
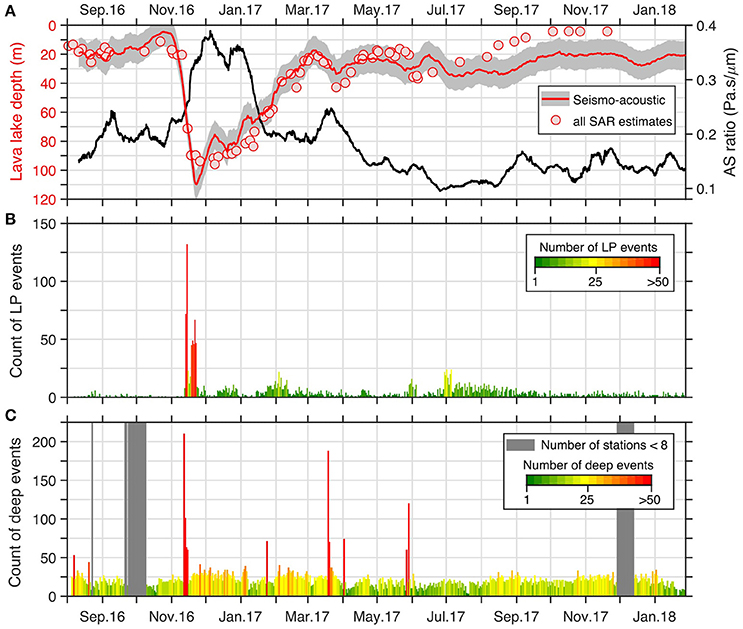
Figure 12. (A) Lava lake depth estimated from the seismo-acoustic CCF mean frequency using the calibration model of Figure 11A. The time series is extended to the end of January 2018. The depth estimates averaged over ±10 days (same window as used for the calibration in Figure 11) are depicted in red. All SAR depth estimates are plotted with round markers. The smoothed AS ratio (±10 days) is plotted as a black line (right y-axis). (B) Daily count of LP events detected at KBTI (extended time series presented in Figure 7B). The color scale corresponds to the number of events per day. (C) Daily count of deep events at Nyiragongo (deeper than 5 km b.s.l). The gray areas correspond to periods when the number of available stations in the Virunga Volcanic Province (VVP) is smaller than 8.
The monitoring of Nyiragongo's activity is also characterized by the occurrence of LP events associated to large bubble bursting (Figure 12B), and the number of seismic events located deeper than 5 km below sea level and within a 15 × 15 km area around the volcano (Figure 12C). This deep and sustained seismicity has been continuously detected since the complete installation of the KivuSNet seismic network in October 2015, notably a batch of seismicity on the southeast flank of Nyiragongo. Although no detailed event classification has yet been performed, these seismic events generally have characteristics of volcano-tectonic earthquakes (e.g., higher and broader frequency content than LP events, more clear P or S wave onsets). Volcano-tectonic locations are obtained using a “picking-free” cross-correlation based technique adapted to low SNR events (see Barrière et al., 2017) and a simple low-resolution 1-D velocity model with two layers between 0 and 30 km depth for the Virunga Volcanic Province (VVP) (Mavonga et al., 2010). Precise hypocenter determination is adversely impacted by the use of this rough velocity model and relatively poor station coverage around the volcano (see Oth et al., 2017). A daily count is tabulated when at least 8 stations located in the VVP are available.
The time series extending to January 2018 shows a rather stable high lava lake level (20 to 30 meters below the inner crater floor) and low LP seismicity during the last few months. As previously highlighted in Figure 7, the first significant correlation is the link between the November 2016 drop and the swarm of LP events. Since the lava lake level drop there has been sustained (~1 year) elevated LP activity, which became the new normal background seismicity. More interestingly, this drop is also accompanied by strong seismic activity at depth. A similar observation can also be made for the two other most significant swarms, with drops of 15 to 20 meters occurring in March and end of May 2017 (see SAR estimates), but without clear changes in LP seismicity. Taken altogether, this evidence suggests that the swarms of deep volcano-tectonic events are likely associated with magma intrusion, which simultaneously results in the drawdown in the level of the lava lake. However, the time resolution is unfortunately insufficient to definitely resolve the process taking place at that time.
Hourly Estimates of Nyiragongo's Lava Lake Depth
A detailed inspection of the dynamics in November 2016 is required in order to better understand the link between the two seismic modes (LP and deep) and the lava lake level. From a monitoring perspective, the ability to rapidly quantify the lava lake level is also of crucial importance. We consider whether it is possible to implement a short-term (near real-time) estimation of the lake depth by computing seismo-acoustic CCFs every 6 min for hourly time windows and 90% overlap. Figure 13A shows the depth estimates based on this short-term calculation between 8 and 15 November 2016. The main drop occurring on 12–13 November is well identified but other major decreases are related to low correlations between seismic and infrasound signals during daytime. Indeed, even in the low frequency band [0.3–0.9] Hz, the correlation of seismic and infrasound signals can be strongly hampered during daytime due to a noisier local environment. This also explains why the AS ratio as computed for Figure 12 cannot be considered as a robust monitoring attribute at this short time scale. Despite the use of an additional lagging 6-h averaging window, the diurnal artifacts on the seismo-acoustic CCFs are still noticeable. Therefore, we test a temporal normalization approach traditionally applied in ambient seismic noise studies for enhancing background coherent noise signals. This pre-processing step is called running-absolute-mean normalization and consists in computing a normalization weight prior to the calculation of the cross-correlation functions (Bensen et al., 2007). For a single data trace of n points dn(either seismic or infrasound), the new corrected data Dn is defined as:
Following Bensen et al. (2007), the width of the normalization window (2N + 1) can be defined as 1/(2fc1), where fc1 is the low cutoff frequency of the band-pass filter (here 0.3 Hz). The effect of this correction procedure is clearly visible in Figure 13B. For the same time period (8–15 November 2016), the artificial drops of the lava lake due to the decrease of seismo-acoustic correlation during daytime are efficiently reduced. Hence this correction needs to be applied to get a more accurate short-term estimation of the lava lake depth. It is important to note, however, that this normalization does not improve the calibration model previously obtained because the large averaging window of several days (±10 days) sufficiently mitigates the diurnal variations. This way, meaningful CCF mean frequencies could be determined and compared with SAR measurements (see Figure 11). Such as observed for the daily estimates (Figure 12A), the short-term estimation of the lava lake depth will be less accurate when the volcanic tremor intensity is weak. A minimum threshold value for the correlation between seismic and infrasound signals should be also defined. Here, this value is arbitrarily set to 0.01 (see Figure 13), yet must be tested in the future for other periods of unrest.
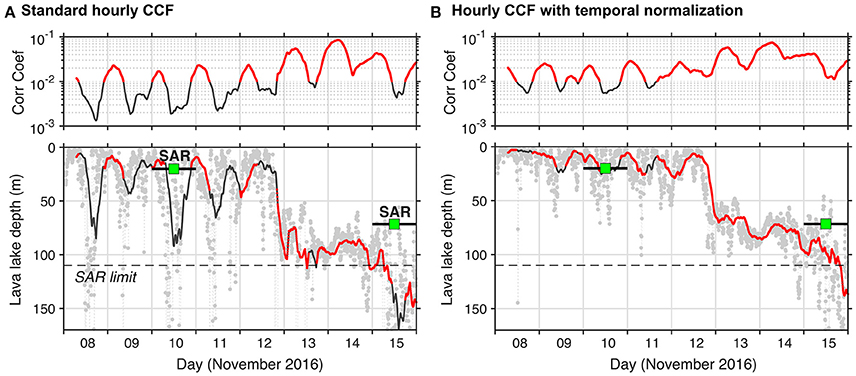
Figure 13. (A) Hourly estimations of the lava lake depth around the main drop of the lava lake (8–15 November 2016), based on seismo-acoustic CCFs calculated each 6 min for a 1–h lagging time-window. The top panel represents the maximum values of the seismo-acoustic CCF (i.e., correlation coefficient between the seismic and the infrasound signals, values above 10−2 are in red). Bottom panel: estimates of the lake level as well as the available SAR measurements for this period. Gray dots correspond to each single calculation (i.e., each 6 min). The solid line is the 6–h lagging average (i.e., 60 calculations). Estimates corresponding to the highest values of seismo-acoustic correlation (i.e., above 10−2) are highlighted in red. The dashed black line “SAR limit” corresponds to the maximum depth detectable by the SAR method. (B) Same as (A) using a pre-processing step (temporal normalization) for the calculation of seismo-acoustic CCFs. Effects of low correlation between seismic and infrasound signals that affect the short-term estimation of the lake depth (see A) are mitigated during daytime.
Discussion: A Relevant Short-Term Unrest Indicator
The short-term approach described previously allows for the identification of the lava lake drop accompanying the deep seismic swarm and the LP “lake” seismicity with enhanced temporal resolution (Figure 14). The maximum occurrence of deep, volcano-tectonic events (12 November) occurs simultaneously with the main drop of the lava lake and precedes the substantial increase of surface LP activity (13–14 November). These observations confirm that the major fluctuations of the lava lake level reflect the dynamics of the magmatic system and that its monitoring is of great importance for evaluating the potential of magma intrusion and eruption at Nyiragongo. This is notably consistent with the interpretation of Wauthier et al. (2012), who inferred a deep dike intrusion (2–10 km deep below sea level) from InSAR analysis that triggered the drainage of magma from the lava lake to a shallower eruptive dike in January 2002.
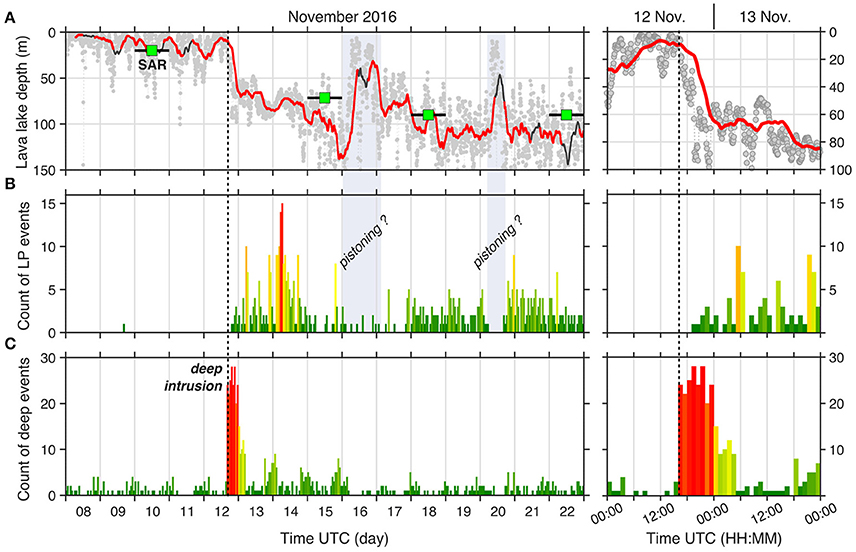
Figure 14. (A) Hourly estimations of the lava lake depth during the main drop of the lava lake in November 2016 and detail is provided for 12–13 November 2016 (right panels). The seismo-acoustic CCFs are calculated each 6 min for a 1–h lagging time-window. Gray dots correspond to each single calculation (i.e., 1 sliding 1–h calculation overlapped by 90%). A less noisy estimation of the short-term variations of lava depth is obtained with a long-term lagging average of 6 h (i.e., 60 sliding calculations, solid line). Note that the y-axis is cropped with respect to the limit values of this last estimation. Values corresponding to correlation coefficient above 10−2 are highlighted in red (see Figure 13). (B) Hourly count of LP events detected at KBTI and (C) Hourly count of deep events at Nyiragongo (located deeper than 5 km b.s.l). The color (green to red) corresponds to the number of events per h scaled for each type of events.
No eruptive episode was analyzed in this study, but the large November 2016 drop could convey a similar mechanism of possible lateral magma intrusion. In Hawaii, before eruptive events leading to the drainage of the lava lake at Halema'uma'u crater, Patrick et al. (2015) pointed out systematic increases of the lava lake level associated with inflation episodes. Such pressurization processes cannot be evidenced from our measurements acquired at ~6 km from the summit. After several months of sustained high level (~20 m below the rim, see Figures 11, 12), there was a small increase of the lava lake level about 1 month before the large November 2016 drop, but this variation almost entirely falls into the confidence interval of the lake depth estimates. In the case of the Hawaiian eruptions studied by Patrick et al. (2015), the periods of increasing pressure preceding the eruptions were also associated with an increase of earthquakes occurrence rate while, in our case, there was no precursory swarm of seismic events. As highlighted by the short time window “12–13 November” depicted in Figure 14, the sudden increase of deep seismicity is synchronous with the decrease of the lava lake level, and the drop of the lava lake level is the only surface evidence of this magma intrusion at great depth.
There are two main notable increases of the lake level on 16 and 20 November that are potential artifacts due to low correlation between seismic and infrasound signals (parts of the solid line not highlighted in red). However, these episodes of increasing levels could be also due to gas pistoning, a common phenomenon at Nyiragongo (Smets et al., 2016). The pistoning effect, which is due to the accumulation of gas in the upper layer of the lake, is associated with low surface activity and quiet seismicity, as observed at Kilauea volcano (Patrick et al., 2016). Therefore, these two short increases occurring on 16 and 20 November, which indeed correspond to periods of low LP seismicity (Figure 14B), might be real episodes of gas pistoning. In the future, the comparison with terrestrial observations at the summit appears essential in order to better constrain this short-term estimation of the lava lake level.
Conclusions
In this study we showed that information about the lava lake dynamics at Nyiragongo, D.R. Congo, is contained in the particular seismic and infrasound signals generated by its spattering activity, similar to what is observed at other lava lake volcanoes such as Kilauea, Hawaii, or Villarrica, Chile. In the absence of close-range observations, we used seismic and infrasound data from a single station (KBTI) located about 6 km from the lava lake. The particularity of the present work is the use of SAR images for calibrating seismo-acoustic ground measurements with lava lake depth. In a noisy anthropogenic environment, a cross-correlation analysis of this continuous seismic-acoustic tremor reveals changing frequency content directly related to the fluctuations of the lava lake level. The processing approach defined here in order to retrieve consistent lava lake depth estimates could eventually be useful for other lava lake volcanoes when no close-range observations are possible.
From a monitoring perspective, the reliable interpretation of the seismo-acoustic signature of the lava lake activity recorded at several kilometers from the summit is a significant step forward in order to better interpret periods of unrest at this volcano on a daily and hourly basis. The intensity of bubble bursting can be inferred through the occurrence of repetitive LP events and their acoustic-to-seismic (AS) amplitude ratios. The AS ratio is also applicable on a daily timeframe for characterizing the volcanic seismo-acoustic tremor. We particularly focused on the November 2016 time interval because we show that this type of drop and the following intense LP “lava lake” seismicity are a consequence of deep magma intrusion and could eventually lead to the next eruption at Nyiragongo. Telemetered near real-time information from the summit (e.g., seismometer, infrasound, SO2/thermal/visible cameras) would obviously be a great help, complementing these remote observations, and could help to refine the model between the lava lake depth and the spectral content of the distant seismo-acoustic records in the future. Other important tools, such as the automatic classification of volcano-seismic events, should also be implemented in near real-time using station KBTI in order to provide an efficient, single-station monitoring solution.
Author Contributions
JB, NdO, and AO: carried out the data analysis; JB and AO: processed the seismic and infrasound data; NdO and HG: processed SAR data; NM, NdO, BS, JB, AO, HG, and FK: carried out field work; JB: wrote the manuscript and all authors commented and contributed to this original version.
Conflict of Interest Statement
The authors declare that the research was conducted in the absence of any commercial or financial relationships that could be construed as a potential conflict of interest.
Acknowledgments
The authors thank Robin Matoza and David Fee for their constructive reviews, which helped to improve the original manuscript, and Valerio Acocella for his final helpful comments on this work. This article is a contribution in the framework of the project Remote Sensing and In Situ Detection and Tracking of Geohazards (RESIST, http://resist.africamuseum.be), funded by the Belgian Science Policy (Belspo), Belgium, and the Fonds National de la Recherche (FNR), Luxembourg. We are grateful to Belspo for funding CosmoSkyMed images (Italian Space Agency) and to Natural Resources Canada (NRCan) for sharing RADARSAT images (Canadian Space Agency). We also wish to thank the Congolese Institute for Nature Preservation (ICCN) and the MONUSCO (UN stabilization mission in Congo) for their continuous support and allowing us to host the stations in their compounds, as well as the entire Goma Volcano Observatory team and the sentinels of the stations, without whom the operation of the seismic network would be impossible. KivuSNet data are underlying an embargo policy following the conditions of the Memoranda of Understanding between the partner institutions of RESIST. Beyond this embargo policy, data may be shared for collaboration purposes upon request with the approval of all RESIST partners. Data archiving and accessibility is ensured through the GEOFON program of the GFZ German Research Centre for Geosciences (http://dx.doi.org/doi:10.14470/XI058335) and KivuSNet is registered within the FDSN with network code KV (http://www.fdsn.org/networks/detail/KV/).
References
Allard, P., Baxter, P., Halbwachs, M., and Komorowski, J. C. (2002). The January 2002 Eruption of Nyiragongo Volcano (Dem. Repub. Congo) and Related Hazards: Observations and Recommendations. Final report of the French-British Scientific team: submitted to the Ministry for Foreign Affairs, Paris: Foreign Office, London, United Kingdom and respective Embassies in Democratic Republic of Congo and Republic of Rwanda. 35. Available online at: http://mhalb.pagesperso-orange.fr/kivu/pdf/concorde_sept2003.pdf (Accessed Sept 27, 2015).
Arrowsmith, S. J., Johnson, J. B., Drob, D. P., and Hedlinn, M. A. H. (2010). The seismoacoustic wavefield: a new paradigm in studying geophysical phenomena. Rev. Geophys. 48:RG4003. doi: 10.1029/2010RG000335
Assink, J. D., Evers, L. G., Holleman, I., and Paulssen, H. (2008). Characterization of infrasound from lightning. Geophys. Res. Lett. 35:L1580. doi: 10.1029/2008GL034193
Barrière, J., Oth, A., Theys, N., d'Oreye, N., and Kervyn, F. (2017). Long-term monitoring of long-period seismicity and space-based SO2 observations at African lava lake volcanoes Nyiragongo and Nyamulagira (DR Congo). Geophys. Res. Lett. 44. 6020–6029. doi: 10.1002/2017GL073348
Baxter, P., and Ancia, A. (2002). Human health and vulnerability in the Nyiragongo volcano crisis, Democratic Republic of Congo, (2002). Final report to the World Health Organisation, 39. Available online at: http://apps.who.int/disasters/repo/7828.pdf (Accessed Sept 27, 2015).
Bensen, G. D., Ritzwoller, M. H., Barmin, M. P., Levshin, A. L., Lin, F., Moschetti, M. P., et al. (2007). Processing seismic ambient noise data to obtain reliable broad-band surface wave dispersion measurements. Geophys. J. Int. 169, 1239–1260. doi: 10.1111/j.1365-246X.2007.03374.x
Bolter, R. (2000). “Reconstruction of man-made objects from high resolution SAR images,” in Proceedings of the IEEE International Aerospace Conference Proceedings 2000 March 25 (Big Sky, MT).
Cannata, A., Montalto, P., and Patane, D. (2013), Joint analysis of infrasound seismic signals by cross wavelet transform: detection of Mt. Etna explosive activity. Nat. Hazard. Earth Syst. Sci. 13, 1669–1677. doi: 10.5194/nhess-13-1669-2013
d'Oreye N Derauw D Geirsson H Smets B Samsonov S Barrière J, et al. (2017). “Recent activity in Nyiragongo active crater, Democratic Republic of Congo - remote sensing and in-situ measurements,” in IAVCEI 2017 Scientific Assembly (Portland, OR), ME43A-004.
Farr, T. G., Rosen, P. A., Caro, E., Crippen, R., Duren, R., Hensley, S., et al. (2007). The shuttle radar topography mission. Rev. Geophys. 45:RG2004. doi: 10.1029/2005RG000183
Fee, D., and Garcés, M. (2007). Infrasonic tremor in the diffraction zone. Geophys. Res. Lett. 34:L16826. doi: 10.1029/2007GL030616
Fee, D., Garces, M., Patrick, M., Chouet, B., Dawson, P., and Swanson, D. A. (2010). Infrasonic harmonic tremor and degassing bursts from Halema‘uma‘u crater, Kilauea. J. Geophys. Res. Solid Earth 115:B11316. doi: 10.1029/2010JB007642
Garcés, M., Fee, D., and Matoza, R. S. (2013). “Volcano acoustics,” in Modeling Volcanic Processes: The Physics and Mathematics of Volcanism, ed S. A. Fagents, T. K. P. Gregg and R. C. Lopez (New York, NY: Cambridge University Press).
Ichihara, M., Takeo, M., Yokoo, A., Oikawa, J., and Ohminato, T. (2012). Monitoring volcanic activity using correlation patterns between infrasound and ground motion. Geophys. Res. Lett. 39:L04304. doi: 10.1029/2011GL050542
Johnson, J. B. (2007). On the relation between infrasound, seismicity, and small pyroclastic explosions at Karymsky Volcano. J. Geophys. Res. 112:B08203. doi: 10.1029/2006JB004654
Johnson, J. B., Anderson, J., Marcillo, O., and Arrowsmith, S. (2012). Probing local wind and temperature structure using infrasound from Volcan Villarrica (Chile). J. Geophys. Res. Atmos. 117:D17107. doi: 10.1029/2012JD017694
Johnson, J. B., and Aster, R. C. (2005). Relative partitioning of acoustic and seismic energy during Strombolian eruptions. J. Volc. Geoth. Res. 148, 334–354. doi: 10.1016/j.jvolgeores.2005.05.002
Johnson, J. B., and Ripepe, M. (2011). Volcano infrasound: a review. J. Volcanol. Geoth. Res. 206, 61–69. doi: 10.1016/j.jvolgeores.2011.06.006
Johnson, J. B., and Ronan, T. J. (2015). Infrasound from volcanic rockfalls, J. Geophys. Res. Solid Earth 120, 8223–8239. doi: 10.1002/2015JB012436
Johnson, J. B., Watson, L. M., Palma, J. L., Dunham, E. M., and Anderson, J. F. (2018). Forecasting the eruption of an open-vent volcano using resonant infrasound tones. Geophys. Res. Lett. 45, 2213–2220. doi: 10.1002/2017GL076506
Kavotha, S. K., Mavonga, T., Durieux, J., and Mukambilwa, K. (2002). Towards a more detailed seismic picture of the January 17th, 2002, Nyiragongo eruption. Acta Vulcanol. 14–15, 87–100. doi: 10.1400/19081
Komatitsch, D., and Vilotte, J. P. (1998). The spectral-element method: an efficient tool to simulate the seismic response of 2D and 3D geological structures. Bull. Seismol. Soc. Am. 88, 368–392.
Komorowski, J.-C., Tedesco, D., Kasereka, M., Allard, P., Papale, P., Vaselli, O., et al. (2004). The January 2002 flank eruption of Nyiragongo volcano (Democratic Republic of Congo): chronology, evidence for a tectonic rift trigger, and impact of lava flows on the city of Goma. Acta Vulcanol. 14–15, 27–62. doi: 10.1400/19077
Lacanna, G., Ichihara, M., Iwakuni, M., Takeo, M., Iguchi, M., and Ripepe, M. (2014). Influence of atmospheric structure and topography on infrasonic wave propagation, J. Geophys. Res. Solid Earth 119, 2988–3005. doi: 10.1002/2013JB010827
Marcillo, O., Johnson, J. B., and Hart, D (2012). Implementation, characterization, and evaluation of an inexpensive low-power low-noise infrasound sensor based on a micro-machined differential pressure transducer and a mechanical filter. J. Atmos. Oceanic Technol. 29, 1275–1284. doi: 10.1175/JTECH-D-11-00101.1
Massonnet, D., and Feigl, K. L. (1998). Radar interferometry and its application to changes in the Earth's surface. Rev. Geophys. 36, 441–500.
Matoza, R. S., and Fee, D. (2014). Infrasonic component of volcano-seismic eruption tremor, Geophys. Res. Lett. 41, 1964–1970. doi: 10.1002/2014GL059301
Matoza, R. S., Fee, D., and Garces, M. (2010). Infrasonic tremor wavefieldof the Pu‘u O‘o crater complex and lava tube system, Hawaii, in April 2007. J. Geophys. Res. Solid Earth 115:B12312. doi: 10.1029/2009JB007192
Matoza, R. S., Garces, M. A., Chouet, B. A., D'Auria, L., Hedlin, M. A. H., De Groot-Hedlin, C., et al. (2009). The source of infrasound associated with long-period events at Mount St. Helens. J. Geophys. Res. Solid Earth 114:B04305. doi: 10.1029/2008JB006128
Mavonga, T., Zana, N., and Durrheim, R. J. (2010). Studies of crustal structure, seismic precursors to volcanic eruptions and earthquake hazard in the eastern provinces of the Democratic Republic of Congo. J. Afr. Earth Sci. 58, 623–633. doi: 10.1016/j.jafrearsci.2010.08.008
Michellier, C. (2017). Contribuer à la Prévention des Risques D'origine Géologique: L'évaluation de la Vulnérabilité des Populations Dans un Contexte de Rareté de Données. Les cas de Goma et Bukavu (RD Congo), Ph.D. thesis, Université Libre de Bruxelles.
Oth, A., Barrière, J., d'Oreye, N., Mavonga, G., Subira, J., Mashagiro, N. (2017), KivuSNet: the first dense broadband seismic network for the Kivu Rift region (western branch of East African Rift). Seismol. Res. Lett. 88, 49–60. doi: 10.1785/0220160147, et al.
Pagliuca, N. M., Badiali, L., Cattaneo, M., Ciraba, H., Delladio, A., Demartin, M., et al. (2009). Preliminary results from seismic monitoring at Nyiragongo Volcano (Democratic Republic of Congo) through telemetered seismic network, Goma volcanological observatory. Boll. Geof. Teor. Appl. 50, 117–127.
Patrick, M. R., Anderson, K. R., Poland, M. P., Orr, T. R., and Swanson, D. A. (2015). Lava lake level as a gauge of magma reservoir pressure and eruptive hazard, Geology 43, 831–834. doi: 10.1130/G36896.1
Patrick, M. R., Orr, T. R., Sutton, A. J., Lev, E., Thelen, W., and Fee, D. (2016). Shallowly driven fluctuations in lava lake outgassing (gas pistoning), Kilauea volcano. Earth Planet. Sci. Lett. 433, 326–338. doi: 10.1016/j.epsl.2015.10.052
Pinel, V., Poland, M. P., and Hooper, A. (2014). Volcanology: lessons learned from synthetic aperture radar imagery. J. Volc. Geoth. Res. 289, 81–113. doi: 10.1016/j.jvolgeores.2014.10.010
Richardson, J. P., and Waite, G. P. (2013). Waveform inversion of shallow repetitive long period events at Villarrica Volcano, Chile. J. Geophys. Res. Solid Earth 118, 4922–4936. doi: 10.1002/jgrb.50354
Richardson, J. P., Waite, G. P., and Palma, J. L. (2014).Varying seismic-acoustic properties of the fluctuating lava lake at Villarrica volcano, Chile. J. Geophys. Res. Solid Earth 119, 5560–5573. doi: 10.1002/2014JB011002
Ripepe, M., Harris, A. J. L., and Carniel, R. (2002). Thermal, seismic and infrasonic evidences of variable degassing rates at Stromboli volcano. J. Volcanol. Geotherm. Res. 118, 285–297. doi: 10.1016/S0377-0273(02)00298-6
Shuler, A., and Ekström, G. J. (2009). Anomalous earthquakes associated with Nyiragongo volcano: observations and potential mechanisms. J. Volcanol. Geotherm. Res. 181, 219–230. doi: 10.1016/j.jvolgeores.2009.01.011
Smets, B., d'Oreye, N., Kervyn, F., Kervyn, M., Albino, F., Arellano, S. R., et al. (2014). Detailed multidisciplinary monitoring reveals pre- and co-eruptive signals at Nyamulagira volcano (North Kivu, Democratic Republic of Congo). Bull. Volcanol. 76:787. doi: 10.1007/s00445-013-0787-1
Smets, B. (2016). Dynamics of Volcanic Activity in a Youthful Extensional Setting Studied by Means of Remote Sensing and Ground-based Monitoring Techniques: Nyiragongo and Nyamulagira Volcanoes (North Kivu, DR Congo), Ph.D. thesis, Vrije Universiteit Brussel.
Smets, B., d'Oreye, N., Kervyn, M., and Kervyn, F. (2016). Gas piston activity of the Nyiragongo lava lake: first insights from a stereographic time-lapse camera system. J. Afr. Earth Sci. 134, 874–887. doi: 10.1016/j.jafrearsci.2016.04.010
Tison, C., Tupin, F., and Maître, H. (2004). “Retrieval of building shapes from shadows in high resolution SAR interferometric images. IGARSS '04,” in Proceedings of the IEEE International Geoscience and Remote Sensing Symposium; 2004 Sept 20-21 (Anchorage, AK).
Tromp, J., Komatitsch, D., and Liu, Q. (2008). Spectral-element and adjoint methods in seismology. Comm. Comp. Phys. 3, 1–32. doi: 10.1029/157GM13
Ulivieri, G., Ripepe, M., and Marchetti, E. (2013). Infrasound reveals transition to oscillatory discharge regime during lava fountaining: implication for early warning. Geophys. Res. Lett. 40, 3008–3013. doi: 10.1002/grl.50592
Wauthier, C., Cayol, V., Kervyn, F., and d'Oreye, N. (2012). Magma sources involved in the 2002 Nyiragongo eruption, as inferred from an InSAR analysis. J. Geophys. Res. 117:B05411.doi: 10.1029/2011JB008257
Wood, D. A., Zal, H. J., Scholz, C. A., Ebinger, C. J., and Nizere, I. (2015). Evolution of the kivu rift, East Africa: interplay among tectonics, sedimentation and magmatism. Basin Res. 29, 175–188. doi: 10.1111/bre.12143
Keywords: lava lake, Nyiragongo, infrasound, seismic, Synthetic Aperture Radar, single-station monitoring
Citation: Barrière J, d'Oreye N, Oth A, Geirsson H, Mashagiro N, Johnson JB, Smets B, Samsonov S and Kervyn F (2018) Single-Station Seismo-Acoustic Monitoring of Nyiragongo's Lava Lake Activity (D.R. Congo). Front. Earth Sci. 6:82. doi: 10.3389/feart.2018.00082
Received: 28 February 2018; Accepted: 30 May 2018;
Published: 19 June 2018.
Edited by:
Corentin Caudron, Ghent University, BelgiumReviewed by:
Robin Matoza, University of California, Santa Barbara, United StatesDavid Fee, University of Alaska Fairbanks, United States
Copyright © 2018 Barrière, d'Oreye, Oth, Geirsson, Mashagiro, Johnson, Smets, Samsonov and Kervyn. This is an open-access article distributed under the terms of the Creative Commons Attribution License (CC BY). The use, distribution or reproduction in other forums is permitted, provided the original author(s) and the copyright owner are credited and that the original publication in this journal is cited, in accordance with accepted academic practice. No use, distribution or reproduction is permitted which does not comply with these terms.
*Correspondence: Julien Barrière, julien.barriere@ecgs.lu