Late-Glacial Paleoecology of the Middle Susitna Valley, Alaska: Environmental Context for Human Dispersal
 Nancy H. Bigelow1*
  Joshua D. Reuther2,3
  Kristi L. Wallace4
  Émilie Saulnier-Talbot5
  Katherine Mulliken2,6
  Matthew J. Wooller5,7
- 1Alaska Quaternary Center, University of Alaska, Fairbanks, AK, United States
- 2Department of Anthropology, University of Alaska Fairbanks, Fairbanks, AK, United States
- 3University of Alaska Museum of the North, University of Alaska Fairbanks, Fairbanks, AK, United States
- 4U.S. Geological Survey, Alaska Volcano Observatory, Anchorage, AK, United States
- 5Water and Environmental Research Center, University of Alaska Fairbanks, Fairbanks, AK, United States
- 6Division of Geological and Geophysical Surveys, State of Alaska Department of Natural Resources, Fairbanks, AK, United States
- 7College of Fisheries and Ocean Sciences, Institute of Marine Science, University of Alaska, Fairbanks, AK, United States
We present here the results of multi-proxy analyses (sediment geochemistry, diatoms, and pollen) from sediment cores collected at four lakes in the middle Susitna Valley, Alaska. These lakes form a transect from the tundra to the boreal forest. The retrieved cores span from ∼12,000 cal yr BP to the present, with age control provided by radiometric dates and tephra deposits, some of which are newly identified. Results indicate that deglaciation occurred before 12,000 cal yr BP and that by that time, the lakes were deep, productive, and surrounded by shrub tundra. The lake with the highest sampling resolution indicates a brief climatic reversal ∼11,500 cal yr BP with decreased diatom-inferred lake level and lowered lake productivity, and reduced shrub presence. During the early to middle Holocene, all of the sedimentary records provide evidence of climatic amelioration with tree expansion and productive lakes. A middle to late Holocene climatic deterioration with reduced trees and a shallower, less productive lake is also indicated. In addition, the prominent Watana tephra at ∼4,000 cal yr BP likely reduced lake productivity and affected the vegetation. Even though the region was relatively productive soon after deglaciation, people did not occupy the region until ∼11,000 cal yr BP, about 1000 years later, and then only sparsely. By the middle and late Holocene, the region was more densely populated and this shift in human occupancy presumably reflects changes in resource abundance, especially caribou. Whether the Watana ashfall influenced caribou abundance and thus people, is still under investigation, but given the tephra’s effect on vegetation and lake productivity, it seems likely.
Introduction and Background
Hundreds of archeological sites spanning 11,000 years are found in the Susitna River drainage of Alaska. For this reason, it is critically important to reconstruct landscape change from deglaciation (before 12,000 years ago [cal yr BP]) to the late Holocene. We focus here on the middle reaches of the river (Figure 1), where the oldest archeological site (Jay Creek Ridge ∼11,100 cal yr BP]) has been found (Dixon et al., 1985; Bowers et al., 2011). We present multi-proxy investigations (sediment geochemistry, tephra, diatoms, and pollen) based on the sedimentary archives of four Susitna lakes located in the tundra, forest-tundra ecotone, and boreal forest, which span from deglaciation through to today. Prior to this study, only one lake record with a problematic chronology existed for the region (Dilley, 1988; Ager, 2018). In contrast, the terrestrial stratigraphy at natural sections and archeological sites are well documented (Dilley, 1988; Mulliken, 2016), but there is a lack of synthetic paleoenvironmental analysis in the context of post-glacial human occupation of the region.
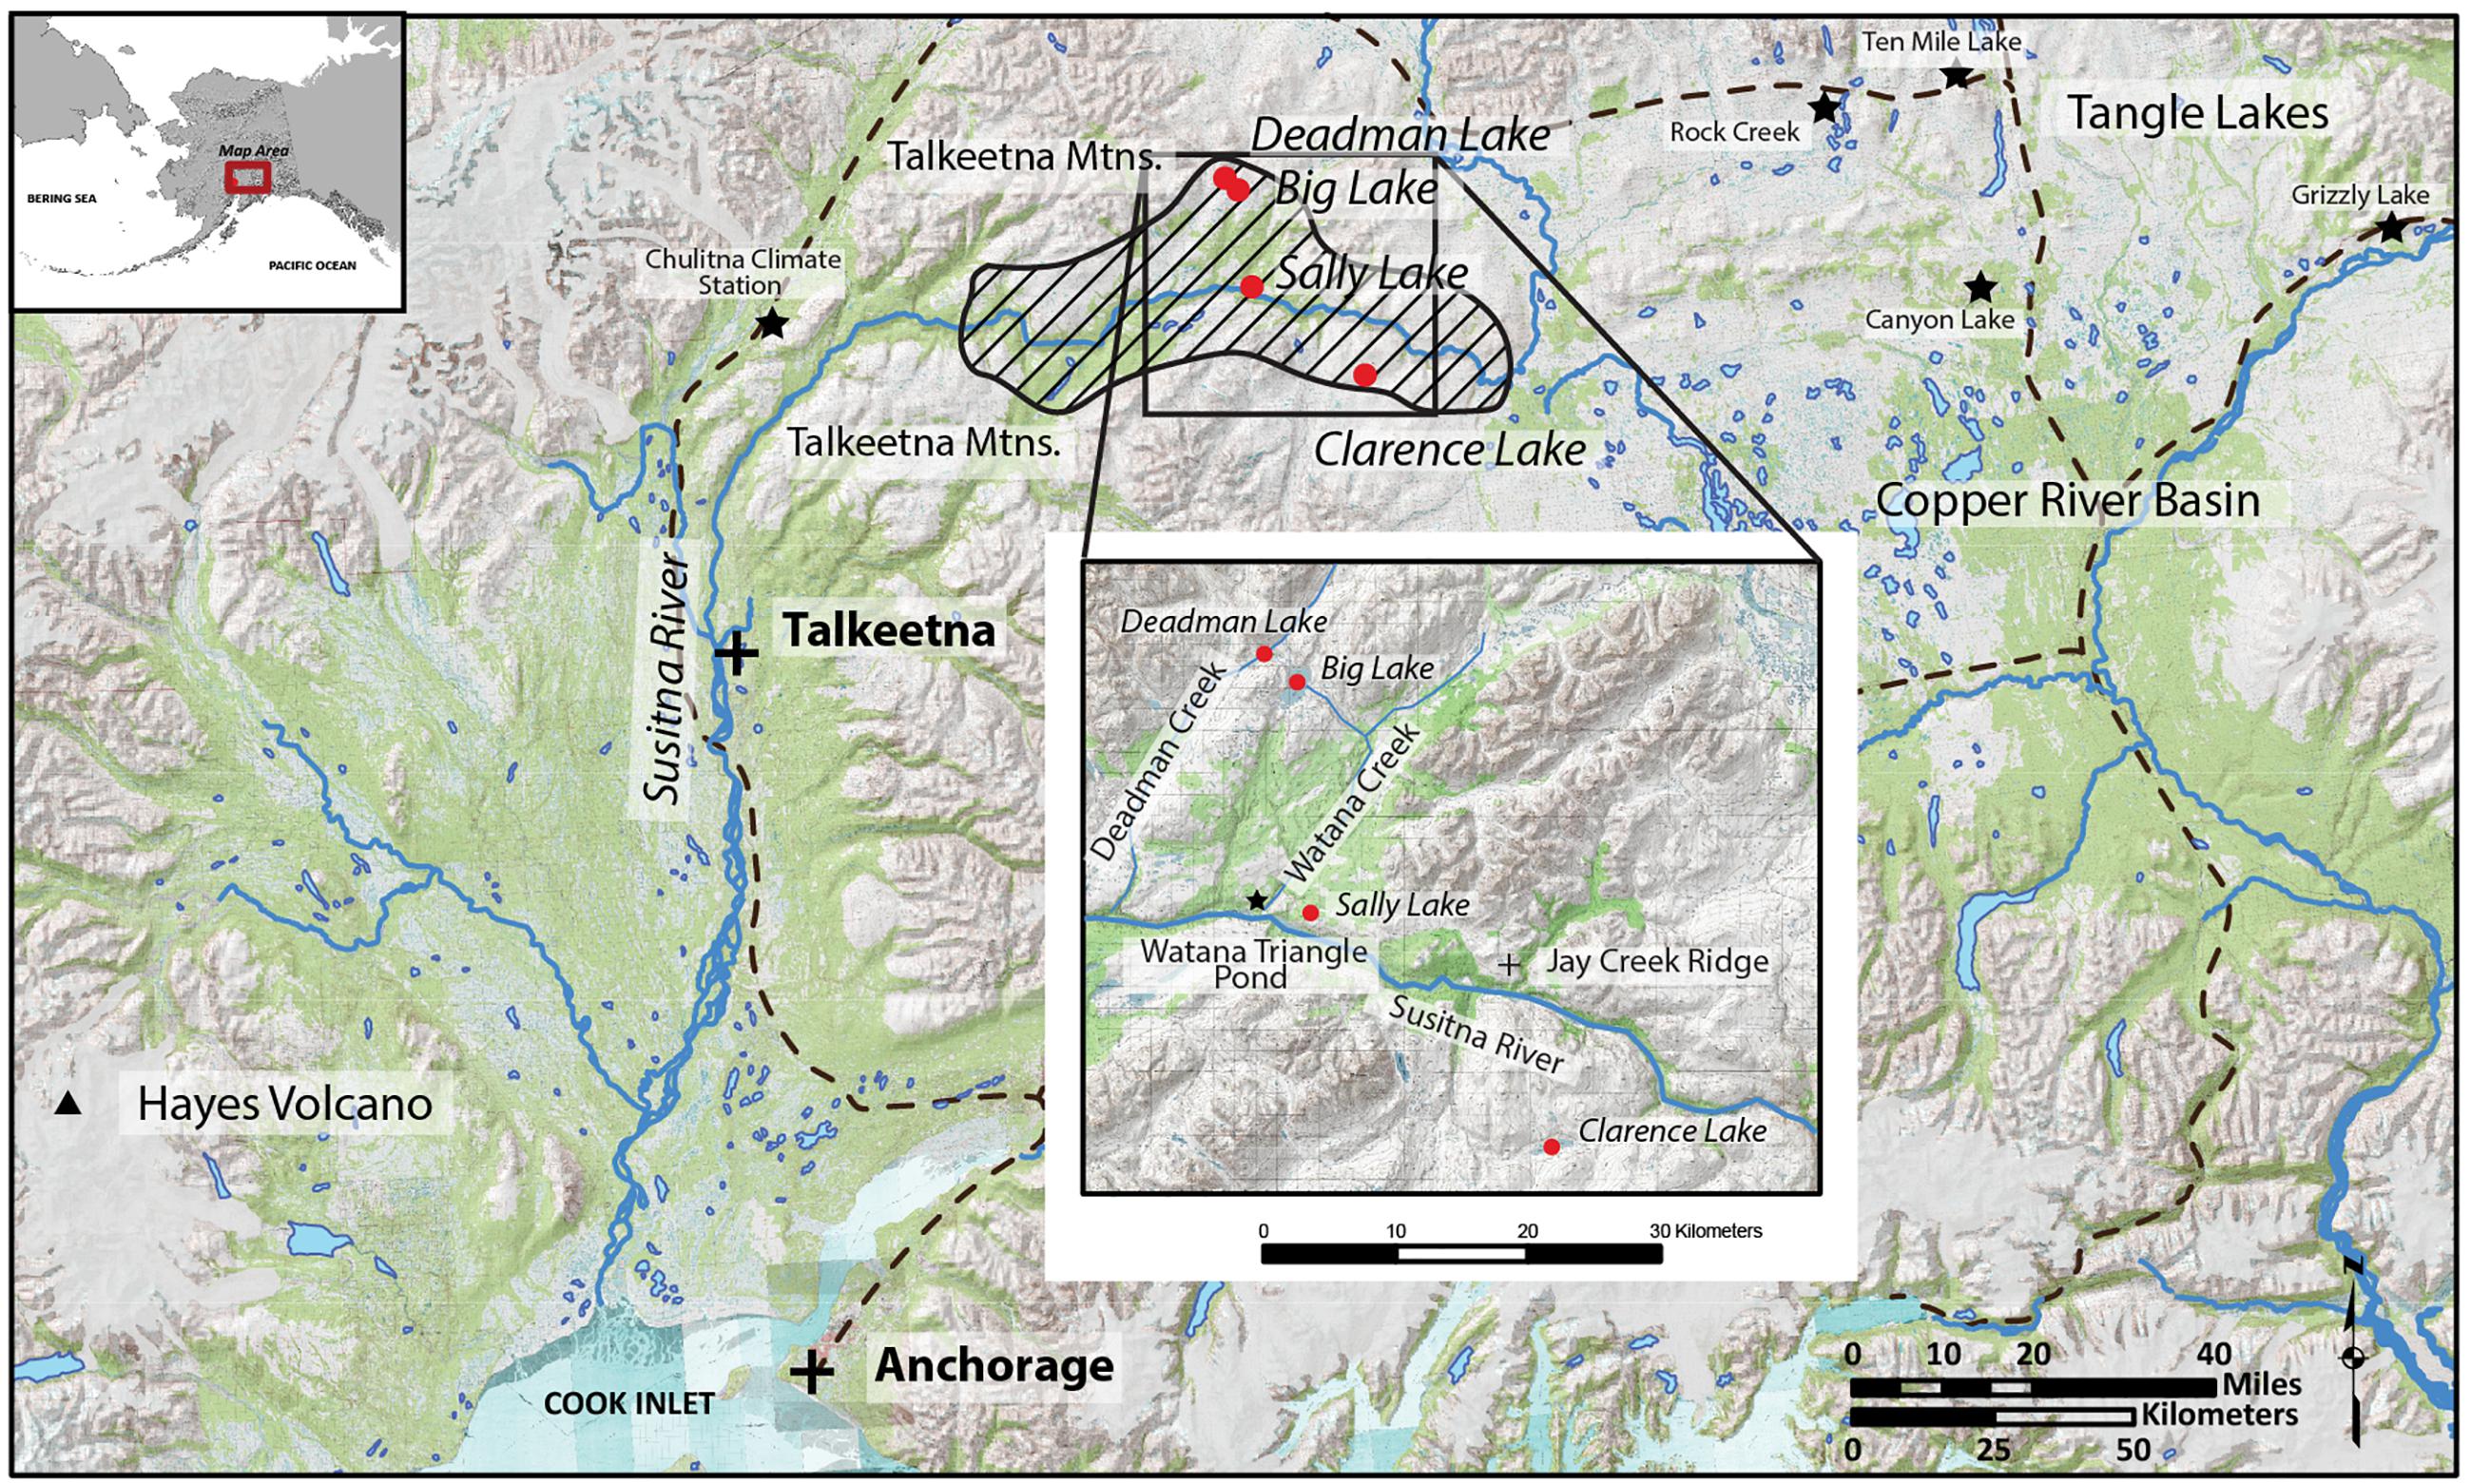
Figure 1. Localities mentioned in the text. Diagonal hatching marks the middle Susitna Valley. Red circles are the study lakes, stars mark other sites and dashed lines are major roads.
Below, we summarize our current understanding of the landscape, paleoecology, and human prehistory of the middle Susitna and surrounding regions. The Late-Glacial (>∼14,000 cal yr BP) was a period of landscape instability that may have maintained extensive ranges of herbaceous tundra and reduced competition from woody plants, as well as hindering paludification (Guthrie, 1990; Mann et al., 2015). By 14,000 cal yr BP, climate was warming, but still much cooler than modern (Viau et al., 2008) and moisture was increasing as reflected in rising lake levels and rapid shrub expansion (Abbott et al., 2000; Bigelow and Edwards, 2001; Bigelow, 2013). The Younger Dryas chronozone (∼12,900–11,700 cal yr BP [Rasmussen et al., 2014]) occurred at the end of the Late-Glacial. While this episode of climate deterioration is well-documented in southern and coastal Alaska (Engstrom et al., 1990; Peteet and Mann, 1994; Hansen and Engstrom, 1996; Kokorowski et al., 2008), it is less-well expressed elsewhere in the state.
The early Holocene (∼11,700–8,200 cal yr BP) ushered in a period of warming summer temperatures (Berger, 1978). Significant landscape changes included a transient expansion of Populus (cottonwood or aspen), the initial expansion of spruce (Anderson et al., 2004; Bigelow, 2013), as well as permafrost degradation and peatland development (Jones and Yu, 2010; Mann et al., 2010; Walter Anthony et al., 2014). Archeological evidence indicates people were using resources in the Susitna Valley as early as ∼11,100 cal yr BP (Dixon, 1999; Wygal and Goebel, 2012; Blong, 2016, 2018), but sites are scarce before 10,000 cal yr BP and somewhat ephemeral, probably reflecting short-term seasonal hunting forays (Wygal and Goebel, 2012; Blong, 2018). These sites are typically found on elevated features and people focused on a broad spectrum of subsistence resources such as bison and elk (Wapiti) (Yesner, 2007; Graf and Bigelow, 2011; Potter, 2011; Blong, 2016). Caribou, sheep, waterfowl and fish were also used, albeit in low quantities (Potter, 2008b).
Later, the middle Holocene (∼8,200–4,200 cal yr BP) may have also been relatively warm, based on pollen (continued spruce expansion) and midge-based temperature reconstructions, while the late Holocene (∼4,200 cal yr BP-present) was generally cooler with neoglacial ice advances (Kaufman et al., 2016). By ∼6,000 cal yr BP, the vegetation in the middle Susitna region was similar to modern, although sites at high elevations show a subsequent retraction of tree line (this study).
Three widespread tephra deposits dating to the middle and late Holocene are widely recognized in terrestrial sections of the Susitna River Valley (Dixon and Smith, 1990): the informally named Oshetna (∼6570–7930 cal yr BP), Watana (∼3,360–4,400 cal yr BP), and Devil (∼1625–1825 cal yr) tephras (Dixon et al., 1985; Dilley, 1988; Dixon and Smith, 1990; Mulliken, 2016). The Watana tephra is the most widespread and thickest of the tephra deposits (up to 20 cm thick in terrestrial sections) and is the only one of the three present in our lake cores. The source volcano for both the Watana and Devil tephra units was Hayes Volcano, where proximal sediments (Units H1, H2, F2, E, and D of Wallace et al., 2014) are highly correlated with these distal units (Mulliken, 2016). In contrast, the Oshetna tephra has a very diverse glass chemistry and is not well documented outside of the Susitna River Valley.
In terms of archeology, a notable shift in resource acquisition, land use strategies, and lithic technologies occurred after 6,000 cal yr BP (Dixon, 1985; Esdale, 2008; Potter, 2008a). These Northern Archaic populations were mobile, highly reliant on seasonally available resources including fish and caribou (Dixon, 1985; Esdale, 2008; Potter, 2008b), and occupied diverse landforms including lakeshores and lower riverbanks (Potter, 2008a). Middle Holocene archeological horizons (components) are relatively abundant, especially in uplands where caribou took on more importance as a subsistence resource. Around 1,500 cal yr BP, the “Athabascan Tradition” reflects a shift from lithic to organic and metal tool technological strategies, with an increase in moose acquisition (Cook, 1975; Workman, 1978; Dixon, 1985; Esdale, 2008; Potter, 2008a). These late Holocene populations expanded the use of seasonally abundant resources, including caribou and fish, with storage pits and subterranean houses becoming common on lakeshores and river and stream terraces (Potter, 2008a).
Study Sites
The study sites are located in the mountains, between ∼600 and ∼900 m above sea level (MASL). The nearest weather station is at the Chulitna River in Broad Pass about 90 km to the west, and somewhat lower, at ∼400 MASL (Figure 1). The Chulitna River climate normals (1981–2010) indicate a mean annual temperature of ∼0.3°C, a mean July temperature of ∼13°C, a mean January temperature of ∼-11.5°C, and mean annual precipitation of ∼850 mm, with ∼70% falling between July and December (Alaska Climate Research Center, 2014). Climate at the study sites themselves is probably somewhat cooler in the summer and perhaps receive more precipitation than at the Chulitna River. The regional vegetation is a birch and willow shrub tundra with occasional alder, especially above 850 MASL. Occasionally, spruce trees are present in protected localities at 800 MASL, but closed boreal forest is found only below 600 MASL, especially along the Susitna River (Boggs et al., 2014).
Much of the study area was heavily glaciated during the Late Wisconsinan (∼25,000–14,000 cal yr BP), with ice originating from the Alaska Range as well as the Talkeetna Mountains to the south and northwest (Woodward-Clyde Consultants, 1982; Reger et al., 1990) and the region’s topography is heavily influenced by past glaciations and associated outwash (Thorson et al., 1981; Dixon et al., 1985; Reger et al., 1990). Moraines, eskers, kames, and kettle lakes lie adjacent to steep-walled scarps and canyons created by post-glacial down-cutting (Kachadoorian, 1974; Dixon et al., 1985; Reger et al., 1990) and large proglacial lakes once covered vast portions of the study area (Reger et al., 1990).
The regions around Deadman, Big, and Sally lakes (Figure 1) were covered by thick ice until deglaciation and the basal radiocarbon dates in those lakes suggest deglaciation was before 12,000 cal yr BP. However, the region around Clarence Lake (Figure 1) apparently remained ice-free during the Late-Wisconsinan (Woodward-Clyde Consultants, 1982). After deglaciation, Holocene-aged ice was limited to cirques with little growth into the valleys, and the study lakes would have been affected indirectly (if at all) by these ice advances (Woodward-Clyde Consultants, 1982; Reger et al., 1990).
Clarence Lake
Clarence Lake (N 62.6784°; W 147.8108° [Supplementary Table 1]) is located south of the Susitna River at about 870 MASL, ∼120 km east northeast of Talkeetna (Figure 1). The lake is ∼3.2 km long and ∼0.5 km wide at its widest point, with the long axis oriented northeast-southwest. The lake has a current maximum water depth of ∼11 m, with the surrounding hills rising to ∼100 m above the lake’s margins (Figure 2). The lake has three major inlets at its eastern and northern margins, and an outlet at the western end of the lake that ultimately drains into the Susitna River. The present vegetation around the lake is shrub tundra with widely scattered spruce trees.
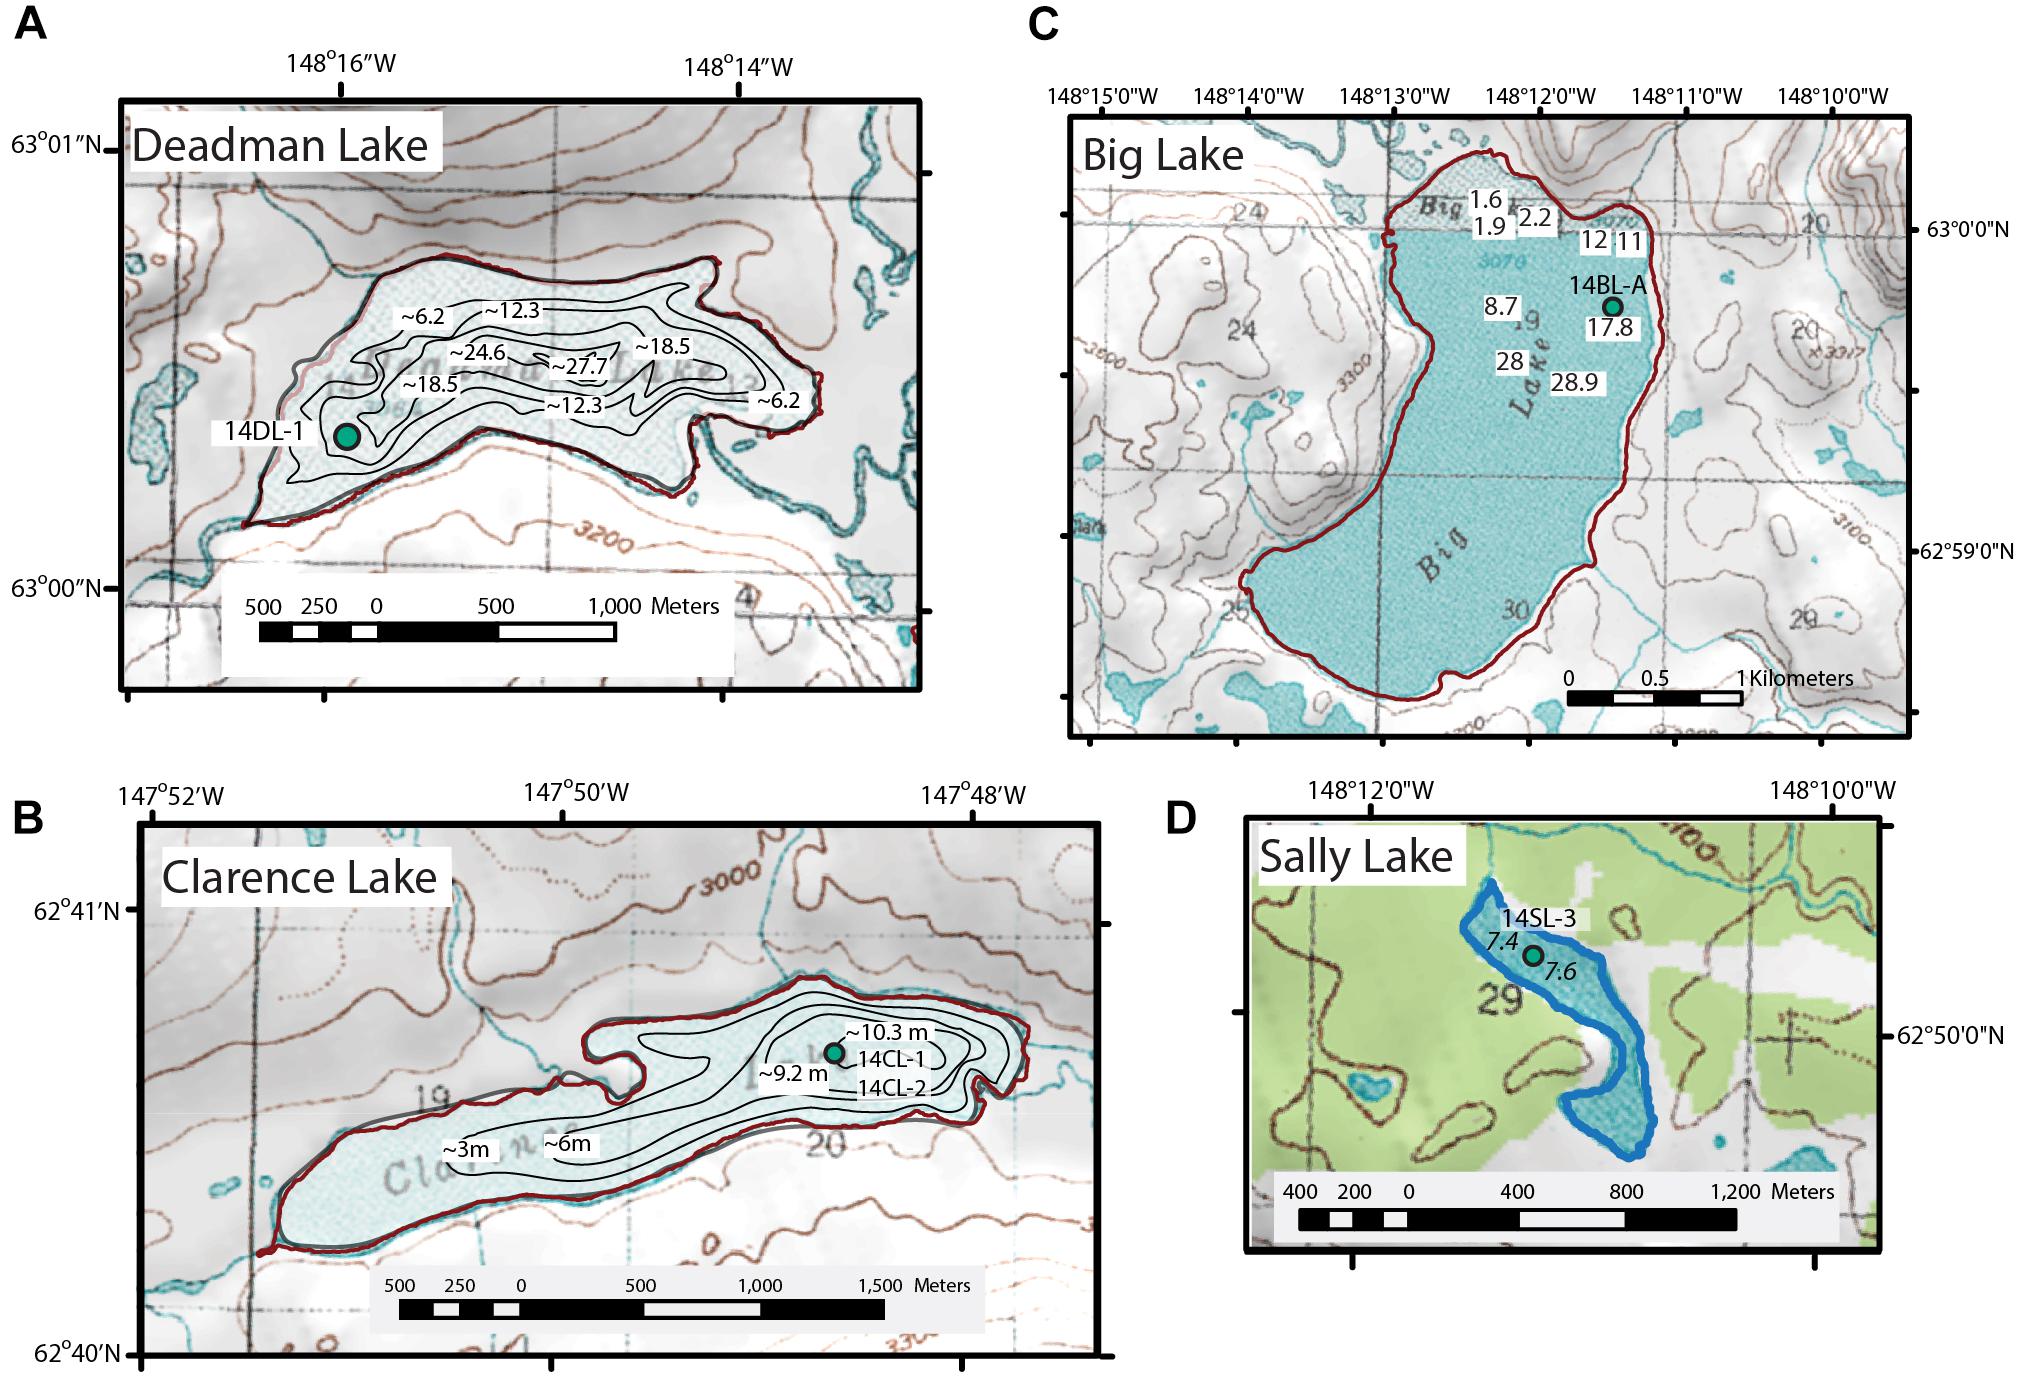
Figure 2. Lakes and coring sites (green circles) in this study. (A) Deadman Lake. (B) Clarence Lake. (C) Big Lake. (D) Sally Lake. Clarence Lake (Alaska Department of Fish and Game, 2019) and Deadman Lake (Alaska Department of Fish and Game, 1983) bathymetries were originally in feet. Spot water depths in m are marked in Big and Sally lakes. Topographic maps are USGS 1:63,360 quads and elevations are in feet.
Deadman and Big Lakes
Deadman Lake (N 63.0059°; W 148.2650°) and Big Lake (N 62.9979°; W 148.2051°) (Supplementary Table 1) are paired lakes located north of the Susitna River ∼120 km northeast of Talkeetna (Figure 1) and are situated in a basin shaped by late Pleistocene glaciations. The surrounding landscape consists of higher elevation peaks that reach up to 1,500 MASL (nearly 600 m above the lakes), which are at 934 and 936 MASL, respectively. Deadman Lake is ∼2 km long and 1 km wide with its long axis oriented roughly east-west (Figure 2). At Deadman Lake, the Alaska Department of Fish and Game (2019) bathymetric map indicates the maximum lake depth in 1983 was ∼92 feet (∼28 m). Big Lake is ∼3 km long and 1.3 km wide, with a large, shallow (1–2 m) embayment at its northwest end (Figure 2). Spot water depth measurements indicate a basin depth of at least 29 m. Deadman Lake and Big Lake were likely once part of a larger proglacial lake system in the area (Reger et al., 1990). Deadman Creek serves both as an inlet at the eastern margin and as an outlet at the western margin of Deadman Lake. Watana Creek serves as an outlet for Big Lake at its eastern shore. Inlets into Big Lake are relatively minor, draining seasonal meltwater from the surrounding hills into its basin. Present-day vegetation around the lakes is tundra with low and tall shrubs, including birch, willow, and ericads, along with alder in the creek drainages (Alaska Biological Research, 2014). A few spruce trees were noted on the slopes to the northeast of Big Lake.
Sally Lake
Sally Lake (N62.8356; W148.1878, Supplementary Table 1) is located just north of the Susitna River, ∼113 km northeast of Talkeetna (Figure 1), at an elevation ∼620 MASL. The lake is likely a kettle lake that formed on a glaciofluvial plain that was eroded by the Susitna River, which created a terrace scarp ∼1 km south of the lake (Woodward-Clyde Consultants, 1982; Dixon et al., 1985; Reger et al., 1990). The hills surrounding Sally Lake rise < 35 m above the lake margins, and are somewhat lower in elevation than those surrounding the other study lakes. The lake is about 1 km long with a width that varies between 250 and 100 m and consists of two basins. Water depth was measured only in the northern basin, where it was ∼7.6 m (Figure 2). An outlet at the northwestern margin of Sally Lake drains into Watana Creek. Boreal forest surrounds the lake, although the spruce trees are more widely scattered than at lower elevations.
Materials and Methods
Field Methods
We collected a series of lake sediment cores from the ice surface at the study lakes in April, 2014. Coring locations were chosen to avoid potential reworking due to debris flows, focusing on lakes with relatively flat basins and with water depths less than about 20 m, the maximum depth allowed by our equipment. All coring and water-depth measurement sites were located with a GPS (Supplementary Table 1). We collected the sediment-water interface with a 7 cm diameter polycarbonate corer (a Bolivia corer) and preserved the core by adding a super absorbent polymer that gelled the overlying water and stabilized the sediments. Underlying sediments were collected with a 1 m-long modified square-rod Livingstone corer with a 5 cm diameter steel barrel (Wright et al., 1984). The depths of each Livingstone drive are presented in Supplementary Table 2 and as a rule, the drives were consecutive, except at Sally Lake, where difficulties extruding the 5 cm-thick Watana tephra lead to multiple attempts to collect and extrude an undisturbed core section. At all lakes, each Livingstone drive was extruded into a split ABS pipe lined with plastic film liner, wrapped, labeled, and packaged for transport to the University of Alaska Fairbanks (UAF). We collected only one long core and one or more surface core from each of the lakes, except at Clarence Lake, where we collected two adjacent long cores (14CL-1 and 14CL-2) in addition to a surface core. The majority of the analyses were conducted on 14CL-2, although tephra analyses were conducted on both cores.
Geochronology
Sediment cores from our study lakes were dated using radioisotopes (14C [Table 1], 210Pb, and 137Cs [Supplementary Table 3]). Radiocarbon was used for pre-industrial aged samples, while 210Pb dating was employed to produce a sediment chronology over the last 160 years (1855–2014 AD). Samples for radiocarbon analysis (plant macrofossils, pollen, and in one case, Daphnia ephippia) were sieved and cleaned with reverse osmosis (RO) water prior to analysis at the Center for Applied Isotope Studies, University of Georgia. In addition to plant macrofossils, pollen extracts (primarily spruce pollen) were radiocarbon dated at the same facility. Details of the pollen extraction methods are in Supplementary Text. Only Dead Man Lake was analyzed for 210Pb and 137Cs, where the upper 10 cm of the surface core was subsampled at 0.5 cm intervals. 137Cs and 210Pb activities were measured by gamma spectrometry at the Flett Research Ltd (Supplementary Table 3). The 1966 137Cs peak1 was recognized in the top 2.5 cm of the core, confirming that physical mixing of the upper sediments was relatively negligible and would not affect the 210Pb chronology. We used Bacon ver. 3.3.5 to build the age models (Blaauw and Christen, 2011), which, using IntCal13 for calibration to cal yr BP, generates mean and median ages for each sample, as well as the 2 standard deviation (2 SD) error range.
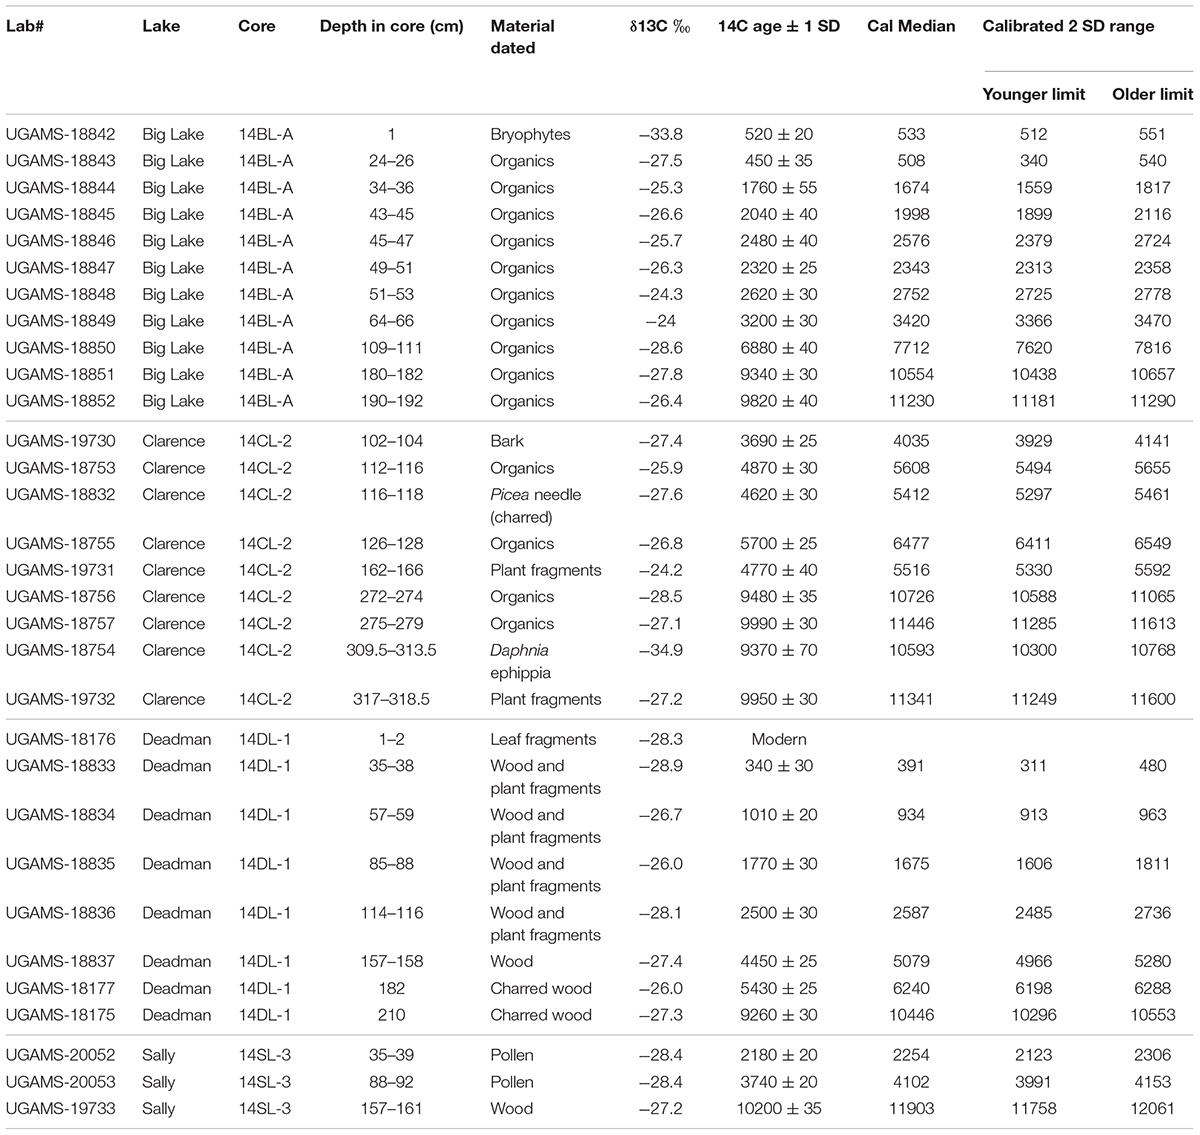
Table 1. Radiocarbon dates from the study lakes.
Tephra Identification
Tephras and presumed tephras were identified visually and texturally in split sediment core surfaces (Supplementary Table 4). Individual tephras were sampled from one side of the split core, reserving the other half for archiving. Single samples were collected for layers < 1 cm thick and multiple samples were collected for thicker layers (>1 cm) to test for possible compositional zonation. All tephra samples were processed and archived at the U.S. Geological Survey (USGS) Alaska Tephra Laboratory & Data Center in Anchorage, Alaska. Splits of the bulk samples were wet sieved using tap water into three size fractions (0.063, 0.125, and 0.250 mm) to remove very fine-grained ash and allow for microscopic analysis. Basic visual descriptions of the tephras including physical characteristics of the juvenile glass component were performed using either a binocular or a petrographic microscope at 100x and 500x magnification. All tephras were confirmed by the presence of glass shards or pumice grains and/or glass coatings on minerals and mineral fragments. For very fine-grained samples (<0.063 mm), confirming volcanic glass was not possible using traditional microscopic techniques and thus, such samples were mounted on pin mounts and imaged using the USGS JEOL JSM-6510LV scanning electron microscope in Anchorage, Alaska. Back-scattered electron images were used to determine if the deposit was volcanic based on presence of glass shards and/or glass-coated crystals.
The 0.250–0.125 mm size fraction was preferentially mounted for electron microprobe microanalysis (EPMA) or the 0.125–0.063 mm material was used for finer-grained samples. Samples finer than 0.063 mm could not be analyzed using the electron microprobe and therefore, there are no geochemical analyses for those samples. Details of the major-element glass analyses are in Supplementary Text. Glass compositions were compared among lakes and with a database of major-element compositions of reference tephras found in terrestrial sections in the Susitna River Valley (Mulliken, 2016), reference tephras from Hayes volcano (Wallace et al., 2014) and the Alaska tephra database (Cameron et al., 2019). Geochemical similarity was measured using the weighted similarity coefficient (SC) of Borchardt (1974), as well as binary plots. Similarity Coefficients of ≥ 0.95 are often indicative of correlative tephras.
Magnetic Susceptibility and Geochemistry
Magnetic susceptibility (MS) was measured using a Bartington MS ring on whole cores at 1, 2, or 5 cm intervals. Samples for stable isotopic analyses (∼1cc) were taken at four or five cm intervals from along the length of the cores. For isotope analysis, each sample was acid fumed with HCl to remove any trace amounts of carbonate. Samples were then freeze-dried and weighed for analysis using an isotope ratio mass spectrometer at the Alaska Stable Isotope Facility (ASIF) at UAF. Stable carbon and nitrogen isotope ratios are expressed in typical delta notation (i.e., δ13C and δ15N values), and are also expressed relative to the Vienna Pee Dee Belemnite (VPDB) and air, respectively. Total organic carbon (TOC [%C]) total nitrogen (TN [%N]) and C:N values were also produced from each sample analysis. Analytical precisions for δ13C, δ15N, %C and %N, based on multiple analyses of a reference standard (peptone), were <0.2, <0.3, <0.6, and <0.6, respectively.
Diatoms
For diatom analyses, a measured amount of wet sediment (between 0.11 and 0.15 g) was treated from 25 samples distributed throughout the Clarence Lake core. Diatom preparation followed standard procedures using H2O2 outlined in Battarbee et al. (2001). Cover slips were mounted using Meltmount, a plastic resin with the same refractive index as Naphrax. A minimum of 400 diatom valves were enumerated for each sample using a Leica DM microscope (1000x magnification under oil immersion). Identification followed mainly northern and western Canadian floras, including Cumming et al. (1995); Fallu et al. (2000), and Antoniades et al. (2008). A diatom-based inference model developed from a set of Alaska lakes (Gregory-Eaves et al., 1999) was applied to the sedimentary data to reconstruct past variations in relative lake depth, conductivity and total phosphorous (TP). The model was implemented and results plotted using the software C2 (Juggins, 2014).
Pollen
Pollen samples were processed using standard techniques described in Faegri and Iversen (1989). In brief, this includes adding a known quantity of exotic pollen (tablets of Lycopodium clavatum spores) and washing the sample in acid and base washes to remove carbonates, organics, and silica. The details of the pollen processing method are in Supplementary Text. Pollen preparations were mounted on slides with silicon oil and analyzed at 400x and 1,000x. Pollen identifications were made by comparison with the pollen reference collection housed at UAF, as well as comparison with published pollen atlases (McAndrews et al., 1973; Moriya, 1976; Moore et al., 1991). As the pollen grains were counted, the exotic pollen (Lycopodium clavatum) was also tallied so that pollen concentration [grains(cm-3)] and influx [grains(cm-2)(yr-1)] could be calculated, in addition to percent calculations. Details of the percent calculations are in Supplementary Text. Pollen diagrams were made with Tilia ver. 2.1.1 (Grimm, 2016). At Clarence and Deadman lakes, pollen counting stopped when a sum of at least 300 terrestrial pollen grains was reached. With Sally Lake, counting stopped at a terrestrial pollen sum of ∼120–200 grains.
Results
Chronologies
A suite of thirty-one radiocarbon dates from the cores, plus a suite of nine 210 Pb samples from Deadman Lake form the chronologies (Table 1 and Supplementary Table 3).
For Clarence Lake, in the forest-tundra ecotone, nine radiocarbon dates form the age model (Figure 3). The median 2 SD range is 915 years, with a maximum 2 SD range of about 1589 yr at ∼2060 cal yr BP. The core base, which is nearly 40 cm below the lowest 14C date, has a modeled age of about 12,280 cal yr BP.
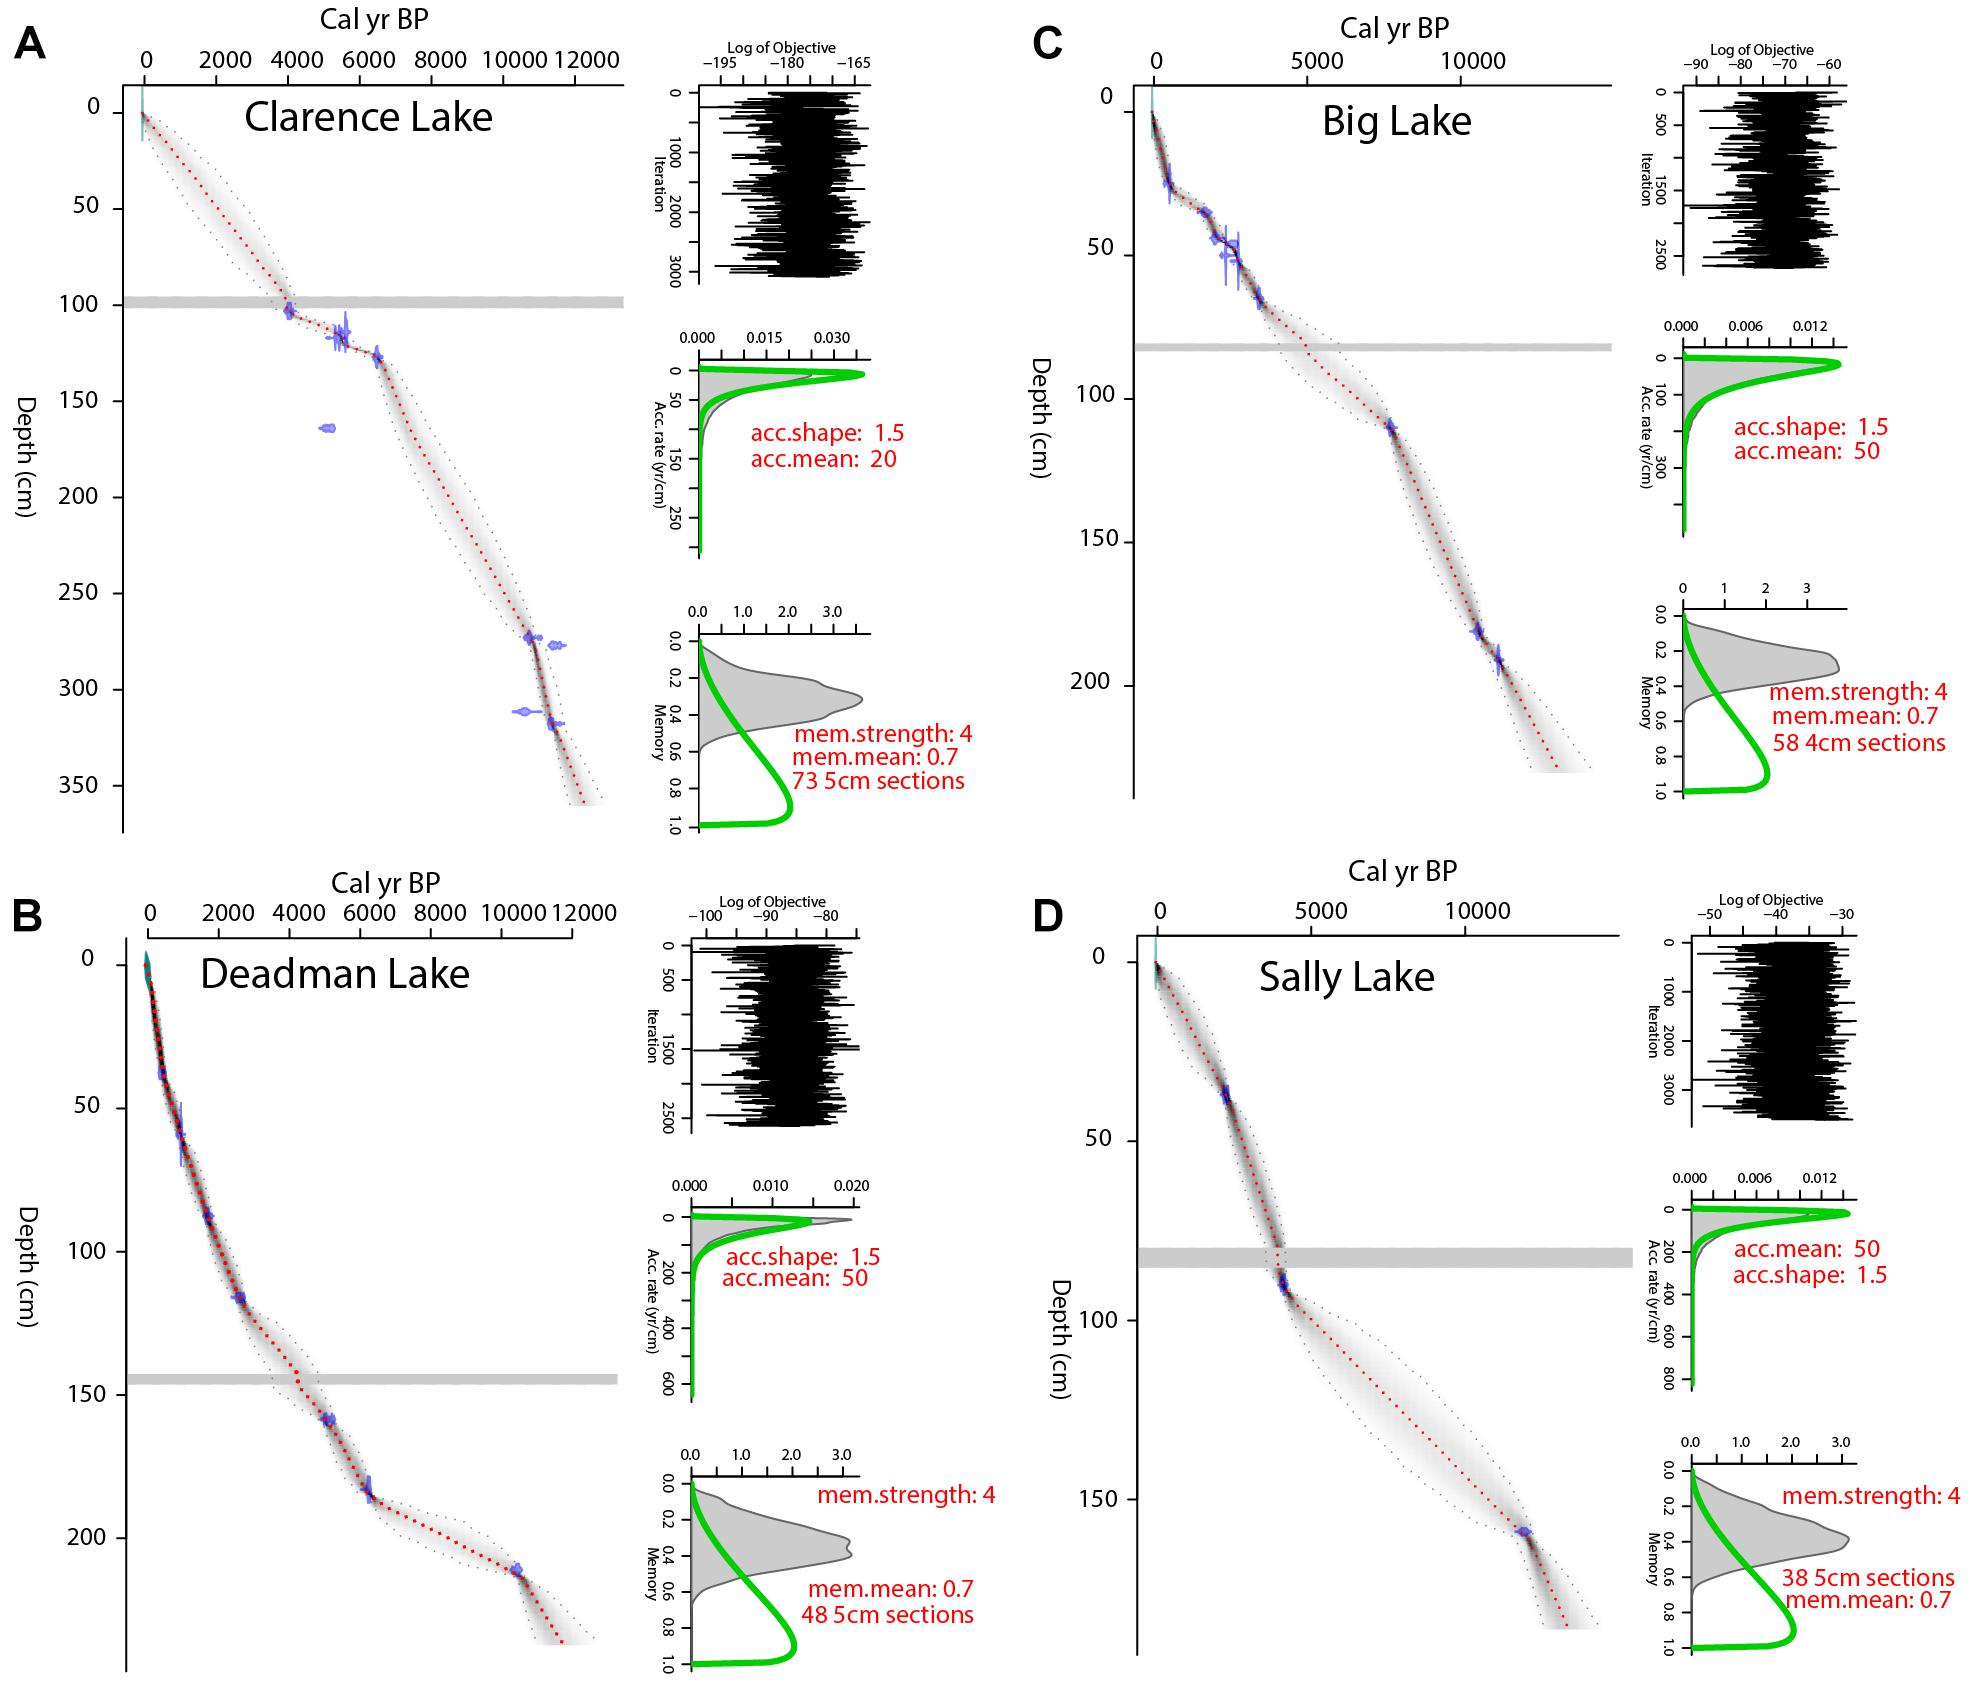
Figure 3. Bacon-generated age models (Blaauw and Christen, 2011) for (A) Clarence, (B) Deadman, (C) Big, and (D) Sally lakes. Red, dashed lines mark the mean ages and gray shading marks the 2 SD error range. In each plot, the horizontal bar marks the Watana tephra.
The age models for adjacent Deadman and Big lakes are based on eight and 11 radiocarbon dates, respectively. Deadman Lake also has a suite of nine210Pb ages (linear model) for the top 4.5 cm. The Deadman Lake chronology has a median 2 SD error of 488 years, with a maximum 2 SD range of nearly 2500 years at ∼8600 cal yr BP. The Deadman record dates at least to ∼10,440 cal yr BP, although if one extrapolates, the core base dates at least to ∼12,000 cal yr BP (Figure 3). At Big Lake, the median 2SD range is 866 yr, with the maximum 2SD range of 2136 yr at ∼5660 cal yr BP. The Big Lake chronology may be running old, at least in the middle Holocene, as the modeled age for the Watana tephra is ∼900 yr older than published ages of ∼4000 cal yr BP for this deposit (Beget et al., 1991; Wallace et al., 2014; Mulliken, 2016). This chronology indicates that the Big Lake record dates to ∼11,230 cal yr BP, though the core base is substantially older if one extrapolates (Figure 3).
Sally Lake, in the boreal forest, has a chronology based on three radiocarbon dates and is the least well-dated of the sites. The median 2 SD range is 1068 years, with a maximum 2 SD range of 3334 years at ∼8590 cal yr BP. The core dates at least to ∼11,800 cal yr BP, but may date to ∼13,000 cal yr BP if one extrapolates (Figure 3).
Lithology and Magnetic Susceptibility
At Clarence Lake, the basal 40 cm of sediment is silt and sand, reflecting an ephemeral and shallow lake (Figure 4). Above this (starting at about 320 cm, ∼11,450 + 280/-110 cal yr BP [ages and 2 SD errors are rounded to the nearest decade]) and continuing to the core top, gyttja (organic-rich lake mud) dominates. Zones of mm-scale laminae occur at 320–260 cm (∼11,450 to ∼10,350 + 370/-470 cal yr BP) and 178–110 cm (∼7,800 + 620/-520 to 4,820 + 410/-500 cal yr BP). Silt bands are scattered throughout the core, though they dominate in the basal half (below ∼200 cm) and two mm-scale diatom layers were also identified at 211 cm and 238 cm. Six visible tephras are preserved at Clarence Lake. They range from 0.05 to 4 cm thick and are located at 330.5, 289, 226.5, 224.5, 98–102, and 49 cm below the sediment-water interface.
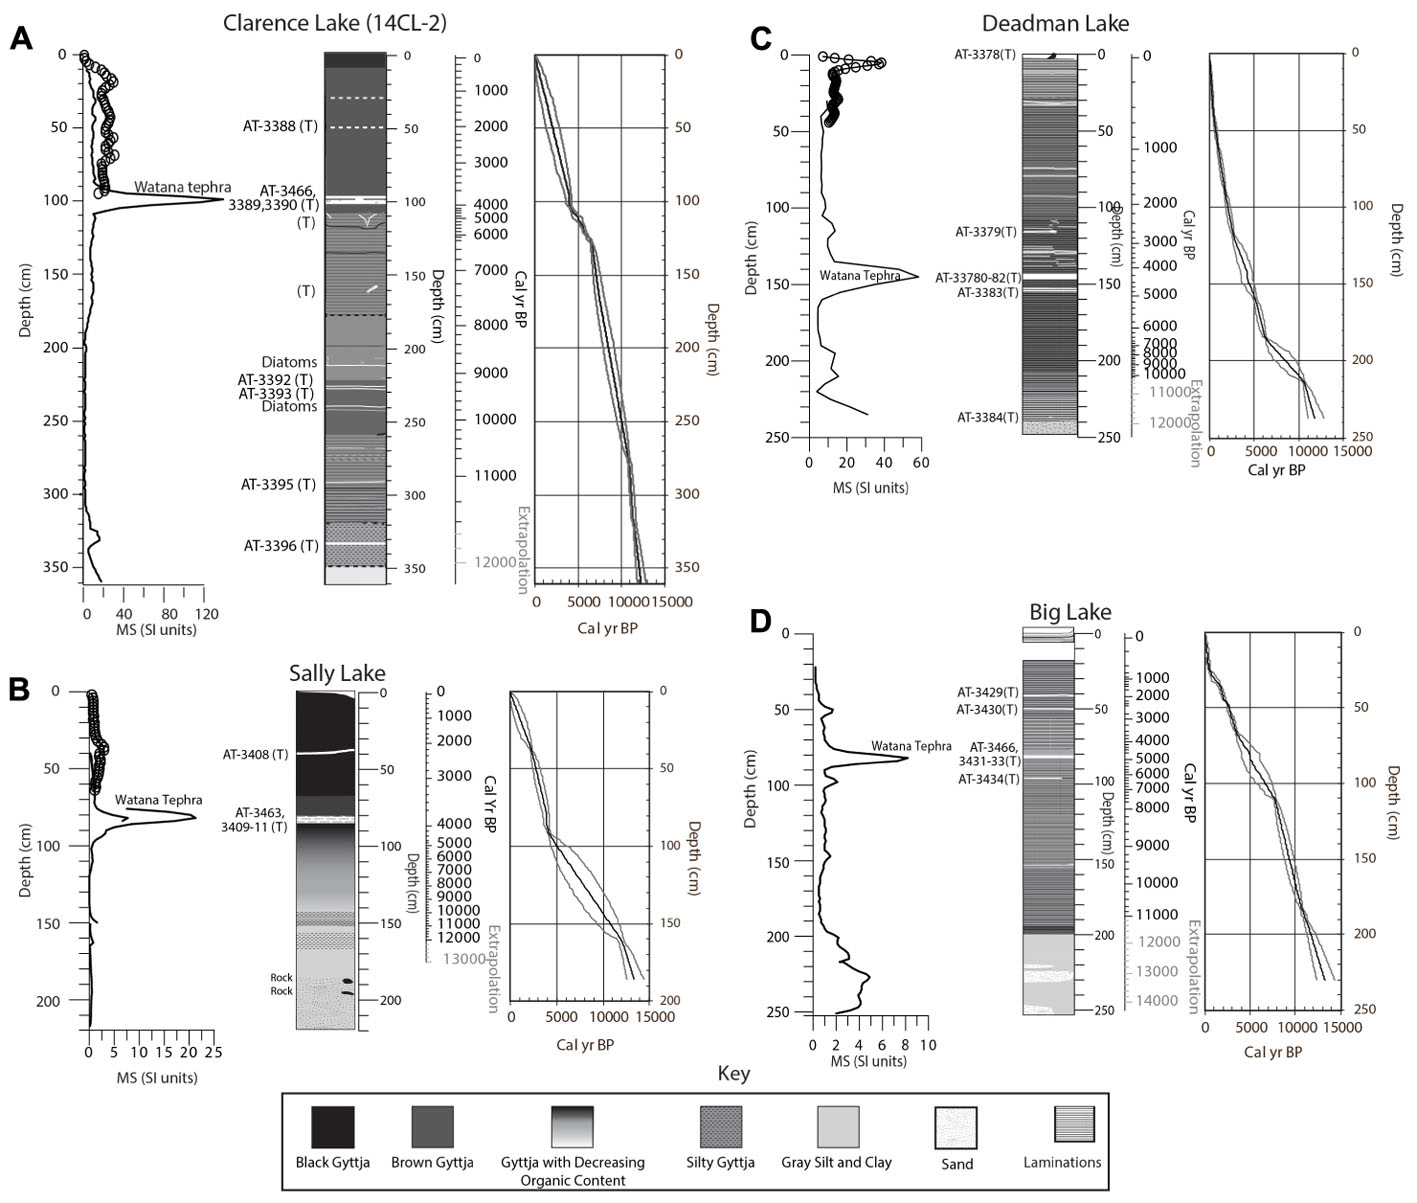
Figure 4. Core stratigraphies, MS measurements and age scales, with 2 SD error envelopes for (A) Clarence, (B) Sally, (C) Deadman, and (D) Big lakes. Tephra units are marked with “(T)”and analyzed tephras are indicated by the sample number (AT-#). These sample numbers are keyed to Figure 5 and Supplementary Table 4. Circles on the MS graphs are measurements from the surface core for each lake. In the age scales, gray-shaded ages are extrapolations below the lowest radiocarbon date. In the error envelopes, the thick black line marks the mean sample age and gray lines mark the 2 SD error range.
Magnetic susceptibility (MS) peaks in Clarence Lake (Figure 4) mark the major tephra units at about 100 and 330 cm. However, the thin, mm-scale tephras were not identified through MS because the analytical resolution was too coarse. The MS data do indicate areas with low mineral influx (when the MS is near zero), such as ∼300–200 cm (∼11,150 + 360/-170 to ∼8,490 + 680/-610 cal yr BP). MS increases higher in the core, with the core top having MS values that are only slightly less than the silt and clay at the base.
In Deadman Lake, the basal ∼10 cm of the core is gray silt, sand, granules and probably represent the lake basin prior to filling (Figure 4). Above this is about 20 cm of gray and tan silt, to about 210 cm below the sediment-water interface. The presence of Pediastrum nets indicate the basin was perennially filled (if shallow) at this time. Starting at ∼220 cm (∼10,900 + 510/-330 cal yr BP), the remainder of the core is gyttja with bands of laminae, fine silt, and tephra. Lenses of fine silt are present after about 4,060 + 650/-700 cal yr BP (∼140 cm) and probably represent episodes of shoreline instability. The MS spikes in Deadman Lake mark tephras ranging in thickness from 0.5 mm to 4 cm at 142–146 cm (Watana), ∼116 cm, and at the core top. However, two additional tephras at 153.5 and 237 cm have low MS values, and aside from the tephras, MS values are low throughout the core, except at the core base where there is increasing silt and sand.
In Big Lake, the basal ∼50 cm (∼250–200 cm) is dominated by gray silt and clay with sand bodies (Figure 4). Starting at 200 cm (∼11,710 + 520/-410 cal yr BP [but ages below ∼82 cm may be too old]), laminated silty gyttja (indicating a perennial lake) dominates much of the remainder of the core with occasional zones of massive gyttja. The gyttja is increasingly organic-rich in the upper 50 cm (younger than ∼2,670 + 60/-190 cal yr BP), where the laminations also become less frequent. Tephras, ranging in thickness from 1 mm to 4 cm, are located at 96, 80 (Watana), 49, and 40 cm below the sediment-water interface and are also marked by the MS data. Aside from the tephras, the MS values are highest in the sand and silt at the core base. The lowest values are in the gyttja and near the core top.
In Sally Lake, the basal ca 35 cm of the core (∼219–168 cm) consists of sand, clay, silt, rocks, and ∼15 cm of gray sticky clay (Figure 4). Shells were not observed in the core, but the δ13C data from this level strongly suggests the presence of carbonates, which would be consistent with loess deposition or possibly an ephemeral lake. Above this, starting abruptly at about 168 cm, silty gyttja and then gyttja dominate the core. Extrapolating from the nearest radiocarbon date, about 10 cm higher in the core, the transition to silty gyttja occurred ∼12,440 + 560/-470 cal yr BP and marks the onset of a perennial lake. The gyttja is initially light-colored, but darkens up-core, indicating increased organic input. Two tephras are preserved in the core and are marked by the MS data (Figure 4), a ∼4 cm thick continuous tephra at 81–85 cm (Watana) and a 0.5 cm thick layer at 39 cm. MS is lowest about 150–120 cm (∼10,750 + 970/-1,390 to ∼7,320 + 1,680/-1,500 cal yr BP) and increases slightly in the non-tephra layers higher in the core.
Tephras
Six distinct tephra deposits were identified among the two Clarence Lake cores, five of which were found in both cores, and one that was only identified in core CL-2 (Figure 4 shows only CL-2 as it is the more complete core). In core CL-1, five tephras were identified, but only two were coarse-grained enough to be geochemically analyzed. In core CL-2, six tephras were identified, of which five were of adequate grainsize to be geochemically analyzed. Of the six analyzed tephras from the Clarence Lake cores, only one correlates with Susitna River Valley reference tephras (the informally named Watana tephra, a widespread deposit found in terrestrial sections in the Susitna River Valley [Dilley, 1988; Dixon and Smith, 1990; Mulliken, 2016]). This 5 cm-thick tephra at ∼96–101 cm depth was subsampled to check for chemical zonation or the possibility that it may be a composite of multiple tephra layers erupted over time from the same volcano. There is definite geochemical spread within these subsamples (Supplementary Table 4 and Figure 5) although all analyses correlate together with very high similarity coefficients (SC) (0.95–0.99) and also correlate with the Watana tephra. However, tephras at 289 and 330.5 cm, the lowest two tephras in core CL-2, are geochemically identical to the 5-cm thick Watana tephra (96–101 cm depth), which is confusing and suggests that eruptions from the same source volcano occurred more than 11,000 cal yr BP. There is no known evidence of an eruption of Hayes volcano during this time frame, although deposits of this age are rarely preserved due to vast ice cover at this time and this could be a newly discovered eruption of Hayes. These layers are distinct and continuous in the core and therefore considered true layers and not a relic of the coring process. The upper-most tephra at 49 cm depth strongly resembles tephra from Augustine volcano, based on comparison with published glass geochemistry queried from the Alaska Tephra Database (Cameron et al., 2019).
Deadman Lake contains five distinct tephra deposits (Figure 4), all of which were geochemically analyzed (Supplementary Table 4 and Figure 5). Of the five tephra layers, only one (at 142–146 cm depth) geochemically correlates to terrestrial reference tephra from the Susitna River Valley (Watana tephra with SCs of 0.98–0.99). The upper-most tephra at 0–2 cm depth strongly resembles tephra from Augustine volcano, based on comparison with published glass geochemistry queried from the Alaska Tephra Database (Cameron et al., 2019). The remaining four tephras are unknown.
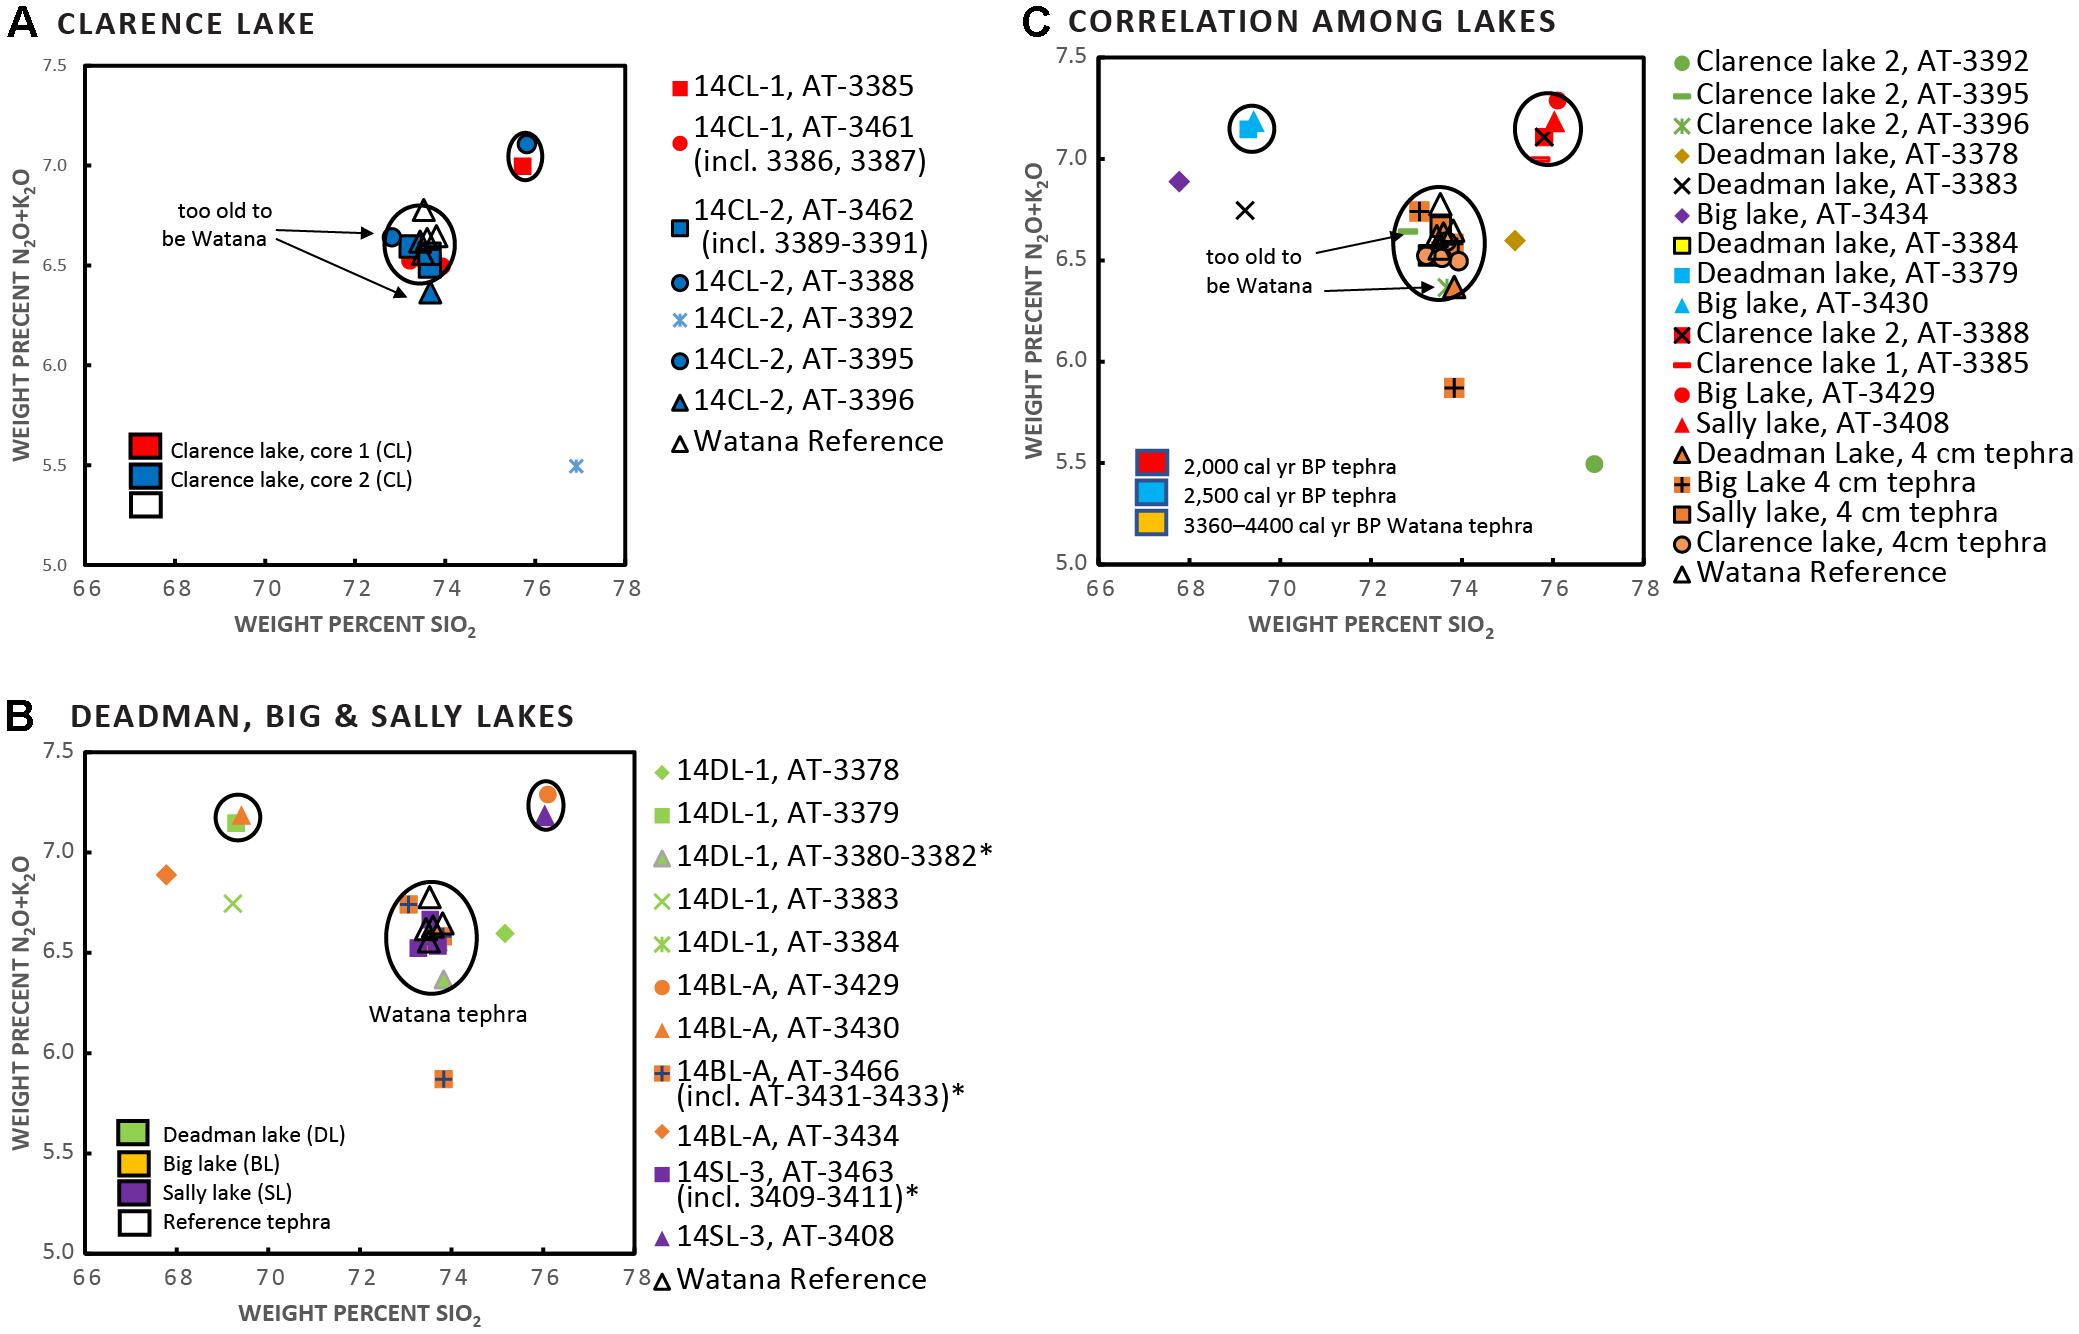
Figure 5. Geochemical scatter plots of tephra units at (A) Clarence Lake, (B) Deadman, Big, and Sally lakes, and (C) Correlations between lakes. In (A–C), each symbol is identified first by the core, then by a unique number (AT-#). Asterisks indicate multiple samples from a single tephra horizon. Figure 4 shows the stratigraphic placement of the samples (identified by AT-#). In all plots, the open triangle marks the Watana reference material.
Big Lake contains four distinct tephra deposits (Figure 4), all of which were geochemically analyzed (Supplementary Table 4 and Figure 5). Of the four tephra layers, only one 4 cm-thick tephra at 80–84 cm depth geochemically correlates to a terrestrial reference tephra from the Susitna River Valley (Watana tephra, with SCs of 0.95–0.96). Subsamples of the prominent 4-cm thick tephra show a high degree of similarity (SCs of 0.95-97). The remaining three tephras are unknown.
Sally Lake contains two distinct tephra deposits (Figure 4), both of which were geochemically analyzed (Supplementary Table 4 and Figure 5). A prominent tephra about 4 cm thick at 81–85 cm is geochemically correlates with Susitna River Valley Watana reference material (SC of 0.96–0.98). Subsamples of this tephra show a high degree of similarity (SC of 0.97–0.99). The upper-most tephra at 39–41 cm depth strongly resembles tephra from Augustine volcano, based on comparison with published glass chemistry queried from the Alaska Tephra Database (Cameron et al., 2019).
Correlation of tephra deposits among the four lakes and with Susitna River Valley reference tephra was assessed using stratigraphic context, radiocarbon age, physical sample characteristics, and geochemical similarity (Figures 5, 6). Correlations of individual samples among lakes are also shown in Supplementary Table 4.
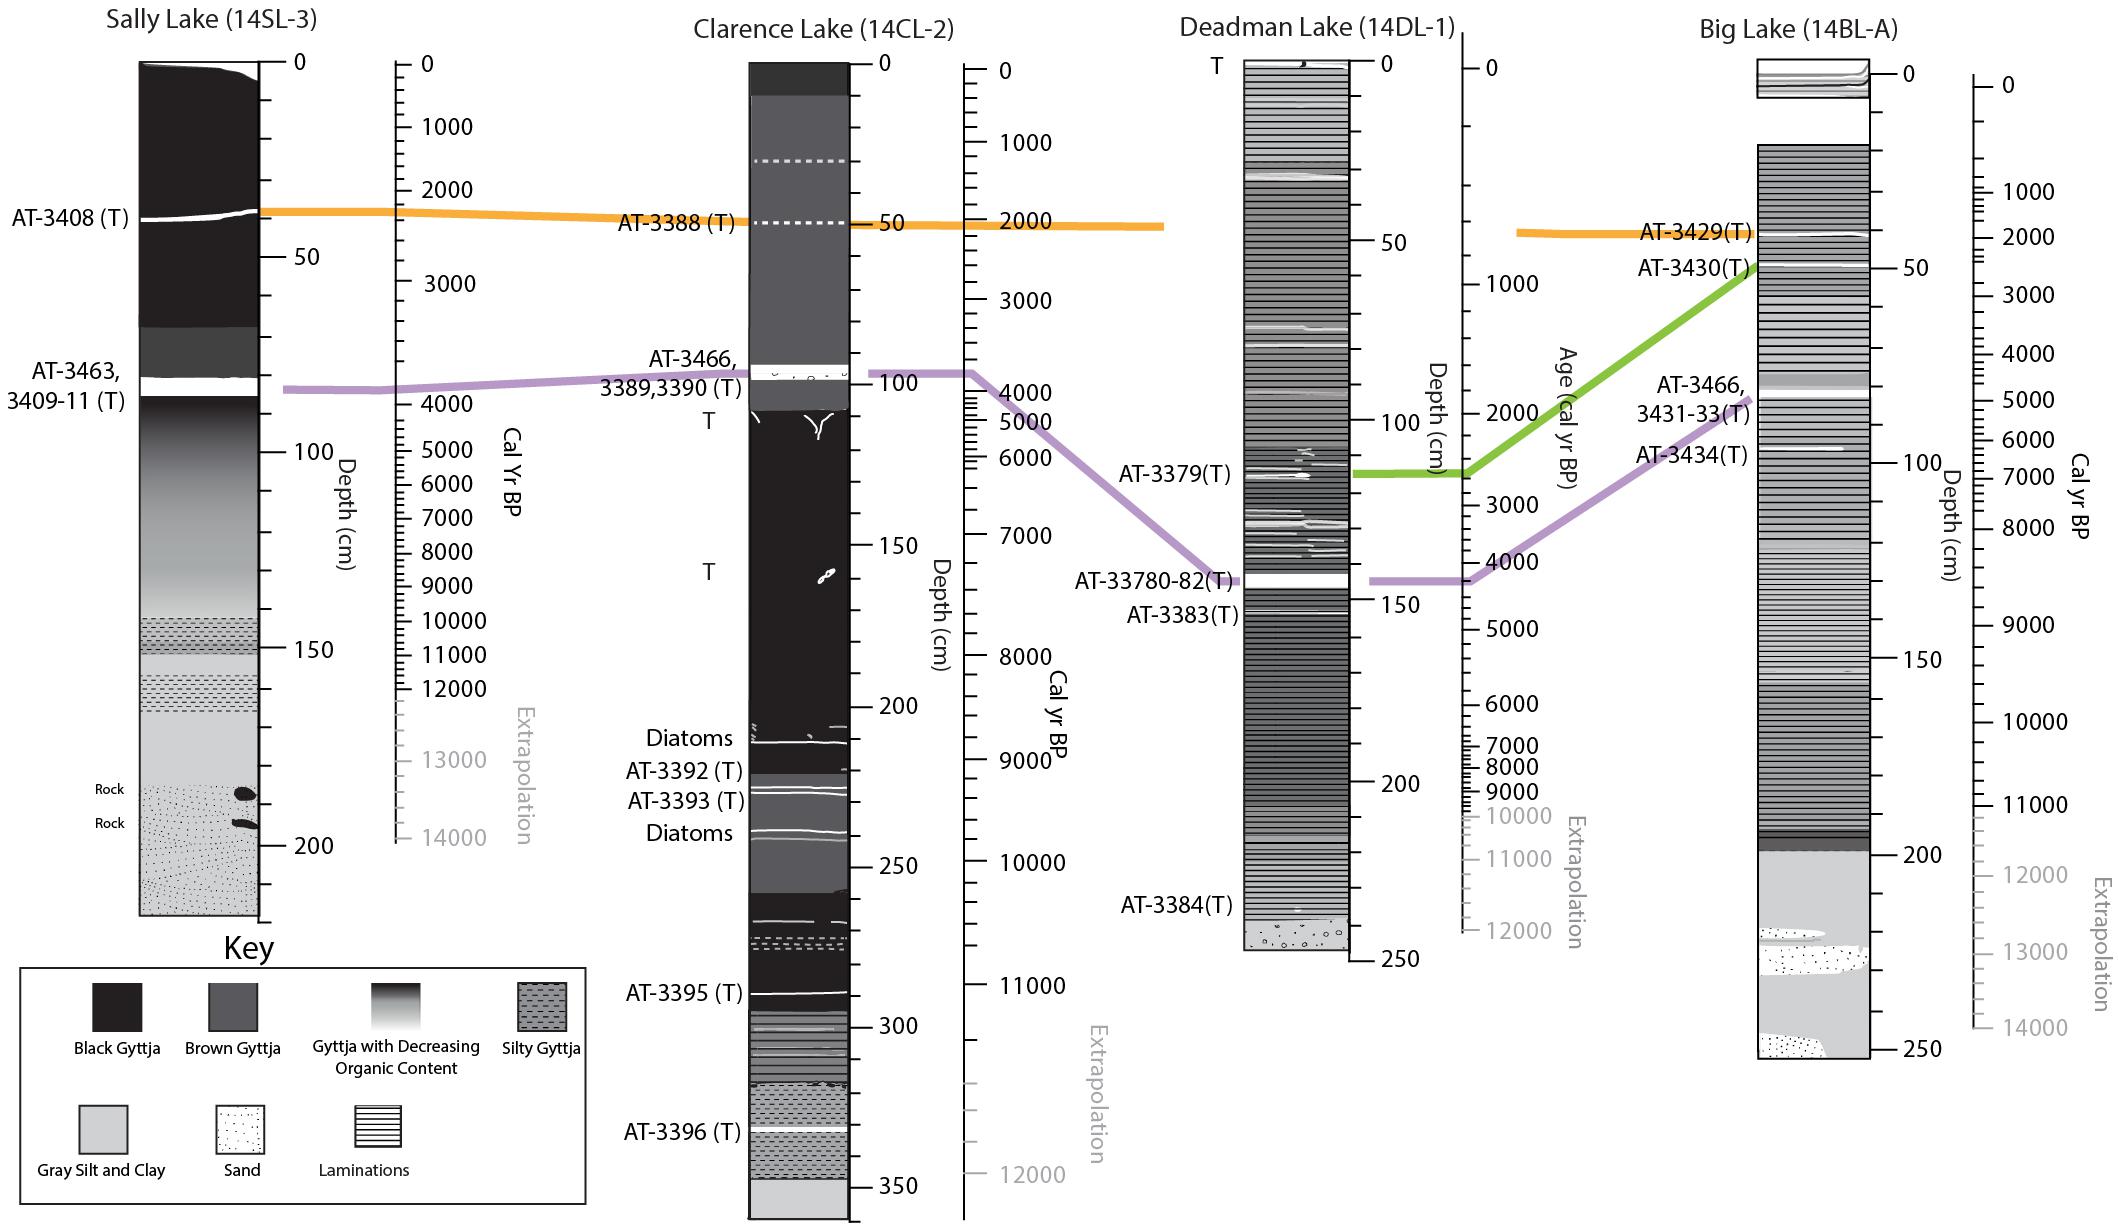
Figure 6. Stratigraphic correlations of the tephra units among the study lakes. The purple line marks the Watana correlates, the orange and green correlates are unknown.
The late Holocene Watana tephra is present in all four lakes as a prominent 4–5 cm thick layer (Figure 6). With the exception of Big Lake, the lacustrine chronologies are internally consistent, indicating an age of 3900 (Sally and Clarence lakes) to 4,200 cal yr BP (Deadman Lake) for this tephra fall, which is within the range of terrestrial ages for this deposit in the middle Susitna Valley (Mulliken, 2016). In contrast, the Big Lake chronology indicates an age of ∼4,900 cal yr BP. The most parsimonious explanation is a problem with the Big Lake chronology and is unlikely the result of multiple eruptions.
Two additional tephras have been correlated between the lakes, although they are unknown in the regional Susitna River Valley tephra stratigraphy. The older tephra, aged about 2,500 cal yr BP, is present in Deadman and Big Lakes (SC 0.98), but is absent in the lower elevation Clarence and Sally lakes. The youngest tephra, dated ∼2,000 cal yr BP is present in Sally, Clarence, and Big lakes, but is absent in Deadman Lake (Figure 6).
Paleoecology
%C, C/N, δ13C, and δ15N
At Clarence Lake (Figure 7), %C is < 3% from the core base to 320 cm (∼11,450 + 280/-110 cal yr BP), where it abruptly increases, first to 5% and then to 7%. With some fluctuations, %C remains at about 7% to ∼180 cm (∼7,850 + 620/-530 cal yr BP), when it gradually decreases to modern levels (∼5%), with a very brief and abrupt decrease to 3% immediately above the Watana tephra. C/N ratios vary around 10% in the lower half of the core, rising slightly above the Watana tephra to ∼13%, indicating greater allochthonous material entering the lake (Meyers and Ishiwatari, 1993). δ13C is elevated (∼-30‰) from the core base to ∼315 cm (∼11,320 + 350/-160 cal yr BP), subsequently decreasing to ∼-33‰ at 290 cm (∼11,030 + 310/-150 cal yr BP) and then gradually rising again so that at 160 cm (∼7,300 + 530/-410 cal yr BP) it is only slightly lower than modern levels of -27‰.
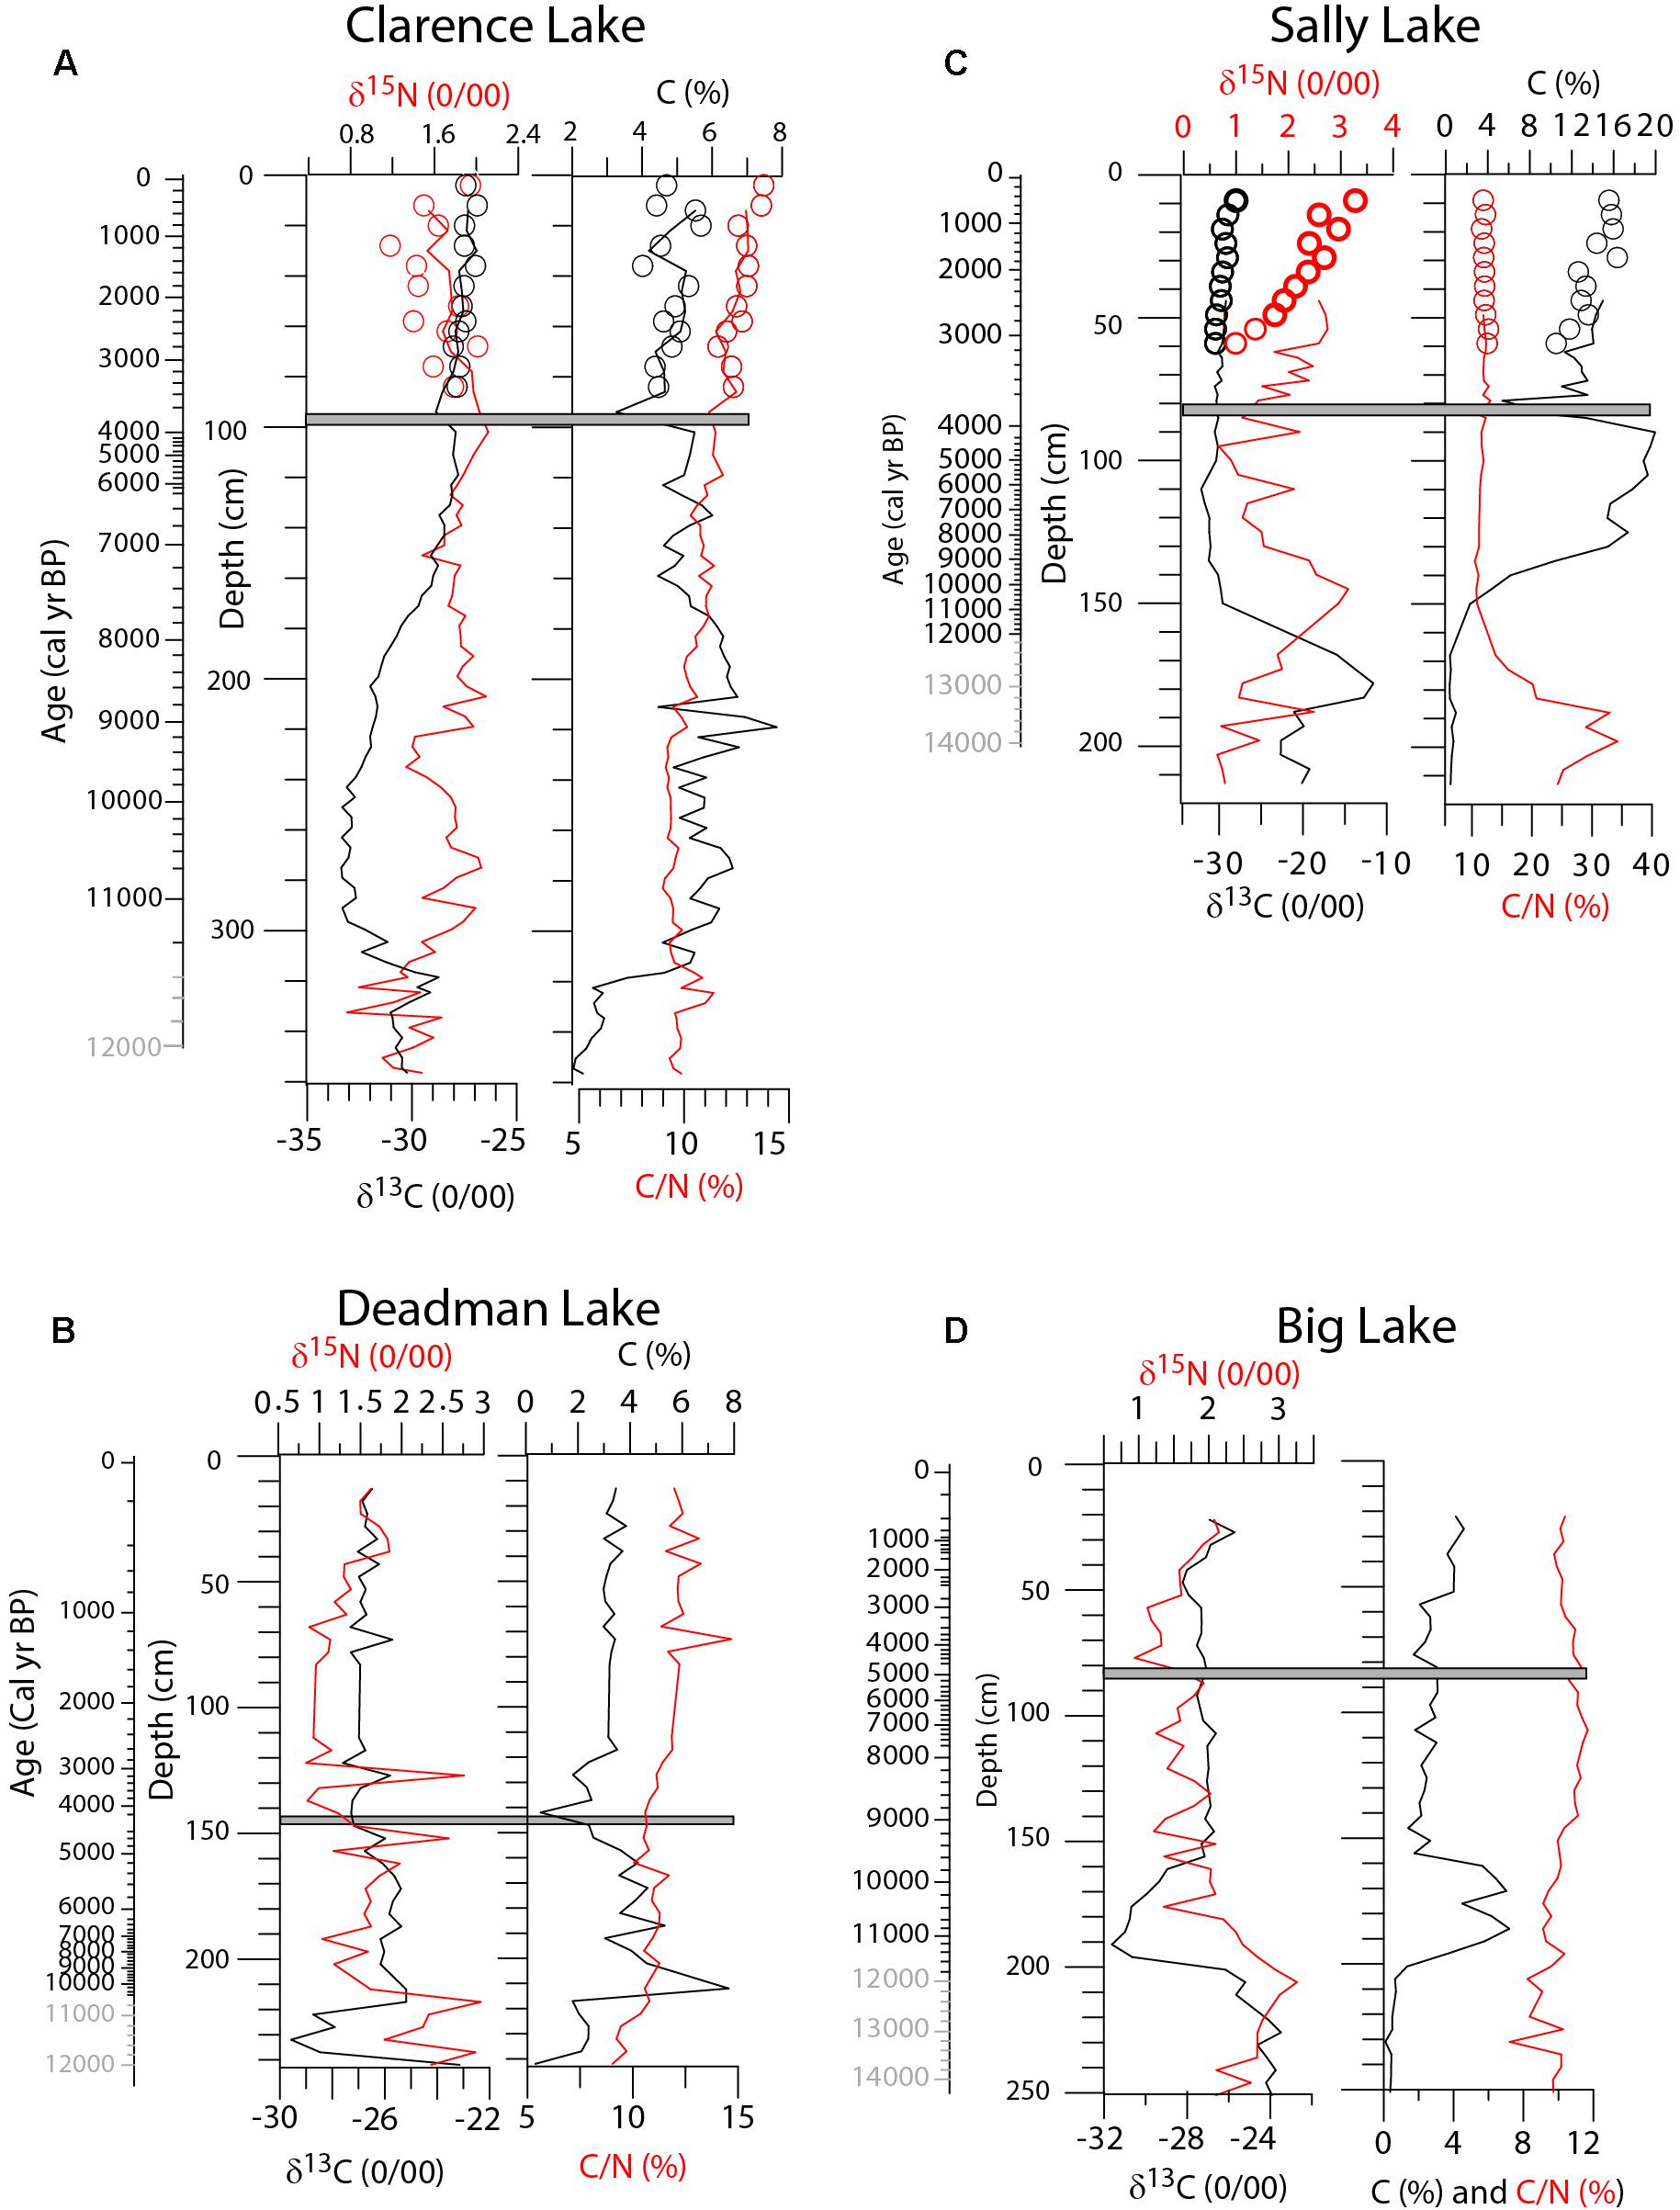
Figure 7. δ13C, δ15N, %C, and C/N for (A) Clarence Lake, (B) Deadman Lake, (C) Sally Lake, and (D) Big Lake. The gray bar in all plots marks the Watana tephra. Ages in gray are extrapolations.
%C at Deadman Lake is ≤2% from the core base to ∼210 cm (∼10,040 + 480/-800 cal yr BP), where it increases to ∼8% (Figure 7). %C subsequently decreases to ∼4% at 160 cm (∼5120 ± 190 cal yr BP) and decreases again to <1% immediately above the Watana tephra. %C then increases to near modern levels of 3–4%. C/N ratios fluctuate around 10% for most of the record, though increasing to ∼13% by the core top. δ13C is high (-23‰) at the extreme base of the core, immediately decreasing to ∼30‰, where it remains until 220 cm (∼10,900 + 510/-330 cal yr BP) where it increases again ∼-25‰. δ13C values then gradually decrease to ∼-27‰ at 150 cm (∼4,470 + 520/-660 cal yr BP), where it remains until the core top.
The Big Lake chronology is problematic and the ages mentioned here (especially at depths > 80 cm) are probably too old and should be viewed with caution. %C at Big Lake is <1% at the base of the core, rising to ∼5% at ∼190 cm (∼11,150 + 180/-270 cal yr BP), remaining at that level to ∼160 cm (∼9,750+460/-550 cal yr BP) and subsequently falling to ∼2%, where it stays for the remainder of the core (Figure 7). C/N ratios fluctuate around 10% for the entire core. δ13C is high (∼-24‰) at the core base, decreasing to ∼30‰ at ∼200 cm (11,710 + 520/-410 cal yr BP). Subsequently, δ13C values increase, so that by ∼140 cm (8,940 + 520/-500 cal yr BP) it is ∼-28‰, where it remains until ∼40 cm (∼1,920 + 260/-270 cal yr BP), where it then increases to ∼-26‰.
Sally Lake, because of carbonates in the core, has a markedly different geochemistry. %C is <1% from the core base to ∼150 cm (∼10,750+970/-1,390 cal yr BP), where it increases first to 5% and then to 15% at 130 cm (∼8,470 + 1,580/-1,690 cal yr BP) (Figure 7). At 90 cm (∼4,090 + 160/-180 cal yr BP) %C is about 20%, subsequently decreasing to 5% immediately above the Watana tephra. Afterward, %C increases to modern levels of 14–15%. C/N ratios are high (>20%) at the base of the core (probably reflecting incomplete removal of carbonates, even after acid-fuming of the samples), decreasing to ∼10% at 150 cm (∼10,750 + 970/-1,390 cal yr BP). δ13C values are very high (up to -10‰) from the core base to ∼170 cm and reflect carbonate in the core. By 150 cm, δ13C values decrease to ∼-30‰, where they stay for the remainder of the core.
The δ15N values at all the lakes fluctuate very little, (∼1–3‰), throughout their records, indicating the source of nitrogen was within the watersheds and not from marine sources, such as from anadromous salmon.
Diatoms
The Clarence Lake diatom record (Figure 8) can be divided into two main periods: the first, older, section of the core (diatom zones 1a, 1b, 1c, and 1d; 357–170 cm, >∼11,400 to ∼7,560 + 600/-460 cal yr BP), is largely dominated by the planktonic taxon Aulacoseira subarctica (up to 72% relative abundance). This taxon is associated with deep, productive (high nutrient) subarctic lakes (e.g., Gregory-Eaves et al., 1999; Moos et al., 2009). Its dominance in the older section of the core indicates that Clarence Lake in the past was generally much deeper and more productive than today. Other components of the assemblage in this section include other planktonic species often associated with productive lakes, including Stephanodiscus minutulus, S. parvus, Asterionella formosa, and Discostella pseudostelligera.
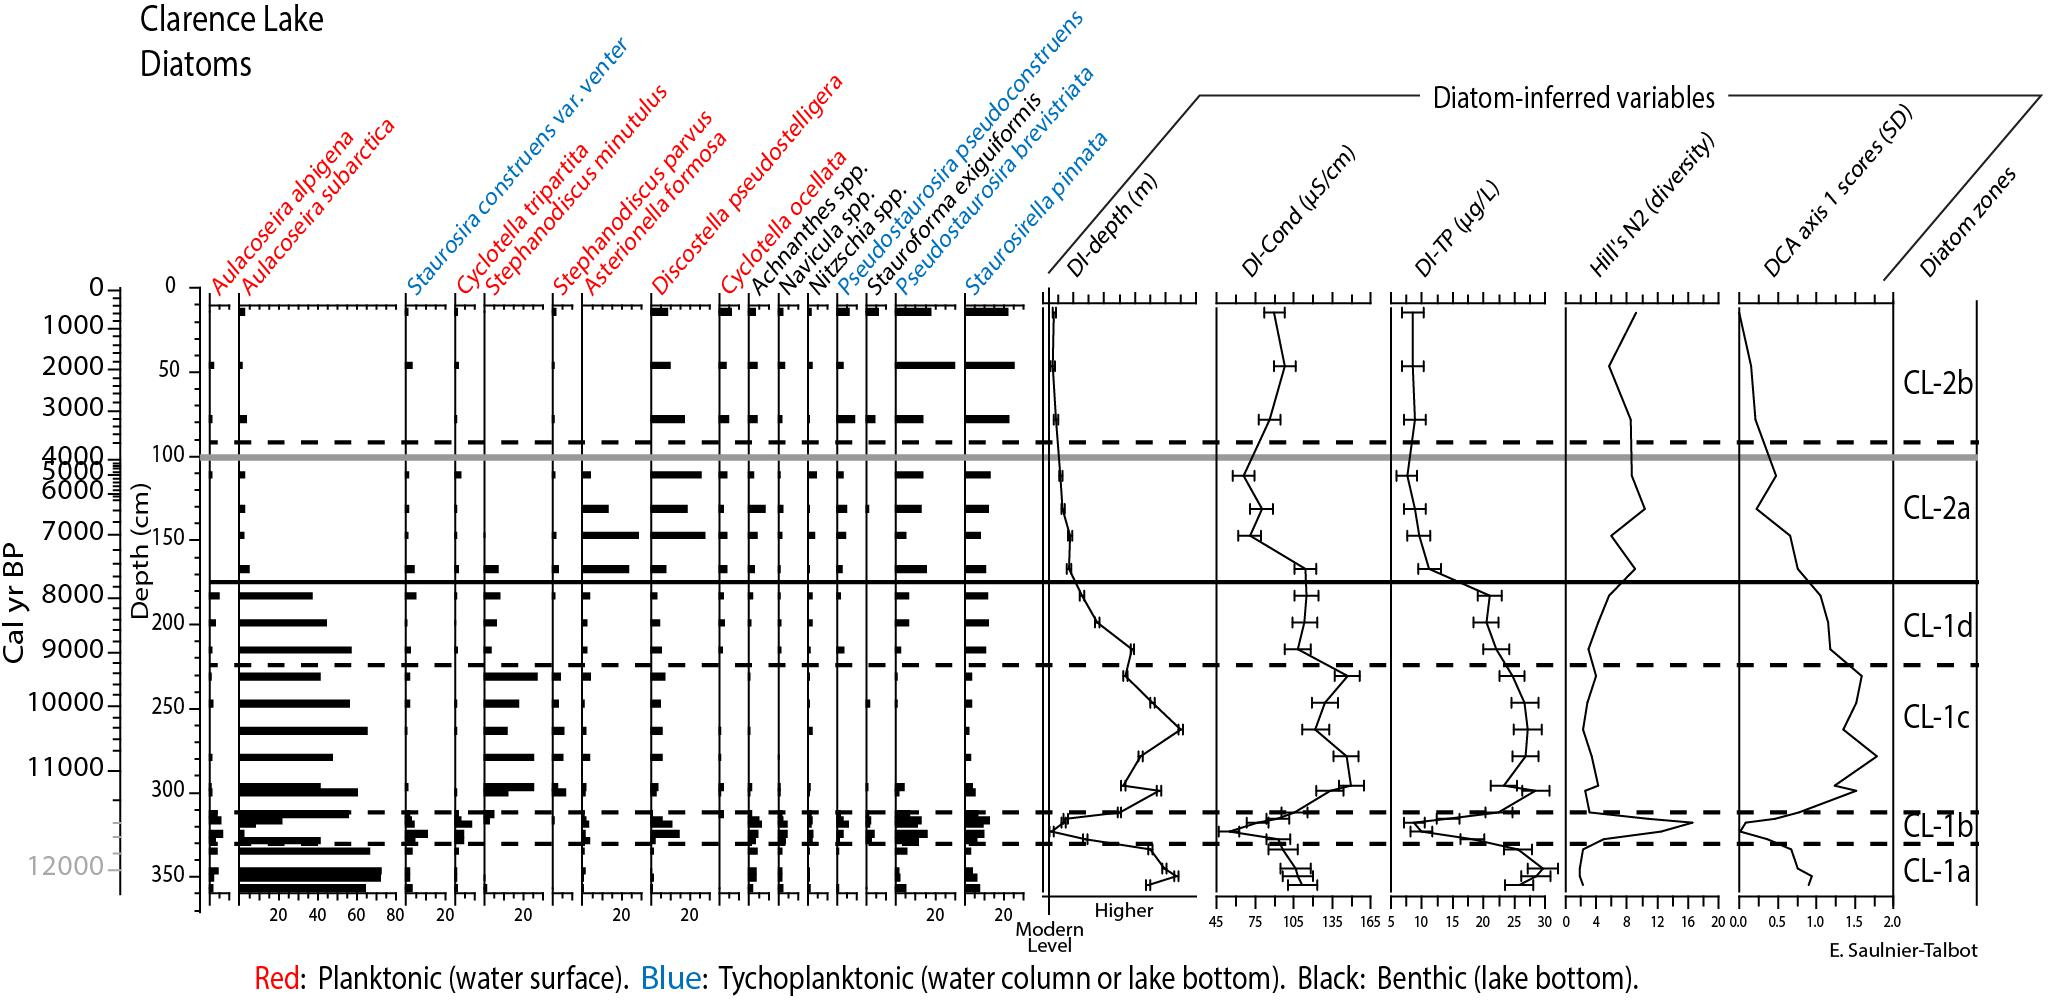
Figure 8. Diatom relative abundances (%) and diatom-inferred variables at Clarence Lake. Diatom taxa are color-coded according to life-form (planktonic, tychoplanktonic, and benthic). The gray bar marks the Watana tephra. Ages in gray are extrapolations. Reconstructed water depth is dimensionless and labeled relative to the modern water level because the maximum reconstructed water depths were unrealistically high, even though the pattern of water level change is probably reliable.
This older section of the record can be subdivided into four sub-zones. The first sub-zone (zone 1a; 357–330 cm (>∼11,670 + 350/-190 cal yr BP) is strongly dominated by A. subarctica. Small Fragilaria sensu lato (Staurosira construens var. venter, Pseudostaurosira brevistriata, Staurosirella pinnata) are also present in the assemblage. The second sub-zone in this section (zone 1b; 330–313 cm, ∼11,670–11,300 + 350/-160 cal yr BP) is particular in that there is a sudden and significant change in the assemblage, with an important increase in species richness (the most diverse of the entire record) and a switch from a dominance of A. subarctica to an assemblage where small tychoplanktonic (water column and bottom-living) Fragilaria sensu lato dominate, along with planktonic cyclotelloid species (Cyclotella tripartita, C. ocellata, Discostella pseudostellligera). Achnanthaceae and Navicualceae are also present in the assemblage. Chrysophyte cyst abundances (not shown) drop markedly in this sub-zone relative to the preceding and following sub-zones. The sudden change in assemblage composition in zone 1b indicates a probable short-lived drop in lake-level, presumably reflecting increased aridity. In the third sub-zone (zone 1c; 313–225 cm, ∼11,300 to ∼9,280 + 590/-620 cal yr BP), there is a switch back to high relative abundances of A. subarctica, along with high relative abundance of planktonic S. minutulus. S. parvus, A. formosa, D. pseudostelligera, and S. pinnata are also notable components of the assemblage. The high relative abundance of the genus Stephanodiscus in zone 1c indicates a highly productive, nutrient-rich ecosystem. This is not uncommon for Alaskan lakes, as Gregory-Eaves et al., 1999 note that diatom floras from Alaska differ from other circumpolar regions in that meso-eutrophic to eutrophic taxa such as Stephanodiscus are present in greater abundances due to higher concentrations of total phosophorus (TP). The fourth sub-zone (zone 1d; 225–175 cm, ∼9,380 to ∼7,710 + 600/-500 cal yr BP) shows a gradual decrease in abundances of A. subarctica, a drop in S. minutulus and quasi disappearance of S. parvus, along with an increase in S. pinnata. P. brevistriata also reappears in this zone. There is a notable drop in Chrysophyte cyst abundance (not shown), which remains low for the remainder of the record. Lower abundances of Stephanodiscus taxa in zone 1d point to decreased productivity in the lake.
The second, younger, main section of the core (zone 2; 175 cm to the core top, ∼7,710 cal yr BP to present) sees a sudden drastic drop in the abundance of A. subarctica to values < 5% and an increase in diatom diversity due to the fact that no one taxa is as dominant in this section of the core. This section of the core is subdivided into two sub-zones with the Watana tephra between them, although we cannot correlate changes in the diatom assemblage with the tephra deposit, as the nearest diatom samples are ∼20 cm above and ∼10 cm below the tephra. In the first sub-zone (zone 2a; 175–100 cm, ∼7,710 to ∼3,960 + 250/-360 cal yr BP), A. subarctica is replaced by the planktonic A. formosa and D. pseudostelligera. Other notable taxa in the assemblage of this zone include small Fragilaria sensu lato, namely Pseudostaurosira pseudoconstruens, P. brevistriata and Staurosirella pinnata, and benthic (bottom-living) Achnanthes, Navicula and Nitzschia. Pseudostaurosira brevistriata and Staurosirella pinnata become the dominant species in the most recent section of the record (zone 2b; 100 cm to the core top), as Discostella pseudostelligera abundances progressively decrease and A. formosa disappears altogether. The profound change in the structure of the diatom assemblage since the mid-Holocene suggests a gradual decrease in lake depth and a significant change in trophic state. As the lake became shallower, it also became more oligotrophic, as suggested by the dominance of small Fragilaria sensu lato in the more recent past. Pseudostaurosira brevistriata and Staurosirella pinnata are tychoplanktonic taxa, meaning that they can either live on the lake floor or in the water column. They are particularly well-adapted to life in highly turbulent conditions, with short growing seasons and low to highly variable nutrient availability (Saulnier-Talbot, 2007). Their dominance in the younger diatom assemblage indicates a deterioration of the climate with, in all likelihood, drier, colder, and perhaps windier conditions.
The transfer functions developed to infer lake depth, conductivity and total phosphorous (TP) are a simple weighted-averaging model with classical deshrinking, with an r2boot = 0.52–0.53, a strength comparable to those generated from other northern calibration studies (Gregory-Eaves et al., 1999). The three diatom-inferred variables show similar trends throughout the core, with generally higher values in the older section, with the exception of zone 1b where there is a marked drop in values of the reconstructed variables, and progressive decreases from zone 1d to lower values in the more recent past. Reconstructed lake depth indicates an initially deep lake (zone 1a) with a sudden drop in lake level (zone 1b), followed by an increase back to initial values (zone 1c). Lake depth subsequently decreases (zone 1d) and stabilizes in the more recent section of the core (zones 2a and 2b). Diatom-inferred conductivity values are initially moderately high (zone 1a) and briefly dip to their lowest values (zone 1b) before progressively increasing to their highest values (zone 1c). They then decrease to moderately high levels (zone 1d) before decreasing even further (zone 2a). Conductivity values increase again slightly in the most recent past (zone 2b). Diatom-inferred TP values are highest at the base of the core (zone 1a), followed by a sharp drop to very low values (zone 1b) before returning to very high levels (zone 1c). Concentrations then decrease somewhat (zone 1d) before decreasing to low levels for the remainder of the record (zones 2a and 2b).
The results of the diatom-inferred reconstructions provide information on the magnitude of environmental change throughout the Holocene in the lake and its catchment. The inference models applied to the sedimentary diatom assemblage data were developed for a set of 51 Alaskan lakes distributed along a latitudinal gradient from the South (Gulf of Alaska) to the North (Arctic Ocean) of the state and include lakes from the region of the Alaska Range, where Clarence Lake is located (Gregory-Eaves et al., 1999). It was therefore deemed appropriate to apply the models to the data of this study. The overwhelming dominance of A. subarctica in the bottom section of the core is a concern for the fit of the model to the sedimentary data because it is only found at a maximum relative abundance of 43% in the model lake set, whereas it is present in abundances > 40% in all (except one) samples of zones 1a, 1c, and 1d of the Clarence Lake core. Therefore, the inferred values for the older section of the core (i.e., below 170 cm) should be considered with caution, especially for lake depth since they appear greatly overestimated for this variable, at least. The lake levels inferred for this section of the record are in fact much higher than the deepest lakes included in the inference model (33 m), which make them suspect. However, the results for lake depth in the upper section of the core appear to be more reliable and the top-most value for lake depth corresponds exactly to current measured values (11 m), which lends more credibility to the diatom-inferred values in the upper section of the core. While the accuracy of the inferred values appears to be statistically questionable, especially for the lower section of the core, the inferred trends provide a reliable scenario for the magnitude and trajectory of environmental change which occurred over the past ∼ 11,000 years in and around Clarence Lake.
Pollen
The Clarence Lake pollen record (Figure 9) is divided into three zones, CL-1, CL-2, and CL-3. CL-1 spans from 355 cm (the base of the pollen record) to 270 cm, (>∼11,400 to ∼10,650 + 230/-340 cal yr BP) and is dominated by birch (Betula) pollen with willow (Salix) and sedges (Cyperaceae) as secondary components. At the bottom of the core, birch pollen percentages and influx [grains(cm-2)(yr-1)] increase, this probably marks the expansion of birch in the region. Pollen concentration (grains(cm-3) [not shown]) and influx is relatively high throughout the zone, suggesting a productive landscape. However, a brief period of reduced birch pollen as well as total influx at 340–320 cm (∼11,870 + 440/-280 to ∼11,450 + 280/-110 cal yr BP) suggests a less productive landscape which generally coincides with marked shifts in diatom assemblages. The vegetation in this zone was a birch-dominated shrub tundra, but willows were also a significant component. Sedge, grass, and Artemisia dominate the herbs, with monolete spores (mainly ferns) becoming more prominent in the latter half of the zone.
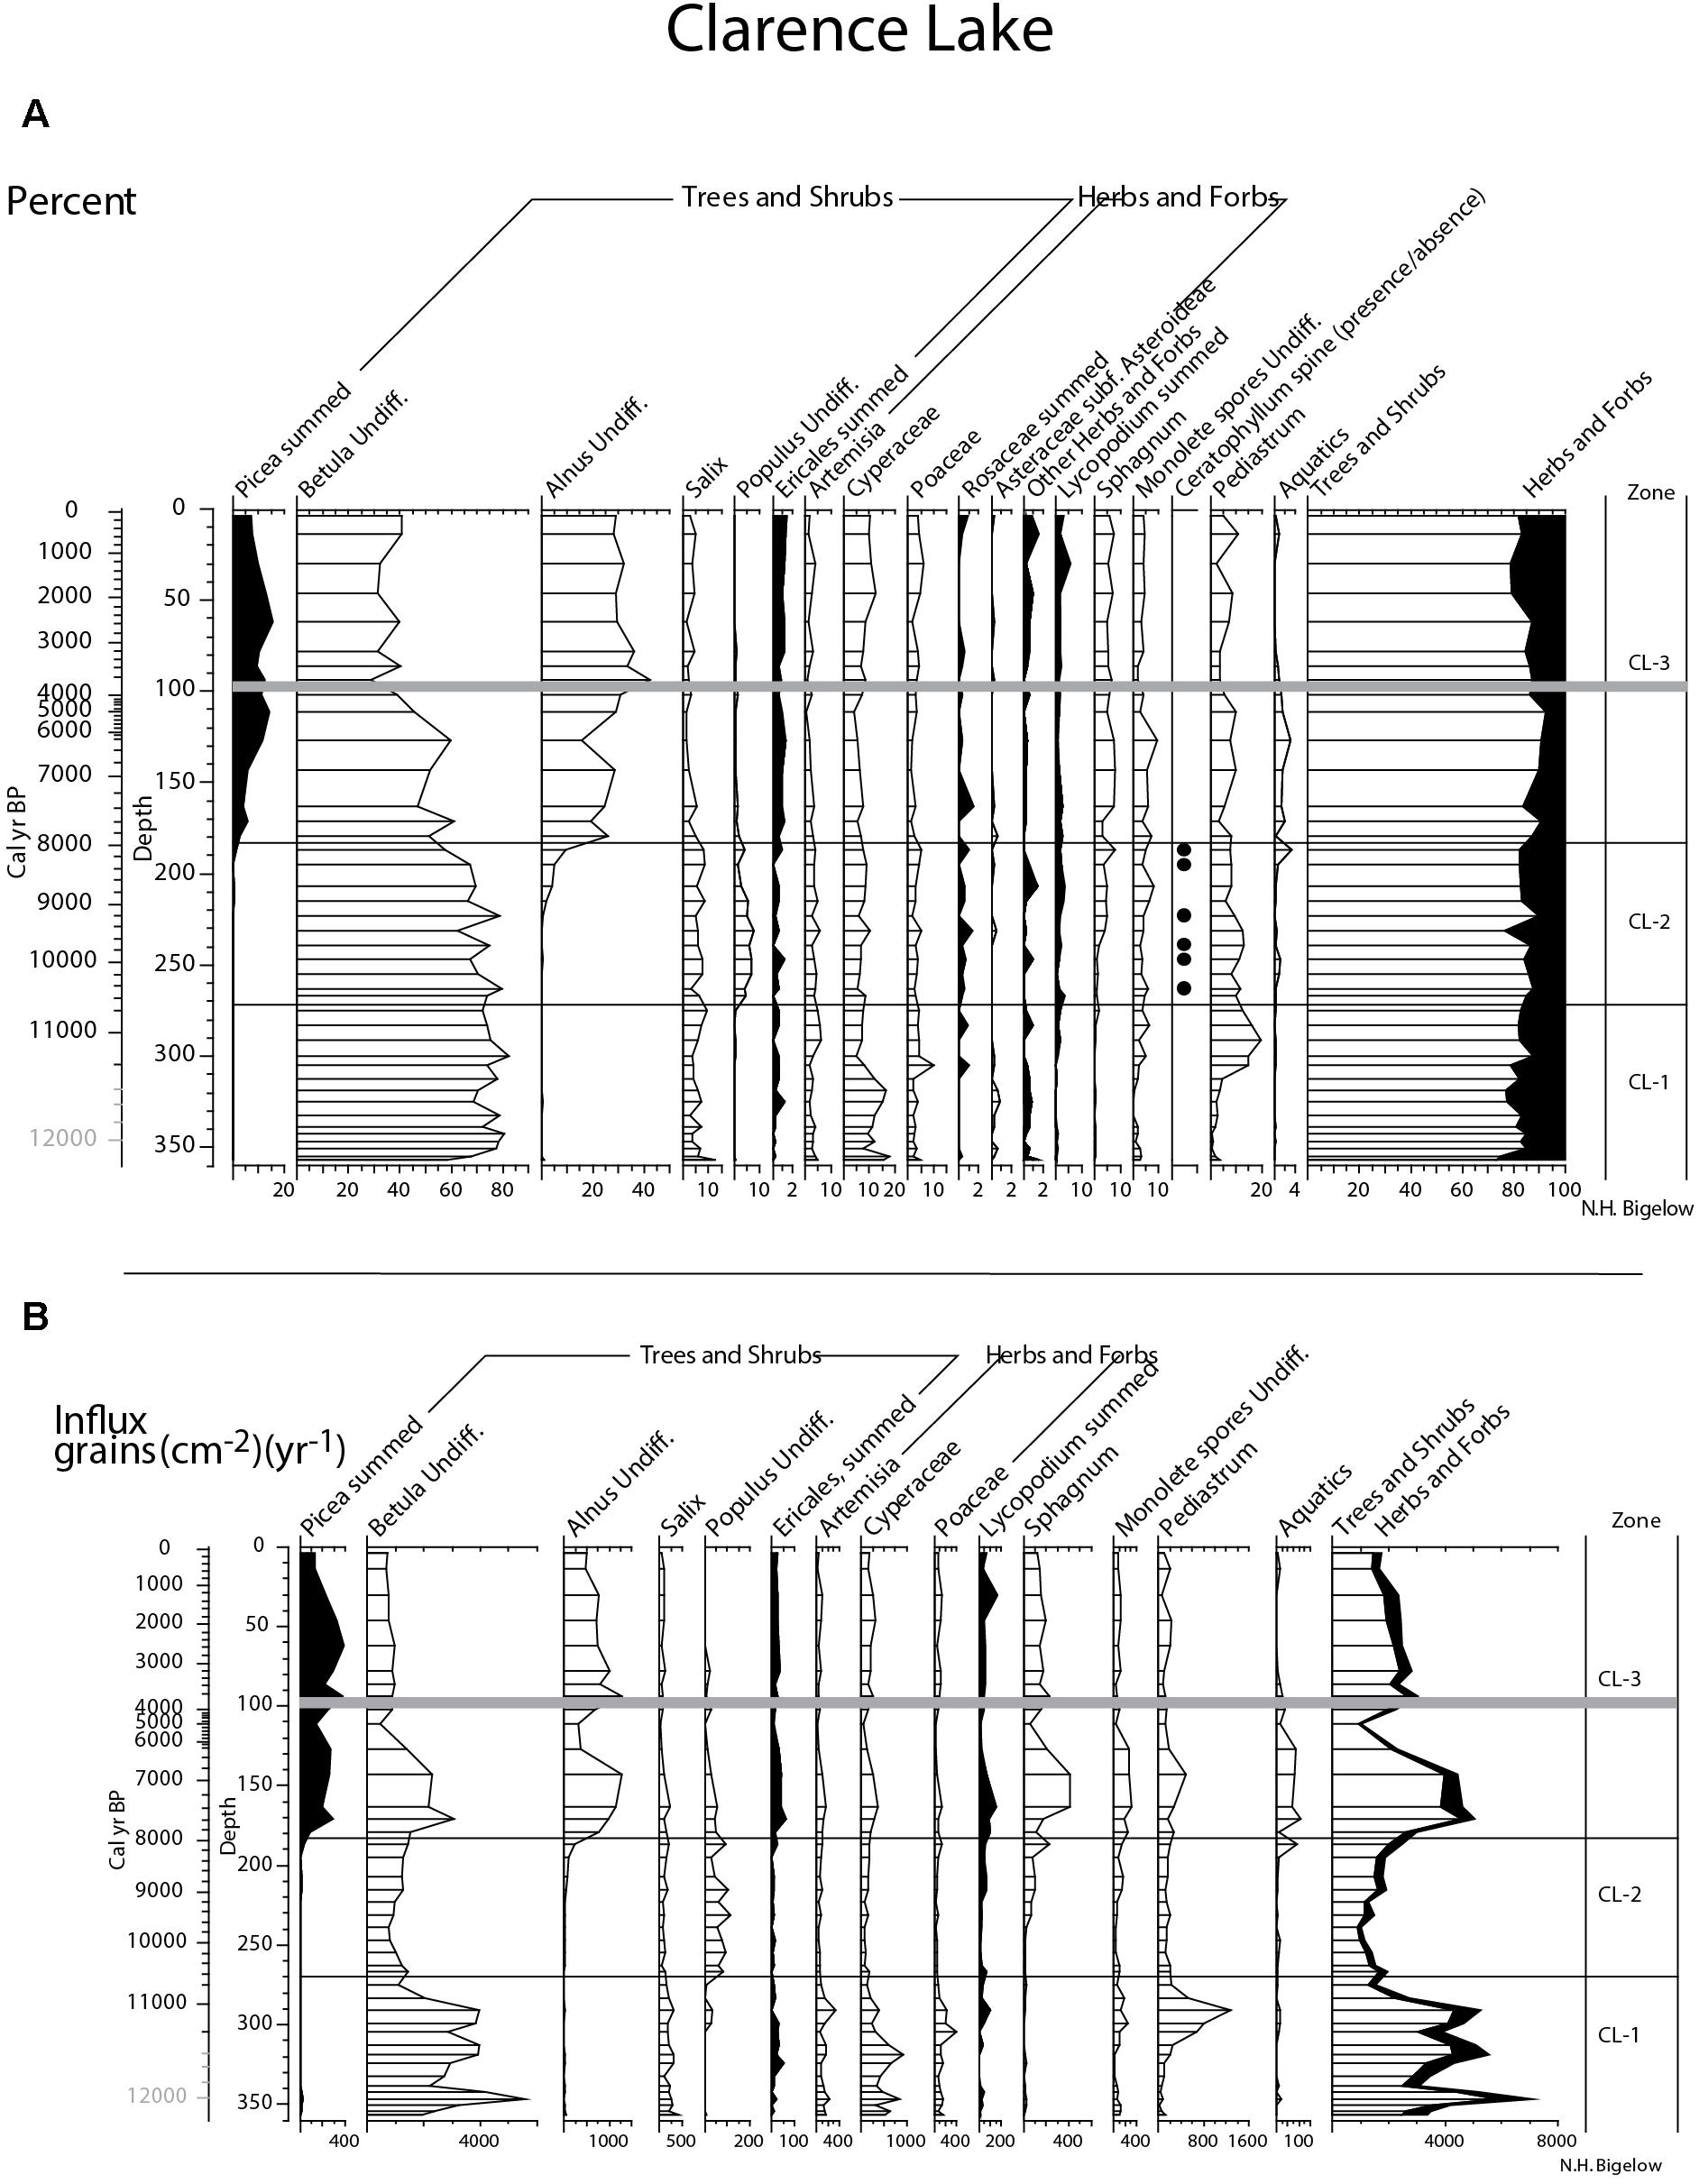
Figure 9. Clarence Lake summary pollen; (A) percent and (B) influx. To emphasize rare taxa in both plots, some x-axes have been enlarged. Gray bar in both plots marks the Watana tephra and ages in gray are extrapolations.
Zone CL-2 spans from ca. 270–180 cm and dates between 10,650 + 230/-340 and 7,860 + 620/-530 cal yr BP. Birch pollen continues to dominate, followed by willow and sedge pollen, and then by Artemisia and grass pollen. The key feature of this zone is the presence of Populus (cottonwood/aspen) pollen and Ceratophyllum spines. Both taxa suggest warm summer temperatures. The vegetation was a birch and willow shrub tundra with scattered cottonwood/aspen stands, possibly around the lake or at its outlet. Pollen influx is low throughout the zone.
Zone CL-3 spans from 180 cm to the core top and dates between 7,860 + 620/-530 cal yr BP and the present. Birch percentages decline in this zone (but influx remains stable, indicating continued importance), while alder (Alnus), and then spruce (Picea) percentages increase. Populus and Salix pollen also decline. Artemisia, grass, and sedge pollen continue as before. Pollen influx is higher here, due to the addition of alder and spruce pollen. Using the 5% threshold for spruce (Hu et al., 1993) and 20% threshold for alder (Anderson and Brubaker, 1986), spruce was probably locally present at ∼170 cm (∼7,560 + 600/-460 cal yr BP), slightly after alder, the pollen of which crosses the 20% threshold at 180 cm (∼7,860 cal yr BP). The vegetation was a birch and alder shrub tundra with widely scattered spruce and possibly birch trees at least in the middle of the zone when spruce pollen is most abundant.
At Deadman Lake, the pollen record is divided into two zones (DL-1 and DL-2) (Figure 10). Zone DL-1 spans from the record base (238 cm) to ∼205 cm; >10,400 to ∼9,260 + 880/-1040 cal yr BP. Birch pollen increases from 20 to 80% and then decreases to about 50% at the top of the zone. At the base of the zone, when birch pollen has the lowest frequencies, willow, Artemisia, sedge, and grass pollen are at their highest frequencies which then decrease as birch increases. However, influx measurements (Figure 10) indicate that all taxa increase in this zone, suggesting greater plant abundance, probably in areas that were unvegetated earlier. The vegetation was a sparse shrub tundra, initially dominated by willow, but later with increasing birch. Understory taxa include very sparse sedge, Artemisia, and grass, along with a few mesic taxa such as ferns (monolete spores).
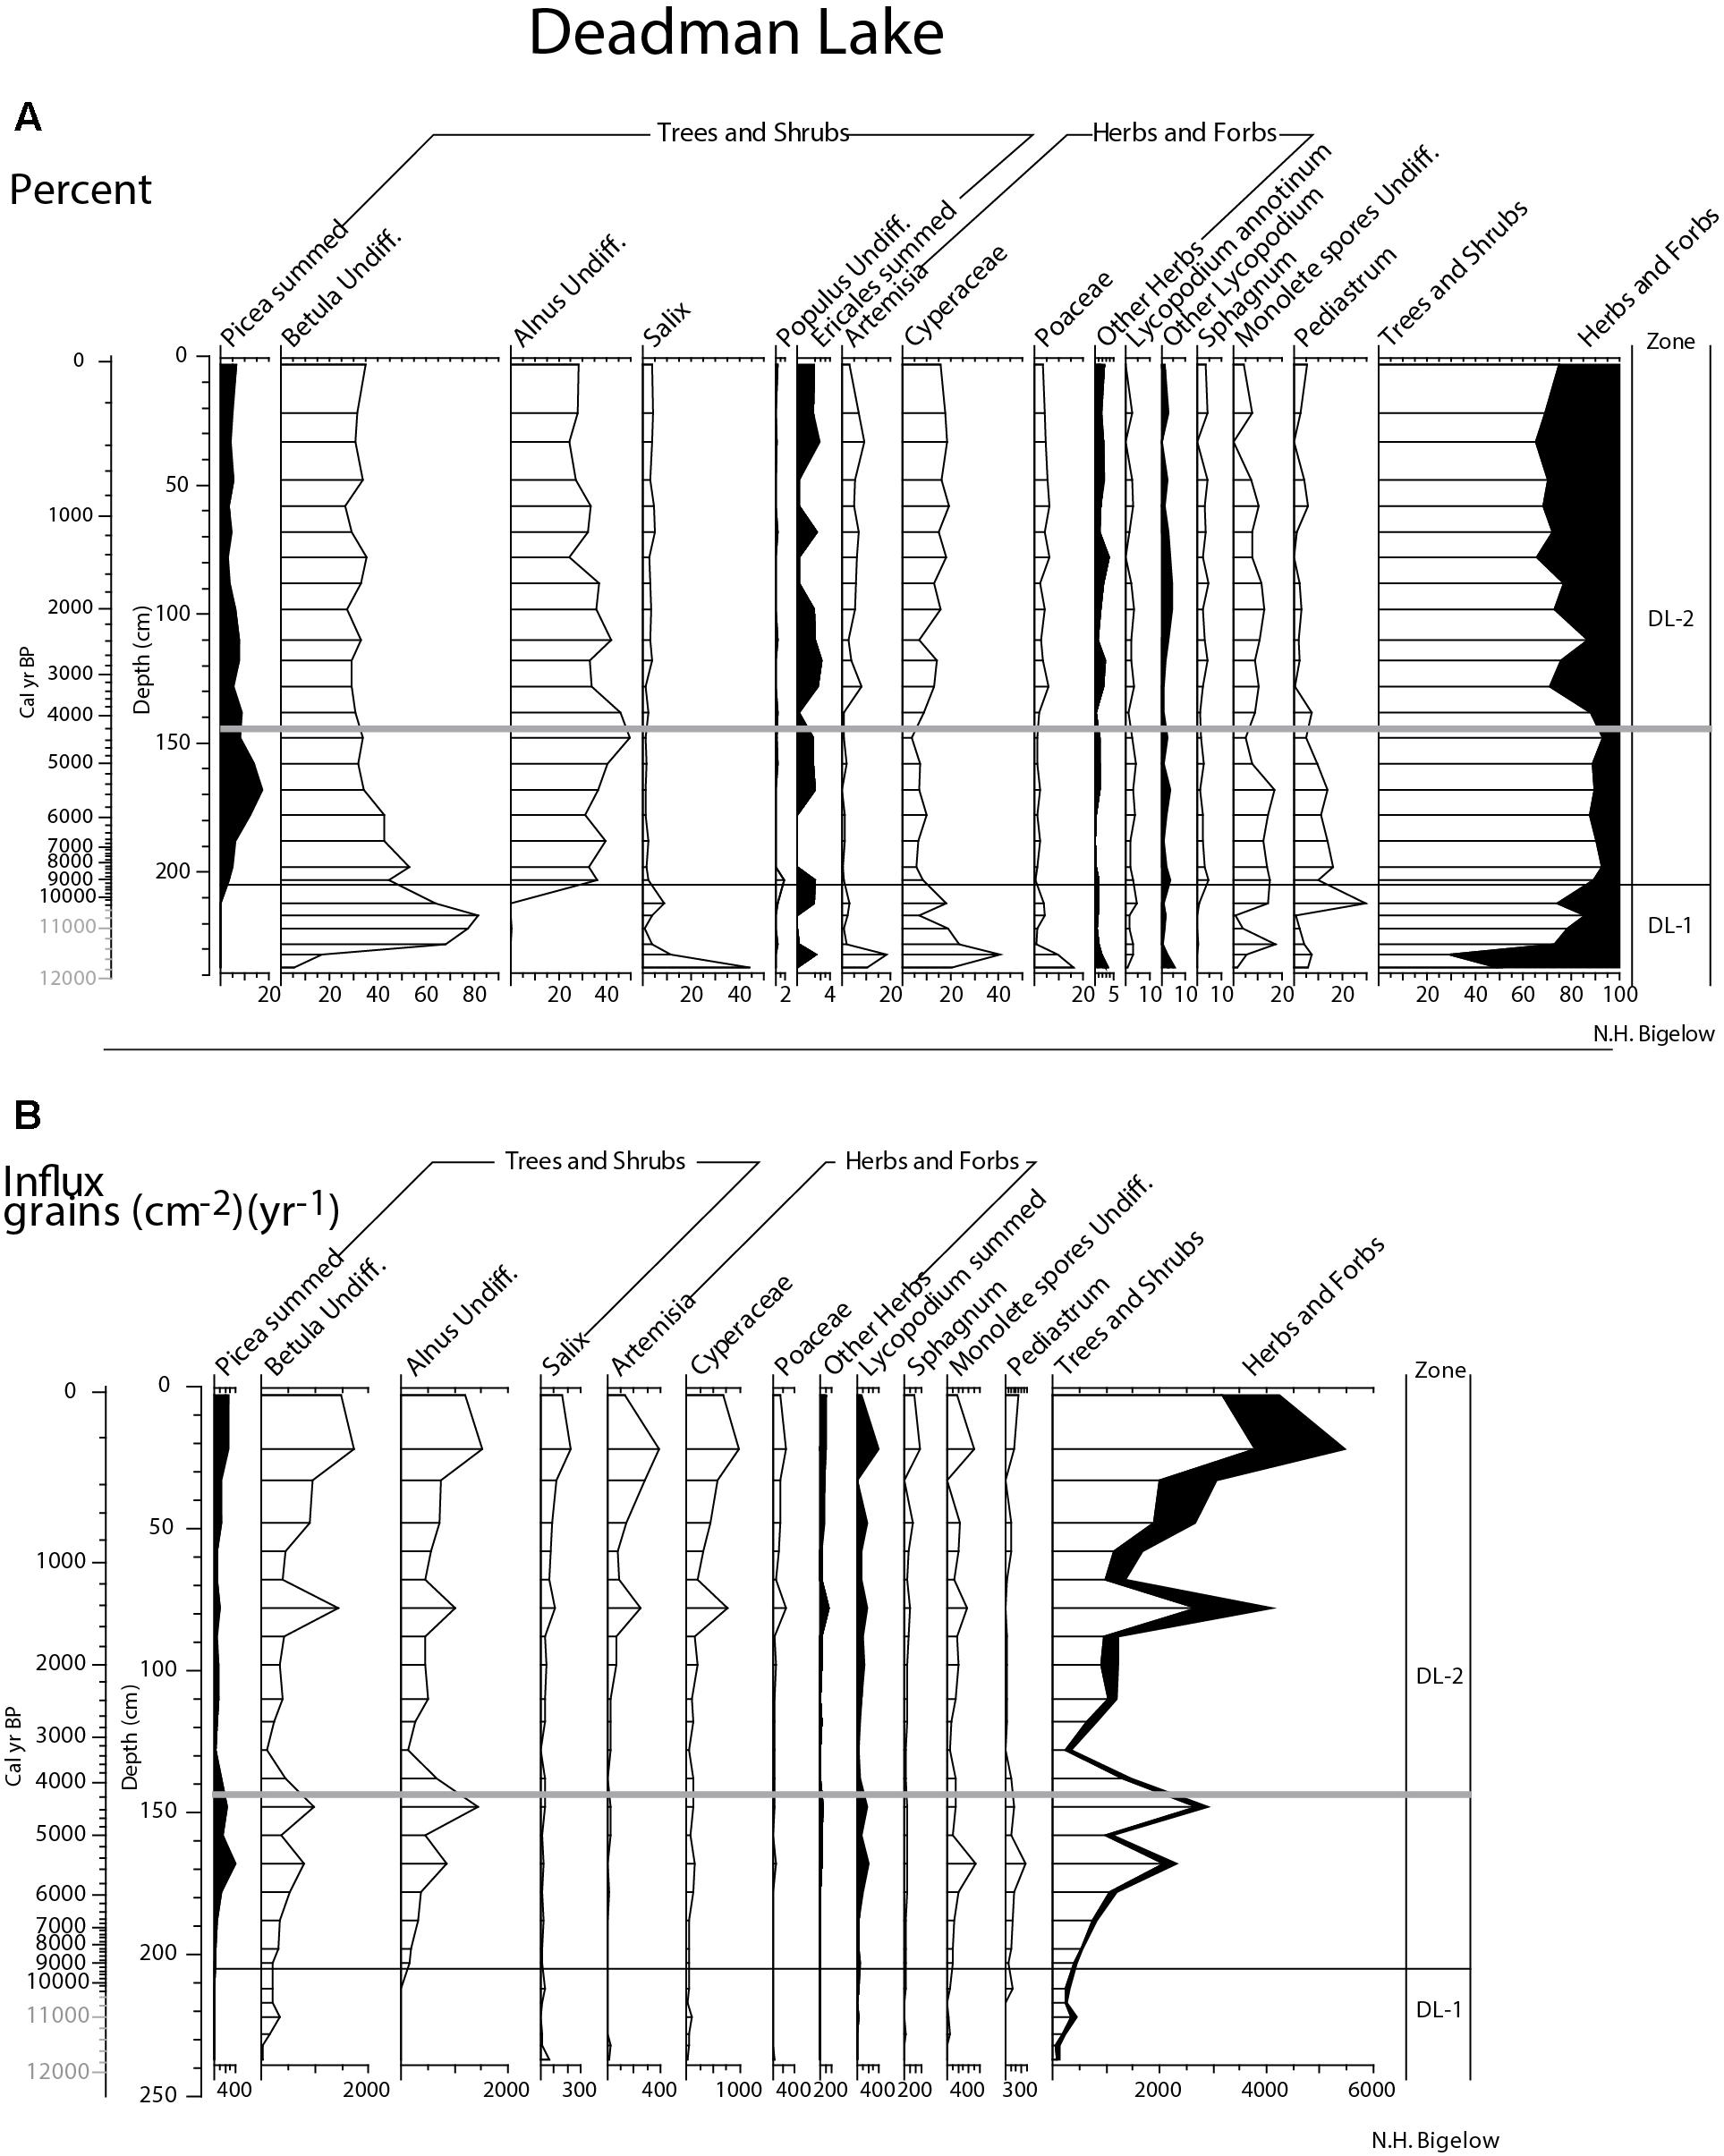
Figure 10. Deadman Lake summary pollen; (A) percent and (B) influx. To emphasize rare taxa in both plots, some x-axes have been enlarged. Gray bar in both plots marks the Watana tephra and ages in gray are extrapolations.
Pollen zone DL-2 (205-0 cm; ∼9,260 + 880/-1040 cal yr BP to the present) is marked by increased spruce and alder frequencies. Birch pollen frequencies decrease, but increase in the influx data, suggesting it continued to be an important feature of the vegetation. Spruce pollen crosses the 5% threshold at 198 cm (∼8,200 + 1160/-1170 cal yr BP) and reaches its maximum frequency of nearly 20% at 168 cm (∼5,510 + 360/-340 cal yr BP), after which it decreases to ∼5%. Alder pollen crosses the 20% threshold at the beginning of the zone and remains at this level throughout the remainder of the core. Willow, Artemisia, and grass pollen are present in low frequencies in the first half of the zone, but increase slightly above 140 cm (∼4,060 + 650/-700 cal yr BP). Ferns and Sphagnum are present in moderate frequencies throughout the zone. The vegetation during this zone was a birch, alder, and willow shrub tundra with varying amounts of spruce and possibly a few birch trees. Spruce was probably present (if very rare [as it is today]) by ∼8,200 cal yr BP, but was more common than today ∼6,000 to 5,000 cal yrs BP, after which it decreased, so that by today, only a very few trees are present in the watershed (when spruce pollen frequencies are about 5%). Pollen influx suggests herbaceous taxa become more abundant in the upper half of the zone, possibly expanding into previously unvegetated areas as the shrub influx also increases.
In Sally Lake, pollen zone SL-1, the basal 55 cm of the record (165–110 cm; ∼12,270 + 410/-440 to ∼6,180+1,570/-1180 cal yr BP), is dominated by birch pollen (80%), with minor amounts of sedge (Cyperaceae), willow, and Artemisia (Figure 11). Populus pollen frequencies peak to 10% in a single sample at 124 cm, ∼7,780 + 1,620/-1,550 cal yr BP, subsequently falling to near zero. Fern spores (monolete spores) increase at 138 cm (∼9,390 + 1,410/-1,630 cal yr BP) while Sphagnum spores increase afterward at 124 cm (∼7,780 + 1,620/-1,550 cal yr BP). The vegetation was initially a birch and willow shrub tundra with grass, sedge, and Artemisia. Populus trees (cottonwood or aspen) were probably briefly present about 7900 cal yr BP, but were subsequently much reduced in the watershed. Increases in the spores (ferns and Sphagnum) indicate increasing moisture toward the latter half of the zone.
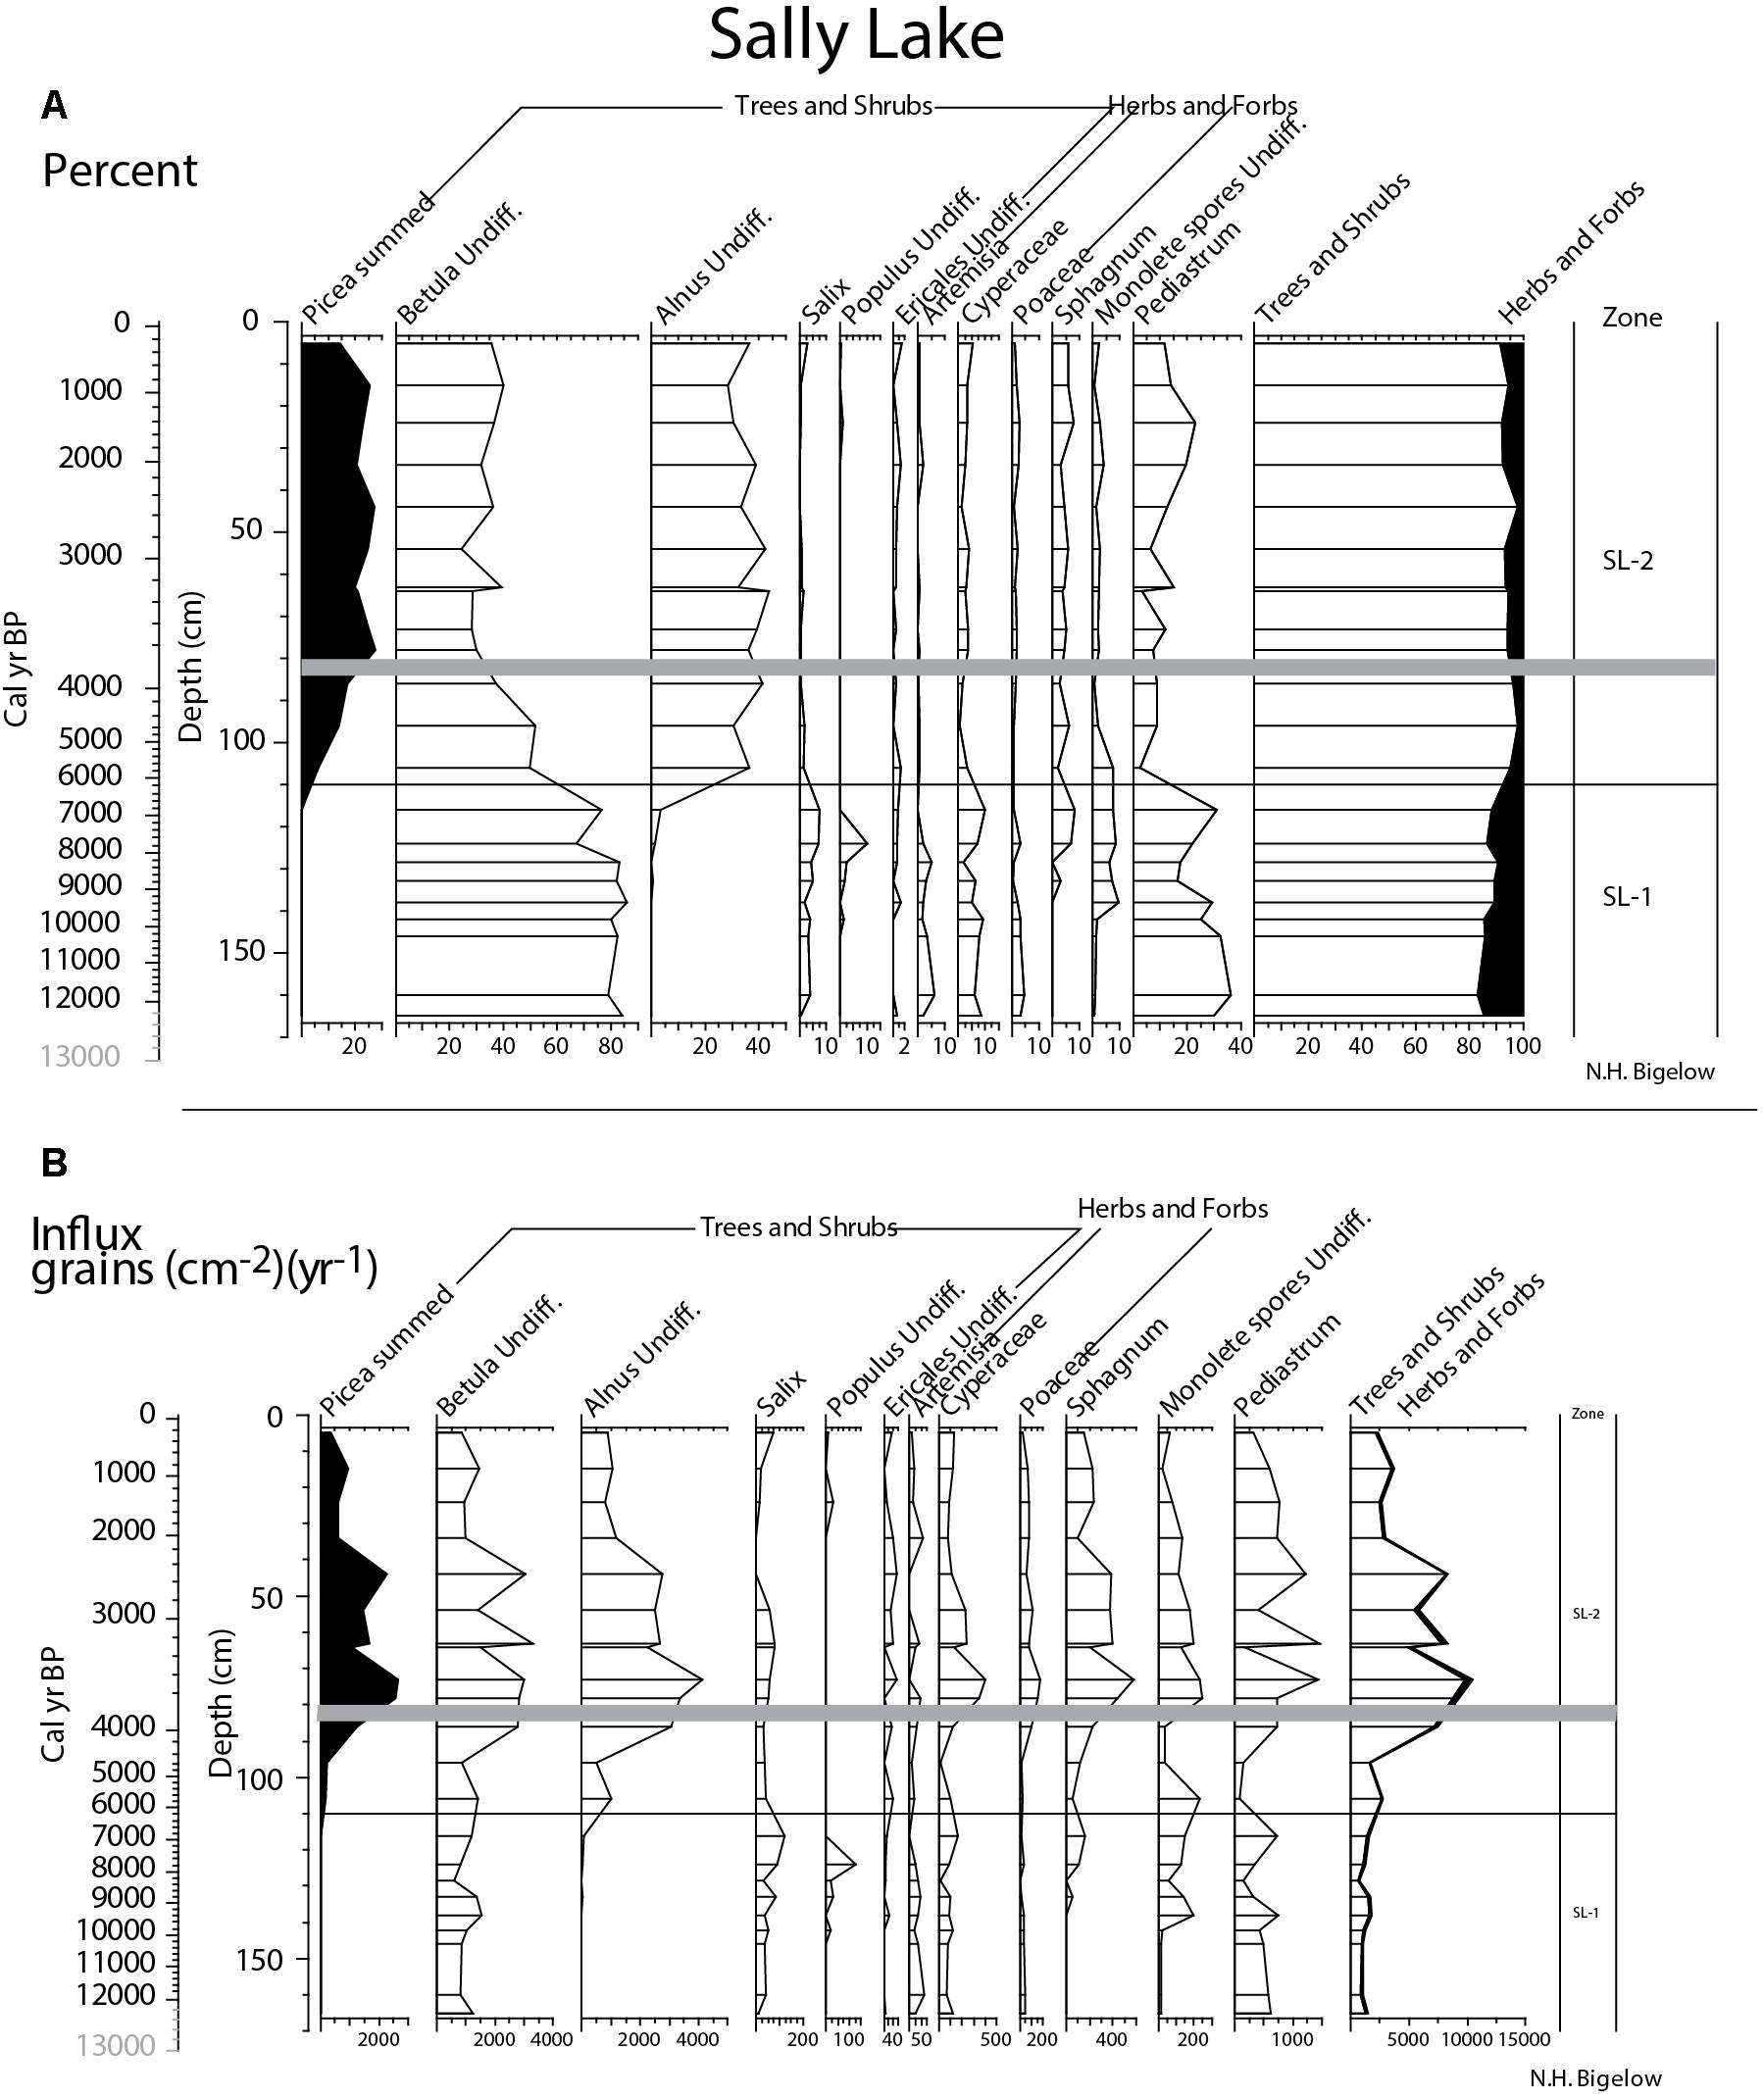
Figure 11. Sally Lake summary pollen; (A) percent and (B) influx. To emphasize rare taxa in both plots, some x-axes have been enlarged. Gray bar in both plots marks the Watana tephra and ages in gray are extrapolations.
Zone SL-2 (110–0 cm; ∼6,180 + 1,570/-1,180 cal yr BP-present) is dominated by birch, alder, and spruce pollen. The decrease in Betula pollen frequencies in this zone is an artifact of the percent calculation; influx data indicates it remained an important component of the pollen assemblage (Figure 11). Spruce pollen crosses the 5% threshold indicating local presence at about 5,900 cal yr BP. The vegetation throughout this zone was spruce-birch-alder boreal forest. Pollen influx decreases from ∼40 cm (∼2400 + 250/-180 cal yr BP) to the core top suggesting reduced pollen production and lowered landscape productivity.
Discussion
Our study sheds light on Late-Glacial and Holocene paleoecology and landscape change in the middle Susitna Valley. Below, we discuss our results within a chronological framework, especially in the context of what we know from adjacent regions. In addition, we present our current understanding of the human prehistory of the Susitna Valley uplands and discuss how these landscape changes could have affected people living in the region at various times.
De-glaciation and Late-Glacial (∼12,000–11,700 cal yr BP)
Chronologies from Deadman, Big, and Sally lakes indicate deglaciation had occurred by about 12,000 cal yr BP, if one accepts the extrapolated ages at the core bases. The apparent absence of Late Wisconsinan ice around Clarence Lake is intriguing. If this is correct, then the formation of Clarence Lake was not directly related to ice recession and aridity may have limited lake formation. This would be consistent with ice-free areas of interior Alaska to the north, where extensive dunes and loess formation (Hopkins, 1982; Muhs et al., 2003) as well as the general absence of lakes prior to ∼14,000 cal yr BP suggest extreme aridity.
Immediately after deglaciation, all lakes were relatively deep and productive. Diatom-inferred variables at Clarence Lake indicate high lake levels, increased conductivity (an indicator for bedrock weathering), and high total phosphorous (a proxy for lake productivity) (Figure 8). This is consistent with the isotope results from Clarence, Deadman and Big lakes, where δ13C and %C values are relatively low (Figure 7). At the same time, a birch or willow shrub tundra covered the landscape from low-elevation Sally Lake to the high-elevation Deadman Lake. However, pollen influx varied among the lakes, so that Clarence Lake had relatively high influx at this time, while at Deadman and Sally lakes, the influx was lower (Figures 9–11), suggesting that plant productivity may have varied across the region.
In terms of archeology, people ranged into higher elevations (>600 MASL) to the north (Teklanika, Nenana, and Bull river valleys) by ∼12,800–12,290 cal yr BP and into the Tangle Lakes region by 11,940 cal yr BP (summarized in Blong, 2018). There is currently no evidence that people occupied the middle and upper reaches of the Susitna River Valley before ∼11,140 cal yr BP, over 1,000 years after people began occupying similar elevations in interior Alaska. This suggests that the relatively high productivity around Clarence Lake did not translate into abundant game resources upon which people depended. If the density of herd animals was less than the lowlands and the Tanana Valley upland margins (Yesner, 2007), then hunting forays or explorations into the Susitna uplands before 11,140 cal yr BP would have been very limited, and would account for the very low archeological visibility during this period in the region (Blong, 2018).
A Brief Environmental Excursion at Clarence Lake (∼11,800–11,200 cal yr BP)
High-resolution sampling at Clarence Lake revealed a marked shift in climate and environment during ∼11,800–11,200 cal yr BP (Figure 12). Diatom-inferred lake levels decreased markedly, as did diatom-inferred conductivity. Diatom diversity was also very high, suggesting a greater diversity of habitats, which is consistent with lowered lake levels. The δ13C values increased during this period, which seems consistent with the decreased lake levels and a possible decrease in the available DIC pool for autochthonous primary production, which is consistent with slightly higher %C toward the end of the excursion. C/N ratios increase slightly, indicating greater allochthonous input into the lake, also consistent with lower water level. Shrub abundance decreased while herbs (especially sedge) increased, and overall pollen production was reduced, suggesting a less productive landscape, at least at the onset.
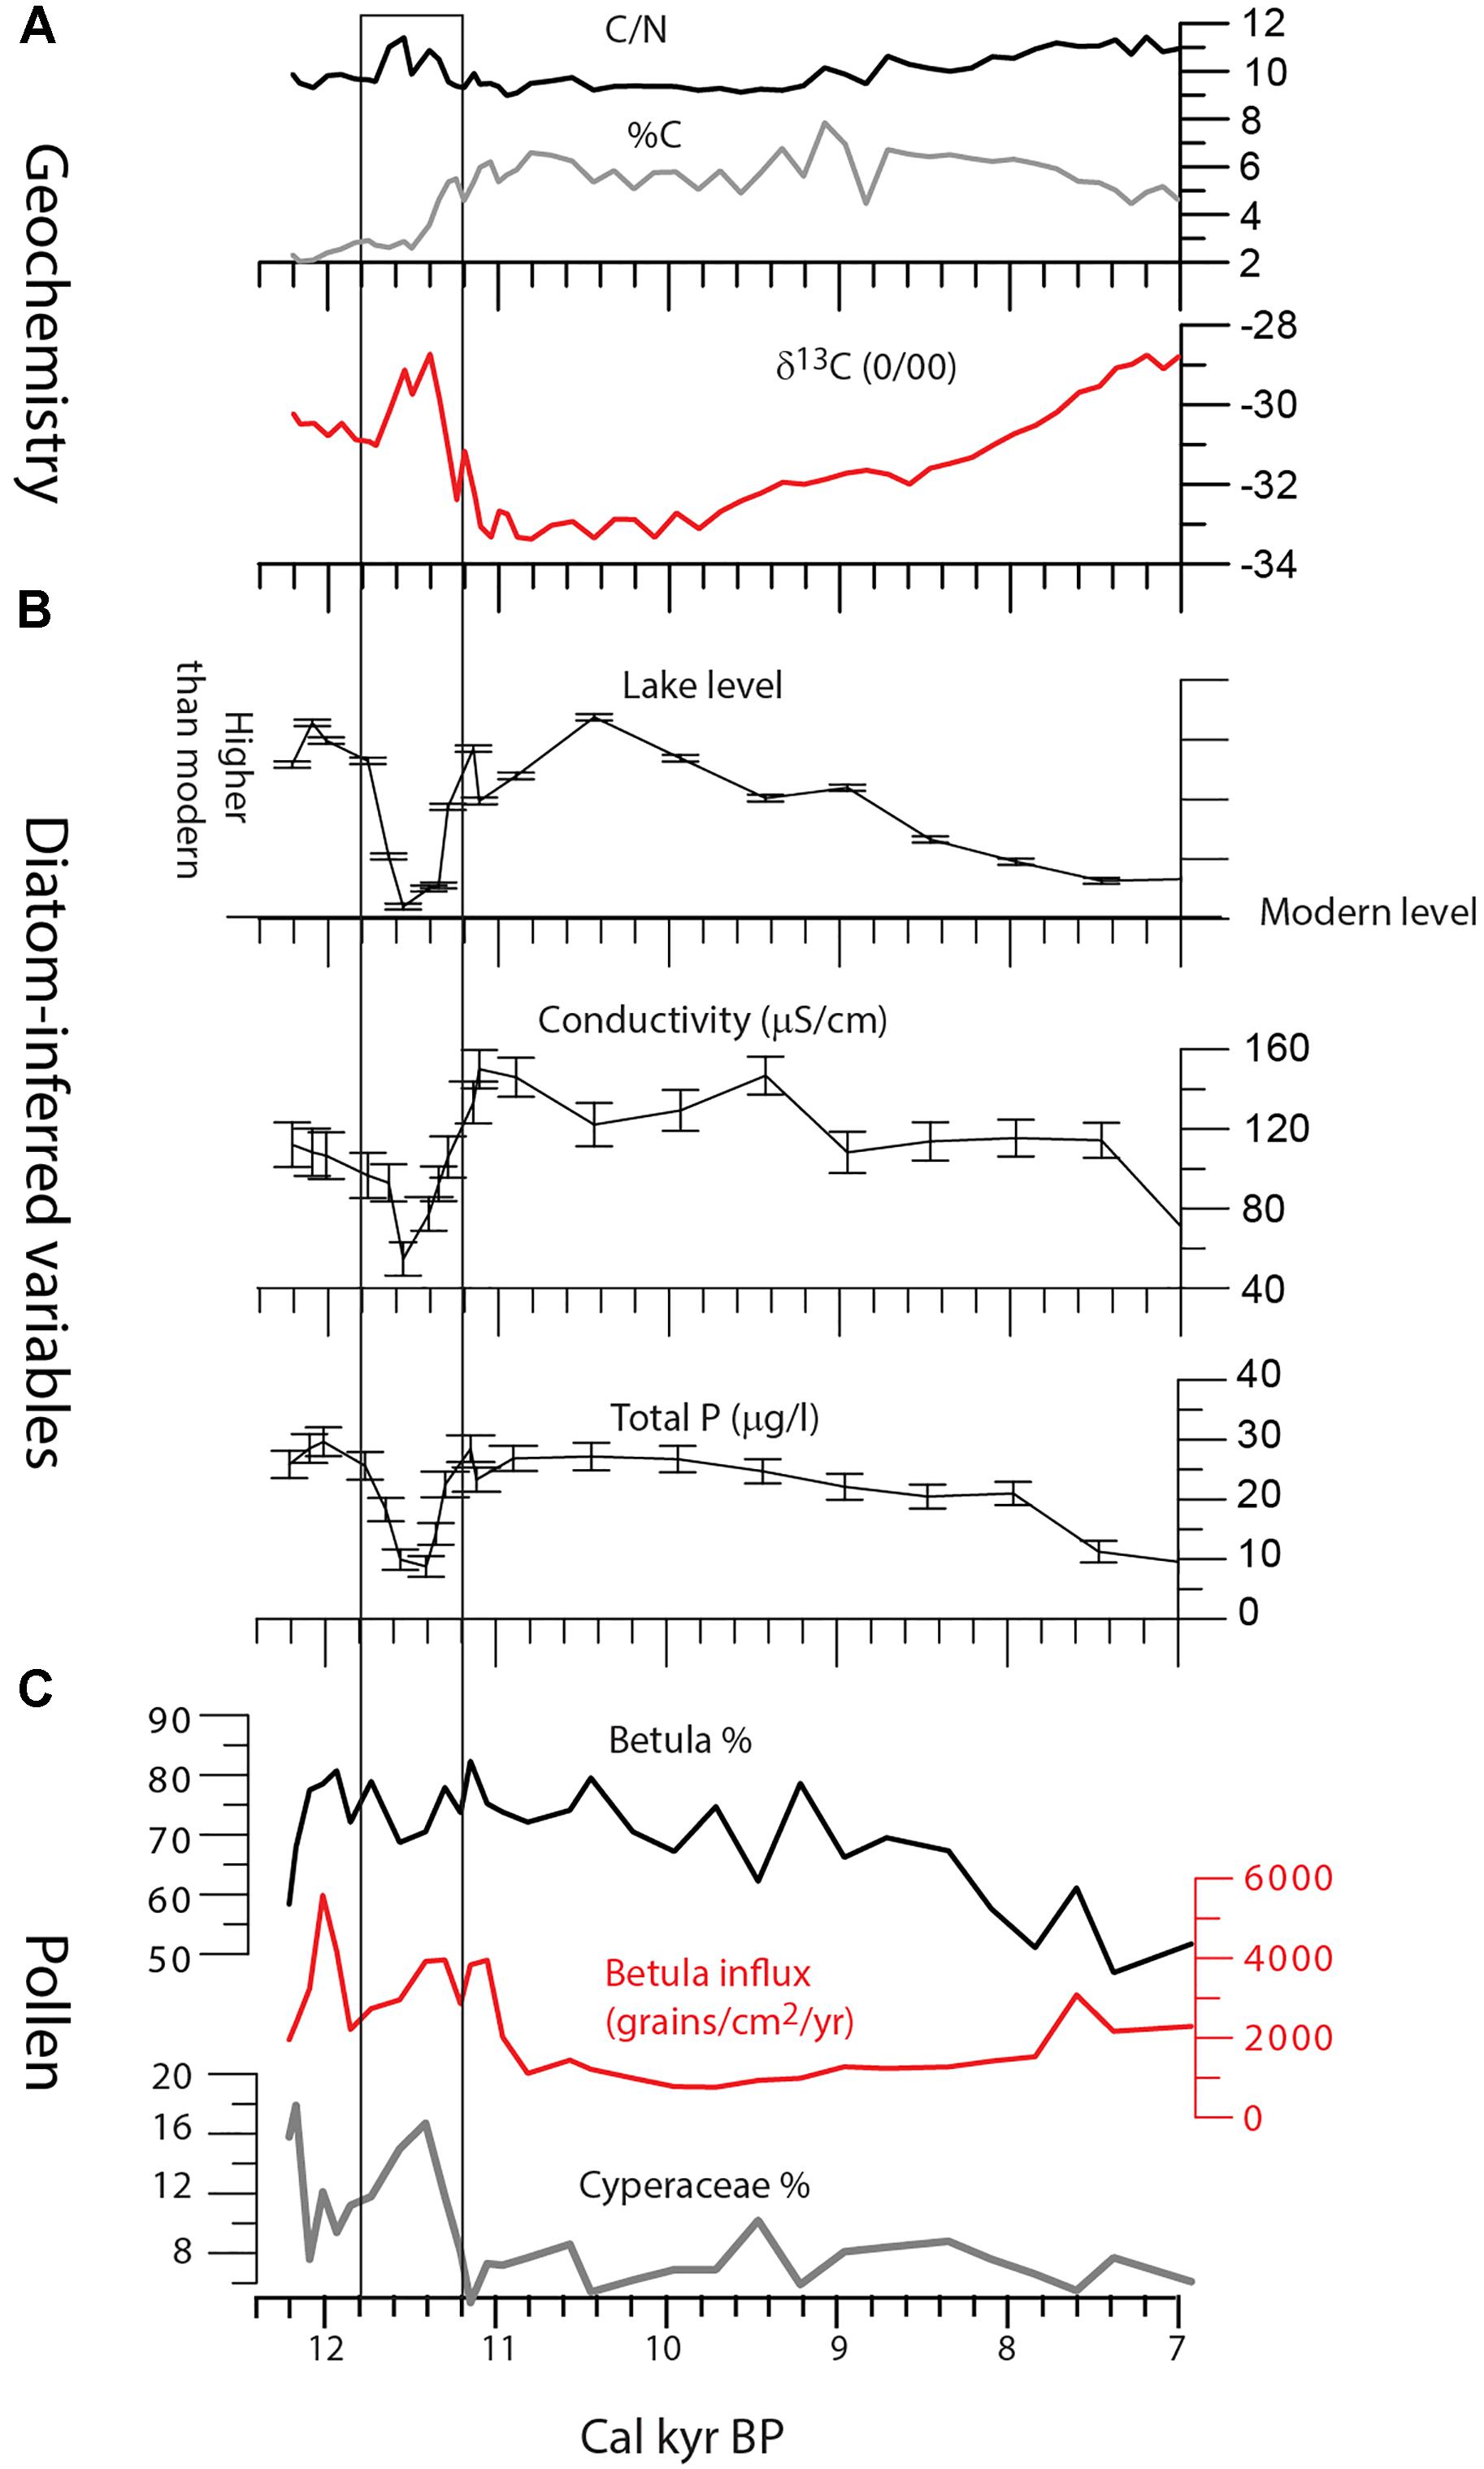
Figure 12. Key variables at Clarence Lake between 12,000 and 7,000 cal yr BP (cal kyr BP). (A) δ13C, C/N, and %C. (B) Diatom-inferred variables. (C) Betula (birch) pollen percent and influx and Cyperaceae (mainly sedge) pollen percent. Box marks the zone with significant shifts of diatom-inferred variables at ∼11,800–11,200 cal yr BP.
The timing of this event (∼11,800–11,200 cal yr BP) suggests it may be related to the Younger Dryas (YD) climate event. While the age is young for the YD chronozone (which is dated ∼ 12,900 to 11,700 cal yr BP [Rasmussen et al., 2014]), proxy responses at Clarence Lake may be lagged, as has been shown elsewhere (Muschitiello and Wohlfarth, 2015). In addition, the proxies suggest a shift to cooler and/or drier environments, which is consistent with a YD oscillation. This excursion was recognized only at Clarence lake because of the diatom analysis and high-resolution sampling there.
If the Clarence Lake excursion corresponds to the YD, this would be consistent with much of what is already known about the YD in Alaska. The YD has been recognized in numerous sites from southern and southeast Alaska (Kokorowski et al., 2008 and references therein, plus Briner et al., 2002; Jones et al., 2009; Kaufman et al., 2010), the Bering Sea (Wooller et al., 2018), the Alaska Range (Kokorowski et al., 2008 and references therein), on the north slope of the Brooks Range (Gaglioti et al., 2017) and the Arctic Coastal Plain (Meyer et al., 2010). In general, various proxies indicate cooling and/or drying during this interval, except in southwest Alaska and the Kenai Peninsula, where increased moisture is indicated (Jones et al., 2009; Jones and Yu, 2010; Kaufman et al., 2010). Interestingly, peatland initiation frequencies did not decrease during the YD (Figure 13), although on the Kenai Peninsula, carbon accumulation rates were low (Jones and Yu, 2010). North Pacific sea surface temperatures decreased (Kallel et al., 1988; Max et al., 2012; Praetorius and Mix, 2014) and winter precipitation in southern Alaska may have been higher, as indicated by various climate models (Mikolajewicj et al., 1997; Peteet et al., 1997) On the North Slope, proxies suggest increased stream incision, eolian deposition, and reduced pollen from woody taxa (Mann et al., 2002), and probably increased summer sea ice (Gaglioti et al., 2017). In Utqiagvik (formerly Barrow), an oxygen and deuterium isotope record from wedge ice also suggests much colder winter temperatures during the YD (Meyer et al., 2010).
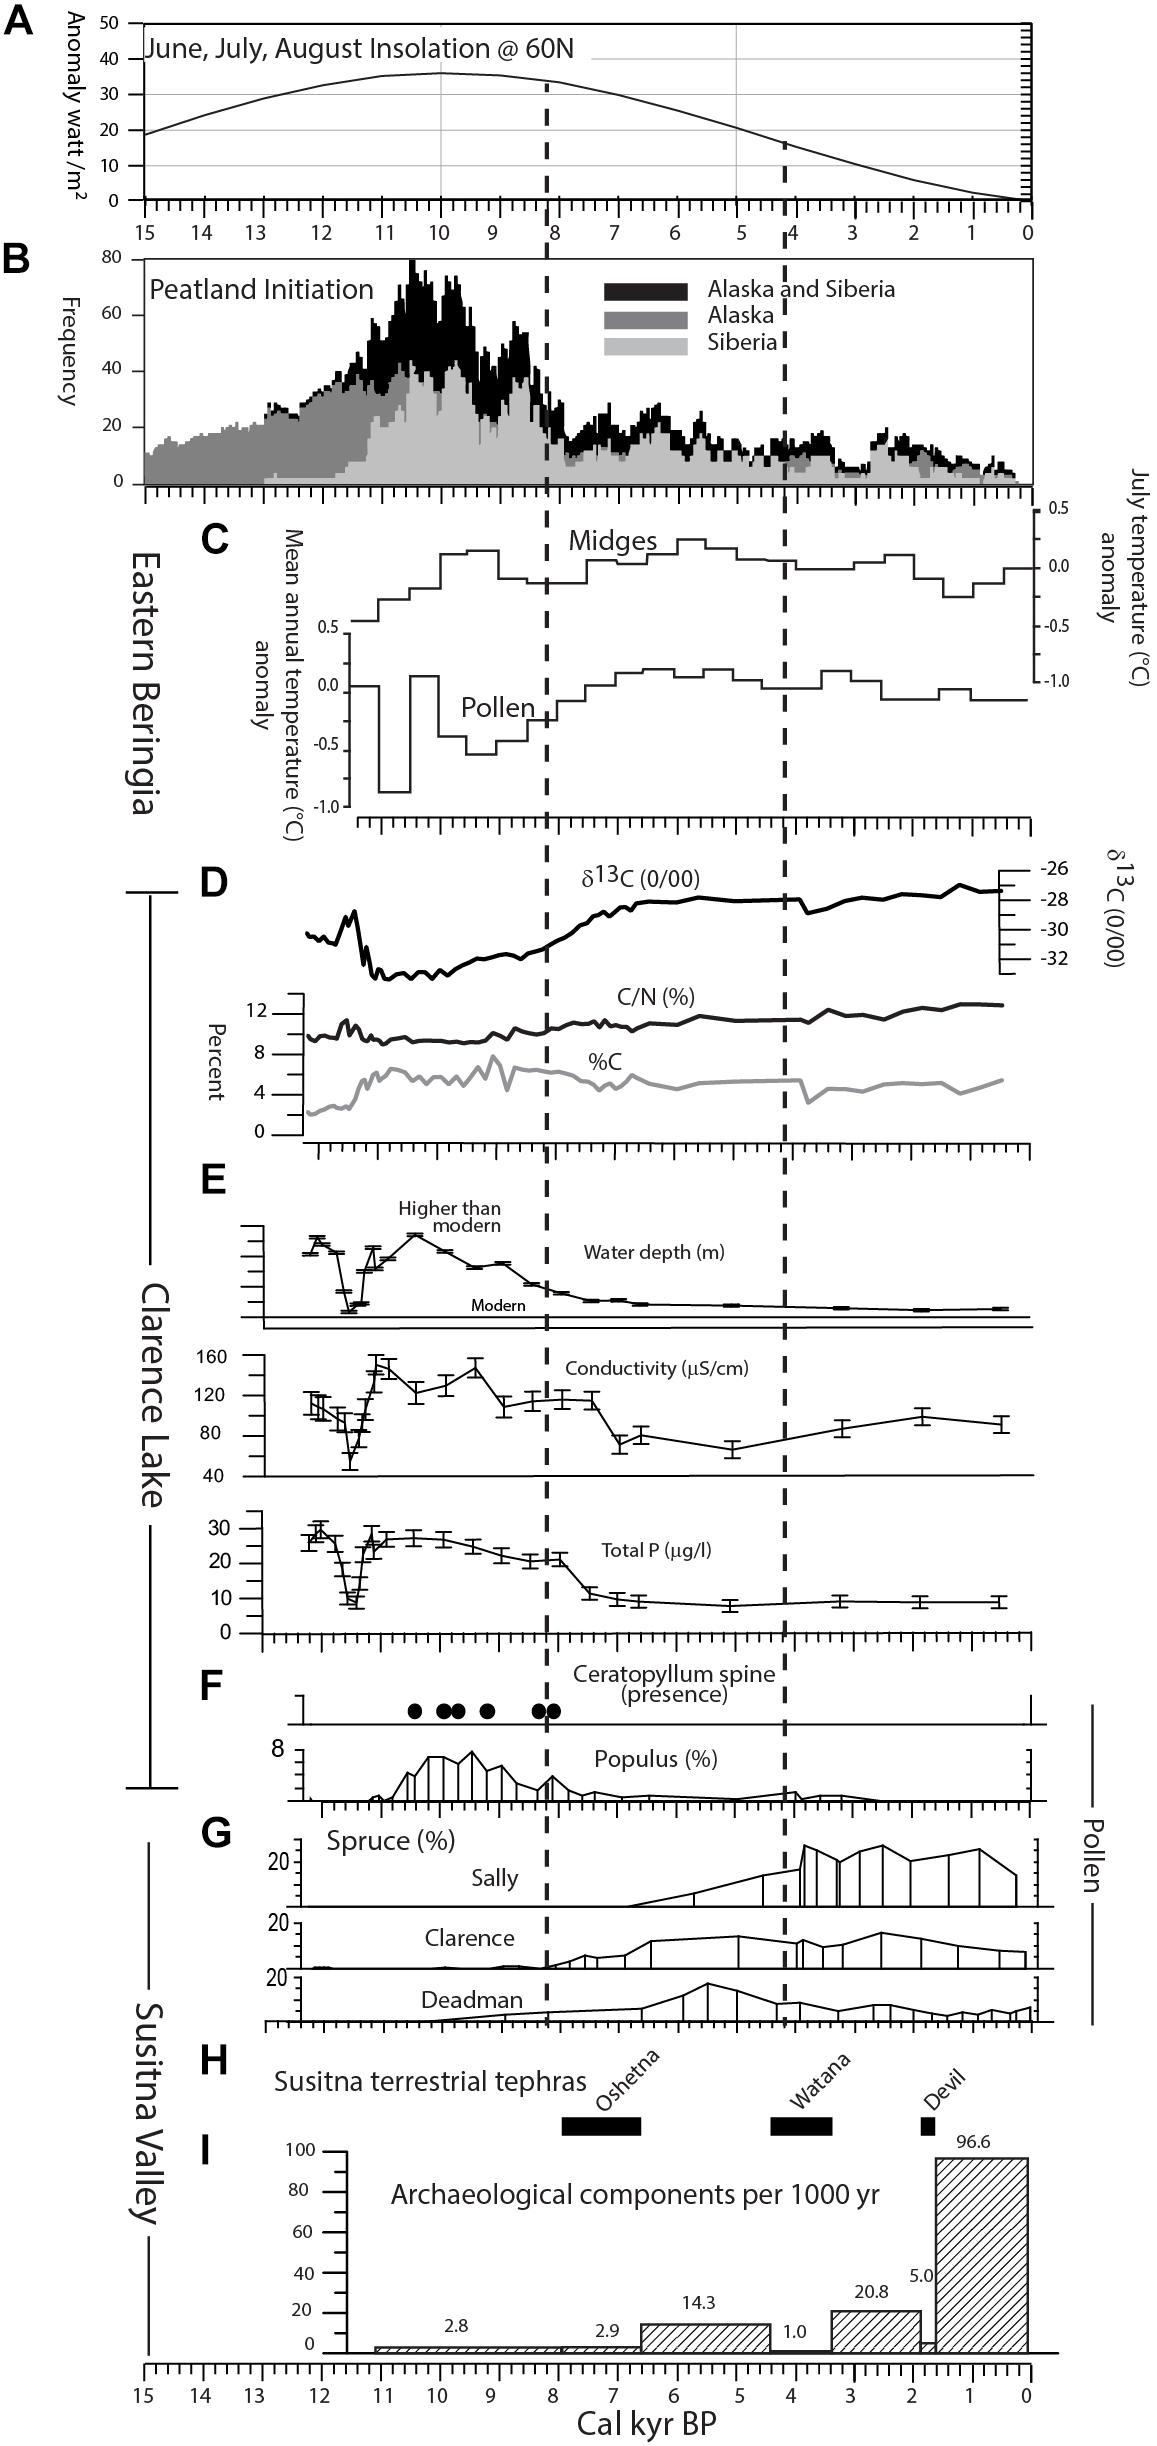
Figure 13. Summary figure of regional studies and key results from this study plotted against age (cal kyr BP). (A) June, July, August insolation at 60° N from 15,000 cal yr BP to the present (Berger, 1978). (B) Peatland initiation frequency (redrawn from Jones and Yu, 2010). (C) Eastern Beringia midge- and pollen-inferred temperatures (redrawn from Kaufman et al., 2016). (D–F) Clarence Lake geochemistry, diatom-inferred variables, and pollen/ macrofossils, respectively. (G) Spruce pollen (%) in the study lakes. (H) Terrestrial tephras in the Susitna Valley. (I) Archeological components per 1000 year in stratigraphic bins relative to the tephra deposits (see text). Dashed vertical lines mark middle and late Holocene boundaries at 8,200 and 4,200 cal yr BP, from Kaufman et al. (2016).
Compared to YD records from around the North Atlantic region (Björck, 2007 and references therein), the Clarence Lake excursion was short-lived and relatively subtle. In scale and duration, it is similar to most Alaskan records, consistent with the idea that the YD in Alaska was the result of teleconnections from the North Atlantic region. Reduced North Atlantic sea surface temperatures could have affected westerly flow, which in turn influenced north Pacific sea surface temperatures as well as the strength and location of the Aleutian Low (Kokorowski et al., 2008).
With the continued lack of vegetative productivity and increased aridity, the middle Susitna Valley likely remained very sparsely inhabited by larger terrestrial mammals (i.e., bison, elk, and caribou) that were important resources for humans. This potential lack of subsistence resources during this time period would have made the region less attractive for humans use. This is in contrast to sites in Interior Alaska, where Artemisia and grasses expanded during the YD (Bigelow and Edwards, 2001), likely creating additional pasture lands for bison, elk and caribou, resulting in those areas having archeological sites dating to the YD (Graf and Bigelow, 2011).
Early Holocene (∼11,200 – ∼ 8200 cal yr BP)
In our study area, lake sediment geochemistry and sedimentary diatoms suggest the lakes were relatively deep and productive, at least at the outset of the period. At Clarence Lake, diatom-inferred variables indicate a rapid lake-level rise beginning ∼11,300 cal yr BP, along with increased bedrock weathering and greater watershed productivity, which is consistent with the higher %C and lowered δ13C at this time. However, by ∼10,500 cal yr BP, productivity was decreasing (lowered TP) as lake level and conductivity also decreased (Figure 13).
Pollen records from Clarence Lake and Sally Lake contain an episode of increased cottonwood/aspen pollen frequencies that span most of the early Holocene (Figures 9, 11). As Populus pollen does not travel far from its source and is easily degraded, this indicates that the trees were growing near the lakes (Edwards and Dunwiddie, 1985). However, Deadman Lake does not record a similar cottonwood/aspen blip (although a few pollen grains were encountered), suggesting the Populus expansion did not reach as high as Deadman lake, at about 960 m.
At Clarence Lake, Ceratophyllum spines (presumably C. demersum) were encountered at the same levels as the increased cottonwood/aspen pollen frequencies (Figures 9, 13). C. demersum is an aquatic plant that favors still, relatively shallow waters found at the lake margin. Today, it is found mainly within the boreal forest, although it has been found at a few localities at the spruce limit or just beyond it (Holmquist, 1971; Les, 1986). While it is unknown whether C. demersum grows in Clarence Lake today, its presence in the lake during the early Holocene is highly suggestive of warmer than modern summer temperatures.
Shifts in solar insolation suggest marked summer warming during the early Holocene (Figure 13) (Berger, 1978). However, a recent summary of Beringian early Holocene proxy climatic records noted a surprising amount of incoherence among records, with significant geographical and proxy-based complexity (Kaufman et al., 2016), which is reflected in the somewhat contrasting midge and pollen based temperature reconstructions (Figure 13). Complexity at the regional scale is also mirrored in the current study. Here, the early Holocene is characterized by initial warming (pollen), increased moisture (diatoms), and increased lake productivity (sediment geochemistry and diatoms). However, diatoms and sediment geochemistry also suggest lower lake levels and lake productivity especially after ∼10,500 cal yr BP, while the pollen suggests continued summer warmth to ∼8,200 cal yr BP. These somewhat contrasting results probably reflect the relative sensitivity of the proxy and whether the terrestrial (pollen) or lacustrine (diatoms) environments were equally sensitive to climate change. Changes in the diatom-inferred variables after 10,500 cal yr BP mirror reduced summer insolation, as well as reduced peatland initiation (Figure 13). This suggests that the lacustrine environments were driven by external factors such as temperature and moisture, but that terrestrial environments may have been mediated by internal factors that are indirectly related to climate, such as soil development, paludification, and plant succession.
The earliest evidence of humans using the upper and middle Susitna Valley date to the early Holocene (∼11,140–10,520 cal yr BP) with the lowest components at Jay Creek Ridge and other sites (Dixon, 1999; Blong, 2016; Reuther et al., 2018) (Figure 1). Degradation of organic remains resulting from slow burial and acidic soils have hampered the dating of many archeological sites, and older archeological remains may be present but cannot be reliably dated. However, Wygal and Goebel (2012) suggest that this region and southcentral Alaska were colonized from the northern interior areas, in particular the Nenana and Tanana River Valleys, which have records of human occupation 2,000–3,000 years earlier. Even though the Susitna Valley was deglaciated one or two millennia prior to occupation, as described above, current archeological evidence suggests that the region was apparently unattractive for human habitation.
Because a large number of archeological components currently do not have reliable radiocarbon ages (Mulliken, 2016), it is best to view the chronology of the human occupation of the middle Susitna Valley as a whole, using relative age estimates based on their stratigraphic position relative to tephras with known age ranges (Dixon and Smith, 1990). We present the archeological data in terms of numbers of components per 1000 years within each stratigraphic category (i.e., below Oshetna, within Oshetna, between Oshtena and Watana, etc.) (Figure 13). Archeological components below the Oshetna tephra are older than ∼7,900 cal yr BP with some like Jay Creek Ridge Component 1 dating as far back as ∼11,140 cal yr BP (Figure 13). There are currently nine components (<4% of the total) that unequivocally lie below the Oshetna tephra, with a frequency of about 2.8 components per 1000 years. The upper and middle Sustina regions appear to be sparsely occupied during the pre-Oshetna time periods, most of the usage of the uplands areas being short hunting forays (Graf and Bigelow, 2011; Potter, 2011; Blong, 2018).
Middle (∼8200–4200 cal yr BP) and Late (∼4200–0 cal yr BP) Holocene
Diatom-inferred lake levels and productivity decreased or remained at lower levels during the middle and late Holocene, while bedrock weathering increased slightly during the late Holocene (Figure 13). Using 5% spruce pollen to indicate the local presence of trees (this study and Hu et al., 1993), we found that spruce were growing locally at Deadman Lake by ∼8,200 cal yr BP, at Clarence Lake by ∼7,600 cal yr BP, and at Sally Lake by ∼5,900 cal yr BP (Figure 13). Taking into account the 2 SD errors associated with the age models, spruce presence was contemporaneous at Deadman and Clarence lakes (9360–7030 and 8200–7120 cal yr BP, respectively), but was later at Sally (7310–4725 cal yr BP).
The expansion of spruce across interior Alaska started in the early Holocene, but continued through the middle Holocene and marked a radical change in the landscape that was probably driven initially by greater summer warmth. In interior Alaska, especially in the Tanana Valley, spruce was present by ∼11,000 cal yr BP (Bigelow and Powers, 2001), although it was slightly later in the tributary valleys (Bigelow and Edwards, 2001). In contrast, spruce trees were present in the lower Susitna Valley somewhat later, by ∼9,500 cal yr BP (Ager, personal communication), which is prior to its appearance in the middle Susitna Valley. In terms of chronology, the lower valley could be a source area, but spruce was present earliest at the sites furthest from the lower valley (Deadman and Clarence lakes) and latest at the site closest to the lower valley (Sally Lake) (Figure 13). This is unexpected, as the obvious route for spruce migration would seem to be up the Susitna Valley. The source of the spruce was likely from sites east of our study area where pollen records from Rock Creek (Schweger, 1981), Ten Mile Lake (Anderson et al., 1994), and Canyon Lake (Shimer, 2009), and sites in the Copper River Basin (Ager, 1989) (Figure 1) indicate that spruce trees were present at those sites by ∼10,000 cal yr BP.
Pollen records at two of the lakes (Deadman and Clarence lakes) indicate a reduction in spruce abundance in the late Holocene (after ∼5,000 cal yr BP at Deadman Lake, possibly somewhat later at Clarence Lake). In contrast, the Sally Lake record shows no such decline, except maybe at the very top. This indicates that spruce retracted its range at the higher elevations, but that lower elevations (such as at Sally Lake) were largely unaffected. Spruce distribution is strongly correlated with summer temperature (Thompson et al., 1999), and reduced spruce abundance, especially at tree-line, implies summertime cooling. This cooling is consistent with the midge and pollen-based temperature reconstructions (Figure 13), as well as well-documented neoglacial ice advances in numerous Alaskan mountain ranges, although they have not been mapped in our region (Porter, 2007; Kaufman et al., 2016).
While the informally named Oshetna, Watana and Devil tephra deposits have been documented in the middle and upper Susitna Valley (Dilley, 1988; Dixon and Smith, 1990; Mulliken, 2016), only the widespread Watana tephra (∼4000 cal yr BP [Beget et al., 1991; Wallace et al., 2014; Mulliken, 2016]) is preserved in all our lake cores. Clarence and Sally Lakes, because of their high sampling resolution may preserve evidence of a transient landscape change associated with the Watana tephra. At both lakes, lowered %C may indicate a brief reduction in lake productivity and pollen suggests a transient increase in spruce and decrease in birch (Figures 7, 9, 11). While these data are still preliminary (we need additional high-resolution analyses), they do suggest that the vegetation in the region was sensitive to these tephra falls. However, the impact on people living in the region is still a matter of debate, as discussed below.
In terms of archeology, Northern Archaic components are stratigraphically situated between the Oshetna and Watana ashfalls (∼6,570–4,400 cal yr BP), and between the Watana and Devil ashfalls (∼3,360–1,825 cal yr BP). The numbers of components and the density of refuse left behind at sites significantly increases after the deposition of the Oshetna ashfall (Dixon et al., 1985; Mulliken, 2016). The frequency of components between the Oshetna and Watana tephras (n = 31; 14.3 components/1000 years) and between the Watana and Devil tephras (n = 32; 20.8 components/1000 years) are similar, but increase slightly after the Watana ashfall (Figure 13). While the number of components increases after the Watana ashfall, the few sites that are radiocarbon dated do suggest a hiatus in use of the area following the Watana tephra (Mulliken, 2016). In all, these Northern Archaic components account for 26% of the components in the region for all time periods. Populations during the Northern Archaic period likely increased their hunting ranges focusing on more seasonally abundant resources than previous populations and targeting montane and upland landscapes more intensively (Potter, 2008a).
Mason and Bigelow (2008) hypothesized that Northern Archaic populations thrived in cooler periods, specifically pointing to a cold anomaly ∼5,600 to 5,000 cal yr BP in the GISP2 ice core record, when caribou populations may have expanded (sensu Mason et al., 2001). In Alaska, radiocarbon dated Northern Archaic components appear to peak between 5,700 and 4,500 cal yr BP (Esdale, 2008), which would roughly correspond to this cooling period and components that are situated between the Oshetna and Watana tephras could date to this period. However, our regional paleoecological data do not show significant landscape responses to cooling in this region between 5,500 and 5,000 cal yr BP. As noted above, it is only after ∼5,000 cal yr BP that we see potential effects of lower summertime temperatures evident in a retraction of spruce from higher elevation sites (i.e., Deadman Lake). Caribou abundance may have risen in the study area after the retraction of spruce, and, in turn, Northern Archaic populations would have increased their usage of the region. However, while components dating to after the Oshetna ashfall may have utilized higher elevations once spruce retracted its range, we cannot directly correlate the two events because of problems in the archeological chronology mentioned above.
Components after the Devil deposition span the earliest part of the Athabascan Tradition period to early historic times when Euroamerican explorers and settlers entered interior Alaska (Dixon et al., 1985). Over 60% of the archeological components for all time periods lie above the Devil tephra (with a frequency of 96.6 components/1000 years), a very notable increase that is likely biased toward an increased archeological visibility, as many of these are near the surface and not deeply buried in sediment. Upland usage and the subsistence resource bases did not change between Northern Archaic and Athabascan Traditions, with the exception of more moose acquired by the latter (Potter, 2008a).
Several studies demonstrate the potential for negative ecological impacts of distal tephras in boreal forest and tundra ecosystems at high latitudes, especially to important subsistence resources (caribou), as well as reduced usable landscape for humans (VanderHoek and Nelson, 2007; Kuhn et al., 2010; Mullen, 2012). While regional landscape use and resource exploitation did not dramatically change over the last 6000 years in the study area, if caribou herds were impacted by changes in vegetation following deposition regional tephras, the Northern Archaic and Athabascan Traditions would likely have also been impacted because of their specialized focus of hunting caribou in the upland regions (Mulliken, 2016). People would have likely abandoned the middle Susitna Valley to hunt caribou in other areas of interior Alaska not impacted by tephra deposition, only returning once caribou abundance increased sufficiently to support sustained human use in the region. As noted above, paleoecological data from most of our study lakes indicate that vegetation was impacted by at least the Watana deposition. However, because of the inexact archeological chronology in the middle Susitna Valley, we cannot currently calculate a period of abandonment, or if one actually did indeed occur, following deposition of the Watana tephra.
Conclusion
This study presents the results of a multidisciplinary research effort in the middle Susitna Valley. Lacustrine cores from lakes in the boreal forest and tundra shed light on tephra deposition and landscape change after ∼12,000 cal yr BP.
The lake cores preserve several tephra deposits, although only one (Watana tephra at ∼4,000 cal yr BP) is also preserved in terrestrial sections in the region. Other terrestrial tephra units (the locally named Oshetna and Devil tephras) are not present in the lake cores. However, in the lake records, tephras dated ∼11,000 and ∼11,600 cal yr BP are new to the region and glass chemistry indicates it may have originated from Hayes Volcano, suggesting a previously unknown eruption from that source. Other tephras are currently unidentified.
Paleoecological analyses indicate the lakes were productive immediately after formation ∼12,000 cal yr BP. The vegetation was a shrub tundra, which was relatively unproductive at some lakes, but not others, suggesting a mosaic across the region. High-resolution analyses at Clarence Lake indicate a brief but dramatic change in the lake with a drop in water level and reduced productivity which coincides with a transient reduction in woody taxa. Taken together, these events indicate climatic cooling and increased aridity. This event could be linked with the YD, although uncertainties in the lake chronology make a formal correlation premature. Subsequently, various proxies at all lakes returned to previous levels, though productivity immediately began to taper off, a trend which continued through the Holocene. In contrast, pollen records indicate the expansion first of cottonwood/aspen, then of spruce beyond their current limits in the early Holocene, both of which point to greater summer warmth. Cottonwood/aspen then retracted by about 8,000 cal yr BP and spruce retracted after about 4,500 cal yr BP.
The extent that people were affected by landscape changes and tephra falls is important for a better understanding of human-environment interactions in the region. The middle Susitna Valley has hundreds of archeological components that span about 11,000 years. However, the region was unoccupied earlier, even though the data presented here suggest this upland landscape may have been somewhat productive. Lower valleys, such as the Tanana and Nenana River Valleys, may have had enough resources, including bison and elk, to support much of the populations before 11,000 cal yr BP, therefore the need to use the sparse upland resources was minimal (Yesner, 2007; Graf and Bigelow, 2011; Potter, 2011). The earliest evidence of humans using the upper and middle Susitna Valleys date to the early Holocene (∼11,140–10,520 cal yr BP), coinciding with a period of greater summer warmth and the expansion of cottonwood/aspen.
Our data suggests that the Watana tephra had an effect on the landscape with reduced lake productivity and minor changes in the vegetation. How these might have affected resource abundance, especially caribou populations, is currently unclear, and will require a more refined archeological chronology to determine if human use of the region was impacted.
Data Availability
Geochemistry, diatom, and pollen data are all available upon request. Tephra data are included in Supplementary Materials.
Author Contributions
NB, JR, and MW participated in field work. NB, JR, MW, KW, KM, and ÉS-T generated data and wrote and edited the text.
Funding
This study was funded by the State of Alaska with a grant to the Susitna-Watana Hydroelectric Project.
Conflict of Interest Statement
The authors declare that the research was conducted in the absence of any commercial or financial relationships that could be construed as a potential conflict of interest.
Acknowledgments
We would like to thank the Alaska Energy Authority and the Susitna-Watana Hydroelectric Project for funding this project. We would like to thank Patrick Hall, Justin Hayes, and Gerad Smith of Northern Land Use Alaska for helping in the field, and we would also like to thank Cassidy Phillips for making the stratigraphic diagrams.
Supplementary Material
The Supplementary Material for this article can be found online at: https://www.frontiersin.org/articles/10.3389/feart.2019.00043/full#supplementary-material
Footnotes
References
Abbott, M. B., Finney, B. P., Edwards, M. E., and Kelts, K. R. (2000). Lake-level reconstructions and paleohydrology of Birch Lake, Central Alaska, based on seismic reflection profiles and core transects. Quat. Res. 53, 154–166. doi: 10.1006/qres.1999.2112
Ager, T. A. (1989). “History of late Pleistocene and Holocene vegetation in the Copper River Basin, South-Central Alaska,” in Late Cenozoic History of the Interior Basins of Alaska and the Yukon. U.S. Geological Survey Circular 1026, eds D. L. Carter, T. D. Hamilton, and J. P. Galloway (Washington, DC: U.S. Geological Survey),89–92.
Ager, T. A. (2018). Pollen Data from Watana Triangle Pond [Online]. Data lodged in Neotoma Paleoecology Database. Available at: https://apps.neotomadb.org/explorer/ [accessed September, 2018].
Alaska Biological Research (2014). Vegetation and Wildlife Habitat Mapping Study in the Upper and Middle Susitna Basin Study Plan Section 11.5: Initial Study Report Part A: Sections 1-6, 8-10. (Anchorage: Alaska Energy Authority). Available at: “http://www.susitna-watanahydro.org/wp-content/uploads/2014/05/11.5_VWHAB_ISR_PartA.pdf “. Data: “http://gis.suhydro.org/isr/11-Botanical/”
Alaska Climate Research Center (2014). Alaska Climate Normals 1981-2010. Available at: http://akclimate.org/Climate/Normals [Online] [accessed March 24, 2014].
Alaska Department of Fish and Game (1983). Deadman Lake Bathymetry. Available at: http://www.adfg.alaska.gov/index.cfm?adfg=fishingsportstockinghatcheries.lakesdatabase
Alaska Department of Fish and Game (2019). Clarence Lake Bathymetry. Alaska Departement of Fish and Game. Available at: http://www.adfg.alaska.gov/index.cfm? adfg=fishingSportLakeData.lakeDetail\&LakeID=435
Anderson, P. M., and Brubaker, L. B. (1986). Modern pollen assemblages from northern Alaska. Rev. Palaeobot. Palynol. 46, 273–291. doi: 10.1111/j.1365-294X.2010.04881.x
Anderson, P. M., Edwards, M. E., and Brubaker, L. B. (2004). “Results and paleoclimate implications of 35 years of paleoecological research in Alaska,” in The Quaternary Period in the United States, eds A. R. Gillespie and S. C. Porter (Amsterdam: Elsevier), 427–440.
Anderson, P. M., Lozhkin, A. V., Eisner, W. R., Kozhevnikova, M. V., Hopkins, D. M., Brubaker, L. B., et al. (1994). Two late Quaternary pollen records from south-central Alaska. Géograph. Phys. Quat. 48, 131–143. doi: 10.7202/032990ar
Antoniades, D., Hamilton, P. B., Douglas, M. V. S., and Smol, J. P. (2008). “Diatoms of North America: the freshwater floras of Prince Partick, Ellef Ringnes and northern Ellesmere Islands from the Canadian Arctic Archipelago,” in Iconographica Diatomologica 17, ed. H. Lange-Bertalot (Ruggell: A. R. G. Gantener-Verlag).
Battarbee, R. W., Jones, V. J., Flower, R. J., Cameron, N. G., Bennion, H., Carvalho, L., et al. (2001). “Diatoms,” in Tracking Environmental Change Using Lake Sediments Volume 3 (Terrestrial, Algal and Siliceous Indicators), eds J. P. Smol, H. J. B. Birks, and W. M. Last (Dordrecht: Kluwer Academic Publishers), 155–202.
Beget, J. E., Reger, R. D., Pinney, D., Gillispie, T., and Campbell, K. (1991). Correlation of the Holocene Jarvis Creek, Tangle Lakes, Cantwell, and Hayes tephras in south-central and central Alaska. Quat. Res. 35, 174–189. doi: 10.1016/0033-5894(91)90065-D
Berger, A. (1978). Long-term variations of daily insolation and Quaternary climatic changes. J.f Atmosph. Sci. 35, 2362–2367. doi: 10.1175/1520-0469(1978)035<2362:LTVODI>2.0.CO;2
Bigelow, N. H. (2013). “POLLEN RECORDS, LATE PLEISTOCENE | Northern North America,” in Encyclopedia of Quaternary Science, 2nd Edn, eds S. A. Elias and C. J. Mock (Amsterdam: Elsevier), 39–51.
Bigelow, N. H., and Edwards, M. E. (2001). A 14,000 yr paleoenvironmental record from Windmill Lake, central Alaska: lateglacial and Holocene vegetation in the Alaska Range. Quat. Sci. Rev. 20, 203–215. doi: 10.1016/S0277-3791(00)00122-0
Bigelow, N. H., and Powers, W. R. (2001). Climate, vegetation, and archaeology 14,000-9000 cal yr B.P. in central Alaska. Arctic Anthropol. 38, 171–195.
Björck, S. (2007). “Younger Dryas Oscillation, Global Evidence,” in Encyclopedia of Quaternary Science, ed. S. A. Elias (Amsterdam: Elsevier), 1985–1993.
Blaauw, M., and Christen, J. A. (2011). Flexible paleoclimate age-depth models using and autoregressive gamma process. Bayesian Anal. 6, 457–474.
Blong, J. C. (2016). Prehistoric Landscape use in the central Alaska Range. Unpublished Ph.D. thesis, Texas A&M University, College Station, TX.
Blong, J. C. (2018). Late-Glacial Hunter-Gatherers in the Central Alaska Range and the Role of Upland Ecosystems in the Peopling of Alaska. PaleoAmerica 42, 1–31. doi: 10.1080/20555563.2018.1460156
Boggs, K., Boucher, T. V., Kuo, T. T., Fehringer, D., and Guyer, S. (2014). Vegetation Map and Classification: Northern, Western and Interior Alaska [Online]. Anchorage: University of Alaska Anchorage.
Borchardt, G. A. (1974). The SIMAN coeffiecient for similarity analysis. Classif. Soc. Bull. 3, 2–8.
Bowers, P. M., Reuther, J., Stern, R. O., Gelvin-Reymiller, C., Slaughter, D., Baxter-McIntosh, J., et al. (2011). Susitna-Watana Hydrological Project Cultural Resources Data Gap Analysis. Report Prepared for the Alaska Energy Authority by Northern Land Use Research, Inc.”. (Fairbanks). Available at: http://www.arlis.org/docs/vol1/Susitna2/1/SuWa122.pdf
Briner, J. P., Kaufman, D. S., Werner, A., Caffee, M., Levy, L., Manley, W. F., et al. (2002). Glacier readvance during the late glacial (Younger Dryas?) in the Ahklun Mountains, southwestern Alaska. Geology 30, 679–682. doi: 10.1130/0091-7613(2002)030<0679:GRDTLG>2.0.CO;2
Cameron, C. E., Mulliken, K. M., Crass, S. W., Schaefer, J. R., and Wallace, K. L. (2019). Alaska Volcano Observatory Geochemical Database; Version 2: Alaska Division of Geological & Geophysical Surveys Digital Data Series 8 v. 2 (Fairbanks, AK: Alaska Division of Geological & Geophysical Surveys), 26. doi: 10.14509/30058
Cumming, B. F., Wilson, S. E., Hall, R. I., and Smol, J. P. (1995). Diatoms from British Columbia (Canada) lakes and their relationship to salinity, nutrients and other limnological variables. Bibl. Diatomol. 31, 1–207.
Dilley, T. E. (1988). Holocene Tephra Stratigraphy and Pedogenesis in the Middle Susitna River Valley. Unpublished M.S. thesis, University of Alaska Fairbanks, Fairbanks, AK.
Dixon, E. J. (1999). Bones, Boats and Bison: Archaeology and the First Colonization of Western North America. Albuquerque: University of New Mexico Press.
Dixon, E. J., Andrefsky, W., Utermohle, C. J., Smith, G. S., and Saleeby, B. M. (1985). Susitna Hydroelectric Project: Cultural Resources Investigations 1979-1985. Fairbanks, AK: University of Alaska.
Dixon, E. J., and Smith, G. S. (1990). “A regional application of tephrochronology in Alaska,” in Archaeological Geology of North America, eds N. P. Lasca and J. Donahue (Boulder: Geological Society of America), 383–398.
Edwards, M. E., and Dunwiddie, P. W. (1985). Dendrochronological and palynological observations on Populus balsamifera in northern Alaska, U. S. A. Arct. Alp. Res. 17, 271–278. doi: 10.2307/1551017
Engstrom, D. R., Hansen, B. C. S., and Wright, H. E. (1990). A possible Younger Dryas record in southeastern Alaska. Science 250, 1383–1385. doi: 10.1126/science.250.4986.1383
Esdale, J. A. (2008). A current synthesis of the Northern Archaic. Arct. Anthropol. 45, 3–38. doi: 10.1353/arc.0.0006
Fallu, M.-A., Allaire, N., and Pienitz, R. (2000). Freshwater diatoms from northern Québec and Labrador. Bib. Diatomol. 45, 1–200.
Gaglioti, B. V., Mann, D. H., Wooller, M. J., Jones, B. M., Wiles, G. C., Groves, P., et al. (2017). Younger-Dryas cooling and sea-ice feedbacks were prominent features of the Pleistocene-Holocene transition in Arctic Alaska. Quat. Sci. Rev. 169, 330–343. doi: 10.1016/j.quascirev.2017.05.012
Graf, K. E., and Bigelow, N. H. (2011). Human response to climate during the Younger Dryas chronozone in central Alaska. Quat. Int. 242, 434–451. doi: 10.1016/j.quaint.2011.04.030
Gregory-Eaves, I., Smol, J. P., Finney, B. P., and Edwards, M. E. (1999). Diatom-based transfer functions for inferring past climatic and environmental changes in Alaska. U.S.A. Arct. Antarct. Alp. Res. 4, 353–365. doi: 10.1080/15230430.1999.12003320
Grimm, E. C. (2016). Tilia [Online]. Available at: https://www.tiliait.com/
Guthrie, R. D. (1990). Frozen Fauna of the Mammoth Steppe. Chicago: University of Chicago Press. doi: 10.7208/chicago/9780226159713.001.0001
Hansen, B. C. S., and Engstrom, D. R. (1996). Vegetation history of Pleasant Island, southeastern Alaska, since 13,000 yr B. P. Quat. Res. 46, 161–175. doi: 10.1006/qres.1996.0056
Holmquist, C. (1971). Northerly localities for three aquatic plants, Lemna trisulca L., Ceratophyllum demersum L., and Myriophyllum spicatum L. Bot. Notiser 124, 335–342.
Hopkins, D. M. (1982). “Aspects of the paleogeography of Beringia during the late Pleistocene,” in Paleoecology of Beringia, eds D. M. Hopkins, J. J. V. Matthews, C. E. Schweger, and S. B. Young (New York, NY: Academic Press), 3–28.
Hu, F. S., Brubaker, L. B., and Anderson, P. M. (1993). A 12,000 year record of vegetation change and soil development from Wien Lake, central Alaska. Can. J. Bot. 71, 1133–1142. doi: 10.1139/b93-133
Jones, M. C., Peteet, D. M., Kurdyla, D., and Guilderson, T. (2009). Climate and vegetation history from a 14,000-year peatland record, Kenai Peninsula, Alaska. Quat. Res. 72, 207–217. doi: 10.1016/j.yqres.2009.04.002
Jones, M. C., and Yu, Z. (2010). Rapid deglacial and early Holocene expansion of peatlands in Alaska. Proc. Natl. Acad. Sci. U.S.A. 107, 7347–7352. doi: 10.1073/pnas.0911387107
Juggins, S. (2014). C2 Version 1.7.6 Software for Ecological and Palaeoecological Data Analysis and Visualisation [Online]. Newcastle upon Tyne: Newcastle University.
Kachadoorian, R. (1974). Geology of the Devil Canyon Dam site, Alaska. Open-file Report, No. 74-40. Reston, VI: United States Geological Survey.
Kallel, H., Labeyrie, L. C., Arnold, M., Okada, H., Dudley, W. C., and Duplessy, J.-C. (1988). Evidence of cooling during the Younger Dryas in the western North Pacific. Oceanol. Acta 11, 369–375.
Kaufman, D. S., Axford, Y. L., Henderson, A. C. G., McKay, N. P., Oswald, W. W., Saenger, C., et al. (2016). Holocene climate changes in eastern Beringia (NW North America) – A systematic review of multi-proxy evidence. Quat. Sci. Rev. 147, 312–339. doi: 10.1016/j.quascirev.2015.10.021
Kaufman, D. S., Scott Anderson, R., Hu, F. S., Berg, E., and Werner, A. (2010). Evidence for a variable and wet Younger Dryas in southern Alaska. Quat. Sci. Rev. 29, 1445–1452. doi: 10.1016/j.quascirev.2010.02.025
Kokorowski, H. D., Anderson, P. M., Mock, C. J., and Lozhkin, A. V. (2008). A re-evaluation and spatial analysis of evidence for a Younger Dryas climatic reversal in Beringia. Quat. Sci. Reviews 27, 1710–1722. doi: 10.1016/j.quascirev.2008.06.010
Kuhn, T. S., McFarlane, K. A., Groves, P., Mooers, A. Ø, and Shapiro, B. (2010). Modern and ancient DNA reveal recent partial replacement of caribou in the southwestern Yukon. Mol. Ecol. 19, 1312–1323. doi: 10.1111/j.1365-294X.2010.04565.x
Les, D. H. (1986). The phytogeography of Ceratophyllum demersum and C. echinatum (Ceratophyllaceae) in glaciated North America. Can. J. Bot. 64, 498–509. doi: 10.1139/b86-064
Mann, D. H., Groves, P., Reanier, R. E., Gaglioti, B. V., Kunz, M. L., and Shapiro, B. (2015). Life and extinction of megafauna in the ice-age Arctic. Proc. Natl. Acad. Sci. U.S.A. 112, 14301–14306. doi: 10.1073/pnas.1516573112
Mann, D. H., Groves, P., Reanier, R. E., and Kunz, M. L. (2010). Floodplains, permafrost, cottonwood trees, and peat: What happened the last time climate warmed suddenly in Arctic Alaska? Quat. Sci. Rev. 29, 3812–3830. doi: 10.1016/j.quascirev.2010.09.002
Mann, D. H., Peteet, D. M., Reanier, R. E., and Kunz, M. L. (2002). Responses of an arctic landscape to Lateglacial and early Holocene climatic changes: the importance of moisture. Quat. Sci. Rev. 21, 997–1021. doi: 10.1016/S0277-3791(01)00116-0
Mason, O. K., and Bigelow, N. H. (2008). The crucible of early to mid-Holocene climate in northern Alaska; Does Northern Archaic represent the people of the spreading forest? Arct. Anthropol. 45, 39–70. doi: 10.1353/arc.0.0008
Mason, O. K., Bowers, P. M., and Hopkins, D. M. (2001). The early Holocene Milankovitch thermal maximum and humans: adverse conditions for the Denali complex of eastern Beringia. Quat. Sci. Rev. 20, 525–548. doi: 10.1016/S0277-3791(00)00100-1
Max, L., Riethdorf, J.-R., Tiedemann, R., Smirnova, M., Lembke-Jene, L., Fahl, K., et al. (2012). Sea surface temperature variability and sea-ice extent in the subarctic northwest Pacific during the past 15,000 years. Paleoceanography 27:A3213. doi: 10.1029/2012pa002292
McAndrews, J. H., Berti, A. A., and Norris, G. (1973). Key to the Quaternary Pollen and spores of the Great Lakes Region. Toronto: Royal Ontario Museum. doi: 10.5962/bhl.title.60762
Meyer, H., Schirrmeister, L., Yoshikawa, K., Opel, T., Wetterich, S., Hubberten, H.-W., et al. (2010). Permafrost evidence for severe winter cooling during the Younger Dryas in northern Alaska. Geophys. Res. Lett. 37:L03501. doi: 10.1029/2009GL041013
Meyers, P. A., and Ishiwatari, R. (1993). Lacustrine organic geochemistry—an overview of indicators of organic matter sources and diagenesis in lake sediments. Organ. Geochem. 20, 867–900. doi: 10.1016/0146-6380(93)90100-P
Mikolajewicj, U., Crowley, T. J., Schiller, A., and Voss, R. (1997). Modelling teleconnections between the North Atlantic and North Pacific during the Younger Dryas. Nature 387, 384–387. doi: 10.1038/387384a0
Moore, P. D., Webb, J. A., and Collinson, M. E. (1991). Pollen Analysis. Oxford: Blackwell Scientific Publications.
Moos, M. T., Laird, K. R., and Cumming, B. F. (2009). The Holocene Climate-related eutrophication of a small boreal lake in northwestern Ontario: a palaeolimnological perspective. Holocene 19, 359–367. doi: 10.1177/0959683608101387
Muhs, D. R., Ager, T. A., Bettis, E. A., McGeehin, J., Been, J. M., Begét, J. E., et al. (2003). Stratigraphy and palaeoclimatic significance of Late Quaternary loess-palaeosol sequences of the Last Interglacial-Glacial cycle in central Alaska. Quat. Sci. Rev. 22, 1947–1986. doi: 10.1016/S0277-3791(03)00167-7
Mullen, P. O. (2012). An archaeological test of the effects of the White River Ash eruptions. Arct. Anthropol. 49, 35–44. doi: 10.1353/arc.2012.0013
Mulliken, K. (2016). Holocene Volcanism and Human Occupation in the Middle Susitna River Valley,Athe Chulitna River in Broad Pass about laska. Unpublished MA. thesis, University of Alaska Fairbanks, Fairbanks, AK.
Muschitiello, F., and Wohlfarth, B. (2015). Time-transgressive environmental shifts across Northern Europe at the onset of the Younger Dryas. Quat. Sci. Rev. 109, 49–56. doi: 10.1016/j.quascirev.2014.11.015
Peteet, D. M., Del Genio, A., and Lo, K. K.-W. (1997). Sensitivity of northern hemisphere air temperatures and snow expansion to North Pacific sea surface temperatures in the Goddard Institute for Space Studies general circulation model. J. Geophys. Res. 102, 23781–23791. doi: 10.1016/j.quascirev.2014.11.015
Peteet, D. M., and Mann, D. H. (1994). Late-glacial vegetational, tephra, and climatic history of southwestern Kodiak Island. Alaska. Écoscience 1, 255–267. doi: 10.1029/97JD01573
Porter, S. C. (2007). “GLACIATIONS | Neoglaciation in the American Cordilleras,” in Encyclopedia of Quaternary Science, ed. S. A. Elias (Oxford: Elsevier), 1133–1142. doi: 10.1080/11956860.1994.11682250
Potter, B. A. (2008a). A first approximation of Holocene inter-assemblage variability in central Alaska. Arct. Anthropol. 45, 89–113. doi: 10.1353/arc.0.0013
Potter, B. A. (2008b). Exploratory models of intersite variability in mid to late Holocene central Alaska. Arctic 61, 407–425.
Potter, B. A. (2011). “Late Pleistocene and early Holocene assemblage variability in central Alaska,” in From the Yenisei to the Yukon: Interpreting Lithic Assemblage Variability in Late Pleistocene/Early Holocene Beringia, eds T. Goebel and I. Buvit (College Station, TX: Texas A&M University Press), 215–233.
Praetorius, S. K., and Mix, A. C. (2014). Synchronization of North Pacific and Greenland climates preceded abrupt deglacial warming. Science 345, 444–448. doi: 10.1126/science.1252000
Rasmussen, S. O., Bigler, M., Blockley, S. P., Blunier, T., Buchardt, S. L., Clausen, H. B., et al. (2014). A stratigraphic framework for abrupt climatic changes during the Last Glacial period based on three synchronized Greenland ice-core records: refining and extending the INTIMATE event stratigraphy. Quat. Sci. Rev. 106, 14–28. doi: 10.1016/j.quascirev.2014.09.007
Reger, R. D., Bundtzen, T. K., and Smith, T. E. (1990). Geology of the Healy A-3 Quadrangle, Alaska. Public-data File 90-1. Fairbanks, AK: Alaska Division of Geological and Geophysical Surveys. doi: 10.14509/1433
Reuther, J. D., Dixon, E. J., Mulliken, K., and Potter, B. A. (2018). The early Holocene-Aged component at the Jay Creek Ridge site, middle Susitna River Valley, Alaska. PaleoAmerica 1–5. doi: 10.1080/20555563.2018.1554963
Saulnier-Talbot, É. (2007). Impacts de L’évolution Climatique Postglaciaire sur les lacs de L’extrême nord de l’Ungava. Unpublished Ph.D. thesis, Université Laval, Québec, QC.
Schweger, C. (1981). Chronology of late glacial events from the Tangle Lakes, Alaska Range, Alaska. Arct. Anthropol. 18, 97–101.
Shimer, G. (2009). Holocene Vegetation and Climate Change at Canyon Lake, Copper River Basin, Alaska. Unpublished MS. thesis, University of Alaska Fairbanks, Fairbanks, AK.
Thompson, R. S., Anderson, K. H., and Bartlein, P. J. (1999). Atlas of Relations Between Climatic Parameters and Distribution of Important Trees and Shrubs in North America–Introduction and Conifers”, in: U.S. Geological Survey Professional Paper 1650-A. Washington: U.S. Dept. of the Interior.
Thorson, R. M., Dixon, E. J., Smith, G. S., and Batten, A. R. (1981). Interstadial proboscidean from south-central Alaska: implications for biogeography, geology, and archaeology. Quat. Res. 16, 404–417. doi: 10.1016/0033-5894(81)90019-3
VanderHoek, R., and Nelson, R. E. (2007). “Ecological roadblocks on a constrained landscape: the cultural effects of catastrophic Holocene volcanism on the Alaska Peninusla, southwest Alaska,” in Living Under the Shadow: Cultural Impacts of Volcanic Eruptions, eds J. Grattan and R. Torrence (Walnut Creek, CA: Left Coast Press), 133–152.
Viau, A. E., Gajewski, K., Sawada, M. C., and Bunbury, J. (2008). Low- and high-frequency climate variability in eastern Beringia during the past 25 000 years. Can. J. Earth Sci. 45, 1435–1453. doi: 10.1139/E08-036
Wallace, K. L., Coombs, M. L., Hayden, L. A., and Waythomas, C. F. (2014). Significance of a near-source tephra-stratigraphic sequence to the eruptive history of Hayes Volcano, south-central Alaska: U.S. Geological Survey Scientific Investigations Report 2014–5133. Reston, VA: U.S. Geological Survey doi: 10.3133/sir20145133
Walter Anthony, K. M., Zimov, S. A., Grosse, G., Jones, M. C., Anthony, P. M., Chapin, F. S., et al. (2014). A shift of thermokarst lakes from carbon sources to sinks during the Holocene epoch. Nature 511, 452–456. doi: 10.1038/nature13560
Woodward-Clyde Consultants (1982). Final Report on Seismic Studies for Susitna Hydroelectric Project: Subtasks 4.09 through 4.15. Buffalo, NY: Acres American Incorporated.
Wooller, M. J., Saulnier-Talbot,É, Potter, B. A., Belmecheri, S., Bigelow, N., Choy, K., et al. (2018). A new terrestrial palaeoenvironmental record from the Bering Land Bridge and context for human dispersal. R. Soc. Open Sci. 2018:180145. doi: 10.1098/rsos.180145
Workman, W. B. (1978). Prehistory of the Aishihik-Kluane area, southwest Yukon Territory. Ottowa, ON: National Museum of Man. doi: 10.2307/j.ctv16s1t
Wright, H. E., Mann, D. H., and Glaser, P. H. (1984). Piston corers for peat and lake sediments. Ecology 65, 657–659. doi: 10.2307/1941430
Wygal, B. T., and Goebel, T. (2012). Early prehistoric archaeology of the middle Susitna valley. Arct. Anthropol. 49, 97–108. doi: 10.1353/arc.2012.0014
Keywords: pollen, isotopes, tephra, diatoms, human paleoenvironments, central Alaska
Citation: Bigelow NH, Reuther JD, Wallace KL, Saulnier-Talbot É, Mulliken K and Wooller MJ (2019) Late-Glacial Paleoecology of the Middle Susitna Valley, Alaska: Environmental Context for Human Dispersal. Front. Earth Sci. 7:43. doi: 10.3389/feart.2019.00043
Received: 24 October 2018; Accepted: 22 February 2019;
Published: 12 March 2019.
Edited by:
Dorothy M. Peteet, Goddard Institute for Space Studies (NASA), United StatesReviewed by:
Maarten Blaauw, Queen’s University Belfast, United KingdomLi Wu, Anhui Normal University, China
Copyright © 2019 Bigelow, Reuther, Wallace, Saulnier-Talbot, Mulliken and Wooller. This is an open-access article distributed under the terms of the Creative Commons Attribution License (CC BY). The use, distribution or reproduction in other forums is permitted, provided the original author(s) and the copyright owner(s) are credited and that the original publication in this journal is cited, in accordance with accepted academic practice. No use, distribution or reproduction is permitted which does not comply with these terms.
*Correspondence: Nancy H. Bigelow, nhbigelow@alaska.edu