Fluctuations of Atmospheric Pressure and the Sound of Underground Karst Systems: The Antro del Corchia Case (Apuane Alps, Italy)
 Giovanni Badino1†
  Roberto Chignola2*
- 1Department of Physics, University of Turin, Turin, Italy
- 2Department of Biotechnology, University of Verona, Verona, Italy
Mountains that contain subterranean voids can inhale fresh and clean air, and their breath is a fascinating natural phenomenon that speleologists know very well. Air flow through the entrances of underground systems is also an interesting geophysical problem. Basically, it is caused by temperature and pressure gradients between the internal and external atmospheres, but the dynamic interplay between these two driving forces is still not well understood. Our contribution dissects the physics of underground winds. Wind velocity, internal and external temperature and pressure have been measured synchronously at two entrances of a vast (∼64 km) underground system beneath the Mount Corchia, Apuane Alps, Italy. The data shows that, within time scales of minutes to days, pressure fluctuations of the external atmosphere primarily force air to flow underground, whereas temperature gradients play only a minor role. We modeled the cave as a system that takes the external atmospheric pressure as the input signal and outputs wind from its entrances. This wind, in turn, contains information about the system’s response, and hence on the structure of the subterranean voids. This information can be extracted using standard signal processing techniques and by using deconvolution methods we identify the same infrasound resonances in signals sampled at both entrances. These are the characteristic frequencies of the cave, and by using the Helmholtz resonance formalism it can be estimated that the explored volume of this important underground system is less than half of its probable real extension.
Introduction
Caves are natural underground cavities and in most cases they are not isolated physical systems. The vast majority of caves on Earth are in fact connected to the external world by one or more entrances and by water flows, and in general they exchange energy that ultimately can sustain life in the form of a specialized biological community. Air flow in caves is frequently observed and is caused by temperature and pressure gradients between the internal and the external atmosphere. Periodic wind reversal within cave entrances has been observed and measured (Cigna, 1968; Plummer, 1969; Faimon et al., 2012), but in general this phenomenon is limited to simple underground systems formed by one or more huge chambers that can physically be modeled as Helmholtz resonators. Infrasonic resonances with frequencies ranging between 0.001 and 1 Hz have actually been measured for such systems (Cigna, 1968; Plummer, 1969; Faimon et al., 2012).
Deep (∼−1 km) and long (>>1 km) caves with more than one entrance show variable, often intense, air circulation, and these underground winds guide the explorations of speleologists through connected, yet unknown branches of subterranean voids. The physics of such winds is much more complex. Supplementary Figure S1 shows some examples of wind speed signals recorded by sonic anemometry at the entrances of some vast underground systems in Italy as well as their power spectra. The signals are very noisy and no clear-cut resonances can be appreciated. Intriguingly, the signals look very different for different caves; indeed, they are expected to carry information on the structure of each cave that, for the cases shown in Supplementary Figure S1, vary greatly.
The basic physical principles of underground air flow have started to be unraveled (Lewis, 1991; Badino, 1995, 2004, 2005, 2018; Lismonde, 2002; De Freitas et al., 2006). Air circulation in caves is basically driven by two independent forces. One is proportional to the density difference between the internal and external atmospheres and leads to air flow due to convection. Differences in the density of the internal and external atmosphere, in turn, are mainly determined by differences between the external and the internal temperatures. Cave temperature is always close to the yearly average external temperatures and importantly it is stable within tenths of a degree (Badino, 1995, 2004; Luetscher et al., 2005). Thus, air flow due to convection is essentially dependent on the local fluctuations of the external temperatures. On the other hand, one more force can trigger air flow in caves, and this is dependent on the fluctuations in the external atmospheric pressure that propagates into the cave (barometric air circulation).
No comprehensive models have been developed that can explain the physical details of underground winds in vast underground systems. Direct observations on wind speed flowing through the entrances of different cave systems might help in dissecting the driving forces and important parameters. Unfortunately, recording a single sample of wind velocity at only one entrance of different caves is not of much use. As shown in Supplementary Figure S1, signals are noisy and clear-cut patterns cannot be appreciated. For these reasons, wind speed data were synchronously recorded at two entrances placed at different heights of the same cave, and the internal and external air temperatures, as well as the external atmospheric pressure, were also measured. In the following sections we show that the data contains interesting information on the cave structure and provide new insights into the physics of air circulation in vast underground systems.
Materials and Methods
Brief Description of the Cave
The Antro del Corchia underground system develops within the Corchia Mountain in the Apuane Alps, Tuscany, Italy. Overall, the known part of the system is ∼1.2 km deep and ∼64 km long, and 16 entrances are presently known that provide access to an intricate network of huge galleries, chambers, shafts, and narrow passages that roughly develop along three main levels at different depths (see Piccini, 2011 for a comprehensive discussion about the Mt. Corchia karst system and its evolution). Measurements of wind speed and temperatures were taken at the Eolo (UTM WGS84: E 603862 N 4875936) and the Serpente (UTM WGS84: E 604243 N 4875633) entrances which open at 1.125 m and 943 m above sea level, respectively, on the same side of the mountain. The Serpente is a known entrance of the system which opens at the lowest altitude and is connected to the Eolo entrance by a ∼2.4 km long underground path. Maps of the cave are freely available for download from the website of the Federazione Speleologica Toscana (Tuscany Speleological Federation) at http://www.speleotoscana.it/vista-grotta/?id=120.
Signal Recording and Processing
Wind speed was measured using two biaxial Windsonic (Gill Instruments) sonic anemometers (accuracy 2% at 12 m/s, resolution 0.01 m/s). The anemometers were placed inside the cave at ∼1–5 m from both the Eolo and the Serpente entrances, and in the middle point of the smallest conduit section in order to increase accuracy and to reduce noise. Data were sampled at 0.2 Hz and stored electronically using a GP1 data-logger (Delta-T Devices).
External temperature and pressure were measured at 1 min intervals approximately halfway between the two cave entrances using a digital P-Log 125B barometer/thermometer equipped with an PT100 temperature sensor (resolution of 0.01°C) and a piezoresistive pressure sensor with a precision of 0.05 hPa in the range of 800–1200 hPa. The internal temperature was measured along the path connecting the two entrances. During the measurement campaign the internal temperature was 9.7 ± 0.2°C and for the purpose of the present work was considered constant (fluctuations in the order of 0.2° are not expected to contribute significantly to global underground air flow, see below and Badino, 1995).
The measurement campaign took place between July 7 and 14, 2008, and during this period we kindly asked speleologists/tourists not to visit the cave. Indeed, no transient perturbations of measurements due to the presence of people in proximity to the instruments could be observed in the signals (Supplementary Data Sheet S2).
All analyses were carried out using the software Mathematica (Wolfram Research Inc., v. 11.1.1.0), and its signal processing package, running on an iMac with 3.4 GHz Intel Core i7 processor.
Results and Discussion
Preliminary Analysis of Measured Time Series
Figure 1 shows wind speed data sampled at the two entrances of the Antro del Corchia cave and both the external temperature and atmospheric pressure. All data have been time-shifted to synchronize the time series. Note that the sampling rate of wind speed data is different from that of the other two time series’ (see above).
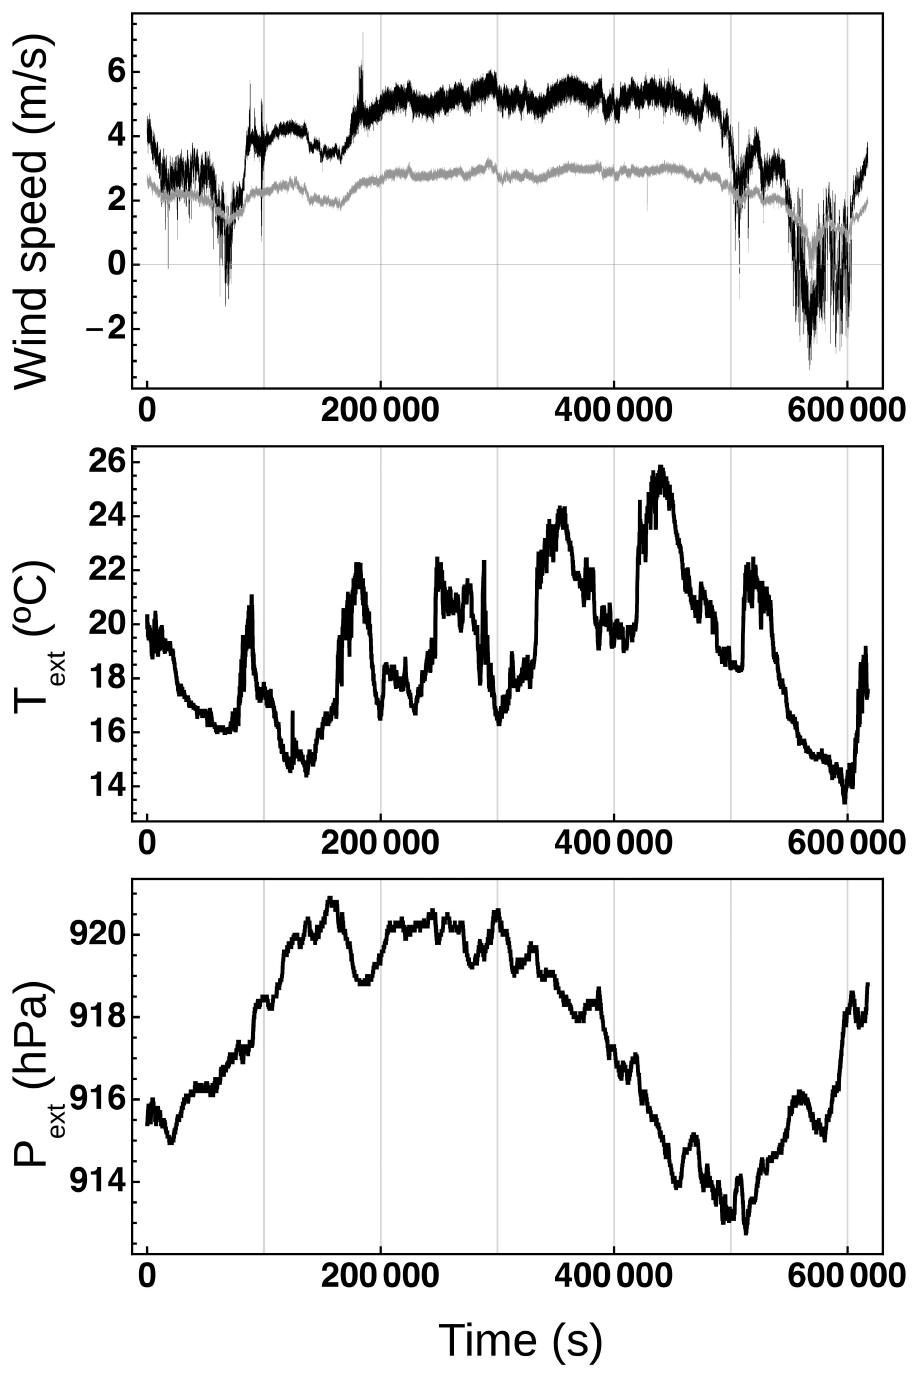
Figure 1. Wind speed and external temperature and pressure measured synchronously at the Eolo and Serpente entrances of the Antro del Corchia cave. Top, raw wind speed data recorded (0.2 Hz sampling rate) at the two entrances. Middle, external temperature. Bottom, external pressure.
The velocity of air flowing through the two entrances showed similar kinetics, but the magnitude of wind speed was generally higher at the Eolo entrance. On three occasions, at ∼65.000, ∼570.000, and ∼590.000 s, the direction of air flowing through this entrance reversed and, at the same time, local minima could be recorded at the Serpente entrance. The Eolo entrance is directly connected to large underground galleries (i.e., with a cross-sectional area of ∼10 m2), whereas the Serpente entrance is connected to them through a ∼40 m long narrow tube. The lower magnitude of wind velocity and the absence of wind reversal in the Serpente signal might have been caused by friction forces dumping underground wind flows (Badino, 1995).
No evident common patterns could be observed between wind speed data and in the external temperature or pressure signals. As expected, the external temperature showed daily periodic variations, and on two occasions – i.e., at ∼89000 s and ∼183000 s – a peak in the external temperature corresponded to a peak in wind speed flowing through the Eolo entrance.
Air Flow Due to Convection
The external temperature fluctuations give rise to density differences that increase linearly with ΔT = Text − Tin, where Text and Tin are the external and internal temperatures, respectively, and with the vertical cave length h. In the case of caves with many entrances placed at various heights – which is the case of the Antro del Corchia cave – this term determines convective internal air movements. It is quite easy to see that the air flux velocity is determined by the loss of charge along the internal paths by the condition that the pressure due to the density difference equals the pressure lost by friction, which roughly depends on the square of air flow velocity, (i.e., Badino, 1995, 2018):
where ρ is the air density and k is a constant that depends on the local cave geometry. As a first approximation, therefore, one might expect that:
Because of its dependence on external temperatures, convective air flow is expected to show seasonal variations. These are actually well known to speleologists that exploit this fact to guide their explorations. During the summer season, as in the present case, when the external temperature is on average warmer than that of the internal atmosphere, external air is expected to flow into the cave from its entrances placed at the highest heights and to exit from the lowest entrances. Obviously, daily variations due to atmospheric perturbation and drop of external temperatures are also possible. The Serpente entrance is the lowest known entrance of the Corchia underground system, so we would expect to observe different wind directions at the Serpente and Eolo entrances due to convection. This was not the case in our data (Figure 1). However, the cave has entrances that are placed at higher altitudes than the Eolo entrance and thus complex modes of air flow circulation, as far as wind direction is concerned, are possible.
In principle, to test whether convection could have forced air to flow through the two entrances of the Antro del Corchia cave, one might exploit the proportional relationship between v and discussed above and search within sampled data for possible correlations between these two variables.
Since the external temperatures were measured at 60 s intervals whereas wind velocities were measured at 5 s intervals, we first resampled air speed data by averaging the 12 samples within each 1 min time interval. Plots of raw wind speed data vs. are shown in Figure 2 for both entrances. No clear-cut correlations between signals can be appreciated, but hints of a correlation between signal subsequences might be postulated from these plots. It is a well-known fact, however, that hidden trends in time series can provide misleading statistical evidence of a linear relationship between non-stationary variables (Wu et al., 2007). Thus, all-time series were de-trended using a moving average filter computed by averaging runs of 60 samples (i.e., a 1 h period) and no correlation between de-trended and wind speed signals could be observed (Figure 2).
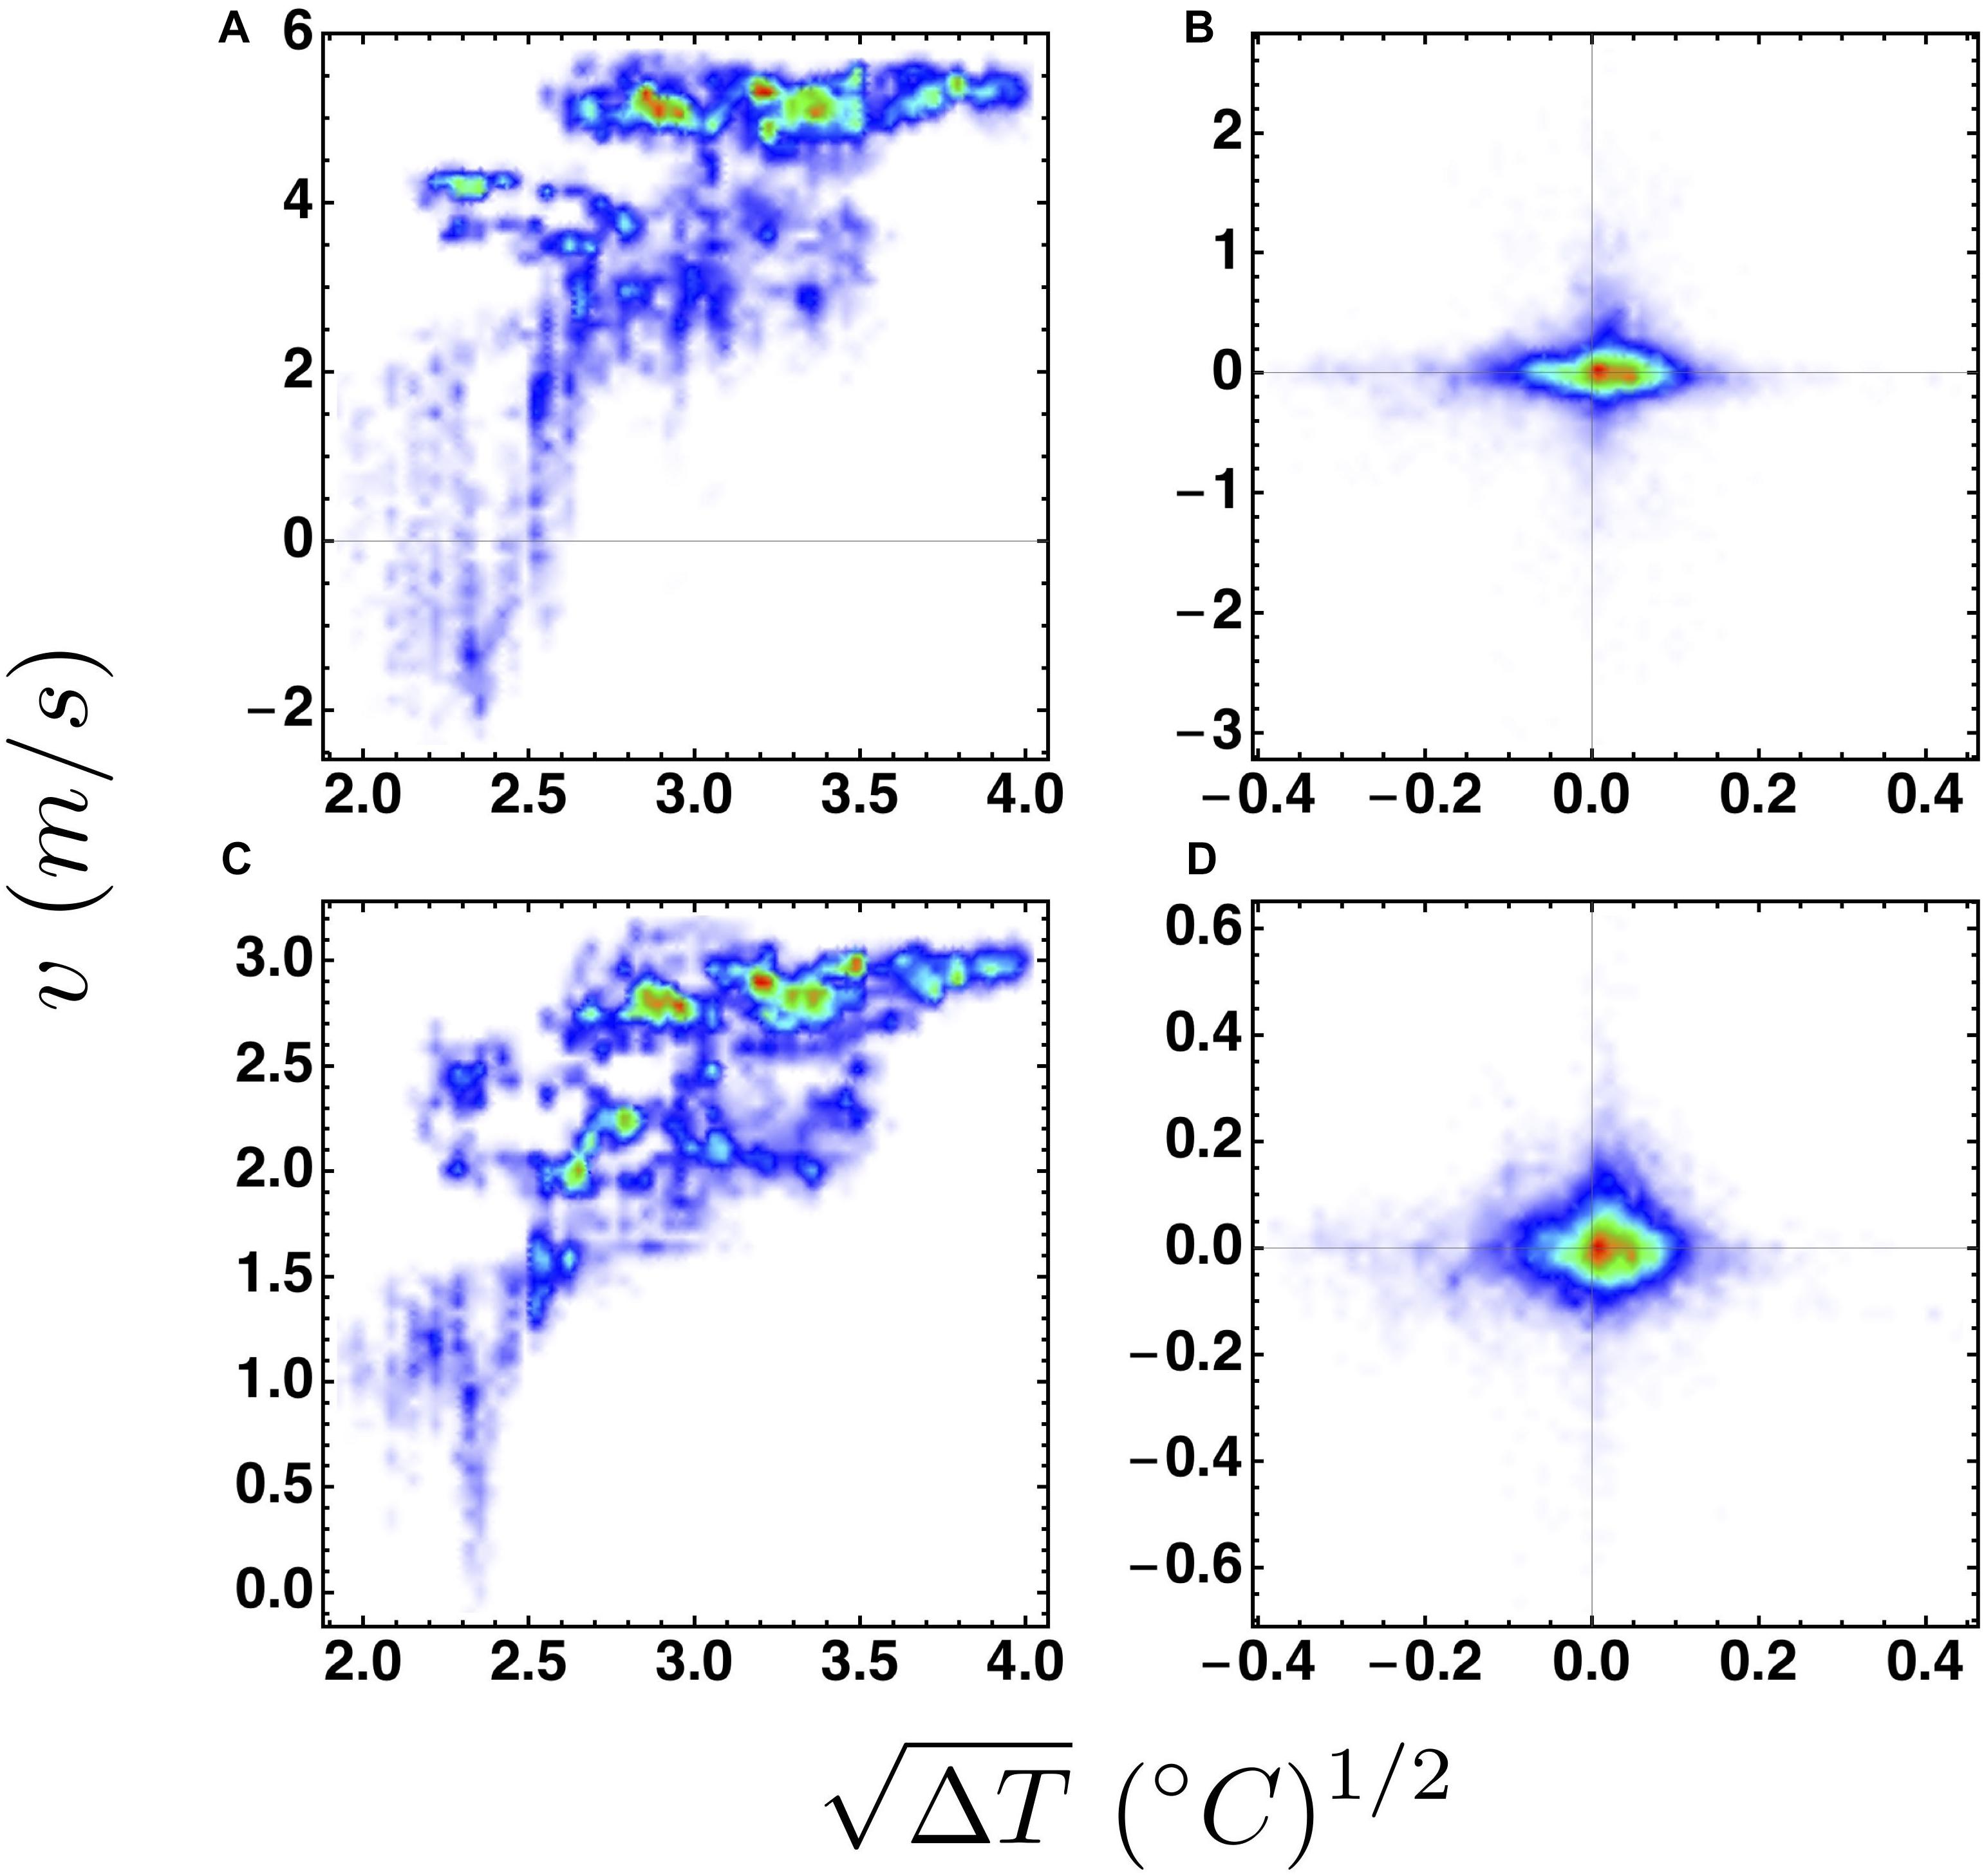
Figure 2. Correlation between wind speed data and temperature gradient. (A,C) Plots of raw wind speed vs. data recorded at the Eolo (A) and the Serpente (C) entrances. (B,D) Plots of de-trended wind speed vs. signals sampled at the Eolo (B) and the Serpente (D) entrances. De-trending was obtained using a moving average filter (see the main text for details).
We then reasoned that if the two variables were somehow correlated, then both wind speed time series should contain information at least of the daily oscillation of the external temperature, information that could be extracted by analyzing the frequency components of the signals. To this purpose we resorted to a spectral analysis of the de-trended signals. Figure 3 compares the power spectra of the signal to those of wind speed time series recorded at both entrances. The ∼24-h dominant periodic oscillation of external temperatures is evident in the signal. This oscillation is much less clear in the other two signals, whose spectra are characterized by higher frequency components that are not present in the signal. A ∼24-h periodic oscillation can nonetheless be appreciated above all in wind speed data recorded at the Serpente entrance. The richer dynamics observed for wind speed signals as compared to the signal, suggest that convection played a minor role in the cave air circulation, at least at the time scales of these data recordings.
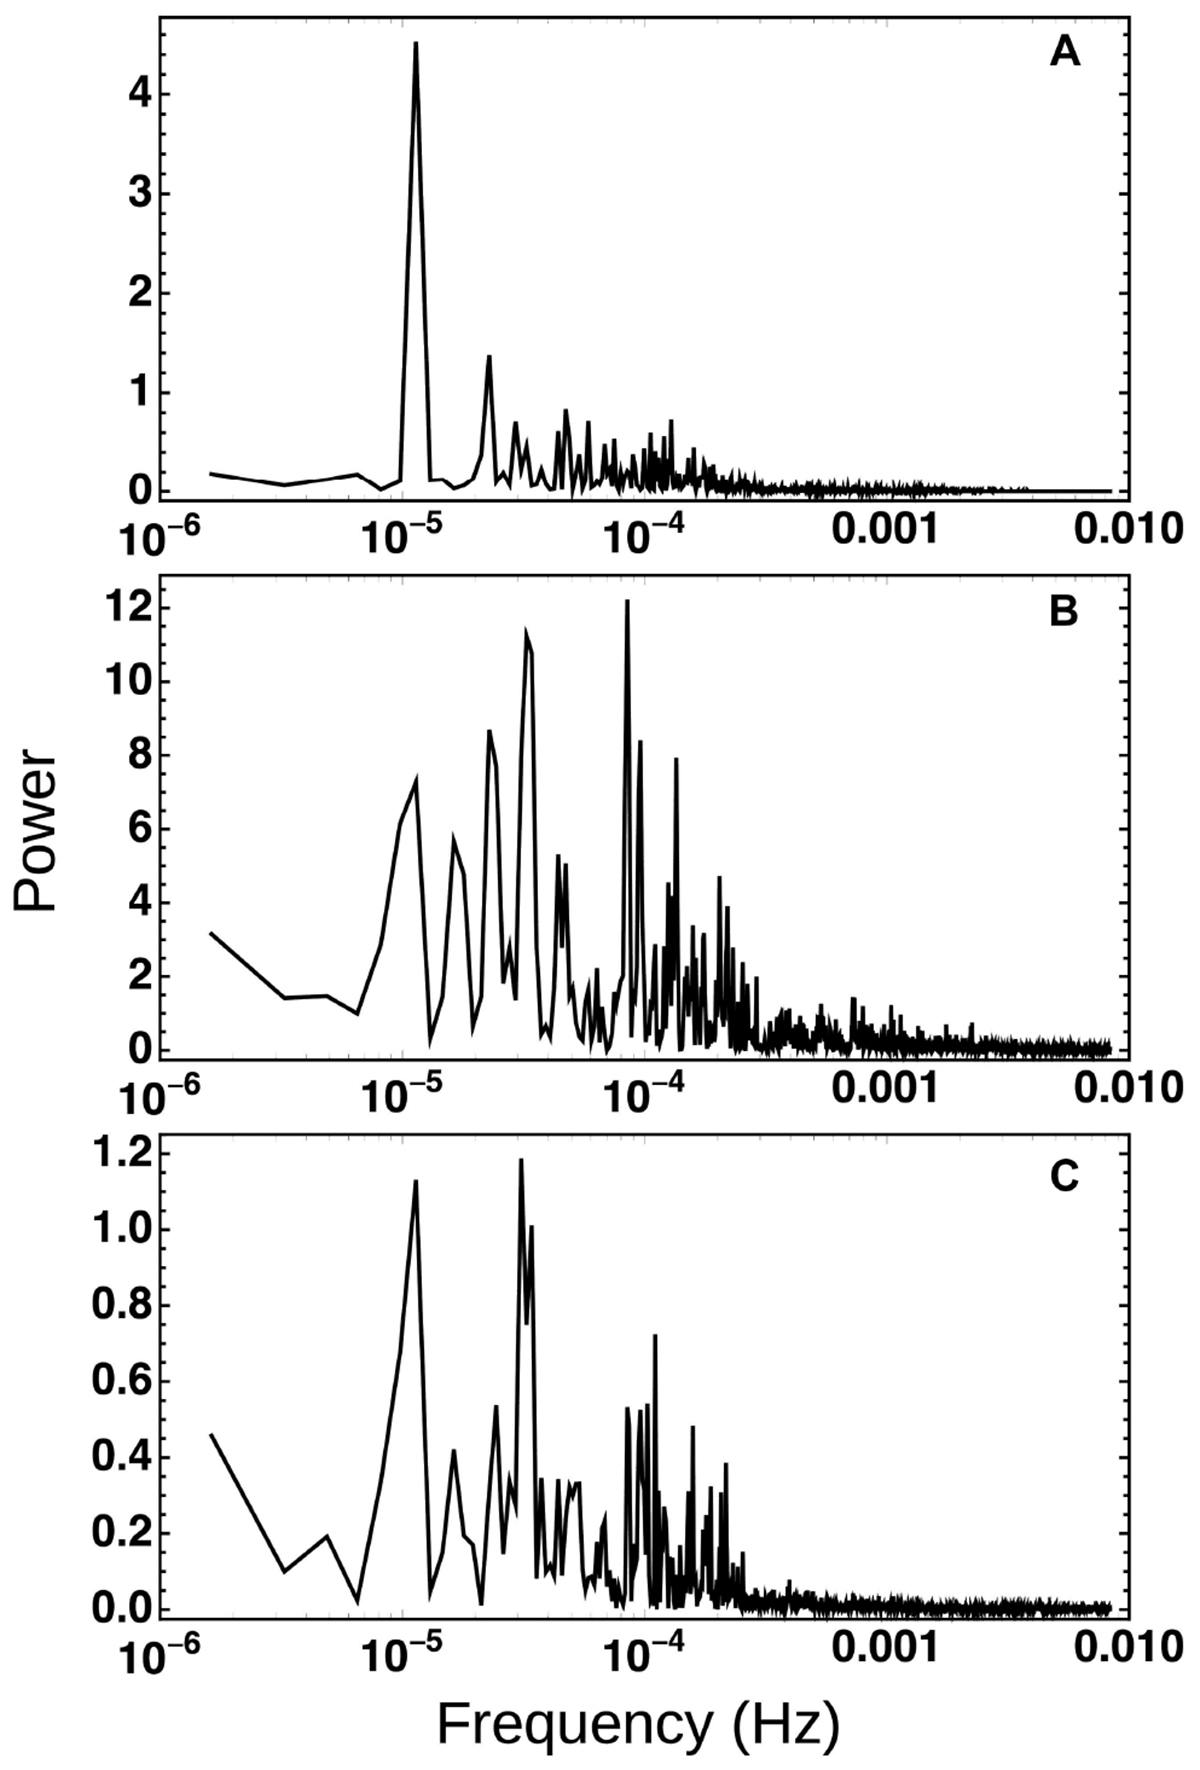
Figure 3. Spectral analysis of de-trended temperature gradient and wind speed signals. Signals were de-trended using a moving average filter (see the main text for details). The figure shows the periodograms computed for signal (A) and wind speed signals recorded at the Eolo (B), or at the Serpente (C) entrances.
Barometric Air Flow
Pressure gradients can play a key role in forcing underground air to flow through the caves’ entrances. The underground atmosphere is connected to the external atmosphere, after all, and thus it must somehow sense and react to variations of the external pressure. The underground atmosphere is confined within closed spaces of various morphologies, like huge chambers, galleries, wells, narrow conduits, and so forth, that influence the movement of air masses and thus the dynamics of underground winds. These winds, therefore, must contain information on the caves’ shape, as well as the sound which carries information on the structure of the musical instrument that has produced it. The external pressure is the input signal that forces the cave system to output winds. Thus, the caves’ response could be identified through the deconvolution of output wind speed and input pressure signals. Since the two entrances where wind speed was measured are connected to the same system we expected to find the same system response after deconvolution analyses.
We used the discrete Fourier transform algorithm to compute the deconvolution in the frequency domain. Figure 4 shows the power spectra of the signals resulting from the deconvolution of wind speed measured at the Eolo and at the Serpente entrances with the external pressure. The baseline of both spectra in Figure 4 is flat and close to zero showing that the system’s response signal is stationary and indicative that the noisy component of the wind speed signals is indeed related to the fluctuations of the external pressure. Both power spectra in Figure 4 show peaks at common frequencies, as expected for entrances connected to the same underground system. Two peaks below 1 mHz, that were evident in the system’s response computed at Eolo, were only vaguely visible in the same response when computed at the Serpente entrance (Figure 4). In general, the amplitude of the peaks recovered at the Serpente entrance was lower than that of the peaks found at the Eolo entrance. As already discussed above, to date, the Serpente is the only known entrance of the cave that is placed at the lowest height, giving access to the system from its periphery through a narrow ∼40 m long conduit. On the contrary, the Eolo entrance is at the center of the underground system and almost directly connected to vast galleries. This might explain why information in the Serpente signal is somehow silenced and why the wind flowing through this entrance whispers.
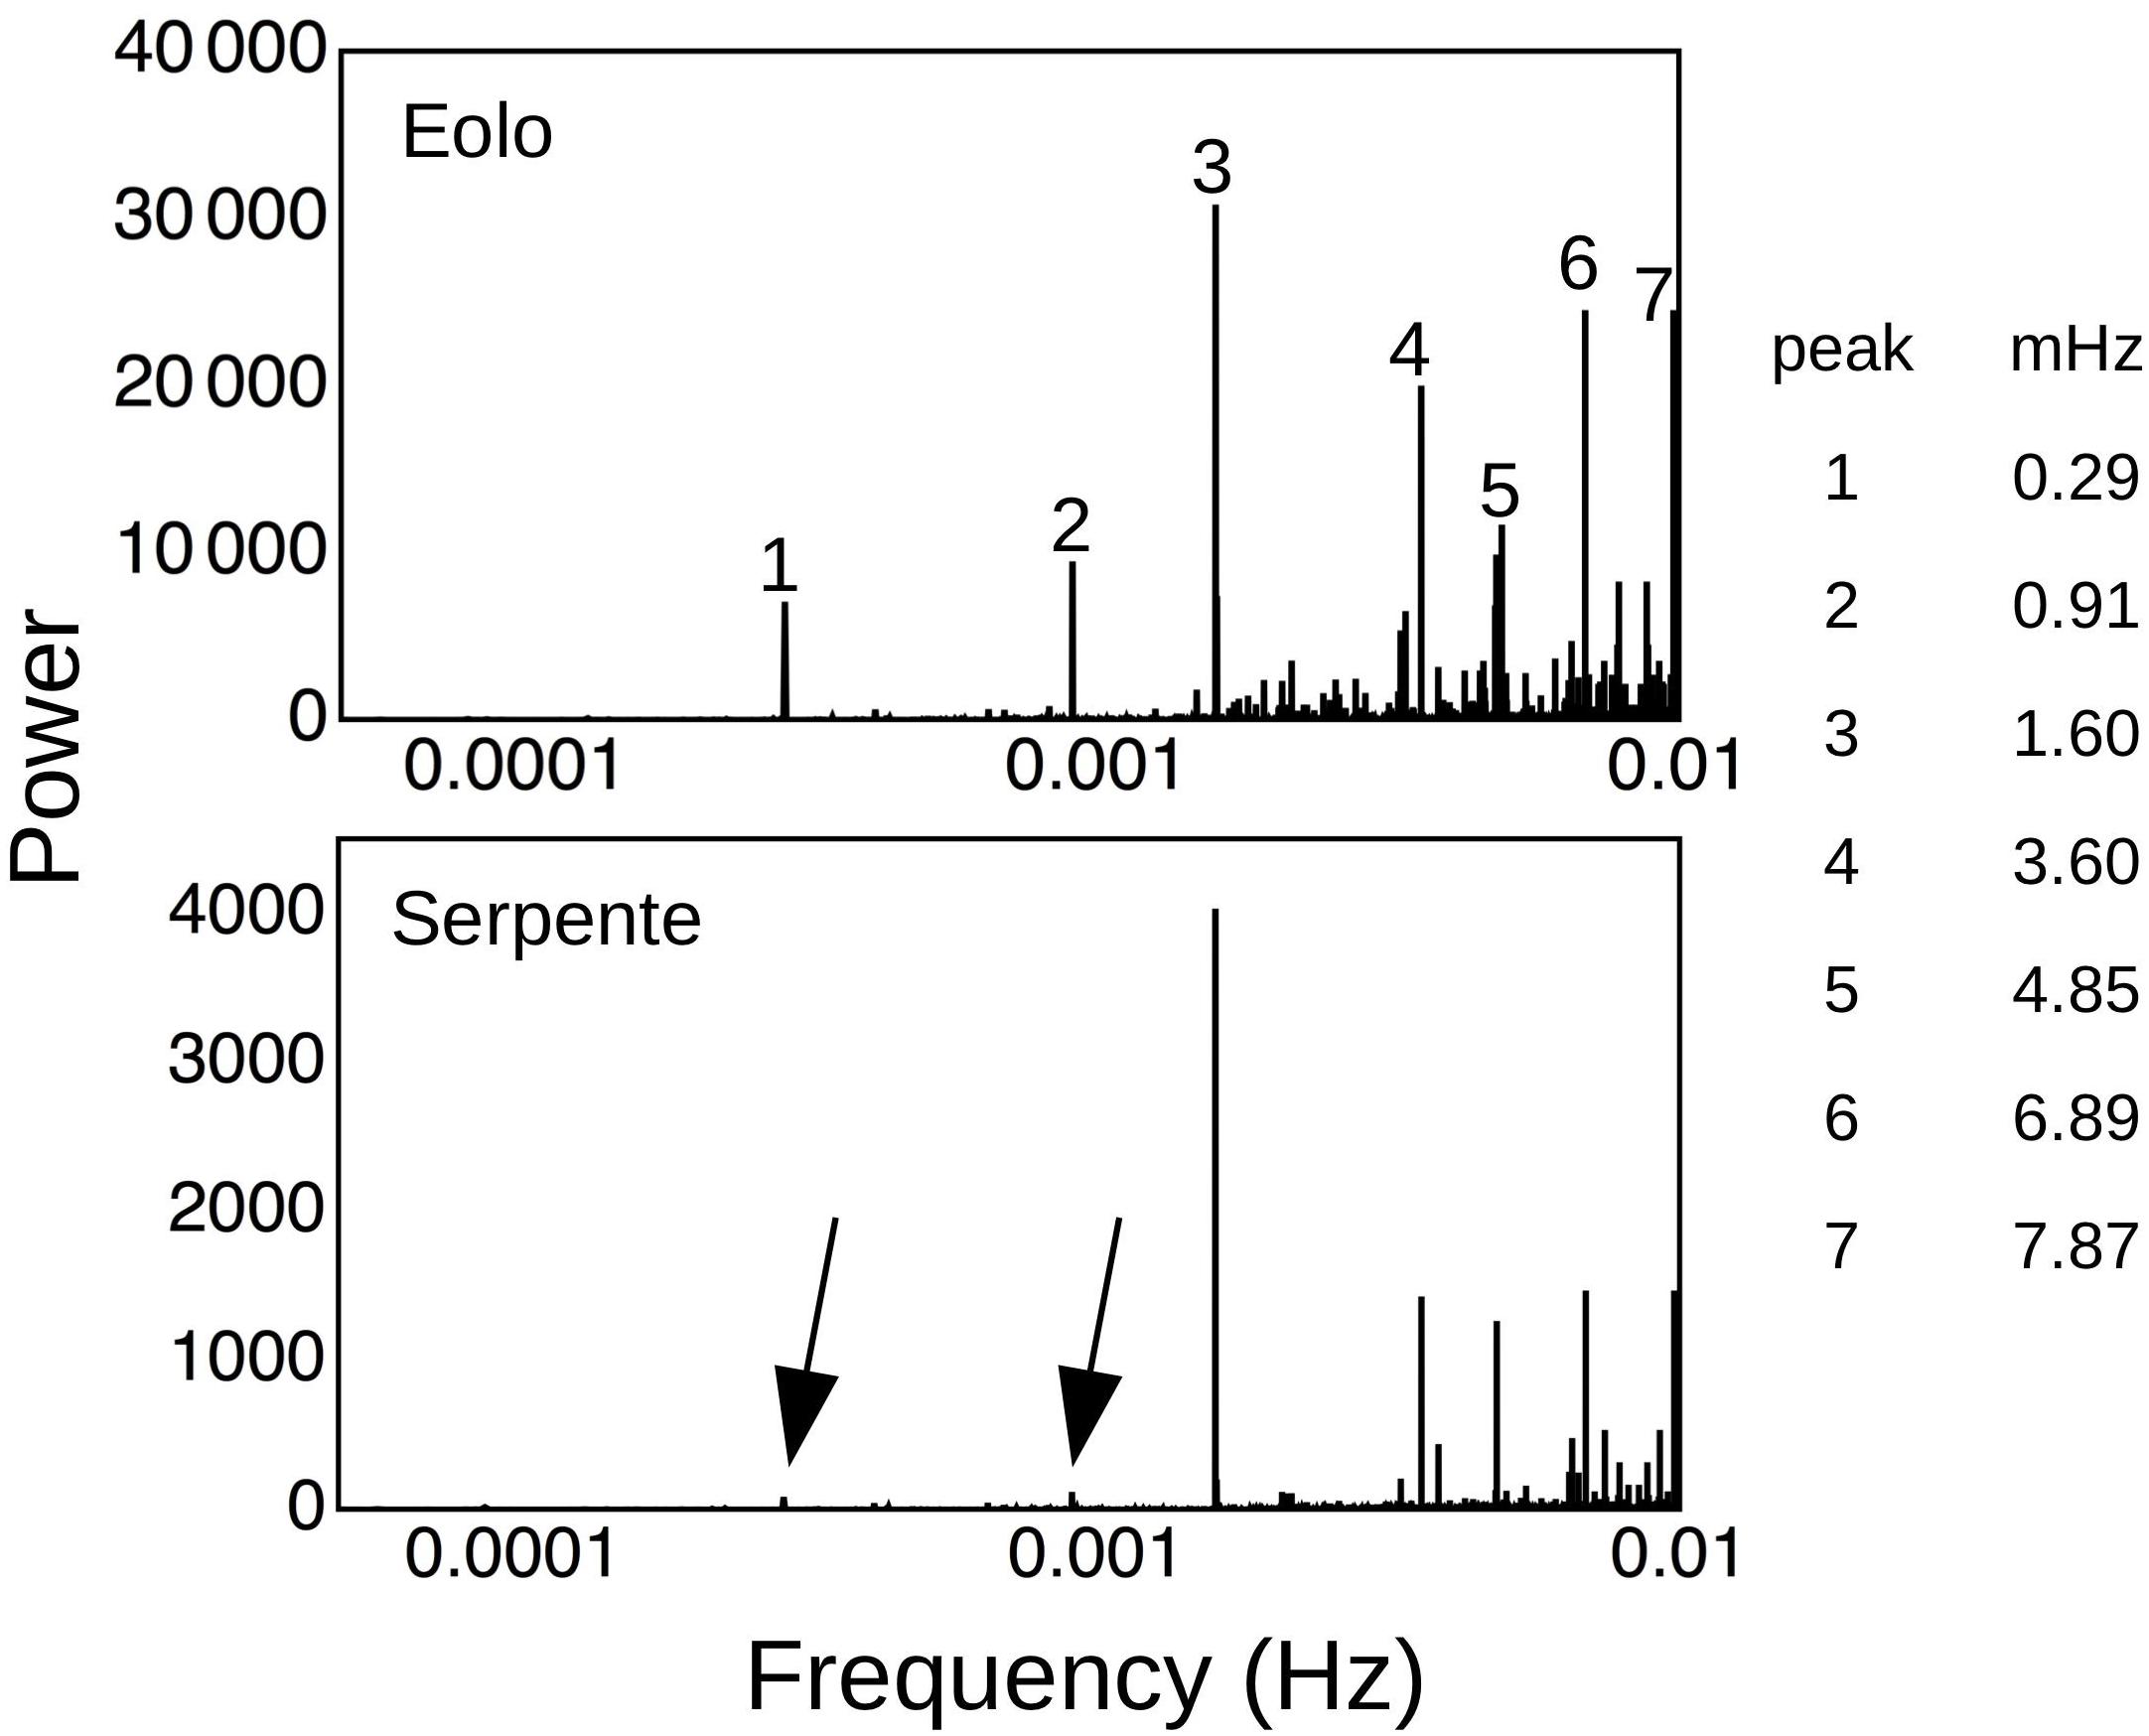
Figure 4. Spectral analysis of the system’s response. The response of the cave system has been estimated by deconvolution of wind speed signals recorded at the Eolo and Serpente entrances (considered as the system outputs) and the external pressure signals (considered as the system input). The analyses reveal common peaks. In the Serpente case, the two peaks at frequencies <1 mHz are only vaguely visible on this scale but are well above the baseline (arrows). Note that in both spectra the x axis has been interrupted at 0.05 mHz. At lower frequencies the spectrum is flat.
Conclusion
No comprehensive physical models of air circulation in vast underground systems have been developed so far, and this is in part due to the high complexity of the problem. Vast caves are not straight tubes but show intricate morphologies and are in general connected to the external side of the mountains through different entrances placed at different heights. Thus, underground air flow is likely to be characterized by turbulent chaotic motions, and to be influenced by complex non-linear interplays between temperature and pressure gradients among different parts of the system. In addition, measurements of air flow taken at the entrances of different underground systems are noisy and at first sight do not appear to contain regular and common patterns. We show here that synchronous and careful measurements of internal and external temperature, pressure and wind speed at two connected entrances of a cave can help in dissecting the main forces that drive underground air flow.
Barometric forces dominate convective forces and mainly affect wind signals, at least at the considered time scales of 1 week. This might not be true at longer scales. For example, the seasonal variations of air circulation in caves, that are well known to speleologists, are likely to depend on the temperature gradients between the internal and external atmosphere (Badino, 2004, 2005). Wind signals, in turn, contain information on the cave’s response to external pressure fluctuations, information that can be extracted using standard signal processing techniques under the form of infrasonic resonances. It is therefore tempting to approximate the cave to a Helmholtz resonator whose characteristic frequency is given by the following equation:
where f is the frequency (Hz), vs is sound speed in air (∼340 m/s), A and L are the cross-sectional areas (m2) and the length (m) of the neck and V (m3) is the volume of the resonator. The Serpente entrance provides access to large galleries through an almost regular tube whose dimensions are A∼1 m2 and L∼40 m. If we consider this path as the neck of a natural Helmholtz resonator, and if we take the frequency of the major peak in both the Eolo and the Serpente signals (peak 3, Figure 4), then f ∼1.6 mHz, and thus V∼1.8 × 10⁸ m3. The Corchia underground system is a network which develops within a block of marble and limestone ∼2 km wide, ∼1 km large and ∼1.6 km high (Piccini, 2011), and whose volume is therefore ∼3.2 × 10⁹ m3. Thus, based on infrasonic analysis the underground system would theoretically extend through ∼5.6% of the mountain. The known part of the cave is ∼64 km long, and its galleries and wells are, on average, ∼20 m wide and ∼50 m high. Overall the volume of the known parts of the underground system would approximately be 6.4 × 10⁷ m3, a value that corresponds to ∼36% of the predicted volume of the cave. More than 64% of the cave is likely to be unknown as local geologists and speleologists believe, and most probably dream.
Overall, our analyses show that caves are the biggest natural wind instruments on Earth.
Author’s Note
Giovani Badino passed away on August 8, 2017 while we were preparing the draft of this paper. He collected all the data shown here and many more during lonely intense measuring campaigns. He was an expert speleologist, a passionate explorer, an excellent scientist with solid, and vast roots in humanities. He was a very good friend.
Data Availability
The data supporting the conclusions of this manuscript will be made available by the authors, without undue reservation, to any qualified researcher. A substantial part of the data is, nonetheless, provided as Supplementary Material.
Author Contributions
GB contributed to the conception and design of the study, recording the measurements, organizing the database, and writing the first draft of the manuscript. RC performed the analyses and wrote the manuscript.
Funding
This work was supported in part by grants from the Associazione Gruppi Speleologici Piemontesi.
Conflict of Interest Statement
The authors declare that the research was conducted in the absence of any commercial or financial relationships that could be construed as a potential conflict of interest.
Supplementary Material
The Supplementary Material for this article can be found online at: https://www.frontiersin.org/articles/10.3389/feart.2019.00147/full#supplementary-material
References
Badino, G. (1995). Fisica del Clima Sotterraneo, Memorie dell’Ist. Bologna: Italiano di Speleologia.
Badino, G. (2018). Models of temperature, entropy production and convective airflow in caves. Geol. Soc. 466, 359–379. doi: 10.1144/sp466.24
Cigna, A. A. (1968). An analytical study of air circulation in caves. Int. J. Speleol. 3, 41–54. doi: 10.5038/1827-806x.3.1.3
De Freitas, C. R., Littlbjohn, R. N., Clarkson, T. S., and Kristament, I. S. (2006). Cave climate: assessment of airflow and ventilation. Int. J. Climatol. 2, 383–397. doi: 10.1002/joc.3370020408
Faimon, J., Troppova, D., Baldik, V., and Novotny, R. (2012). Air circulation and its impact on microclimatic variables in the Cisařska Cave (Moravian karst, Czech Republic). Int. J. Climatol. 32, 599–623. doi: 10.1002/joc.2298
Lismonde, B. (2002). Aèrologie des Systèmes Karstiques. in Climatologie du Monde Souterrain T 2. Grenoble: Comité Départemental de Spéléologie Isère, 1–362.
Luetscher, M., Jeannin, P. Y., and Haeberli, W. (2005). Ice caves as an indicator of winter climate evolution: a case study from the Jura Mountains. Holocene 15, 982–993. doi: 10.1191/0959683605hl872ra
Piccini, L. (2011). Speleogenesis in highly geodynamic contextx: he quaternary evolution pf Monte Corchia multi-level karst system (Alpi Apuane, Italy). Geomorphology 134, 49–61. doi: 10.1016/j.geomorph.2011.06.005
Plummer, W. T. (1969). Infrasonic resonances in natural underground cavities. J. Acoust. Soc. Am. 46, 1074–1080. doi: 10.1121/1.1911823
Keywords: cave winds, sonic anemometry, underground meteorology, signal processing, cave systems, Antro del Corchia
Citation: Badino G and Chignola R (2019) Fluctuations of Atmospheric Pressure and the Sound of Underground Karst Systems: The Antro del Corchia Case (Apuane Alps, Italy). Front. Earth Sci. 7:147. doi: 10.3389/feart.2019.00147
Received: 27 February 2019; Accepted: 24 May 2019;
Published: 11 June 2019.
Edited by:
Raquel Nieto, University of Vigo, SpainReviewed by:
Zhao Li, The Hong Kong Polytechnic University, Hong KongPenka Vlaykova Maglova Stoeva, Space Research and Technology Institute (BAS), Bulgaria
Copyright © 2019 Badino and Chignola. This is an open-access article distributed under the terms of the Creative Commons Attribution License (CC BY). The use, distribution or reproduction in other forums is permitted, provided the original author(s) and the copyright owner(s) are credited and that the original publication in this journal is cited, in accordance with accepted academic practice. No use, distribution or reproduction is permitted which does not comply with these terms.
*Correspondence: Roberto Chignola, roberto.chignola@univr.it
†Deceased