Orogenic Collapse and Stress Adjustments Revealed by an Intense Seismic Swarm Following the 2015 Gorkha Earthquake in Nepal
 Lok Bijaya Adhikari1,2*
  Laurent Bollinger3
  Jérôme Vergne4 Sophie Lambotte4 Kristel Chanard2 Marine Laporte3 Lily Li5 Bharat P. Koirala1 Mukunda Bhattarai1
  Chintan Timsina1 Nabina Bishwokarma1 Nicolas Wendling-Vazquez3 Frédéric Girault2 Frédéric Perrier2
- 1Department of Mines and Geology, National Earthquake Monitoring and Research Center, Kathmandu, Nepal
- 2Université de Paris, Institut de Physique du Globe de Paris, CNRS, IGN, Paris, France
- 3CEA, DAM, DIF, Bruyères-le-Châtel, France
- 4Institut Terre et Environnement de Strasbourg, CNRS, Université de Strasbourg, Strasbourg, France
- 5Beijing National Earth Observatory, Institute of Geophysics, China Earthquake Administration, Beijing, China
The April 25, 2015 Mw 7.9 Gorkha earthquake in Nepal was characterized by a peak slip of several meters and persisting aftershocks. We report here that, in addition, a dense seismic swarm initiated abruptly in August 2017 at the western edge of the afterslip region, below the high Himalchuli-Manaslu range culminating at 8156 m, a region seismically inactive during the past 35 years. Over 6500 events were recorded by the Nepal National Seismological Network with local magnitude ranging between 1.8 and 3.7 until November 2017. This swarm was reactivated between April and July 2018, with about 10 times less events than in 2017, and in 2019 with only sporadic events. The relocation of swarm earthquakes using proximal temporary stations ascertains a shallow depth of hypocenters between the surface and 20 km depth in the High Himalayan Crystalline slab. This swarm reveals an intriguing localized interplay between orogenic collapse and stress adjustments, involving possibly CO2-rich fluid migration, more likely post-seismic slip and seasonal enhancements.
Introduction
Crustal processes are particularly important to understand in the Himalayas, where the convergence between India and Eurasia plates is able to produce in the near future a megaquake expected to affect Nepal and Northern India, one of the most-densely populated area on Earth (e.g., Bilham, 2019). In the Himalayas, earthquakes also contribute to the orogenic growth, rise and support of the high topography, which results from the competition between geodynamical and climatic conditions at the geological timescale. The front of the high Himalayan range is located above the downdip-end of locked fault segments (e.g.,Avouac et al., 2001; Bollinger et al., 2004; Ader et al., 2012; Lindsey et al., 2018; Ingleby et al., 2020) of the shallow dipping Main Himalayan Thrust (MHT) fault system (Nabelek et al., 2009). These segments break during large and great earthquakes, leading instantly to the coseismic subsidence of the high mountain range. These episodes are followed by decades or centuries of postseismic and interseismic deformation during which the range locally rises, prior to the occurrence of another large earthquake. The strain and stress rates within the hanging wall of the MHT vary therefore significantly during the period separating two interseismic stages. This may impact the seismic behavior of faults located in the high range.
These processes could be studied in detail after the deadly Mw 7.9 2015 Gorkha earthquake in Nepal (e.g. Avouac et al., 2015; Galetzka et al., 2015; Grandin et al., 2015; Elliott et al., 2016). Indeed, this earthquake was the first large Himalayan earthquake with extensive instrumental coverage. Monitoring of deformation in Nepal and Tibet revealed the interplay between afterslip and viscoelastic relaxation (e.g., Gualandi et al., 2017; Zhao et al., 2017; Wang and Fialko, 2018; Jiang et al., 2019; Jouanne et al., 2019; Tian et al., 2020; Liu-Zeng et al., 2020). Aftershocks are being monitored by the 21-station National Earthquake Monitoring and Research Center (NEMRC) network (Adhikari et al., 2015), continuously in operation since 1994 (Pandey et al., 1995), and temporarily complemented by local and nearby networks (Bai et al., 2016; Mendoza et al., 2019; Yamada et al., 2020). These aftershocks, still active in 2020, are mostly located in the vicinity of the rupture zone in Central Nepal, between the epicenters of the main shock and of the May 12, 2015 shock (Adhikari et al., 2015; Baillard et al., 2017).
In addition to aftershocks, and to earthquakes resulting from interseismic stress buildup along the downdip end of the locked fault zone, the NSC network also recorded very rare transient seismic swarms (Hoste-Colomer et al., 2017). The study of these unusual swarms revealed stress triggering and/or fluid diffusion in the crust (Hoste-Colomer et al., 2017), mechanisms that were documented elsewhere thanks to robust earthquake catalogues (e.g., Hainzl, 2004; Kraft et al., 2006; Lohman and McGuire, 2007; Cappa et al., 2009; Duverger et al., 2015; De Barros et al., 2019).
In this paper, we report a new and peculiar feature of the seismicity after the Gorkha earthquake. An intense swarm developed suddenly in the summer of 2017 under the very high topography of the Manaslu-Himalchuli range, about 30 km North of the epicenter of Gorkha earthquake, outside of the aftershock zone (Figure 1), and in a region where no significant earthquake activity had been recorded since 1994 (Supplementary Figure 1) and where no large earthquake occurred since the 14th century. This swarm is the most intense swarm ever recorded in the whole Himalayan range. Using records from the NSC network, complemented by local temporary stations, we constrain the location of this seismicity. We then discuss our observations, their possible causes and their implications in term of regional geodynamical setting.
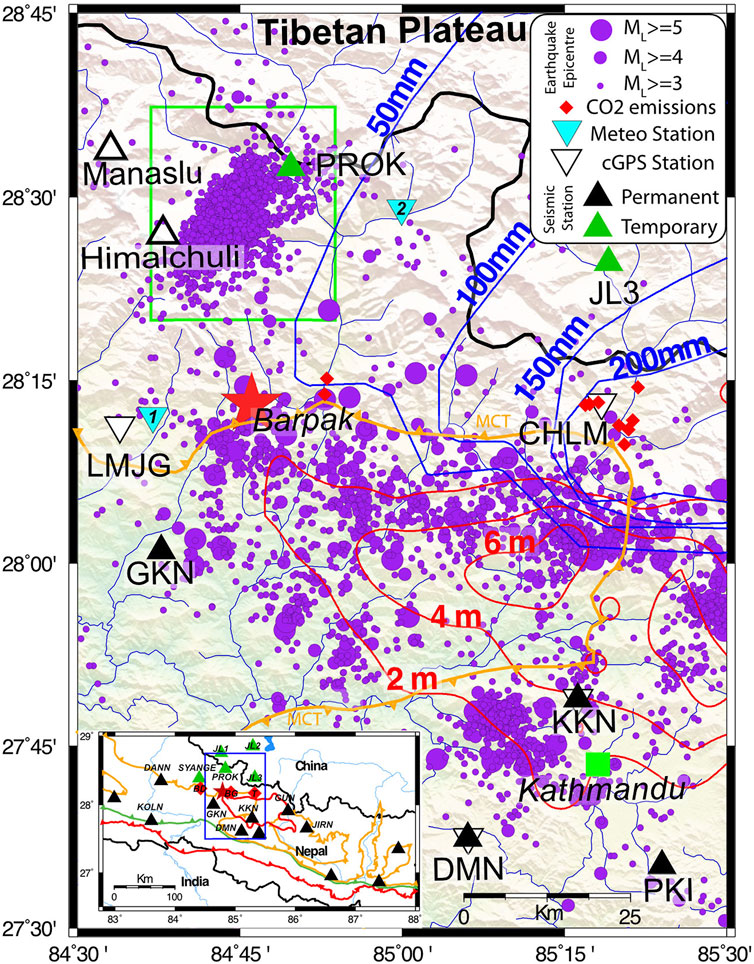
FIGURE 1. Seismicity after the Mw 7.8 Gorkha earthquake of April 25, 2015. Earthquakes with local magnitude ML ≥ 3.0 are recorded by the permanent NSC network (stations shown in inset) plotted in purple circles. Red star represents the Gorkha mainshock. Green triangles represent the temporary seismic stations installed following the activation of Himalchuli swarm. Light blue triangles represent the meteorological stations (numbers 1 and 2 respectively for Gharedhunga and Chhekampar). Red contours correspond to coseismic slip (Grandin et al., 2015). Blue contours correspond to post-seismic slip deduced from cGPS stations (Zhao et al., 2017). At a larger spatial scale, the inset presents the seismic stations (black triangle), and three CO2 emission sites (red diamond), where BD, BG, and T stand for Bahundanda, Budhi Gandaki, and Trisuli sites, respectively.
Events and Data
The Mw 7.9 Gorkha earthquake, which struck Central Nepal on April 25, 2015 at 11:56 local time, ruptured a 140 km-long and-50 km-wide patch of the MHT. The main shock, which accommodated several meters of coseismic slip (e.g., Avouac et al., 2015; Grandin et al., 2015; Elliott et al., 2016), was immediately followed by an intense seismic activity, mainly located at the periphery of the rupture (Figure 1).
These aftershocks of the Gorkha earthquake were continuously recorded by the NSC network which consists in 17 short period (1 s) vertical component stations (ZM500) and 4 broad-band stations (0.1–120 s) operated since 1994 by the Department of Mines and Geology (DMG) in collaboration with the Département Analyse Surveillance Environnement (DASE, France). The instruments cover the whole Nepalese territory, but lie primarily at the front of the High Himalayan range (Figure 1). The seismic signals captured at these stations are telemetered in real time to the seismological centers located in Kathmandu (Central Nepal) and in Surkhet (Western Nepal).
In total, over 43,000 earthquakes were recorded in Nepal between April 2015 and April 2020, among them over 31,000 aftershocks of the Gorkha earthquake. These events tend to be clustered and fall principally within a few kilometers from the edges of the fault plane that ruptured during the main shock, a region also associated with a centimetric afterslip (e.g., Mencin et al., 2016; Gualandi et al., 2017; Zhao et al., 2017; Jouanne et al., 2019; Liu-Zeng et al., 2020; Ingleby et al., 2020). In the meantime, larger afterslip happened North of the downdip end of the rupture. This reincreased the Coulomb stress by ≥0.05 MPa along 30% of the downdip end of the rupture during the first year of postseismic slip (Liu-Zeng et al., 2020).
Most of the seismic clusters persisted, but their activity decreased progressively during the 4 years following the main shock. However, a major exception to this behavior occurred 30 km North from the Gorkha mainshock epicenter (Figure 1), under the Himalchuli-Manaslu mountain range, where a large seismic swarm developed mainly in 2017, and repeated with lower intensity in 2018. This swarm occurred 45 km North of GKN, the closest station from the permanent network, in a region only reached after 5 days of walking. This region had been seismically inactive over the past 35 years (Supplementary Figure 1). No historical seismicity was reported either. The crisis began on August 7, 2017 with a sharp onset, the first event recorded being followed by 18 events within a day and more than 100 events within 3 days. The rate of earthquakes detected by the NSC network continued to increase until day 7 then stationed around 200 ± 50/day from the next day onwards (Figure 2 and Supplementary Figure 2). The local magnitude of the events, deduced from the maximum amplitude of the (Sn, Sg, Lg) (See Adhikari et al., 2015), peaked several times between local magnitude ML 3.6 and 3.7 (reached by an event on 27/08/2017). The b-value, calculated using the maximum likelihood method, remained higher than 4 (Figure 2), a value totally different from the average b-value around 0.8 determined elsewhere along strike (Pandey et al., 1999; Adhikari et al., 2015).
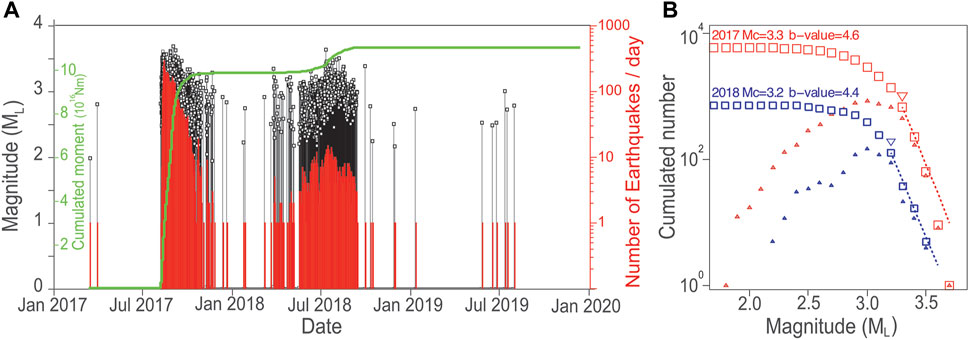
FIGURE 2. Seismicity in the region affected by the swarm (source: NSC catalogue). (A) Magnitude versus time (in black). In red, the number of recorded earthquakes per day versus time. In green, cumulated seismic moment released by the earthquakes. (B) Cumulated number of events versus local magnitude in 2017 (in red) and in 2018 (in blue). Triangles and squares correspond to the number of events and to the cumulated number of events above a given magnitude, respectively.
Since the hypocentral depths and location of the events remained associated with large uncertainties, mainly due to the poor azimuthal coverage and relatively large distances to the permanent seismic stations of the network, we installed temporary three component stations (KVS500 and Le3D5s respectively on a EDR-X7000 @50Hz and a Nanometrics -Taurus @ 100Hz) and an accelerometer (Güralp CMG5T on a Staneo digitizer) in a village named Prok (station codename PROK installed on August 21, 2017 for 7 days of acquisition, Figure 1) and later in fall in Syangje (stations codename SYNGE, inset of Figure 1), at kilometric distances from the swarm to the East and West (Figure 1). The local earthquakes were also recorded by three broadband stations, deployed northward on the Tibetan plateau by the Chinese Earthquake Administration (JL1-2-3, Figure 1) on September 2, 2017 and available until September 18, 2017. In 2018 and 2019, the seismicity was only monitored by the permanent stations of the national network.
Methods and Early Processing
Arrival times of (Pg, Pn) and (Sg, Sn) waves of the seismic events were picked manually by analysts at the NSC in Kathmandu. The maximum amplitude of (Sg, Sn) seismic phases was measured at stations on the 0.8–8.0 Hz band-pass filtered seismic signals to compute local magnitude (ML) of the seismic events (Adhikari et al., 2015). A 1D/3 layers velocity model is used (Pandey, 1985), with P and S wave velocities of 5.56, 6.50, 8.10 and 3.18, 3.71, 4.63 km s−1, respectively, with depth interfaces at 23 and 55 km for the Moho discontinuity.
In total, NSC analysts manually picked 74,759 phases, mainly Pg and Sg, locating a total of 6,756 earthquakes in the swarm from August 7, 2017 to September 13, 2019 with ML ranging from 1.8 to 3.7 in the region of interest (from 28.35° to 28.60°N latitude and from 84.55° to 84.90°E longitude). Preliminary discrete fixed depth values (2, 6, 10, 15, 20, and 25 km) are attributed to the events by this processing, minimizing the time residuals. The earthquakes epicenters resulting from this first step of processing are spread over a 25 x 15 km2 SW-NE area. The events that occurred in 2018 and 2019 are centered on the 2017 seismicity spread (Figure 3A and Supplementary Figure 3). The hypocentral depths range from 0 to 30 km. No clear spatial organization emerged at this stage; the swarm appears as an apparent seismicity spread oriented along an axis perpendicular to the orientation of the permanent network.
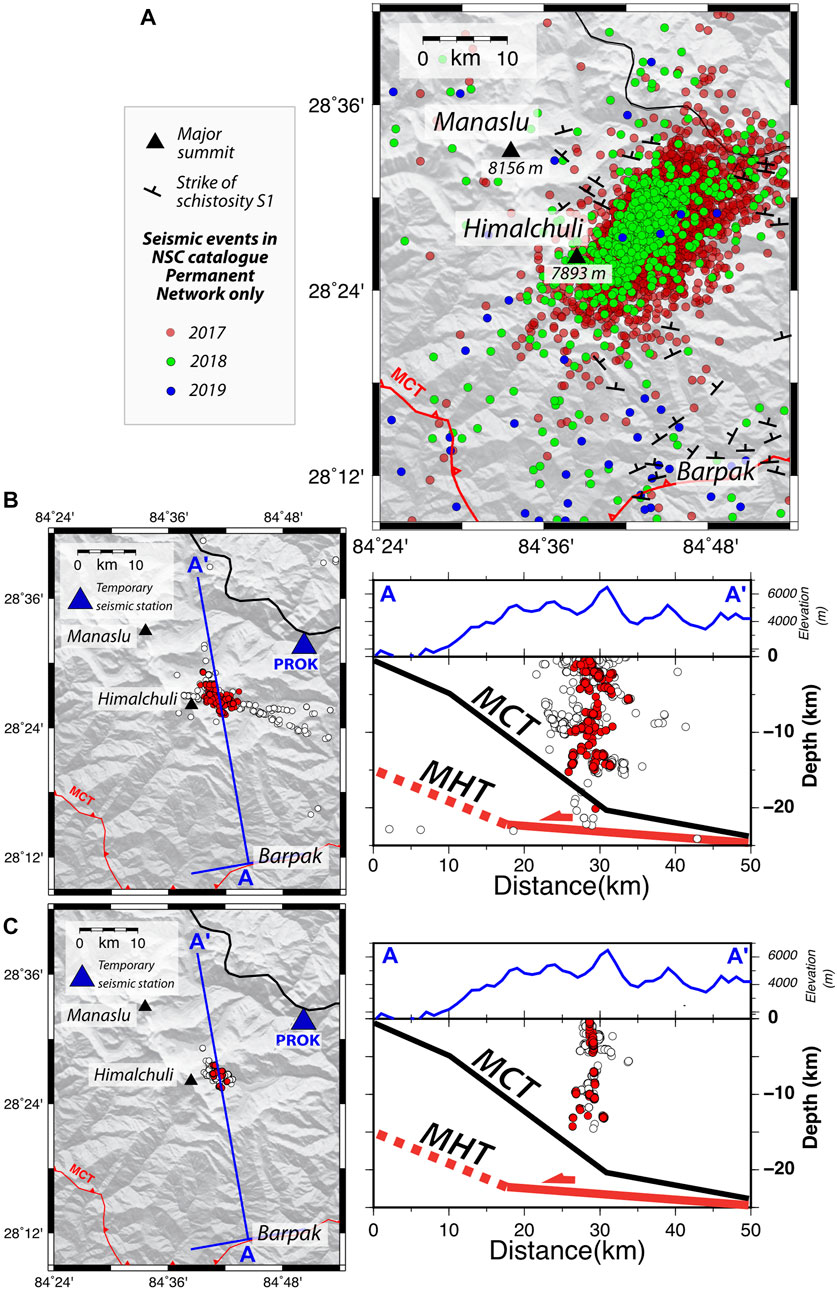
FIGURE 3. (A) Seismicity recorded by the permanent NSC network. Red, green, and blue circles correspond to events recorded in 2017, 2018, and 2019, respectively. The red contour corresponds to the surface trace of MCT. (B) Map and cross section through the seismic events detected using template matching and relocated including at least one temporary station (PROK or JL). Open circles show all the events located with Hypo71; red circles show the events located with at least 9 phases. (C) Map and cross section through the best events relocated using HypoDD.
The events that were also captured by the temporary stations were then relocated in order to better determine the true shape of the seismicity cluster (Figure 3B). For that purpose, we refined the catalogue of phase picks on the temporary stations using EQcorrscan, a matched filter and subspace detection package (Chamberlain et al., 2017). After an examination of the signals, seven and five templates were selected at PROK and JL, respectively. The templates span the variety of signals acquired and could mostly correspond to events at various depths. This approach allowed detecting 1800 almost repeating earthquakes within 8 days at PROK, and 1217 within 16 days at JL. These earthquakes include all events picked at NSC at the permanent stations. The additional events represent an increase of 67 % of the database for the considered days. The hypocentral locations of the events detected by template matching were determined with Hypo71 using the NSC velocity model (Pandey, 1985), integrating the phase arrival time deduced from template matching and the phases initially picked by the analysts. Among these events, 1532 were located with more than nine picks, including at least one temporary station (Figure 3B and Supplementary Table 1). These template matched events were then relocated using a double-difference scheme under HypoDD (Waldhauser and Ellsworth, 2000), requiring a cross correlation coefficient of the signals at 0.8 (Figure 3C and Supplementary Figures 4, 5).
Synthetic tests were then performed in order to determine the robustness of the hypocentral locations and the influence of the biases induced by the network geometries. For that purpose, we generated synthetic catalogues of earthquakes taking into account the average time and spatial uncertainties estimated from the events manually picked at NSC. The synthetic events were then relocated using a double-difference scheme under HypoDD, considering the three seismic network geometries available during the seismic crisis (See Supplementary Figure 6 for full description and used parameters). The results of these synthetic tests are used to support our conclusions below.
Results: Spatio-Temporal Variations of the Himalchuli Swarm Seismicity
General Behavior of the Swarm
The first results from the data analysis reveal the peculiar behavior of the Himalchuli swarm, both persistent over weeks and with a possible strong seasonal modulation. With 6793 ML>1.8 events, this is the largest swarm ever recorded in the Himalayas. The onset of the seismicity in 2017 is sharp and not following at all the typical mainshock-aftershocks pattern.
Indeed, after a first ML 2.8 earthquake on August 7, 2017 at 00:29:21 UTC, the swarm expanded quickly over a surface similar to the final extension of its overall seismicity. The beginning of this seismic sequence do not coincide with the occurrence of a large earthquake at regional or teleseismic distance. We found therefore no candidate for a dynamic triggering by long-period surface waves, a phenomenon described further west in Kumaon-Garhwal Himalaya, with local microearthquake activity triggered by the surface waves of the 2007 Mw 8.5 earthquake (Mendoza et al., 2016). The number of events per day increased from 1 to 294 in 7 days, contributing then to a dense seismic activity near the barycenter of the swarm (Figure 2 and Supplementary Figures 2, 3). The rate of earthquakes decreased more progressively than it rose until early September 2017. A few additional earthquakes occurred from 16 September to November 2017 (Figure 2 and Supplementary Figure 2). The seismic activity rate reached a low level with 1 event every 10 days until March 2018 and the beginning of a new period of activity (Figure 2 and Supplementary Figure 2). The rate of earthquakes increased more progressively from the May 17, 2018, reaching a peak of activity on July 14, 2018, with 15 earthquakes that day. This episode was followed by a decrease of the seismicity that ended on September 12, 2018. Then, almost no earthquakes were detected until the summer 2019, when sporadic local earthquakes occurred (Figure 3A). The higher seismicity rates of the swarm during the summer for these three successive years cannot be attributed to a temporal decrease of the seismic noise. Indeed, the high frequency seismic noise at the NSC stations is higher in summer than in winter due to river and landslide activity (Burtin et al., 2009), leading to less event detection (Bollinger et al., 2007). The largest event, with ML 3.8, occurred on November 5, 2017.
The seismic moment released by the crisis was evaluated from the Mw converted from the ML of the earthquakes obtained at NSC, using the following relation (Ader et al., 2012): Mw=0.84ML+0.21. We obtained that the 5992 events recorded in 2017 progressively released 9.92 × 10¹⁶ Nm, the 759 events in 2018 released 1.19 × 10¹⁶ Nm, while 2019 events released only 5.13 × 10¹³ Nm. The total seismic moment released reached then 1.11 × 10¹⁷ Nm, a value equivalent to a single earthquake of Mw 5.3.
Earthquake Relocation and Geometry of the Swarm
The earthquake catalogues also show that the seismicity spreads within a single-continuous patch (Figures 1, 2, 3A). However, the genuine size and orientation of the spread are not sufficiently well constrained in the original NSC catalogue. Indeed, the addition of one or the other temporary stations (PRK, between the 21 and 28/08/2017 or JL, between the 02 and 18/09/2017), which efficiently closes the azimuthal detection gap, reshapes the cluster. The synthetic tests performed for every network geometry available during the seismic crisis help to quantify the hypocentral location biases (Supplementary Material “Synthetic tests” and Supplementary Figure 6). They demonstrate the robustness of the catalogue generated when the network was complemented by these temporary stations closing the azimuthal gap. This relocated catalogue, which contains only the 20% of best located earthquakes, is illustrated in Figure 3B.
The structure of the seismicity deduced from the relocated catalogues is significantly different from the original one (Figure 3A). The seismicity swarm does not spread over nor is elongated along a NE-SW axis, but is organized within a narrow (2–4 km-thick) steeply northward dipping, 7 × 15 km2 region located at the foot of the Himalchuli summit (Figure 3B). The difference observed in comparison with the original catalogue is expected, since the shape and width of the original seismicity spread were largely controlled by the network geometry (a result illustrated by synthetic catalogue testing described in Supplementary Material and Supplementary Figure 6). The difference is also not a bias related to the short period and limited number of events covered by the temporary stations. Indeed, the density map of events considered for the relocation shows similarities with the density map of all earthquakes happening in 2017 or 2018, the location and shape of the area of highest density remaining similar (Supplementary Figure 3). This suggests that the geometry described by a small number of well-relocated events may be representative of the overall distribution of the swarm. The events in 2018 and 2019 could also line up with the same inferred fault, no migration of the densest area of the seismicity or change of the shape of this region being detectable (Supplementary Figure 3). The depth of the relocated events ranges between 0 and 28 km, when considering all events, most of the best located events (95%) falling between 0 and 15 km. An average seismic slip of 2.85 cm on such a 7 × 15 km2 plane would have been enough to release the total seismic moment of the swarm (1.11×10¹⁷ Nm). However, the swarm geometry defined by the microseismicity remains associated with large uncertainties, while the kinematics on the fault remains uncharacterized, limiting the possibility for a convincing interpretation of this seismicity taken out of its geological or seismotectonic context. We therefore attempted at determining the focal mechanisms of the largest earthquakes of the seismic swarm in order to benefit from a fault plane orientation and slip vector. The attempts at waveform inversion at regional distances failed because all earthquakes are too small (below Mw 3) for being studied at KKN, the nearest permanent broadband station installed 90 km from the cluster. In parallel, we attempted at determining focal mechanisms with first motion polarities of the direct P-wave. For most of the largest earthquakes selected, the signals are not very impulsive and the polarities are difficult to ascertain. Furthermore, for all of them, the distribution of the polarities on the focal sphere is far from optimal, due to the large azimuthal gap, the range of hypocentral distances covered by the stations and the shallow depths of the earthquakes. The events of MLv 3.5 and 3.1 (resp. Mw 2.8 and 2.5) that occurred on August 26 and 29, 2017, respectively (and were recorded at PROK), are among the best recorded for determining a focal mechanism (see Supplementary Material). However, the result we obtained for the two are not consistent, precluding the validation or invalidation of some possible geometries based on the observed polarities (Supplementary Figure 7).
Structure of the Fault Plane Likely Activated by the Swarm
The updip-end, shallow trace, of the swarm defined by the best located earthquakes, recorded during the few days when the local station of PROK was available, falls precisely at the toe of Himalchuli Southeastern face, along a glacial valley. They did occur on a steep plane. The geological survey of the region by Colchen et al. (1986) revealed no active fault trace but a large slab of High Himalayan Crystalline (HHC) units, slightly dipping to the North. The slab is associated with almost East-West structural fabrics. The bedding of the local quartzite/gneisses, complemented by the bedding of the Lesser Himalayan unit southward, helped tying a local balanced cross-section (Figure 3A and Figure 4A). Most, if not all, of the seismic swarm develops through the Formations I and II of the HHC, above a change of dip of the units in the hanging-walls of the Main Central Thrust (MCT) and MHT fault systems (Figure 4A). A structure activated with the same orientation as the main structural fabrics is likely, but the activation of a structure across the main fabrics remains possible. To our knowledge, the valley along the south-eastern slope of the Himalchuli was not the focus of any extensive tectonic survey, and its morpho-glacial activity probably precludes the preservation of the neotectonic landforms of active faults. Without an opportunity to survey the area, we visually inspected the high resolution GoogleEarth™ and ArcGIS™ Wayback imagery of the world images available in the vicinity of the seismic swarm before and after the Gorkha earthquake and the first swarm sequence (Supplementary section Imagery and Supplementary Figure 8). We checked in particular possible ∼NS and NE-SW structures consistent with the orientation of the closest active normal faults, mapped 60 km to the North-East in Gyirong graben (Armijo et al., 1986). This examination confirmed the main East-West orientation of the rocks bedding, schistosity and/or structural fabrics (Supplementary Figure 8), but was not relevant to identify any active fault trace in the area, along or across fabrics within that area, highly covered by snow and ice.
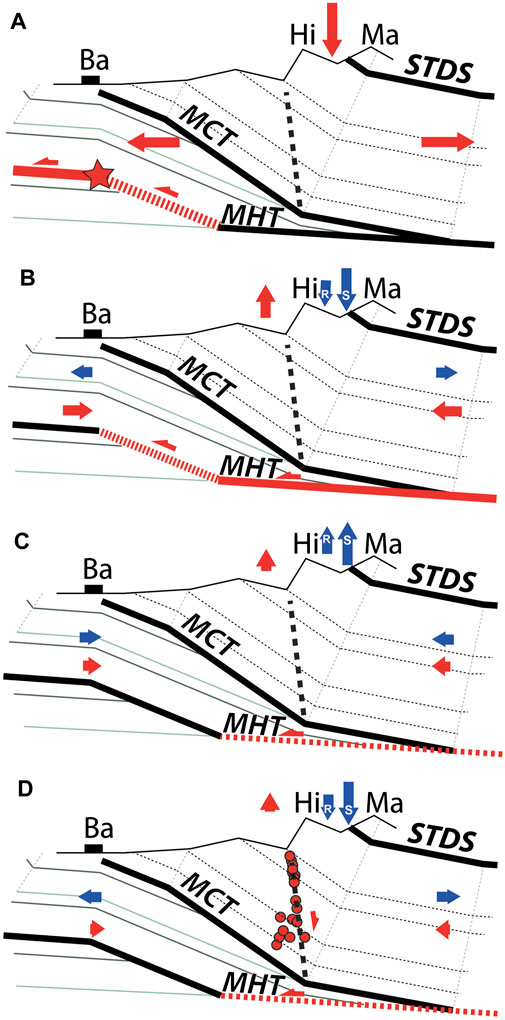
FIGURE 4. Conceptual model of the transient and seasonal straining and the seismic swarm (see text). Geological section is deduced from field mapping (Colchen et al., 1986). Ba, Hi, and Ma stand for Barpak, Himalchuli, and Manaslu, respectively. MHT, MCT, and STDS stand for Main Himalayan Thrust, Main Central Thrust, and Southern Tibetan Detachment System, respectively. The bold dashed line corresponds to the fault activated during the seismic crisis. The red arrows are related to the effects of the tectonic forcing. The blue arrows are related to the effects of the hydrological surface loads, R for Regional, S for local Snow load. (A) April 25, 2015. Coseismic damage, following the rupture of the upper decollement of the MHT in red, generates localized extension and subsidence of the High range. (B) Summer 2015. Afterslip associated with immediate fault clamping. (C) Fall-Winter 2016. Seasonal fault clamping resulting from tectonics, regional and local straining. (D) August 2017. Orogenic collapse and/or fluid/gas migration associated with seasonal extension related to regional seasonal straining and local snow loading. Hypocenters from relocated earthquakes are shown as red circles (plotted in Figure 3C).
Discussion
Relations With the Gorkha Earthquake Rupture and Afterslip
This shallow seismicity swarm of more than 6500 earthquakes with ML>1.8 located at the foot of the High Himalayan range is unusual, falling in a region where swarms had never been recorded since 1994. The clustered seismicity, however, developed 30 km North of the 2015 Mw 7.9 Gorkha earthquake epicenter in a region prone, since the main shock, to large variations of strain and stresses. We found no evidence of dynamic triggering, founding no large earthquake possibly associated with the onset of the swarm.
The earthquake ruptured a 140 × 50 km2 locked fault patch to the South-East which was responsible for the subsidence of the high Himalayan range (e.g., Avouac et al., 2015; Grandin et al., 2015; Figure 4A). This subsidence locally exceeded 1 m. Despite lower values in the Himalchuli area, the coseismic strain and stress changes applied to the geological medium were likely significant (Figure 4A). Indeed, the peak of coseismic slip on the MHT was observed 80 km to the southeast of the study area, exceeding 5 m (e.g., Avouac et al., 2015; Grandin et al., 2015). A displacement of 1–2 m at depth is also estimated on the fault segments 10–20 km to the South of the Himalchuli. The discrepancy between the source models and the relatively low resolution of the slip accommodated at depth on the midcrustal ramp of the MHT, precludes any precise estimate of the stress buildup at short distances. Nevertheless, the whole hanging wall of the MHT was necessarily considerably affected by the main shock in this region of high slip gradients and localized extension (Figure 4A). The earthquake was immediately followed by deep afterslip, poroelastic rebound and viscous relaxation (Figure 4B) (e.g., Gualandi et al., 2017; Zhao et al., 2017; Wang and Fialko, 2018; Jiang et al., 2019; Jouanne et al., 2019; Tian et al., 2020; Liu-Zeng et al., 2020). The deep afterslip, within the 3 months following the mainshock, exceeded 1 cm and reached locally as much as 5 cm after a year, a value which corresponds to 2.5 years of interseismic loading (Gualandi et al., 2017; Zhao et al., 2017; Ingleby et al., 2020; Liu-Zeng et al., 2020; Tian et al., 2020).
Knowing the large postseismic relaxation and afterslip of the Gorkha earthquake, in the following, we discuss different types of forcing that may modulate, induce or trigger the seismicity in the Himalchuli swarm and the mountain collapse including surface hydrological loading and fluid migration.
Effects of the Surface Hydrological Loads on the Fault
The strain and stress rates that resulted from the early postseismic behavior of the fault were significantly larger than those induced by surface hydrological loading of the Earth. However, these postseismic effects dampen with time as the tectonic system relaxes, becoming locally less influential on the strain and stress within the upper crust than the hydrological surface loading. Indeed, in the Himalayas, surface mass redistribution of continental hydrology induces measurable transient and seasonal deformation. Seasonal amplitudes of regional horizontal and vertical displacements, as recorded by cGPS stations located in the high range, reach a few mm to a few cm (Bettinelli et al., 2008; Chanard et al., 2014; Larochelle et al., 2018) (Figure 5). Seasonal hydrology not only induces seasonal strain but also seasonal stress variations at depth on the fault systems. These stress variations are suspected to be responsible for the seasonal modulation of the midcrustal seismicity along the MHT (Bollinger et al., 2007; Bettinelli et al., 2008; Ader and Avouac, 2013).
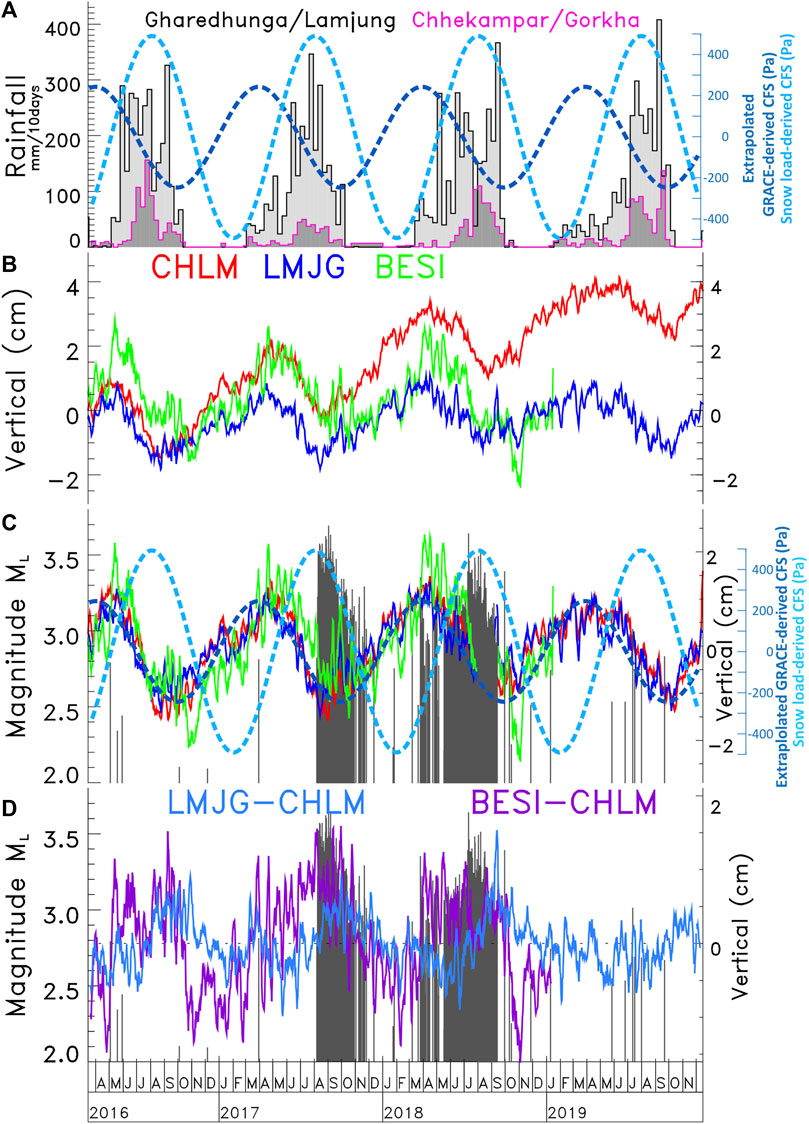
FIGURE 5. (A) Pink and black histograms represent the rainfall measured at two meteorological stations (Chhekampar and Gharedhunga located in Figure 1). The modulation of the Coulomb Failure Stress (CFS), related to the regional straining, is extrapolated from GRACE (dark blue), and that related to the local straining, is derived from local snow loads (light blue) (B) Vertical displacements measured at the cGPS stations of Chilime (CHLM in red), Lamjung (LMJG in blue) and Besisahar (BESI in green) (C) Detrended vertical displacement confronted with the magnitude versus time distribution of the seismicity (in grey) and with (D) LMJG‒CHLM and BESI‒CHLM cGPS baselines.
Here, we quantitatively estimated the strain and stress induced by regional and local surface loading (see Supplementary Methods 1, 2). We first take advantage of satellite gravity measurements from the Gravity and Recovery Climate Experiment (GRACE) to quantify spatial and temporal variations in regional surface loading. We then calculate the full displacement field characterizing the solid-Earth’s response to surface variations in hydrological loading inferred from GRACE, using a spherical layered elastic Earth model (Chanard et al., 2018). Our calculation is validated by comparison with observed displacements at cGPS stations (Supplementary Figure 9), and then used to evaluate stress perturbations on steeply dipping fault planes N080-N100E, dipping 70N-90N, a fault geometry consistent with the pattern of the swarm (Figure 3) and the main structural fabrics of the area. We compute change in Coulomb stress (CFS) as an indicator of the fault susceptibility to failure under annual stresses derived from GRACE. This shows a maximum of CFS in spring and a maximum rate of CFS at the onset of the monsoon, with amplitudes reaching up to 800 Pa (Figure 5, Supplementary Figures 10–12).
The spatial resolution of the GRACE data is only of a few hundred of km (∼300 km). This leads to averaging loads over large areas, resolving the large wavelengths of the surface forcing on the faults. This may lead in this area to a significant mis-determination of the static stress change applied on shallow faults, which are also sensitive to localized loads, such as short wavelength snow accumulation on top of faults. Indeed, during summer monsoon, the freezing-thawing altitude reaches nearly 6000 m. The precipitations under this altitude favor rapid snow melt. Water is evacuated into rivers, while a thick snowpack is formed above 6000 m. According to the precipitations recorded at Gharedunga and Chhekampar, two meteorological stations at close distance from the Himalchuli (Figures 1, 5), surface load of the summer monsoon due to snow accumulation could reach 1 m -water equivalent- above 6000 m in the hanging wall of the suspected northward dipping fault, while no snow accumulates in the footwall which remains below the zero isotherm. This leads to a potential large stress increase on the fault plane. This would favor the normal fault failure during the summer monsoon. To test this hypothesis, we compute stress fields induced by 1 m snow loads localized on the surface of the hanging wall, over the Himalchuli or Manaslu mountain ranges using the Boussinesq solution (Boussinesq, 1878; see Supplementary Methods 2). Supplementary Figure 13 shows the two settings of snow surface load at 6 km on the Himalchuli or Manaslu, as well as the resulting depth profiles of the largest stress component
This is not surprising, snow loads having been suspected to be the forcing which modulate seismicity elsewhere, inhibiting the seismicity in winter in Japan on shallow dipping thrust faults and strike slip faults parallel to the snow loads (Heki, 2003). The tectonic setting here is different from the Japanese case, because of the orientation of the geological structures and their kinematics, but the effect could be similar in term of the amplitude of the Coulomb stress modulation on the fault system. Note that if the receiver faults are normal faults oriented NS or NE-SW, steeply dipping toward the highest topography to the West, the results would have not been drastically different.
Note that this local effect adds to the seasonal modulation of the stress by regional forcing previously described with a time structure favoring earthquakes in April and enhancing the seismicity rate in summer, the seismicity rate being expected to vary in proportion to the stress rate (Figures 4B,C) (Bettinelli et al., 2008).
A Collapse Possibly Accompanied by Fluid Migration
To decipher the processes behind the seismic swarm, another important information is that large carbon dioxide (CO2) emissions and hydrothermal disturbances followed the Gorkha earthquake at the front of the High Himalayan range (Girault et al., 2018). Several plausible causative scenarios for the failure and seismogenesis of the area can then be considered.
We consider a scenario involving the progressive collapse of the mountain under its own weight along a normal fault system. Indeed, the basement of the Himalchuli-Manaslu, which is the highest mountain group affected by subsidence along the Gorkha rupture, was probably weakened due to instant stretching and damages resulting from the mainshock (Figure 4A). Although not mapped by previous geological surveys, possibly hidden under the local glacier, a northward dipping fault is highly probable and both consistent with the shape of relocated swarm of earthquakes (Figure 3B and Figure 4D) and the local stress field imposed by the high topography. The failure was probably delayed by the deep afterslip on the MHT, responsible for clamping the steep northward dipping normal fault (Figure 4B). During this period of afterslip at depth, the fault is also solicited by the seasonal variations of the surface loads (Figure 4B for summer 2015 and 2016 and 4C for fall and winter 2015 and 2016). In August 2017, the normal fault is activated at the peak of local seasonal stresses (Figure 5C). During the two years that follow, the seismicity is then modulated by the stresses related to the surface hydrological loads (Figure 5C). The transient slip and swarm are reactivated in two stages in 2018: 1) at the peak of the regional Coulomb failure stress applied on the fault, involving a first increase of the seismicity rate in spring, and 2) during the summer monsoon, (a) when the local load in the hanging wall of the normal fault contributes to facilitating the rupture and (b) when the stress rate is optimal. The time structure of the sporadic events recorded in 2019 suggest that this scenario repeated two years after the initiation of the swarm (Figure 5C).
These mechanisms could be possibly accompanied by fluid migration that affects fracture strength. This would explain the high b-value obtained (Figure 2), the seismicity exhibiting a deficiency of large earthquakes, a signature often associated with the presence of fluids (e.g., Murru et al., 1999; Bachmann et al., 2012). In addition to pore pressure changes which could be the driver of the failure, alternative scenarios can involve changes in poroelastic stresses contributing to the generation of induced seismicity. Instead of resulting from the sole fault clamping by afterslip, the delay between the Gorkha mainshock, and/or an initial fluid injection, and the beginning of the swarm development could be due to the time necessary to increase enough the fluid pressure for triggering seismicity. These delays between injection and earthquake realizations have been illustrated elsewhere (e.g., Zhai et al., 2019). The seasonal deformations that follow the first swarm realization in 2017 can lead to repeated episodes in which the rock is hydraulically fractured due to additional poro-elastic stresses.
Several examples of seismicity driven by fluids involved deep CO2-rich fluids upwelling through fractured rocks (e.g., Cappa et al., 2009; Weinlich, 2014; Ingebritsen et al., 2015; Miller et al., 2004; Chiodini et al., 2020). In the Nepal Himalayas, CO2 produced by metamorphic reactions is released mainly in the MCT zone in the dissolved form as hot spring waters and in gaseous form as tectonic fumaroles and diffuse degassing structures (e.g., Girault et al., 2014; Figure 1). The 2015 Mw 7.9 Gorkha earthquake strongly affected Central Nepal triggering significant perturbations of the whole CO2 emitting region (Girault et al., 2018): increases and decreases of gaseous CO2 emissions at diffuse degassing structures and of dissolved CO2 emissions in springs, up to a complete cessation of flow in the Trisuli valley (Inset map Figure 1).
Other valleys, less than 30 km away from the swarm, such as the Budhi Gandaki and Marsyandi valleys, also release significant CO2 and are at closer distances (Figure 1). Repeated CO2 flux measurements at the Bahundanda hydrothermal system (Inset map Figure 1) during active and inactive periods of the swarm did not show any clear change. The available time-series of soil-gas radon-222 concentration at this site show variations associated with the monsoon and steady signals during winter. Carbon isotopic values of CO2 (δ13C) in the Budhi Gandaki valley remain relatively similar: for gaseous CO2 emissions, −5.4 ± 0.1 ‰ in January 2017 and −5.6 ± 0.1 ‰ in January 2018 at Khorlabesi, −3.0 ± 0.1 ‰ versus −3.1 ± 0.1 ‰ at Machhakhola; for dissolved CO2 in hot spring waters, −0.5 ± 0.2 ‰ versus +1.1 ± 0.1 ‰ at Machhakhola. In the Marsyandi valley, at Bahundanda, the δ13C values of gaseous CO2 emissions (−2.2 ± 0.1 ‰ in January 2017, −3.6 ± 0.1 ‰ in August 2018) and of dissolved CO2 in hot spring waters (+0.2 ± 0.2 ‰ versus +0.9 ± 0.1 ‰, and −0.2 ± 0.3 ‰ versus +0.6 ± 0.1 ‰) show a slight difference possibly due to an increase in CO2 degassing or to monsoonal rain effects (Girault et al., 2018; C. France-Lanord and P. Agrinier, private communications). At this stage, we cannot identify any clear excursion of carbon isotopic values of CO2 in gas and hot water at these hydrothermal sites during the period covered by the swarm.
Thus, no hydrothermal changes at known hydrothermal sites nearby were noticed in measurements available during the specific period of activity of the Himalchuli swarm. However, the potential presence of CO2 emission zones or CO2-rich springs in the immediate vicinity of the swarm has not been investigated yet. Despite the very high b-value, the particular behavior of the seismicity, the presence of numerous fluid/gas vents in the region affected by the seismicity, there are no other compelling evidence for a fluid-driven swarm activity.
Whereas some of these plausible forcing generate unique seismic temporal structures, or particular seismic spatial patterns, their respective contributions to the triggering of the seismic events emphasized here are difficult to further resolve. Indeed, we were unable to resolve any migration of the seismicity front, nor to determine the volume and time of fluid injection possibly triggering the observed seismicity, as well as to overcome the absence of well-constrained focal mechanisms. Finally, while we lack time-series of near-field InSAR and cGPS data covering the whole crisis, this seismic cluster located below the highest Himalayan summits and found in the trace of the Gorkha earthquake, at the edge of the western Nepal seismic gap, offers unique and challenging observations.
Conclusion
A peculiar seismic swarm initiated in August 2017 at the front of the High Himalayas, about 30 km North-West of the epicenter of the Mw 7.9 2015 Gorkha earthquake in Nepal. This swarm produced more than 6500 events with ML larger than 1.8 in three months in 2017. It was then reactivated in 2018 and again mildly in 2019. No comparable seismic swarm was recorded before in the Himalayas, the previous swarms being much smaller in size and intensity (Hoste-Colomer et al., 2017, 2018).
The Himalchuli swarm reveals a new possible feature of the seismicity following large earthquakes in the Himalayas. Beyond aftershocks in and around the rupture zone, seismicity can happen in the extended region affected by post-seismic relaxation, in the form of swarms, as observed in other contexts (e.g., Hainzl, 2004). Such swarms may help to diagnose the stress conditions of the seismogenic crust. However, they can only be detected by permanent networks, as temporary networks, while dense and more sensitive, are not necessarily installed in an adequate location and are usually not maintained sufficiently long after large earthquakes.
The occurrence of this swarm is a major concern, the area being situated at the northeastern edge of a large MHT segment that has not ruptured since the 14th century (Bollinger et al., 2016). Furthermore, it is the first example of a recurrent seismic swarm under the front of the high range. The relocation of this seismicity, using nearby temporary stations, shows that the earthquakes happened along a northward dipping plane between the sub-surface and the basal décollement of the MHT. Thus, the relocated seismicity does not suggest any clear connection to the next megaquake. Rather, the spatial structure of the seismicity relative to the high topography suggests a definite relation with the collapse of the high mountain range, associated on average with 2–3 cm of seismic slip along a 7 × 15 km2 long plane. This collapse happens at the foot of the Himalchuli-Manaslu group, the only mountain range above 8000 m-high along the Gorkha earthquake rupture. The high b-value and the deficit of large earthquakes suggest that this episode was accompanied by fluid injection and/or migration in the High Himalayan Crystalline rocks. However, the data available are yet too limited to distinguish between the various possible mechanisms of earthquake triggering. Nevertheless, the occurrence of such strong seismic swarm indicate that this system is highly sensitive to small deformation rates related to hydrologically-driven seasonal strain in the Himalayas and is therefore under near-critical conditions. Careful monitoring of small magnitude earthquake swarms in this region should therefore be an essential task in the future.
Data Availability Statement
The raw data supporting the conclusions of this article will be made available by the authors, without undue reservation.
Author Contributions
LA, LB, JV and FP contributed to conception and design of the study. All authors contributed at various stages of the analysis of the seismological data. LA, LB, JV and FP wrote the manuscript with contributions from KC, ML and FG. All authors contributed to manuscript revision, read, and approved the submitted version.
Conflict of Interest
The authors declare that the research was conducted in the absence of any commercial or financial relationships that could be construed as a potential conflict of interest.
Acknowledgments
We thank DMG (Nepal) as well as DASE (France) for facilitating the early exchanges during the crisis, as well as the data acquisition and treatment. DMG director general Sarbjit Prasad Mahato, Rajendra Khanal, Soma Nath Sapkota and Ram Prasad Ghimire are thanked for support over the years. Nepal Ministry of Home Affairs Nepal and DASE provided helicopter for installation and service of the temporary seismological station. We acknowledge early discussions with Pascal Bernard (IPGP) and Héléne Lyon-Caen (ENS Paris) and feedback from Yves Gaudemer. Kamal Kaphle, Arjun Bandhari and Destin Nziengui were involved in the processing. The Ambassador François-Xavier Léger and the French Embassy in Kathmandu are thanked for assistance. Two reviewers provided constructive comments that helped improve the original manuscript. This is IPGP contribution number 4229.
Supplementary Material
The Supplementary Material for this article can be found online at: https://www.frontiersin.org/articles/10.3389/feart.2021.659937/full#supplementary-material
References
Ader, T., Avouac, J.-P., Liu-Zeng, J., Lyon-Caen, H., Bollinger, L., Galetzka, J., et al. (2012). Convergence Rate across the Nepal Himalaya and Interseismic Coupling on the Main Himalayan Thrust: Implications for Seismic hazard. J. Geophys. Res. 117 (B4), a–n. doi:10.1029/2011jb009071
Ader, T. J., and Avouac, J.-P. (2013). Detecting Periodicities and Declustering in Earthquake Catalogs Using the Schuster Spectrum, Application to Himalayan Seismicity. Earth Planet. Sci. Lett. 377–378, 97–105. doi:10.1016/j.epsl.2013.06.032
Adhikari, L. B., Gautam, U. P., Koirala, B. P., Bhattarai, M., Kandel, T., Gupta, R. M., et al. (2015). The Aftershock Sequence of the 2015 April 25 Gorkha-Nepal Earthquake. Geophys. J. Int. 203, 2119–2124. doi:10.1093/gji/ggv412
Armijo, R., Tapponnier, P., Mercier, J. L., and Han, T.-L. (1986). Quaternary Extension in Southern Tibet: Field Observations and Tectonic Implications. J. Geophys. Res. 91 (B14), 13803–13872. doi:10.1029/jb091ib14p13803
Avouac, J.-P., Bollinger, L., Lavé, J., Cattin, R., and Flouzat, M. (2001). Le cycle sismique en Himalaya. Comptes Rendus de l'Académie des Sci. - Ser. IIA - Earth Planet. Sci. 333 (9), 513–529. doi:10.1016/s1251-8050(01)01573-7
Avouac, J.-P., Meng, L., Wei, S., Wang, T., and Ampuero, J.-P. (2015). Lower Edge of Locked Main Himalayan Thrust Unzipped by the 2015 Gorkha Earthquake. Nat. Geosci. 8 (9), 708–711. doi:10.1038/ngeo2518
Bachmann, C. E., Wiemer, S., Goertz-Allmann, B. P., and Woessner, J. (2012). Influence of Pore-Pressure on the Event-Size Distribution of Induced Earthquakes. Geophys. Res. Lett. 39, 9302. doi:10.1029/2012GL051480
Bai, L., Liu, H., Ritsema, J., Mori, J., Zhang, T., Ishikawa, Y., et al. (2016). Faulting Structure above the Main Himalayan Thrust as Shown by Relocated Aftershocks of the 2015Mw7.8 Gorkha, Nepal, Earthquake. Geophys. Res. Lett. 43 (2), 637–642. doi:10.1002/2015gl066473
Baillard, C., Lyon-Caen, H., Bollinger, L., Rietbrock, A., Letort, J., and Adhikari, L. B. (2017). Automatic Analysis of the Gorkha Earthquake Aftershock Sequence: Evidences of Structurally Segmented Seismicity. Geophys. J. Int. 209 (2), 1111–1125. doi:10.1093/gji/ggx081
Bettinelli, P., Avouac, J. P., Flouzat, M., Bollinger, L., Ramillien, G., Rajaure, S., et al. (2008). Seasonal Variations of Seismicity and Geodetic Strain in the Himalaya Induced by Surface Hydrology. Earth Planet. Sci. Lett. 266 (3-4), 332–344. doi:10.1016/j.epsl.2007.11.021
Bilham, R. (2019). Himalayan Earthquakes: a Review of Historical Seismicity and Early 21st century Slip Potential. Geol. Soc. Lond. Spec. Publications 483 (1), 423–482. doi:10.1144/sp483.16
Blewitt, G., Hammond, W., and Kreemer, C. (2018). Harnessing the GPS Data Explosion for Interdisciplinary Science. Eos 99, 485. doi:10.1029/2018EO104623
Bollinger, L., Avouac, J. P., Cattin, R., and Pandey, M. R. (2004). Stress Buildup in the Himalaya. J. Geophys. Res. 109 (B11), B11405. doi:10.1029/2003jb002911
Bollinger, L., Perrier, F., Avouac, J.-P., Sapkota, S., Gautam, U., and Tiwari, D. R. (2007). Seasonal Modulation of Seismicity in the Himalaya of Nepal. Geophys. Res. Lett. 34 (8), L08304. doi:10.1029/2006gl029192
Bollinger, L., Tapponnier, P., Sapkota, S. N., and Klinger, Y. (2016). Slip Deficit in central Nepal: Omen for a Repeat of the 1344 AD Earthquake?. Earth, Planets and Space 68 (1), 12. doi:10.1186/s40623-016-0389-1
Boussinesq, J. (1878). Équilibre D’élasticité D’un Sol Isotrope Sans Pesanteur, Supportant Différents Poids. CR Math. Acad. Sci. Paris 86, 1260–1263.
Burtin, A., Bollinger, L., Cattin, R., Vergne, J., and Nábělek, J. L. (2009). Spatiotemporal Sequence of Himalayan Debris Flow from Analysis of High-Frequency Seismic Noise. J. Geophys. Res. 114 (F4), 1198. doi:10.1029/2008JF001198
Cappa, F., Rutqvist, J., and Yamamoto, K. (2009). Modeling Crustal Deformation and Rupture Processes Related to Upwelling of Deep CO2-rich Fluids during the 1965-1967 Matsushiro Earthquake Swarm in Japan. J. Geophys. Res. 114 (B10), B10304. doi:10.1029/2009jb006398
Chamberlain, C. J., Boese, C. M., and Townend, J. (2017). Cross-correlation-based Detection and Characterisation of Microseismicity Adjacent to the Locked, Late-Interseismic Alpine Fault, South Westland, New Zealand. Earth Planet. Sci. Lett. 457, 63–72. doi:10.1016/j.epsl.2016.09.061
Chanard, K., Avouac, J. P., Ramillien, G., and Genrich, J. (2014). Modeling Deformation Induced by Seasonal Variations of continental Water in the Himalaya Region: Sensitivity to Earth Elastic Structure. J. Geophys. Res. Solid Earth 119 (6), 5097–5113. doi:10.1002/2013jb010451
Chanard, K., Fleitout, L., Calais, E., Rebischung, P., and Avouac, J. P. (2018). Toward a Global Horizontal and Vertical Elastic Load Deformation Model Derived from GRACE and GNSS Station Position Time Series. J. Geophys. Res. Solid Earth 123 (4), 3225–3237. doi:10.1002/2017jb015245
Chiodini, G., Cardellini, C., Di Luccio, F., Selva, J., Frondini, F., Caliro, S., et al. (2020). Correlation between Tectonic CO2 Earth Degassing and Seismicity Is Revealed by a 10-year Record in the Apennines. Italy. Sci. Adv. 6, eabc2938. doi:10.1126/sciadv.abc2938
Colchen, M., LeFort, P., and Pêcher, A. (1986). Recherches géologiques dans l'Himalaya du Népal. Paris: CNRS.
De Barros, L., Baques, M., Godano, M., Helmstetter, A., Deschamps, A., Larroque, C., et al. (2019). Fluid‐Induced Swarms and Coseismic Stress Transfer: A Dual Process Highlighted in the Aftershock Sequence of the 7 April 2014 Earthquake (Ml 4.8, Ubaye, France). J. Geophys. Res. Solid Earth 124 (4), 3918–3932. doi:10.1029/2018jb017226
Duverger, C., Godano, M., Bernard, P., Lyon‐Caen, H., and Lambotte, S. (2015). The 2003-2004 Seismic Swarm in the Western Corinth Rift: Evidence for a Multiscale Pore Pressure Diffusion Process along a Permeable Fault System. Geophys. Res. Lett. 42 (18), 7374–7382. doi:10.1002/2015gl065298
Elliott, J. R., Jolivet, R., González, P. J., Avouac, J.-P., Hollingsworth, J., Searle, M. P., et al. (2016). Himalayan Megathrust Geometry and Relation to Topography Revealed by the Gorkha Earthquake. Nat. Geosci. 9 (2), 174–180. doi:10.1038/ngeo2623
Galetzka, J., Melgar, D., Genrich, J. F., Geng, J., Owen, S., Lindsey, E. O., et al. (2015). Slip Pulse and Resonance of the Kathmandu basin during the 2015 Gorkha Earthquake, Nepal. Science 349 (6252), 1091–1095. doi:10.1126/science.aac6383
Girault, F., Adhikari, L. B., France-Lanord, C., Agrinier, P., Koirala, B. P., Bhattarai, M., et al. (2018). Persistent CO2 Emissions and Hydrothermal Unrest Following the 2015 Earthquake in Nepal. Nat. Commun. 9 (1), 2956. doi:10.1038/s41467-018-05138-z
Girault, F., Bollinger, L., Bhattarai, M., Koirala, B. P., France-Lanord, C., Rajaure, S., et al. (2014). Large-scale Organization of Carbon Dioxide Discharge in the Nepal Himalayas. Geophys. Res. Lett. 41, 6358–6366. doi:10.1002/2014gl060873
Grandin, R., Vallée, M., Satriano, C., Lacassin, R., Klinger, Y., Simoes, M., et al. (2015). Rupture Process of theMw = 7.9 2015 Gorkha Earthquake (Nepal): Insights into Himalayan Megathrust Segmentation. Geophys. Res. Lett. 42 (20), 8373–8382. doi:10.1002/2015gl066044
Gualandi, A., Avouac, J.-P., Galetzka, J., Genrich, J. F., Blewitt, G., Adhikari, L. B., et al. (2017). Pre- and post-seismic Deformation Related to the 2015, Mw7.8 Gorkha Earthquake, Nepal. Tectonophysics 714–715, 90–106. doi:10.1016/j.tecto.2016.06.014
Hainzl, S. (2004). Seismicity Patterns of Earthquake Swarms Due to Fluid Intrusion and Stress Triggering. Geophys. Res. Int. 159, 1090–1096. doi:10.1111/j.1365-246x.2004.02463.x
Heki, K. (2003). Snow Load and Seasonal Variation of Earthquake Occurrence in Japan. Earth Planet. Sci. Lett. 207 (1–4), 159–164. doi:10.1016/s0012-821x(02)01148-2
Hoste-Colomer, R., Bollinger, L., Lyon-Caen, H., Adhikari, L. B., Baillard, C., Benoit, A., et al. (2018). Lateral Variations of the Midcrustal Seismicity in Western Nepal: Seismotectonic Implications. Earth Planet. Sci. Lett. 504, 115–125. doi:10.1016/j.epsl.2018.09.041
Hoste-Colomer, R., Bollinger, L., Lyon-Caen, H., Burtin, A., and Adhikari, L. B. (2017). Lateral Structure Variations and Transient Swarm Revealed by Seismicity along the Main Himalayan Thrust north of Kathmandu. Tectonophysics 714–715, 107–116. doi:10.1016/j.tecto.2016.10.004
Ingebritsen, S. E., Shelly, D. R., Hsieh, P. A., Clor, L. E., Seward, P. H., and Evans, W. C. (2015). Hydrothermal Response to a Volcano-Tectonic Earthquake Swarm, Lassen, California. Geophys. Res. Lett. 42, 9223–9230. doi:10.1002/2015gl065826
Ingleby, T., Wright, T. J., Hooper, A., Craig, T. J., and Elliott, J. R. (2020). Constraints on the Geometry and Frictional Properties of the Main Himalayan Thrust Using Coseismic, Postseismic, and Interseismic Deformation in Nepal. J. Geophys. Res. Solid Earth 125 (2), e2019JB019201. doi:10.1029/2019jb019201
Jiang, G., Wang, Y., Wen, Y., Liu, Y., Xu, C., and Xu, C. (2019). Afterslip Evolution on the Crustal Ramp of the Main Himalayan Thrust Fault Following the 2015 Mw 7.8 Gorkha (Nepal) Earthquake. Tectonophysics 758, 29–43. doi:10.1016/j.tecto.2019.03.005
Jouanne, F., Gajurel, A., Mugnier, J.-L., Bollinger, L., Adhikari, L. B., Koirala, B., et al. (2019). Postseismic Deformation Following the April 25, 2015 Gorkha Earthquake (Nepal): Afterslip versus Viscous Relaxation. J. Asian Earth Sci. 176, 105–119. doi:10.1016/j.jseaes.2019.02.009
Kraft, T., Wassermann, J., Schmedes, E., and Igel, H. (2006). Meteorological Triggering of Earthquake Swarms at Mt. Hochstaufen, SE-Germany. Tectonophysics 424 (3–4), 245–258. doi:10.1016/j.tecto.2006.03.044
Larochelle, S., Gualandi, A., Chanard, K., and Avouac, J. P. (2018). Identification and Extraction of Seasonal Geodetic Signals Due to Surface Load Variations. J. Geophys. Res. Solid Earth 123 (12), 11–31. doi:10.1029/2018jb016607
Lindsey, E. O., Almeida, R., Mallick, R., Hubbard, J., Bradley, K., Tsang, L. L. H., et al. (2018). Structural Control on Downdip Locking Extent of the Himalayan Megathrust. J. Geophys. Res. Solid Earth 123 (6), 5265–5278. doi:10.1029/2018jb015868
Liu-Zeng, J., Zhang, Z., Rollins, C., Gualandi, A., Avouac, J. P., Shi, H., et al. (2020). Postseismic Deformation Following the 2015 Mw7. 8 Gorkha (Nepal) Earthquake: New GPS Data, Kinematic and Dynamic Models, and the Roles of Afterslip and Viscoelastic Relaxation. J. Geophys. Res. Solid Earth 125 (9), e2020JB019852. doi:10.1029/2020JB019852
Lohman, R. B., and McGuire, J. J. (2007). Earthquake Swarms Driven by Aseismic Creep in the Salton Trough, California. J. Geophys. Res. Solid Earth 112 (B4), jb004596. doi:10.1029/2006jb004596
Mencin, D., Bendick, R., Upreti, B. N., Adhikari, D. P., Gajurel, A. P., Bhattarai, R. R., et al. (2016). Himalayan Strain Reservoir Inferred from Limited Afterslip Following the Gorkha Earthquake. Nat. Geosci. 9 (7), 533–537. doi:10.1038/ngeo2734
Mendoza, M. M., Ghosh, A., Karplus, M. S., Klemperer, S. L., Sapkota, S. N., Adhikari, L. B., et al. (2019). Duplex in the Main Himalayan Thrust Illuminated by Aftershocks of the 2015 Mw 7.8 Gorkha Earthquake. Nat. Geosci. 12 (12), 1018–1022. doi:10.1038/s41561-019-0474-8
Mendoza, M. M., Ghosh, A., and Rai, S. S. (2016). Dynamic Triggering of Small Local Earthquakes in the central Himalaya. Geophys. Res. Lett. 43 (18), 9581–9587. doi:10.1002/2016gl069969
Miller, S. A., Collettini, C., Chiaraluce, L., Cocco, M., Barchi, M., and Kaus, B. J. P. (2004). Aftershocks Driven by a High-Pressure CO2 Source at Depth. Nature 427 (6976), 724–727. doi:10.1038/nature02251
Murru, M., Montuori, C., Wyss, M., and Privitera, E. (1999). The Locations of Magma chambers at Mt. Etna, Italy, Mapped Byb-Values. Geophys. Res. Lett. 26 (16), 2553–2556. doi:10.1029/1999gl900568
Nabelek, J., Hetényi, G., Vergne, J., Sapkota, S., Kafle, B., Jiang, M., et al. (2009). Underplating in the Himalaya-Tibet Collision Zone Revealed by the Hi-CLIMB experiment. Science 325 (5946), 1371–1374. doi:10.1126/science.1167719
Pandey, M. R. (1985). Seismic Model of central and Eastern Lesser Himalaya of Nepal. J. Geol. Soc. Nepal 3, 1–11. doi:10.3126/jngs.v3i0.32655
Pandey, M. R., Tandukar, R. P., Avouac, J. P., Lavé, J., and Massot, J. P. (1995). Interseismic Strain Accumulation on the Himalayan Crustal Ramp (Nepal). Geophys. Res. Lett. 22 (7), 751–754. doi:10.1029/94gl02971
Pandey, M. R., Tandukar, R. P., Avouac, J. P., Vergne, J., and Heritier, T. (1999). Seismotectonics of the Nepal Himalaya from a Local Seismic Network. J. Asian Earth Sci. 17 (5-6), 703–712. doi:10.1016/s1367-9120(99)00034-6
Tian, Z., Freymueller, J. T., and Yang, Z. (2020). Spatio-temporal Variations of Afterslip and Viscoelastic Relaxation Following the Mw 7.8 Gorkha (Nepal) Earthquake. Earth Planet. Sci. Lett. 532, 116031. doi:10.1016/j.epsl.2019.116031
Waldhauser, F., and Ellsworth, W. L. (2000). A Double-Difference Earthquake Location Algorithm: Method and Application to the Northern Hayward Fault, California. Bull. Seismological Soc. America 90 (6), 1353–1368. doi:10.1785/0120000006
Wang, K., and Fialko, Y. (2018). Observations and Modeling of Coseismic and Postseismic Deformation Due to the 2015 Mw 7.8 Gorkha (Nepal) Earthquake. J. Geophys. Res. Solid Earth 123 (1), 761–779. doi:10.1002/2017jb014620
Weinlich, F. H. (2014). Carbon Dioxide Controlled Earthquake Distribution Pattern in the NW Bohemian Swarm Earthquake Region, Western Eger Rift, Czech Republic - Gas Migration in the Crystalline Basement. Geofluids 14, 143–159. doi:10.1111/gfl.12058
Yamada, M., Kandel, T., Tamaribuchi, K., and Ghosh, A. (2020). 3D Fault Structure Inferred from a Refined Aftershock Catalog for the 2015 Gorkha Earthquake in Nepal. Bull. Seismological Soc. America 110 (1), 26–37. doi:10.1785/0120190075
Zhai, G., Shirzaei, M., Manga, M., and Chen, X. (2019). Pore-pressure Diffusion, Enhanced by Poroelastic Stresses, Controls Induced Seismicity in Oklahoma. Proc. Natl. Acad. Sci. USA 116 (33), 16228–16233. doi:10.1073/pnas.1819225116
Keywords: Gorkha earthquake, aftershock, seismic swarm, seismicity and tectonics, relocation, himalaya
Citation: Adhikari LB, Bollinger L, Vergne J, Lambotte S, Chanard K, Laporte M, Li L, Koirala BP, Bhattarai M, Timsina C, Bishwokarma N, Wendling-Vazquez N, Girault F and Perrier F (2021) Orogenic Collapse and Stress Adjustments Revealed by an Intense Seismic Swarm Following the 2015 Gorkha Earthquake in Nepal. Front. Earth Sci. 9:659937. doi: 10.3389/feart.2021.659937
Received: 28 January 2021; Accepted: 16 June 2021;
Published: 22 July 2021.
Edited by:
A. Alexander G. Webb, The University of Hong Kong, ChinaReviewed by:
Abhijit Ghosh, University of California, Riverside, United StatesJie Deng, University of California, Los Angeles, United States
Copyright © 2021 Adhikari, Bollinger, Vergne, Lambotte, Chanard, Laporte, Li, Koirala, Bhattarai, Timsina, Bishwokarma, Wendling-Vazquez, Girault and Perrier. This is an open-access article distributed under the terms of the Creative Commons Attribution License (CC BY). The use, distribution or reproduction in other forums is permitted, provided the original author(s) and the copyright owner(s) are credited and that the original publication in this journal is cited, in accordance with accepted academic practice. No use, distribution or reproduction is permitted which does not comply with these terms.
*Correspondence: Lok Bijaya Adhikari, lbadhikari@hotmail.com