Waveform Decontamination for Improving Satellite Radar Altimeter Data Over Nearshore Area: Upgraded Algorithm and Validation
 Haihong Wang1,2*
  Zhengkai Huang3,4
- 1School of Geodesy and Geomatics, Wuhan University, Wuhan, China
- 2Key Laboratory of Marine Environmental Survey Technology and Application, Ministry of Natural Resources, Guangzhou, China
- 3School of Civil Engineering and Architecture, East China Jiaotong University, Nanchang, China
- 4Key Laboratory of Basin Water Resources and Eco-environmental Science in Hubei Province, Yangtze River Scientific Research Institute, Wuhan, China
One of the thorniest problems in altimetry community is retrieving accurate coastal sea surface height, especially in the last several kilometers offshore. It is confirmed in previous studies that decontaminating waveforms is beneficial to improve the quality of coastal SSHs. In this article, we proposed an upgraded strategy for waveform decontamination, including a novel realignment algorithm and gate-wise outlier detector. We validated the new strategy in four test regions using Jason-2 altimeter data. In the validation process, we compared retracked SSHs by 16 retrackers, which include retrackers provided in SGDR (Sensor Geophysical Data Record), ALES (Adaptive Leading Edge Subwaveform), and PISTACH (Prototype Innovant de Système de Traitement pour les Applications Côtières et l’Hydrologie) products. Comparison results verified that retracking the waveforms decontaminated using our new method can greatly improve the SSHs in the coastal region. The 20% threshold retracker (DW-TR20) and the ICE1 retracker (DW-ICE1) based on the decontaminated waveforms outperform other retrackers, especially in 0–4 km zone offshore. DW-TR20 and DW-ICE1 can provide robust SSHs with a consistent accuracy in 0–20 km coastal band and a high correlation (>0.9) with nearby gauge data. To conclude, the upgraded waveform decontamination strategy provides a promising solution for coastal altimetry, which makes it possible to extend reliable observations to the last several kilometers offshore.
Introduction
Satellite altimetry is a mature technique for observing the global open ocean from space, providing a wealth of measurements for oceanographic, geodetic, and geophysical applications (Stammer and Cazenave, 2017; Fu and Cazenave, 2001). In the past decade, applications further extended to the coastal areas, which triggered a new discipline in the altimetry community, referred to as coastal altimetry (Vignudelli et al., 2011). It dedicates to exploit satellite altimetry from the open ocean to the coasts.
The crucial difficulty for coastal altimetry is that the altimeter data in the coastal zones are seriously degraded. In standard products, data in the coastal zone (up to tens of kilometers from the coast) are usually flagged as bad (Cipollini et al., 2017; Vignudelli et al., 2011). It will result in no usable data over the coastal strip. Hence, the paramount work of coastal altimetry is retrieving more and better data closer to the coast. In recent years, considerable concern has arisen over this challenging topic and a dramatic effort has been made by the altimetry community of researchers. A series of reprocessed products for coastal applications were developed by some agencies, such as X-TRACK by LEGOS (Laboratoire d’Etudes en Géophysique et Océanographie Spatiales, France) (Birol et al., 2017), ALES (Adaptive Leading Edge Subwaveform) by NOC (National Oceanography Centre, United Kingdom) (Passaro et al., 2014), and PISTACH (Prototype Innovant de Système de Traitement pour l’Altimétrie Côtière et l’Hydrologie) (Mercier et al., 2010) and PEACHI (the Prototype for Expertise on Altimetry for Coastal, Hydrology and Ice) (Valladeau et al., 2015) by CNES (Centre National d’Etudes Spatiales).
The degradation of coastal altimeter data can be attributed to a couple of factors, such as contamination of the radar echoes and inadequate corrections. The most important one is the range error due to the distorted coastal waveforms. The coastal waveforms received by the altimeter will be contaminated by the reflections from land, calm water, or steep waves appearing in the radar footprint (Deng and Featherstone, 2006; Gomez-Enri et al., 2010). The contaminated waveforms depart from the open-ocean Brown model (Brown, 1977), which is routinely used for the onboard tracking system. Therefore, erroneous measurements might be derived in coastal regions. During the last few decades, a postprocessing technique referred to as waveform retracking has been extensively applied to overcome this problem. Numerous waveform retracking algorithms were developed that can be categorized into model-based and empirical retrackers (Gommenginger et al., 2011; Passaro et al., 2014). A number of studies have demonstrated the improvements in both quantity and quality of the coastal measurements when they are reprocessed using waveform retracking methods. Valid measurements after retracking have been approaching to the band of 10 km offshore from 50 km offshore. However, retrieving valid data over the last few kilometers to the coastline is still a challenge (Tseng et al., 2014; Huang et al., 2017; Vignudelli et al., 2019).
The closer to shore, the more complex the waveform is (Chaudhary et al., 2015; Idris et al., 2017, Bignalet-Cazalet et al., 2020; Sinurata et al., 2021). The traditional retrackers for processing the ocean waveform, neither model-based nor empirical, sometimes fail to retrack the waveform or misestimate parameters in coastal regions due to the severe noise in the coastal waveform. In order to depress the noise, approaches based on the subwaveform containing the leading edge are widely used (Hwang et al., 2006; Guo et al., 2010; Yang L. et al., 2012; Idris and Deng, 2012; Passaro et al., 2018). However, it is not easy to accurately extract the subwaveform since the partitioning of the waveform is inevitably disturbed by the signal from non-ocean surfaces (Yang Y. et al., 2012; Huang et al., 2017; Wang and Ichikawa, 2017). In the coastal zone, a large portion of altimetric waveforms are corrupted by peaks caused by bright targets inside the illustrated area. These peaks may lead to overestimation of the amplitude of the waveform. For these peaky waveforms, some hybrid models were introduced to refine parameter estimation, e.g., the Brown with Gaussian peak model (Halimi et al., 2013). Another strategy is removing anomalous peaks before retracking (Peng and Deng, 2018). Based on the stack of successive along-track waveforms (referred to as echogram or radar-gram), parabola traces can be observed at the trailing edge area, which are corresponding to the signals of bright targets within the altimeter footprint (Gomez-Enri et al., 2010). The parabolic feature can be applied to remove the peaky-type noise at the trailing edge caused by fixed-point bright targets (Wang and Ichikawa, 2017). In a more ordinary way, noise superimposed on the waveform can be suppressed using empirical methods. A waveform modifying procedure based on a preset criterion was proposed to mitigate anomalous peaks in coastal waveforms (0.5–7 km from coasts) (Tseng et al., 2014). This procedure was further improved by Huang et al. (2017). Abovementioned studies have consolidated a concept that cleaning the waveform prior to retracking can contribute greatly to retrieving more accurate data closer to the coast.
The purpose of this article is to upgrade the waveform decontamination technique and ascertain its effect on improving coastal altimetric data. It has been pointed out that the criteria for selecting reference waveforms and identifying outliers are still open research questions (Huang et al., 2017). In this study, an optimized algorithm for waveform decontamination is presented based on realigned waveforms. More sophisticated criteria are adopted in the new algorithm. The upgraded decontaminating technique will be more stable and robust, especially for waveforms at the last few kilometers to coasts.
Data and Study Area
Jason-2 Sensor Geophysical Data Record (SGDR)
The altimetry satellite Jason-2 was launched on June 20, 2008. The main objective of Jason-2 is to measure ocean surface ensuring the continuity of the TOPEX/Poseidon and Jason-1 missions. Due to the improvements in the echo acquisition and tracking modes, the Poseidon-3 altimeter onboard Jason-2 maintained significantly higher data availability over land or mixed land-sea terrain in comparison with its predecessor Poseidon-2 onboard Jason-1 (Desjonquères et al., 2010). It guaranteed an additional goal of Jason-2, which is to provide measurements over coastal areas and inland waters.
For retracking, SGDR product should be used. The Jason-2 SGDR products (version d) are downloaded from Archiving, Validation, and Interpretation of Satellite Oceanography (AVISO, https://www.aviso.altimetry.fr). The dataset provides 1 and 20Hz sampling values. Waveforms contained in the dataset allow customized retracking for refining measurements. The dataset provides four kinds of ranges derived using different retracking strategies. One is the onboard operating tracker (hereafter referred to as “Raw”). The other three retrackers are MLE4 (4-parameter Maximum Likelihood Estimator), MLE3 (3-parameter), and ICE, respectively (Dumont et al., 2017).
Coastal and Hydrology Altimetry (PISTACH) Products
The PISTACH products were developed by Collecte Localization Satellites (CLS) with support from CNES. PISTACH is dedicated to refining Jason-2 data over coastal regions and inland waters for coastal and hydrological applications. For this purpose, several new retracking algorithms were developed. A set of four alternative retracked ranges are provided in the PISTACH products. The four retrackers are ICE1, ICE3, RED3, and OCE3, respectively. Furthermore, the PISTACH products include several state-of-the-art geophysical corrections, e.g., wet tropospheric corrections and sea state bias corrections. More details about these retrackers are available in the PISTACH handbook (Mercier et al., 2010). These products can be accessed via AVISO ftp (ftp://ftp-access.aviso.altimetry.fr/pub/oceano/pistach).
ALES Dataset
The ALES Jason-2 dataset was produced by DGFI-TUM (Deutsches Geodätisches Forschungsinstitut Technische Universität München) and distributed via Open Altimeter Database (OpenADB, https://www.openadb.dgfi.tum.de). This dataset was a reprocessed product using the ALES retracker. This retracker selects part of each waveform by adapting its width according to the significant wave height and models the subwaveform with the classic Brown model by means of least square estimation (Passaro et al., 2014). A number of studied have validated that ALES has good performance over coastal areas (Passaro et al., 2014; Xu et al., 2018; Gómez-Enri et al., 2019; Birol et al., 2021). As well as PISTACH, the ALES product is used as a reference to evaluate the performance of the new retracking scheme proposed in this work.
Tide Gauge Data
Sea level measured by tide gauge is usually used to validate the altimeter-derived sea surface heights (SSHs). Tide gauge data used in this study are the Research Quality Data (RQD) at hourly resolution, achieved by UHSLC (University of Hawaii Sea Level Center) (Caldwell et al., 2015). The RQD is a final science-ready dataset with quality control, which can be downloaded from the ftp sever of UHSLC (ftp://ftp.soest.hawaii.edu/uhslc/rqds). Four stations equipped with float gauge were used for validation. The four stations are located at Los Angeles (United States), Cape May (United States), Funchal (Madeira Island), and Ko Lak (Thailand), respectively. The float gauge has an accuracy of several millimeters. Thus, the tide gauge data are preferred for validating altimeter-derived SSHs. However, each tide station has a unique local datum, and datum information of some stations are not given. Therefore, relative validation is frequently conducted by removing their mean values.
Study Areas
Figure 1 shows four test areas chosen to validate the upgraded strategy, which are same as those in Huang et al. (2017). One Jason-2 pass (red line) accompanied by a tide gauge station (white pentacle) nearby is used for each case. Cycle 1-252 altimeter data were used in this study. In each area, the coastal topography and ocean floor are very different from each other, representing different sea state and surface reflectivity. General information of these regions are tabulated in Table 1. In Los Angeles, the coastal topography is a 500 m high mountain. The along-track bathymetry within 10 km offshore varies from 0 to 600 m, which has a sharp slope within 4–6 km. The terrain in Cape May is very flat and low altitude and ocean water is very shallow. While the third case is near Madeira Island, where the coast is very steep and the bathymetry sharply drops by 2000 m within 4 km. In the last case, the coast terrain is smooth and water depth is shallow. However, the satellite track is very close to the coastline, which induces a great amount of noise in altimeter waveforms. According to the classification of waveforms in PISTACH, percentages of each waveform class within 20 km offshore are listed in Table 1. It clearly shows that serious waveform contamination occurred in each case, especially in the Ko Lak region.
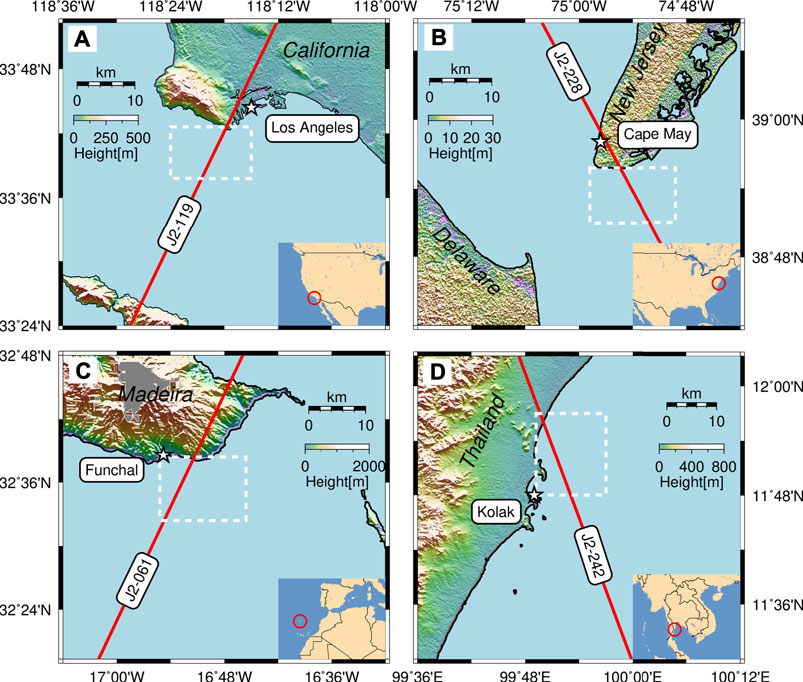
FIGURE 1. Four areas for validation near tide gauge stations: (A) Los Angeles, California, United States; (B) Cape May, New Jersey, United States; (C) Funchal, Maderia Island, Portugal; (D) Ko Lak, Thailand. The red line denotes ground track of Jason-2. The white pentacle shows the position of tide gauge. The rectangle with white dashed line sketches the test area.
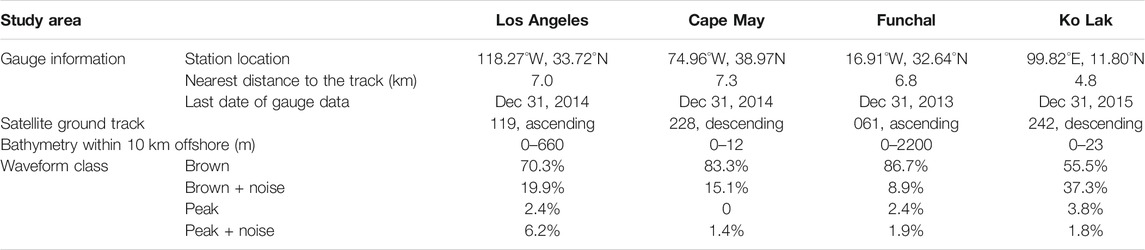
TABLE 1. General information of study areas.
Materials and Methods
In this section, we will introduce our new strategy for retrieving coastal SSHs based on the decontamination technique. Compared with the previous method, two significant improvements were made in the new strategy. Firstly, we proposed an algorithm to realign waveforms in the echogram before outlier detection, aiming to moderate the influence of shifting of the leading edge. Secondly, we substituted the single criterion in the old method with the gate-wise criteria for outlier detection in each echogram.
Sea Surface Height
SSH is the height of sea surface with respect to the reference ellipsoid. By altimetry, SSH can be determined by subtracting altimeter range from the altitude of the satellite. Ranges measured by the altimeter must be corrected for instrument effects, path delay in the atmosphere, and the nature of the reflecting sea surface. The resultant SSH is given by
where h is the altimetry-derived SSH, Alt is the orbit altitude of the satellite, R is the altimeter range, and ΔR represents corrections for the range. The subscripts “instr,” “atmos,” and “ssb” indicate instrumental corrections, atmospheric corrections, and sea state bias (SSB) corrections, respectively. ΔRdyn is the correction for the dynamic response to atmospheric pressure. The last item ΔRretrack is an optional correction, which is applied only when retracking is implemented.
In general, instrumental corrections consist of the distance offset between antenna and center of gravity, USO (Ultra Stable Oscillator) frequency drift correction, internal path correction, Doppler correction, modeled instrumental errors correction, and system bias. For the Jason-2 SGDR products, all retracked ranges have been corrected for all instrumental corrections. It is noteworthy that the last three corrections are not included in raw ranges. They should be additionally counted if one makes use of the raw ranges or implements customized retracking processing. Atmospheric corrections consist of wet troposphere correction, dry troposphere correction, and ionosphere correction. Model-derived atmospheric corrections in SGDR are used in this study. The SSB and dynamic atmosphere corrections used in the study are retrieved from the PISTACH product, which is suggested in the previous study (Huang et al., 2017).
Waveform Decontamination and Retracking
The main idea of waveform decontamination is identifying and amending anomalous samples in the waveform according to some preset criteria. The criteria have to be determined based on each echogram as no other a priori information can be available. The reference waveform, which is determined by averaging whole waveforms in the echogram, plays an important role in this procedure. It is shown that the migration of the leading edge of along-track waveforms will lead to misjudgment of contaminated gates due to improper selection of the reference waveform (Huang et al., 2017). In order to reduce the effect caused by the shift of the leading edge, a method is proposed to realign waveforms in the echogram (see Realignment of Waveforms). In addition, new algorithms are adopted for the detection and remedy of outliers (see Outlier Detection).
Realignment of Waveforms
Shifts of the leading edges in the echogram can cause serious distortion of the leading edge of the reference waveform. It is better to align waveforms prior to averaging. Here, it is called realignment because the onboard tracker had tried to align the leading edges centered on a nominal gate. To do this, the offset of each waveform relative to a given waveform should be determined and then eliminated by translation along the time (or range) axis. According to the tracking principal of the altimeter, the relative offset can be estimated using the difference of surface topography by
where ΔGi is the offset of the ith waveform relative to the selected waveform (farthest to the coast in this study), Δhi is the SSH difference derived from the raw SSHs, ΔNi is the difference of the geoid undulations, and d is the range resolution of the altimeter (about 0.47 m for Jason-2). The offset should be rounded to the nearest whole number because waveform gates require integer values. The EGM 2008 (Pavlis et al., 2012) geoid model was used in this study. The accuracy of EGM2008 marine geoid is in centimeter level, which is much less than the range resolution of the altimeter. So, the impact of the geoid error can be ignored when estimating the relative offset.
Let the matrix
Figure 2 shows an example of a Jason-2 coastal track, which is a descending pass departing from the coast. Apparent shifts of the leading edges can be observed near the coast (latitude >38.8°N) in the raw waveforms (Figure 2A). Two parabola traces due to bright targets are notable prior to the leading edges between 38.63° and 38.7°. Figure 2B indicates that the height differences are closely correlated with the location of the leading edges. As observed in Figure 2C, shifts of the leading edges had been efficiently reduced in the realigned waveforms based on the offsets derived from the height differences.
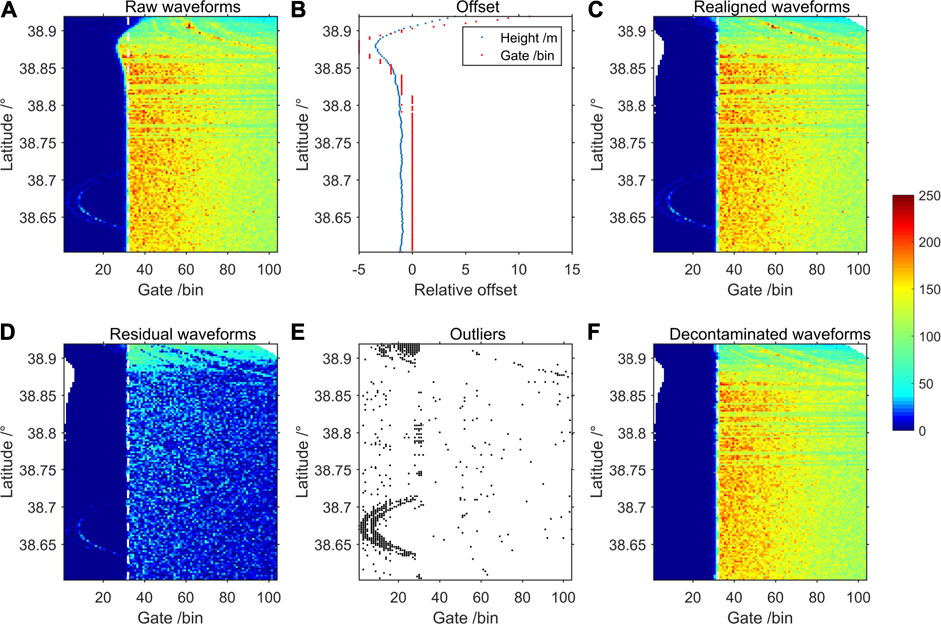
FIGURE 2. Illustration of the waveform contamination procedure using a Jason-2 coastal track (Pass #228, cycle #225). (A) Raw waveforms. (B) Translation offsets derived from height differences. (C) Realigned waveforms. (D) Residual waveforms. (E) Detected outliers. (F) Decontaminated waveforms. The white dashed line indicates the nominal gate of Jason-2.
Outlier Detection
The realigned waveforms are averaged and used as a reference for outlier detection. The reference waveform
Subtracting the reference waveform from the realigned waveforms, residuals can be derived as follows:
Based on the residuals, the root mean square (RMS) for each gate is calculated as follows:
Pixels in the echogram are tested using the gate-wise criterion given in Eq. 7. If the residual on a pixel exceeds twice RMS, this pixel will be regarded as an outlier and set to a null value.
Amending Outlier
Outliers are necessary to be amended before retracking. This procedure is implemented by interpolation. In the previous work (Tseng et al., 2014), a 2D linear interpolation from neighboring pixels was applied to amend outliers, which is actually a weighted mean method. Inevitably, interpolation might induce errors especially when neighboring samples are noisy. An alternative method that outliers are directly set to null value was proposed in order to avoid interpolation error (Huang et al., 2017). However, null values potentially affect parameter estimation during retracking when they appear within or near the leading edge of a waveform. Therefore, interpolation is still performed in this study but using a different method. If
Figures 2D–F illustrate the efficiency of algorithms for detecting and amending outliers. Two parabola signals at the thermal noise stage and anomalous peaks in the trailing edge area were successfully identified and fixed.
Retracking Methods
Three retrackers were applied on the decontaminated waveforms. The three retrackers are 20% threshold retracker (TR20), 50% threshold retracker (TR50), and ICE1 retracker. For these retrackers, the retracked gate (also named as Epoch) can be computed using a uniform equation as follows:
where
where
Since the emphasis of this study is to improve coastal SSHs, only the parameter for range correction was estimated in the retracking procedure. Finally, the retracking correction was derived by
in which
Validation Results and Discussion
For the convenience of illustration, we used the abbreviation “RW” for the raw waveform, “DW” for the decontaminated waveform by the new method developed in this article, and “MW” for the modified waveform by the previous approach given by Huang et al. (2017). Three kinds of waveforms were retracked using TR20, TR50, and ICE1, respectively. Adding retrackers provided in SGDR, ALES, and PISTACH, 16 retrackers were involved for comparison in total.
Evaluating the Variability of Along-Track SSHs
The internal variability in each cycle of the along-track SSHs with respect to the geoid can reflect the performance of various retrackers. Standard deviations (SD) of the differences between the retracked SSHs and the geoid are frequently employed to evaluate the variability (Hwang et al., 2006; Lee et al., 2010). Meanwhile, data availability is an important consideration. Generally, a good retracker should be capable to retrieve more valid data with the smaller SD. We hence introduced the ratio of the percentage of valid measurements to SD as an evaluation index (Wang et al., 2019), which is expressed as
where
FIGURE 3. Performance comparison of various retrackers in terms of SD (left) and PSR (right) in 0–10 km zone for each case: (A)–(B) Pass 119 near Los Angeles; (C)–(D) Pass 228 near Cape May; (E)–(F) Pass 61 near Funchal; (G)–(H) Pass 242 near Ko Lak.
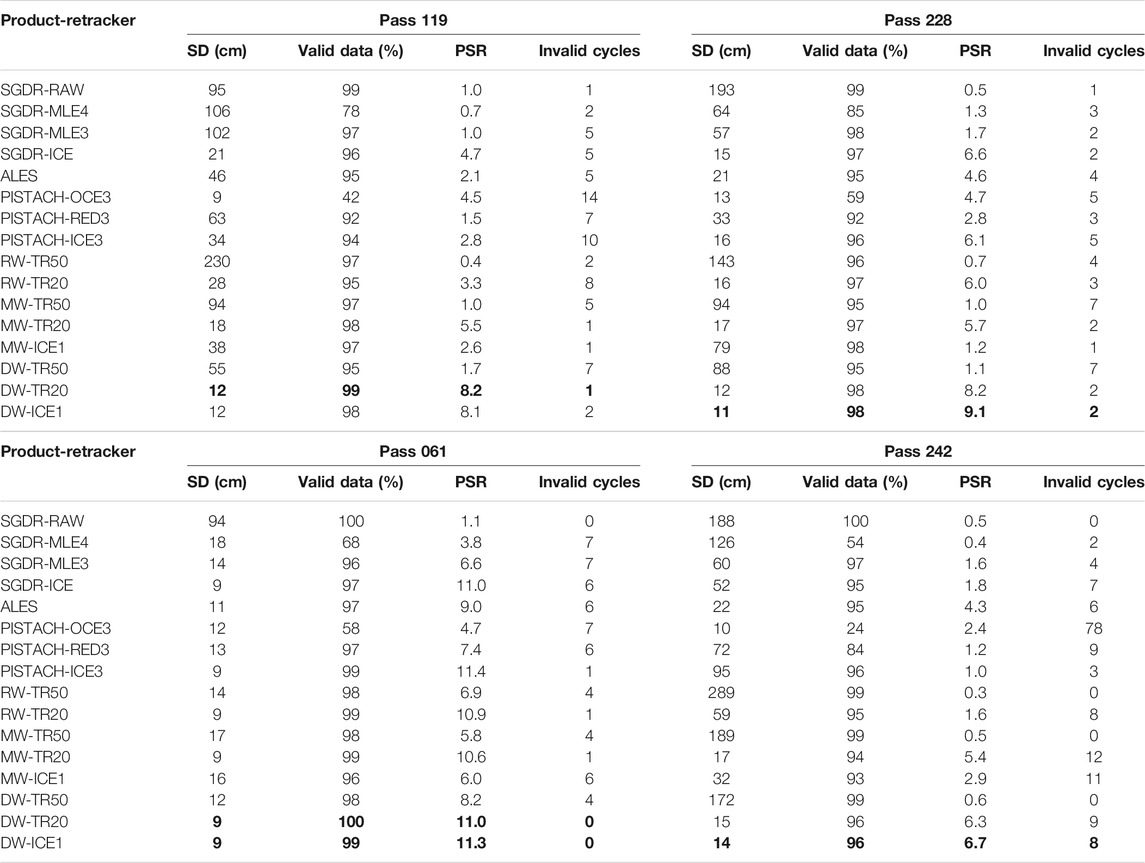
TABLE 2. Average indices of various retracked along-track SSHs in 0–10 km zone for each case.
Obviously, the nonretracked (SGDR-RAW) SSHs are of poor quality, which is a common sense in coastal altimetry community. The Brown model-based retrackers, such as MLE4 and MLE3, do not perform well because they are developed for “clean” ocean waveforms. As observed in Figure 3, the SDs of ICE retracker are much smaller than those of other retrackers in SGDR, and its corresponding PSRs are relatively high indicating good data availability in the coastal area. These results are consistent with those reported previous studies (Kuo et al., 2012; Tseng et al., 2014; Huang et al., 2017). Validation at Ko Lak tide gauge station performed by Idris et al. (2020) also indicated that the ICE retracker is the best in the SGDR data. Compared with SGDR-ICE, PISTACH retrackers do not seem to bring significant improvement as expected. Although OCE3 achieves good accuracy, its percentage of valid measurements is very low. ICE3 and RED3 are also not as good as ICE1 in the four test areas. On average, ALES outperforms SGDR and PISTACH.
Threshold retrackers with different threshold levels are applied to RWs, MWs, and DWs separately. TR20 achieved much better results than TR50, implying that 20% threshold level is more suitable for retrieval of coastal data. It is reasonable because peaky noise extensively appearing in coastal waveforms may lead TR50 to overestimate the epoch. On the other hand, it can be seen in Figure 3 and Table 2 that the performance of the same retrackers when applying to DWs is apparently superior to that when applying to RWs and MWs. Among 16 retrackers, furthermore, DW-TR20 and DW-ICE1 got the largest PSR values, as well as the smallest SDs in all cases. The results show a strike effect of our upgraded decontamination algorithm on refining the coastal SSHs.
To explore how close to the shore valid SSH data retrieved by each retracker can reach to, we plotted along-track SSHs along with the EGM2008 geoid for all tracks used in this study and made a movie for each region for easy scanning. Figure 4 presents a plot as an example. Only the SSHs by seven retrackers with relatively high accuracy were illustrated in the plot, and arbitrary constants were added to each result for visual clarity. It shows that the DW-TR20 and DW_ICE1 retrackers can stably retrieve valid SSHs in the last 1 km stripe, while the other retrackers become unstable in 0–4 km zone. It is notable that some biased values appear in the SSHs by MW-TR20 at about 6–9 km. It might be attributable to null values in waveforms set by the old version of the decontamination algorithm (Huang et al., 2017).
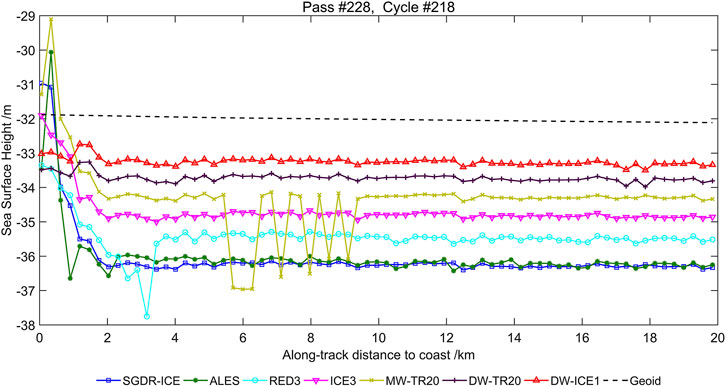
FIGURE 4. Along-track sea surface heights retrieved by various retrackers. Arbitrary constants were added to the result of each retracker for visual clarity.
Validation With Gauge Data
Tide gauge provides independent sea level observations to validate altimeter-derived SSHs. In order to compare with in situ sea level, tidal corrections were excluded from the SSHs. Since tide gauge stations do not locate on the satellite track, geoid gradient corrections were applied to the SSHs. To avoid possible datum bias between altimeter measurements and gauge data, the mean value of each time series was subtracted. The RMSE value was calculated to show the mean error of retracked results compared with gauge data. Correlation coefficients (CCs) between altimeter-derived SSHs and gauge data were also computed. Statistical results within 0–20 km zone offshore for each retracker in the four test regions are demonstrated in Figure 5. In each panel, bars at the bottom represent RMSE values and CCs are illustrated as waterfalls on the top. The color denotes along-track distance to the coastline, changing from red to blue corresponding to the increase in distance from 0 to 20 km.
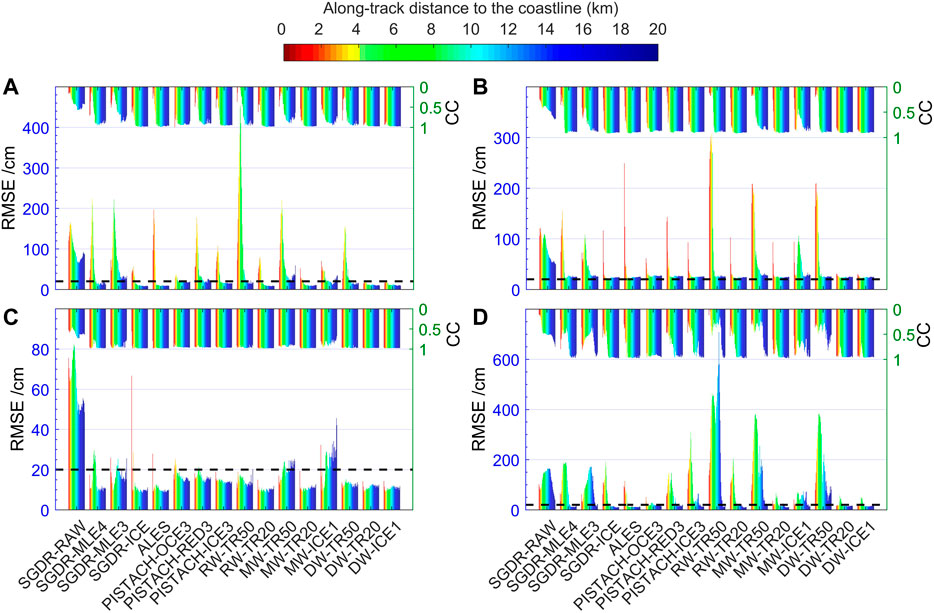
FIGURE 5. RMSE and correlation coefficients (CCs) of retracked SSH time series within 20 km offshore w.r.t. tide gauge data in each test area. (A) Los Angeles; (B) Cape May; (C) Funchal; (D) Ko Lak. The color of the bar changes from red to blue, indicating along-track distance to the coastline rising from 0 to 20 km. The black dashed line denotes the accuracy level of 20 cm.
Figure 5 visually depicts that the accuracy of the altimeter-derived SSHs decreases when approaching to the coast. In 10–20 km coastal zone, most retrackers perform well keeping the RMSE value below 20 cm and CC higher than 0.9. However, within 10 km, the RMSE increases rapidly and the correlation decreases correspondingly. Remarkably, two retrackers (DW-TR20 and DW-ICE1) developed in this study show very robust performance. The two retrackers can consistently yield small RMSEs in 0–20 km coastal zone. Overall, the performance of various retrackers revealed in Figure 5 agrees well with the evaluation results in Evaluating the Variability of Along-Track SSHs.
Figure 6 presents an example of SSH time series within 20 km offshore near Ko Lak gauge station by several selected retrackers, which have relatively good performance in the coastal area. It is obvious that the results based on retracking denoised waveforms are better than those based on retracking raw waveforms. Comparing results of MW-ICE1 and DW-ICE1, we can conclude that the upgraded decontamination strategy made a great improvement. In this case, ALES achieved the smallest RMSE. The reason is due to the good efficacy of ALES in the zone beyond 7-8 km offshore. Enough high accuracy measurements in the farther zone can help to reject crude measurements in the very near coastal area by the de-outlier process during constructing the SSH time series. However, the efficiency of ALES dramatically declines within 8 km (Huang et al., 2017; Wang and Ichikawa, 2017), which can also be verified by results in Figure 5 and Table 2.

FIGURE 6. Coastal (0–20 km) SSH time series derived by selected retrackers near Ko Lak gauge station (Pass 242). Mean value of each time series is removed to avoid possible bias.
Focusing on the last several kilometers, we compared the performance of various retrackers within 4 km. The improvement percentage (IMP) was computed to assess the improvement over the nonretracked SSHs (Hwang et al., 2006). Statistical results are given in Table 3. We can observe that most retrackers yield large RMSE and small CC except DW-TR20 and DW-ICE1. On rare occasion, ALES has the minimum RMSE of 7 cm in the third case (Pass 61), where the percentage of Brown and Brown-like waveforms is more than 95% (see Table 1). However, its performance is much poorer than that of DW-TR20 or DW-ICE1 in other cases. It implies that the ALES retracker has a good ability to handle with the Brown-like waveforms, but it is not good at processing the more complicated coastal waveforms. It makes sense because the ALES retracker is based on the Brown model (Passaro et al., 2014). Evidently, the DW-TR20 and DW-ICE1 retrackers achieve the biggest improvement in accuracy in 0–4 km zone. Their IMP values are larger than 80% in all cases. It is indicated that our technique works well not only for the Brown-like waveforms but also for the extremely distorted waveforms.
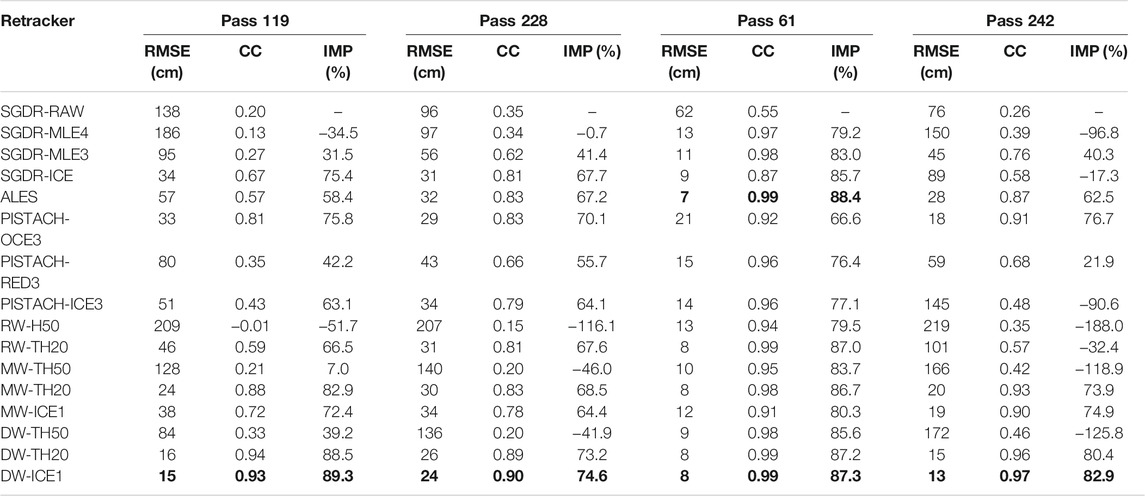
TABLE 3. Statistical results of retracked SSHs in 0–4 km zone offshore compared with gauge data.
Additional Comments on the Decontamination Technique
It is ideal to minimize noise interference during waveform retracking. Traditional subwaveform technique works well in many situations by extracting the clean leading edge according to partitioning waveforms (Guo et al., 2006; Guo, et al., 2010; Idris and Deng, 2012; Yang, et al., 2012a; Passaro et al., 2014). However, this passive approach gets into trouble in near coast zone where waveforms are seriously distorted. The results in Table 2 and Table 3 illustrate that subwaveform-based retrackers such as ALES, RED3, and ICE3 are poor performing for the complicated waveforms. It can be attributed to the difficulty for determining the noise-free leading edge in this situation.
In another way, the decontamination technique which is developed to actively reduce noise in waveform has proved to be very effective for processing complex coastal waveforms (Tseng et al., 2014; Huang et al., 2017; Wang and Ichikawa, 2017). The core of this technique is how to locate polluted sampling gates and how to fix them. The strategy proposed in the current study is easy to implement and not time-consuming. By considering the issue of shifting of the leading edge and adopting gate-wise judging criteria, the new strategy improves the outlier detection procedure. This can be verified by comparing MW- and DW-retrackers. However, there is still no other sophisticated method for amending outliers except interpolation from neighbors. Furthermore, rounding off the offset derived by Eq. 2 during realignment might induce alignment error in individual cases, which may influence subsequent denoising. Small jaggies might appear in the along-track SSHs in this case, e.g., at 18 km in Figure 4. This effect can be eliminated by smoothing or downsampling into 1 Hz data.
Conclusions
In this article, we presented an upgraded strategy for decontaminating waveform, aiming to improve altimeter-derived coastal SSHs. The tests in four areas with four satellite passes validated the efficiency of the new strategy. Two retrackers (DW-TR20 and DW_ICE1) based on decontaminated waveforms show powerful performance to retrieve more and better coastal measurements, which will be beneficial to coastal applications such as coastal sea level change and geoid refining in oceanography, geodesy, and other fields.
Compared with the old decontamination strategy, one important improvement of the update method is the realignment of waveforms prior to decontamination. We proposed a novel alignment algorithm based on the raw SSH measurements. This improvement leads to a more reasonable reference waveform for the later outlier detection and remedy. Another improvement is that we adopted gate-based outlier judging criteria, which enable outlier detector to treat different parts of the waveform (e.g., thermal noise stage, leading edge, and trailing edge) with different criteria. These improvements make it possible to retrieve reliable SSHs in the last 1 km to the coast.
Although the decontamination strategy was validated only using Jason-2 data, it is appropriate to apply to the similar radar altimetry missions. In addition, only the threshold retracker and the ICE1 retracker were tested on the DWs in this work. It is worthy to explore the efficiency of other model-based retrackers such as MLE applied to the DWs. The combination of ALES and DW may be of great interest for future research.
It should be mentioned that the validation in this study focused on the new decontamination strategy. Refining coastal geophysical corrections such as wet troposphere correction and SSB was not considered. Different tidal effects between the tide gauge station and satellite nadirs were also not removed in the validation. Therefore, the accuracy of coastal SSHs can be further improved if these factors are taken into account.
Data Availability Statement
The original contributions presented in the study are included in the article/Supplementary Material; further inquiries can be directed to the corresponding author.
Author Contributions
HW designed the study and wrote the first draft. ZH performed the experiments and drew the pictures. All authors analyzed the data and wrote the final draft.
Funding
This work was sponsored by the National Natural Science Foundation of China (Grant No. 41974016), the Open Research Program of Key Laboratory of Marine Environmental Survey Technology and Application, Ministry of Natural Resources (Grant No. MESTA-2020-A004), the CRSRI Open Research Program (Grant No. CKWV2019773/KY), and the Natural Science Foundation of Jiangxi Province (Grant No. 20202BABL214055).
Conflict of Interest
The authors declare that the research was conducted in the absence of any commercial or financial relationships that could be construed as a potential conflict of interest.
Publisher’s Note
All claims expressed in this article are solely those of the authors and do not necessarily represent those of their affiliated organizations, or those of the publisher, the editors, and the reviewers. Any product that may be evaluated in this article, or claim that may be made by its manufacturer, is not guaranteed or endorsed by the publisher.
Acknowledgments
We would like to acknowledge AVISO providing the Jason-2 SGDR data and the PISTACH data (https://www.aviso.altimetry.fr/), UHSLC providing the tide gauge data (ftp://ftp.soest.hawaii.edu/uhslc/rqds), and DGFI-TUM providing the ALES data (https://www.openadb.dgfi.tum.de).
Supplementary Material
The Supplementary Material for this article can be found online at: https://www.frontiersin.org/articles/10.3389/feart.2021.748401/full#supplementary-material
References
Bignalet-Cazalet, F., Urien, S., Picot, N., Couhert, A., Marechal, C., Desai, S., et al. (2020). Jason-3 Products Handbook, Version 2.0. CNES:SALP-MU-M-OP-16118-CN. Available at: https://www-cdn.eumetsat.int/files/2020-10/pdf_j3_prod_handbook.pdf.
Birol, F., Fuller, N., Lyard, F., Cancet, M., Niño, F., Delebecque, C., et al. (2017). Coastal Applications From Nadir Altimetry: Example of the X-TRACK Regional Products. Advances Space Research. 59 (4), 936–953. doi:10.1016/j.asr.2016.11.005
Birol, F., Léger, F., Passaro, M., Cazenave, A., Niño, F., Calafat, F. M., et al. (2021). The X-TRACK/ALES Multi-Mission Processing System: New Advances in Altimetry towards the Coast. Adv. Space Res. 67 (8), 2398–2415. doi:10.1016/j.asr.2021.01.049
Brown, G. (1977). The Average Impulse Response of a Rough Surface and its Applications. IEEE Trans. Antennas Propagat. 25 (1), 67–74. doi:10.1109/TAP.1977.1141536
Caldwell, P. C., Merrifield, M. A., and Thompson, P. R. (2015). Sea Level Measured by Tide Gauges From Global Oceans — the Joint Archive for Sea Level Holdings (NCEI Accession 0019568), Version 5.5. Dataset: NOAA National Centers for Environmental Information. doi:10.7289/V5V40S7W
Chaudhary, A., Basu, S., Kumar, R., Mahesh, C., and Sharma, R. (2015). Shape Classification of AltiKa 40-Hz Waveforms Using Linear Discriminant Analysis and Bayes Decision Rule in the Gujarat Coastal Region. Mar. Geodesy. 38, 62–72. doi:10.1080/01490419.2014.1001504
Cipollini, P., Calafat, F. M., Jevrejeva, S., Melet, A., and Prandi, P. (2017). Monitoring Sea Level in the Coastal Zone With Satellite Altimetry and Tide Gauges. Surv. Geophys. 38 (1SI), 33–57. doi:10.1007/s10712-016-9392-0
Deng, X., and Featherstone, W. E. (2006). A Coastal Retracking System for Satellite Radar Altimeter Waveforms: Application to ERS-2 Around Australia. J. Geophys. Res. 111 (C6), C6012. doi:10.1029/2005JC003039
Desjonquères, J. D., Carayon, G., Steunou, N., and Lambin, J. (2010). Poseidon-3 Radar Altimeter: New Modes and In-Flight Performances. Mar. geodesy. 33 (Suppl. 1), 53–79. doi:10.1080/01490419.2010.488970
Dumont, J. P., Rosmordue, V., Picot, N., Desai, S., Bonekamp, H., Figa, J., et al. (2017). OSTM/Jason-2 Products Handbook", Version 1.11, CNES:SALP-MU-M-OP-15815-cn. Available at: https://www.ospo.noaa.gov/Products/documents/hdbk_j2.pdf.
Fu, L. L., and Cazenave, A. (2001). Satellite Altimetry and Earth Sciences: A Handbook of Techniques and Applications. San Diego: Academic Press.
Gómez-Enri, J., González, C. J., Passaro, M., Vignudelli, S., Álvarez, O., Cipollini, P., et al. (2019). Wind-Induced Cross-Strait Sea Level Variability in the Strait of Gibraltar from Coastal Altimetry and In-Situ Measurements. Remote Sensing Environ. 221, 596–608. doi:10.1016/j.rse.2018.11.042
Gomez-Enri, J., Vignudelli, S., Quartly, G. D., Gommenginger, C. P., Cipollini, P., Challenor, P. G., et al. (2010). Modeling Envisat RA-2 Waveforms in the Coastal Zone: Case Study of Calm Water Contamination. IEEE Geosci. Remote Sensing Lett. 7 (3), 474–478. doi:10.1109/LGRS.2009.2039193
Gommenginger, C., Thibaut, P., Fenoglio-Marc, L., Quartly, G., Deng, X., Gómez-Enri, J., et al. (2011). “Retracking Altimeter Waveforms Near the Coasts,” in Coastal Altimetry. Editors S. Vignudelli, A. Kostianoy, P. Cipollini, and J. Benveniste (Berlin: Springer), 61–101. doi:10.1007/978-3-642-12796-0_4
Guo, J., Gao, Y., Hwang, C., and Sun, J. (2010). A Multi-Subwaveform Parametric Retracker of the Radar Satellite Altimetric Waveform and Recovery of Gravity Anomalies Over Coastal Oceans. Sci. China Earth Sci. 53 (4), 610–616. doi:10.1007/s11430-009-0171-3
Halimi, A., Mailhes, C., Tourneret, J.-Y., Thibaut, P., and Boy, F. (2013). Parameter Estimation for Peaky Altimetric Waveforms. IEEE Trans. Geosci. Remote Sensing. 51 (3), 1568–1577. doi:10.1109/TGRS.2012.2205697
Huang, Z., Wang, H., Luo, Z., Shum, C., Tseng, K.-H., and Zhong, B. (2017). Improving Jason-2 Sea Surface Heights Within 10 Km Offshore by Retracking Decontaminated Waveforms. Remote Sensing. 9 (107710), 1077. doi:10.3390/rs9101077
Hwang, C., Guo, J., Deng, X., Hsu, H.-Y., and Liu, Y. (2006). Coastal Gravity Anomalies From Retracked Geosat/GM Altimetry: Improvement, Limitation and the Role of Airborne Gravity Data. J. Geodesy. 80, 204–216. doi:10.1007/s00190-006-0052-x
Idris, N., Deng, X., Md Din, A., and Idris, N. (2017). CAWRES: A Waveform Retracking Fuzzy Expert System for Optimizing Coastal Sea Levels From Jason-1 and Jason-2 Satellite Altimetry Data. Remote Sensing. 9 (603), 603–622. doi:10.3390/rs9060603
Idris, N. H., and Deng, X. (2012). The Retracking Technique on Multi-Peak and Quasi-Specular Waveforms for Jason-1 and Jason-2 Missions Near the Coast. Mar. Geodesy. 35 (Suppl. l), 217–237. doi:10.1080/01490419.2012.718679
Idris, N. H. (2020). Regional Validation of the Coastal Altimetry Waveform Retracking Expert System (CAWRES) Over the Largest Archipelago in Southeast Asian Seas. Int. J. Remote Sensing. 41 (15), 5680–5694. doi:10.1080/01431161.2019.1681605
Jinyum, G., Cheiway, H., Xiaotao, C., and Yuting, L. (2006). Improved Threshold Retracker for Satellite Altimeter Waveform Retracking over Coastal Sea. Prog. Nat. Sci. 16 (7), 732–738. doi:10.1080/10020070612330061
Kuo, C.-Y., Kao, H.-C., Lee, H., Cheng, K.-C., and Lin, L.-C. (2012). Assessment of Radar Waveform Retracked Jason-2 Altimetry Sea Surface Heights Near Taiwan Coastal Ocean. Marine Geodesy. 35 (2), 188–197. doi:10.1080/01490419.2011.637861
Lee, H., Shum, C. K., Emery, W., Calmant, S., Deng, X., Kuo, C.-Y., et al. (2010). Validation of Jason-2 Altimeter Data by Waveform Retracking Over California Coastal Ocean. Mar. Geodesy. 33 (Suppl. l), 304–316. doi:10.1080/01490419.2010.488982
Mercier, F., Rosmorduc, V., Carrere, L., and Thibaut, P. (2010). "Coastal and Hydrology Altimetry Product (PISTACH) Handbook", Version 1.0, CNES:CLS-DOS-NT-10-246. Available at: https://www.aviso.altimetry.fr/fileadmin/documents/data/tools/hdbk_Pistach.pdf.
Passaro, M., Cipollini, P., Vignudelli, S., Quartly, G. D., and Snaith, H. M. (2014). ALES: A Multi-Mission Adaptive SubwaveForm Retracker for Coastal and Open Ocean Altimetry. Remote Sensing Environment. 145, 173–189. doi:10.1016/j.rse.2014.02.008
Passaro, M., Rose, S. K., Andersen, O. B., Boergens, E., Calafat, F. M., Dettmering, D., et al. (2018). ALES+: Adapting a Homogenous Ocean Retracker for Satellite Altimetry to Sea Ice Leads, Coastal and Inland Waters. Remote Sensing Environment. 211, 456–471. doi:10.1016/j.rse.2018.02.074
Pavlis, N. K., Holmes, S. A., Kenyon, S. C., and Factor, J. K. (2012). The Development and Evaluation of the Earth Gravitational Model 2008 (EGM2008). J. Geophys. Res. 117, a–n. doi:10.1029/2011JB008916
Peng, F., and Deng, X. (2018). A New Retracking Technique for Brown Peaky Altimetric Waveforms. Mar. Geodesy. 41 (2), 99–125. doi:10.1080/01490419.2017.1381656
Sinurata, M. E., Nababan, B., Gaol, J. L., Manik, H. M., and Idris, N. H. (2021). Waveform classification and retracking of Jason-2 and Jason-3 in Halmahera Sea. Jurnal Teknologi 83, 107–117. doi:10.11113/jurnalteknologi.v83.15125
Stammer, D., and Cazenave, A. (2017). Satellite Altimetry over Oceans and Land Surfaces. Boca Raton: CRC Press.
Tseng, K.-H., Shum, C. K., Yi, Y., Emery, W. J., Kuo, C.-Y., Lee, H., et al. (2014). The Improved Retrieval of Coastal Sea Surface Heights by Retracking Modified Radar Altimetry Waveforms. IEEE Trans. Geosci. Remote Sensing. 52 (2), 991–1001. doi:10.1109/TGRS.2013.2246572
Valladeau, G., Thibaut, P., Picard, B., Poisson, J. C., Tran, N., Picot, N., et al. (2015). Using SARAL/AltiKa to Improve Ka-Band Altimeter Measurements for Coastal Zones, Hydrology and Ice: The PEACHI Prototype. Marine Geodesy. 38 (SI), 124–142. doi:10.1080/01490419.2015.1020176
Vignudelli, S., Birol, F., Benveniste, J., Fu, L.-L., Picot, N., Raynal, M., et al. (2019). Satellite Altimetry Measurements of Sea Level in the Coastal Zone. Surv. Geophys. 40 (6), 1319–1349. doi:10.1007/s10712-019-09569-1
Vignudelli, S., Kostianoy, A. G., Cipollini, P., and Jerome, B. (2011). Coastal Altimetry. Berlin: Springer.
Wang, H., Chu, Y., Huang, Z., Hwang, C., and Chao, N. (2019). Robust, Long-Term Lake Level Change From Multiple Satellite Altimeters in Tibet: Observing the Rapid Rise of Ngangzi Co over a New Wetland. Remote Sensing. 11 (5), 558. doi:10.3390/rs11050558
Wang, X., and Ichikawa, K. (2017). Coastal Waveform Retracking for Jason-2 Altimeter Data Based on Along-Track Echograms Around the Tsushima Islands in Japan. Remote Sensing. 9 (7), 762. doi:10.3390/rs9070762
Xu, X.-Y., Birol, F., and Cazenave, A. (2018). Addendum: Xu, X.-Y. et al. Evaluation of Coastal Sea Level Offshore Hong Kong From Jason-2 Altimetry. Remote Sens. 2018, 10, 282. Remote Sensing. 10 (7), 1059. doi:10.3390/rs10071059
Yang, L., Lin, M., Liu, Q., and Pan, D. (2012a). A Coastal Altimetry Retracking Strategy Based on Waveform Classification and Sub-Waveform Extraction. Int. J. Remote Sensing. 33 (24), 7806–7819. doi:10.1080/01431161.2012.701350
Keywords: coastal altimetry, sea surface height, waveform retracking, waveform decontamination, Jason-2
Citation: Wang H and Huang Z (2021) Waveform Decontamination for Improving Satellite Radar Altimeter Data Over Nearshore Area: Upgraded Algorithm and Validation. Front. Earth Sci. 9:748401. doi: 10.3389/feart.2021.748401
Received: 27 July 2021; Accepted: 23 August 2021;
Published: 21 September 2021.
Edited by:
Jinyun Guo, Shandong University of Science and Technology, ChinaReviewed by:
Yihao Wu, Hohai University, ChinaShengjun Zhang, Northeastern University, China
Nurul Hazrina Idris, University of Technology Malaysia, Malaysia
Copyright © 2021 Wang and Huang. This is an open-access article distributed under the terms of the Creative Commons Attribution License (CC BY). The use, distribution or reproduction in other forums is permitted, provided the original author(s) and the copyright owner(s) are credited and that the original publication in this journal is cited, in accordance with accepted academic practice. No use, distribution or reproduction is permitted which does not comply with these terms.
*Correspondence: Haihong Wang, hhwang@sgg.whu.edu.cn